Abstract
The olive fruit fly Bactrocera oleae (Rossi) (Diptera: Tephritidae) is the primary pest of olive crop globally, causing serious economic losses each year. Early and accurate detection of this pest is essential for implementing integrated management strategies and minimizing the use of chemical inputs. In this context, the application of advanced technologies such as computer vision and machine learning through modelling emerges as a promising solution for monitoring and managing this pest. However, the absence of a robust and efficient dataset has hindered the development of reliable models for its recognition. This study details the creation procedure of a dataset comprising 2440 images collected from field and laboratory environments, along with data augmentation and training of three different models using machine learning algorithms. The models were implemented with YOLOv5 and optimized with different versions (s, m, and epoch). All three models achieved accuracy exceeding 90%. The optimisation process, which combined different YOLOv5 versions (s and m) and epochs (300 and 150), determined that the model trained with the s version and 300 epoch provided the best trade-off between accuracy, robustness, and computational efficiency. This makes it the most suitable option for implementation on low-cost, resource-limited platforms such as the Raspberry Pi. This study represents a step toward the integration of artificial intelligence into olive cultivation, bringing significant benefits to both producers and the environment. This study differs from previous YOLOv5-based pest detection research by providing a heterogeneous dataset that combines field and laboratory conditions, and by validating its deployment on a low-cost embedded platform (Raspberry Pi), thus enabling practical automation in Integrated Pest Management (IPM) systems.
1. Introduction
The olive tree (Olea europaea) is economically vital, especially in the Mediterranean [1]. In Spain, it covers 2.78 million hectares, representing 70% of the EU’s production. However, pests like the olive fruit fly B. oleae (Rossi) (Diptera: Tephritidae), which is considered the most damaging pest of olive production worldwide, cause significant economic losses by damaging fruit and oil quality and can affect up to 100% of the crop yield when infestations are not controlled [2,3,4]. Integrated Pest Management (IPM) has been mandatory in the EU, as established in the European Directive 2009/128/EC on the sustainable use of pesticides and reinforced by the European Green Deal, which aims to reduce pesticide dependency and promote sustainable agricultural practices [5]. To this end, one of the key fundamentals on which to build an IPM program is the availability of the economic injury level and economic threshold for intervention, which usually depend upon the monitoring of the insect pest populations, together with the selection of the most suitable control method [6,7]. The olive fruit fly IPM programs are based on adult trapping, which is considered the most effective and widely used method for monitoring the olive fruit fly population dynamics, to obtain reliable data for correct decision-making [7,8]. The development of increasingly precise, rapid, and cost-effective methods that require minimal field technician intervention is one of the great challenges of IPM, with technological innovations as key tools to overcome the limitations of traditional monitoring methods [9,10,11]. Thus, the integration of advanced technologies such as computer vision and machine learning into the detection and counting process emerges as a promising solution for olive fruit fly monitoring and management [9,12,13,14,15]. Computer vision enables machines to understand and process visual data, facilitating tasks such as object detection, and it continues to advance with the development of new algorithms [16]. However, the creation of reliable and accurate automated recognition systems largely depends on the availability of high-quality, representative datasets [9,15,17]. A major challenge is the absence of public and comprehensive olive fruit fly datasets, which limits the development of accurate and robust models for olive fruit fly detection [9,17].
Regarding recent advances in automatic fruit fly identification, several studies have explored the application of deep learning and object-detection architectures to improve trap-based monitoring accuracy. In [18], a YOLO-based framework was implemented for the detection and counting of B. oleae, demonstrating the feasibility of real-time processing in image-based monitoring systems. The work in [19] proposed an improved YOLOv5m configuration focused on small insect pest detection, enhanced robustness under challenging image conditions. In [20], a cascaded deep-learning approach was applied to greenhouse pest detection using sticky-trap images, highlighting the relevance of computer-vision-based solutions in integrated monitoring programs. Additionally, ref. [21] evaluated YOLOv5-based detectors for multi-species pest identification. Although these contributions represent meaningful progress, most of them were developed under controlled image-acquisition conditions, relied on limited datasets, or were not evaluated on low-cost embedded platforms, which reinforces the need for a heterogeneous and deployable dataset such as the one presented in this study.
Recent years have seen considerable progress in the development of automatic recognition systems for insect detection, driven by the application of deep and machine learning techniques. Additionally, models based on architectures like YOLOv5 have demonstrated effectiveness in identifying and classifying several species [15,19,22,23].
However, some of the main limitations lie in the quality and diversity of the datasets used. Most datasets have a weak structure, containing a limited number of images and lacking variability in factors such as brightness, shadows, environmental conditions. Also, many datasets focus exclusively on the segmentation of the target insect, eliminating the context of the trap and excluding other environmental elements, such as other insects or particles, which could lead to confusion in a real-world scenario. Therefore, it is crucial to develop datasets that consider environmental variability and the coexistence of similar species, to enhance the accuracy and robustness of detection models.
However, the development of reliable deep learning models for olive fruit fly detection has also been limited by the lack of publicly available, sufficiently large, and heterogeneous datasets. Previous studies have typically relied on a very small number of images and restrictive acquisition conditions, which constrains model generalization and increases the risk of overfitting [17,18,19]. Beyond dataset size, key characteristics such as environmental diversity, illumination variability, background complexity, annotation quality, and domain representativeness are essential to ensure robust learning and transferability to real-world scenarios. Therefore, the present work not only expanded the dataset volume, but also increased variability in backgrounds, lighting conditions, camera devices, and specimen states, aiming to provide a more realistic and operationally relevant dataset for field deployment.
The present study aimed to create a high-quality dataset, validated not only by the model but also by expert assessment, for automated olive fruit fly population recognition. Therefore, one of the main objectives was to develop and characterize a dataset that captures the complexity of the dipteran detection problem in real scenarios by focusing on three main aspects:
- Collection of olive fruit fly images incorporating variations in environmental and growing conditions to build a robust dataset.
- Development of a comprehensive labelling protocol, leveraging the expertise of entomologists specialized in this dipteran, to ensure the creation of accurate and reliable models.
- Validation of the dataset through modelling, statistical analysis, and subsequent evaluation.
Several studies have applied YOLOv5 or similar convolutional neural networks to pest detection in agricultural environments [9,14,18,19,20,21,23,24]. However, most of these approaches were evaluated exclusively under controlled laboratory conditions and did not assess model performance on resource-limited or embedded devices. In contrast, this work contributes by: (i) developing a heterogeneous dataset that combines field and laboratory images of B. oleae under variable lighting and background conditions; (ii) analyzing the effect of training configurations (YOLOv5s and YOLOv5m, 150 and 300 epochs) on recall and F1-score across confidence thresholds; and (iii) validating real-time performance on a Raspberry Pi device. These aspects enhance the practical applicability of deep learning for pest monitoring and support its integration into Integrated Pest Management (IPM) systems.
2. Materials and Methods
The methodology adopted in this work involved a series of steps (Figure 1). In this sense, the collection of images from chromotropic traps (yellow sticky panels; Econex S.L., Murcia, Spain), targeting the olive fruit fly was the starting point for building the dataset. Following this, manual labeling was carried out to annotate each instance of the fly in the images. Data augmentation techniques were also applied to artificially enhance the size and diversity of the training dataset. The labelling of the images represented a key aspect for the subsequent training of the convolutional neural network models (CNN).
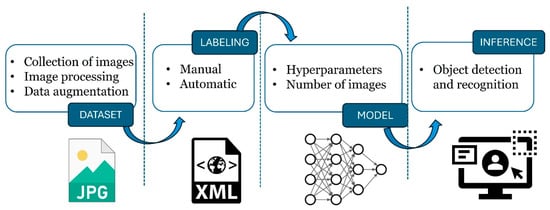
Figure 1.
Phases of implementation of a computer vision object detection system.
Lastly, during the inference stage, the trained model was used to identify and make predictions or decisions based on new input images that it had not encountered during training.
2.1. Creation of the Dataset
2.1.1. Creation of the Field Dataset
For this study, a total of 659 images were collected over two years (2022–2023) in a real field environment (Figure 2). These collected images are part of the FruitFlyNet-ii project (http://fruitflynet-ii.aua.gr) (accessed on 10 October 2024), in which an image dataset was created. Since these images were taken in different scenarios, weather conditions, environments, and variations in the fly’s appearance. Data augmentation techniques were applied to the original 659 images to enhance the dataset and improve model generalization, resulting in an expanded dataset comprising 1083 images.
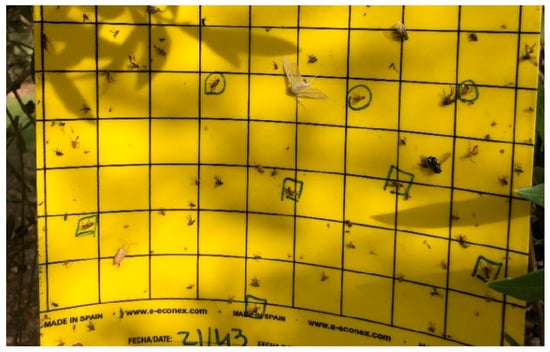
Figure 2.
Images obtained from the field.
2.1.2. Creation of Laboratory Dataset
To complement the field-acquired images, an additional dataset comprising 370 images was generated under controlled laboratory conditions. This additional dataset was required to overcome the limited and seasonal availability of field images and to ensure sufficient variability for robust model training. The controlled laboratory setup allowed for the incorporation of diverse illumination conditions, backgrounds, camera angles, and specimen states, resulting in a more balanced, representative, and generalizable dataset (Figure 3).
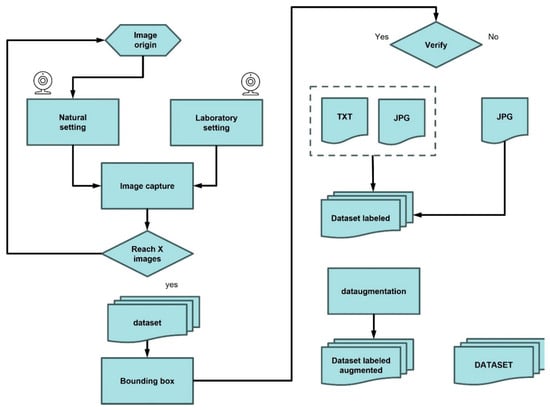
Figure 3.
Dataset construction process.
To replicate field trapping conditions, a laboratory setup was designed to simulate chromotropic traps involving olive fruit fly and other insect species. Daily photographs were captured using a custom support structure that emulated the appearance and conditions of chromotropic traps (Figure 4). These images were also augmented using data augmentation techniques, resulting in a total of 1337 images.
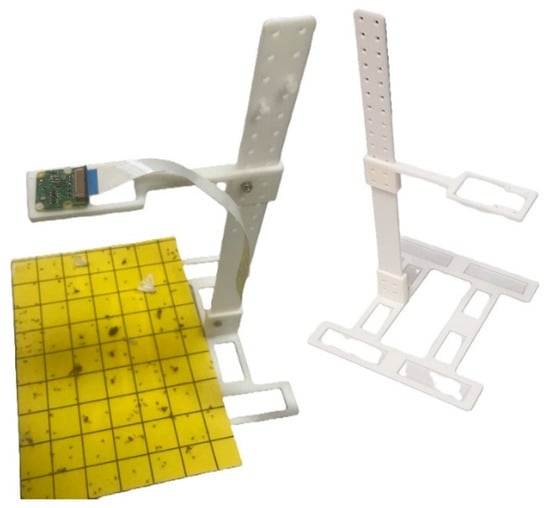
Figure 4.
Support used in the process of obtaining laboratory dataset.
To approximate the visual characteristics of field images, such as shadows, reflections, and contrast, various light configurations and transparent support materials were evaluated. These included rigid and flexible transparent plastics, as well as commercial plastic wraps, to reproduce the optical properties of the sticky trap surface. Several real-world visual artefacts were intentionally incorporated into the dataset, and during laboratory acquisition, to guarantee variability in image appearance. This included heterogeneous illumination conditions, shadows, surface reflections caused by sunlight, and partial occlusions. Additionally, physical trap contamination was simulated using naturally adhered non-target insects and olive leaves, reproducing common sources of visual noise observed in commercial monitoring traps. Image acquisition was performed using an 8-megapixel Raspberry Pi camera (resolution: 3280 × 2464 pixels; Raspberry Pi Foundation, Cambridge, UK), which was selected based on a comparative evaluation of multiple imaging devices. This camera offered an optimal balance of image quality, focal length suitability, physical dimensions, and cost-effectiveness for the specific imaging requirements of olive fruit fly monitoring (Figure 5).
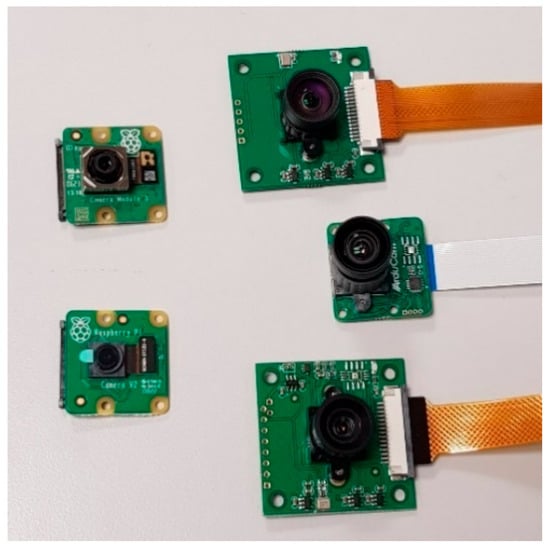
Figure 5.
Selection of different cameras with resolution 5 Mpx, 8 Mpx and 12 Mpx and focal length.
2.1.3. Data Augmentation
To improve model generalization and robustness under diverse environmental conditions, several data augmentation techniques were applied to both the field and laboratory datasets. The selected transformations included horizontal flipping, vertical flipping, and 180° image rotation implemented and automated using Python’s Pillow package (version 10.2.0). These geometric operations were chosen because they realistically emulate potential variations in trap orientation, camera angle, and insect positioning that may naturally occur in field monitoring scenarios while preserving the biological integrity and visual characteristics of B. oleae specimens.
The augmentation process substantially increased the total volume and variability in the training data. Specifically, the field dataset expanded from 659 to 1083 images, and the laboratory dataset increased from 370 to 1337 images, resulting in a combined total of 2420 images. This threefold increase in data size enhanced model exposure to diverse visual patterns, helping to reduce overfitting and improve convergence stability during training.
Although an ablation analysis isolating the contribution of each transformation was not conducted, comparative experiments between non-augmented and augmented datasets demonstrated consistent improvements in model performance. Models trained on augmented data exhibited higher recall and F1-scores, confirming that these augmentations positively impacted the detector’s capacity to identify olive fruit flies across variable imaging conditions.
The field images used in this study originate from the FruitFlyNet-II dataset; however, their number was limited because the activity of B. oleae is seasonal and because a larger dataset was required to support robust model training. For this reason, additional images were generated under controlled laboratory conditions to reproduce the visual characteristics of chromotropic traps and increase dataset diversity. Although different camera types with higher pixel resolutions were preliminarily tested, the final acquisition pipeline employed the same 8-megapixel Raspberry Pi camera used in FruitFlyNet-II, ensuring comparable resolution and optical properties. Consequently, the dataset developed in this study can be considered an extended and diversified version of FruitFlyNet-II, incorporating a broader range of lighting conditions, backgrounds and sample variability while maintaining consistent acquisition parameters.
2.2. Image Labelling
For image annotation, bounding boxes were employed to indicate the position of B. oleae specimens on the trap surfaces. Multiple labeling software or platforms can be used for labelling. The open-source tool LabelImg was utilized in this study. Annotations were initially saved in the PASCAL VOC (XML) format due to occasional instability of LabelImg when using the YOLO format.
Afterwards, custom Python scripts were implemented to convert the XML annotations into YOLO-compatible TXT format and generate composite images that overlaid the bounding boxes on top of the original images for viewing.
This post-tagging visualization step allowed for efficient inspection of the annotated data using standard image viewers, eliminating the need to reopen the files within the tagging tool (Figure 6 and Figure 7). This visual check was essential to ensure the quality of the annotations and to facilitate the subsequent model training phases. Annotation data were stored in formats compatible with object detection frameworks (e.g., COCO, PASCAL VOC, YOLO), allowing for flexibility in model selection.
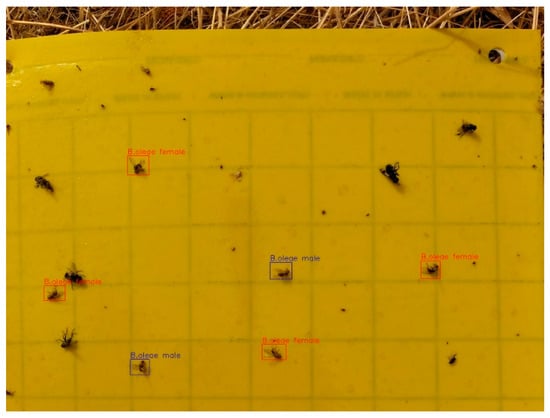
Figure 6.
Labeled field image display.
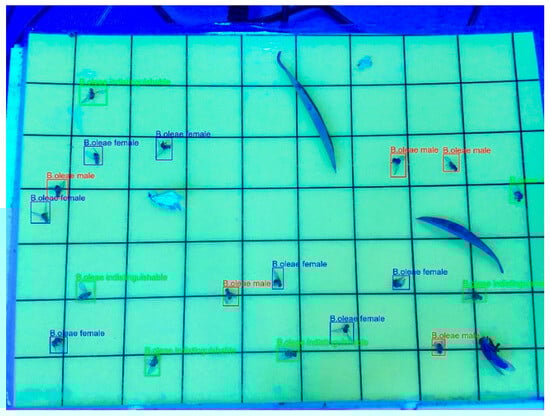
Figure 7.
Display of labelled laboratory image.
To ensure accuracy and consistency of labeling, all labeling annotations were performed by expert annotators. This rigorous approach was essential to develop a reliable and robust training dataset, which ultimately contributed to improved model performance in olive fruit fly detection and localization.
To confirm the reliability of the manual annotations, a small set of representative images covering different lighting conditions, backgrounds and insect positions was re-annotated by the same expert entomologist at a later time. Bounding-box agreement between the original and repeated labels was quantified using the Intersection over Union (IoU), defined as the ratio between the overlapping area and the total union area of both boxes (Figure 8).
intersection_width = max(0, min(xmax_GT, xmax_annot) − max(xmin_GT, xmin_annot))
intersection_height = max(0, min(ymax_GT, ymax_annot) − max(ymin_GT, ymin_annot))
intersection_area = intersection_width * intersection_height
union_area = area_GT + area_annot − intersection_area
IoU = intersection_area/union_area
union_area = area_GT + area_annot − intersection_area
IoU = intersection_area/union_area
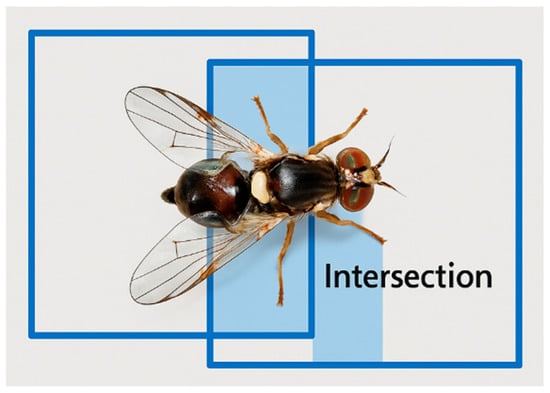
Figure 8.
Illustration of the Intersection over Union (IoU) metric used in the annotation quality-control procedure. IoU is defined as the ratio between the overlapping area of the original and re-annotated bounding boxes (intersection) and the total area encompassed by both boxes (union).
Across the inspected images, IoU values ranged from 0.63 to 0.79, with an average IoU of 0.71, indicating a consistent and reliable labeling process despite the intrinsic difficulty of annotating small insects on reflective sticky surfaces. This quality-control procedure supports the robustness of the ground-truth annotations used for model training.
2.3. Training of Models
2.3.1. Model Training with Different Datasets
The model training process was a critical step in validating the image dataset collected for olive fruit fly detection. To this end, three training models were developed using three distinct datasets: one consisting of field-acquired images, another composed of laboratory-acquired images, and a third combining both sources to form a global dataset. To ensure proper model development, the dataset was partitioned into two subsets: 80% of the images were used for training, while the remaining 20% were reserved for validation (Figure 9). Model training was conducted using the YOLOv5 architecture, a family of object detection models developed by Ultralytics, recognized for offering a strong balance between inference speed and detection accuracy. The YOLOv5s, YOLOv5m, and YOLOv5l models represent different sizes and levels of complexity within the YOLOv5 family, each optimized for specific applications. In this study, we evaluated the optimal model by training it with an image size of 640 pixels and 300 epochs (the number of times the model processes the entire dataset during training). The training was performed on a GPU server, specifically using Google Colab, a cloud-based service that provides access to Tensor Processing Units (TPUs) and Graphics Processing Units (GPUs) for developing open-source software, standards, and computational services.
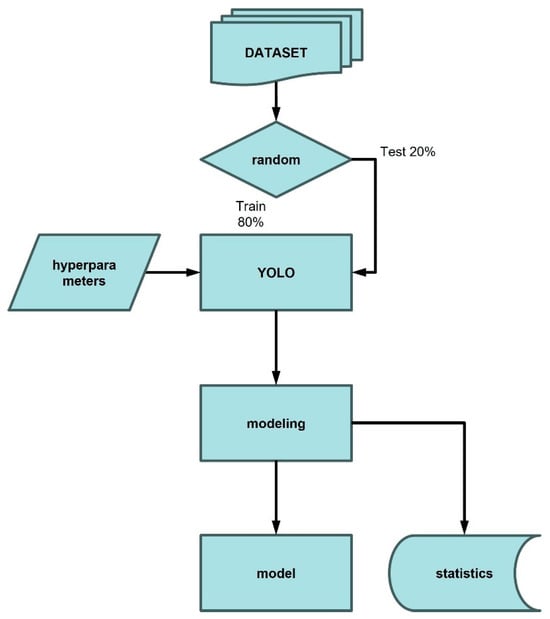
Figure 9.
Model building process.
After preparing the necessary scripts in the Google Colab terminal for the model training process, we proceeded with training by entering the specific commands tailored to the required model size. !python train.py --batch 8 --epochs 300 --data customdata.yaml --weights yolov5s.pt –cache.
This initiates the training process for the different versions evaluated (YOLOv5s and YOLOv5m) and epochs (150 and 300) (Figure 10). The files generated after training, namely best.pt and last.pt, contain the weights required by YOLOv5 to perform the subsequent inference process. Best.pt: represents the best weights collected during training. Last.pt: is the weight of the last stage of training.
Figure 10.
Model training process.
The inclusion of simple geometric augmentations (horizontal and vertical flips and 180° rotations) improved the stability of the training process and enhanced model generalization, particularly under variable illumination and background conditions. These augmentations contributed to the high recall and F1-scores achieved by all configurations.
Additionally, to ensure full reproducibility, the experimental environment and hyperparameter configuration are detailed below. All training procedures were performed using the official Ultralytics YOLOv5 repository in Google Colab. The experimental setup consisted of Python 3.10.12, PyTorch 2.5.0+cu121 and CUDA 12.1, running on an NVIDIA Tesla T4 GPU with 15 GB of VRAM. Training was executed with the YOLOv5 default configuration using an input resolution of 640 × 640 pixels and a batch size of 8. The hyperparameters corresponded to the official YOLOv5 default values, including: learning rate = 0.01, momentum = 0.937, weight decay = 0.0005, warm-up = 3 epochs and default augmentation parameters (hsv_h = 0.015, hsv_s = 0.7, hsv_v = 0.4, translate = 0.1, scale = 0.5, fliplr = 0.5, mosaic = 1.0).
Models were trained using the following command:
python train.py --batch 8 --epochs {150 or 300} --data customdata.yaml --weights yolov5{model}.pt –cache
Unless otherwise indicated, all other hyperparameters were used as provided by the YOLOv5 default configuration. The custom dataset was defined in the customdata.yaml file and included a single target class. Additionally, geometric augmentation was applied offline by generating horizontally flipped, vertically flipped and 180° rotated versions of each image prior to training to increase data diversity and improve generalization.
2.3.2. Optimization of the Model with Versions of YOLOv5s and YOLOv5m
Building on the results obtained from models trained with different datasets, three additional models were developed. To optimize their performance, the objective was to determine the most suitable model size (small or medium) for effectively detecting the olive fruit fly while also ensuring compatibility with the computational constraints of the Raspberry Pi when using the global dataset (comprising both field and laboratory images). This evaluation included versions of YOLOv5s and YOLOv5m, each trained over 150 and 300 epochs.
The YOLOv5s model represents the smaller and more lightweight variant within the YOLOv5 architecture. It was trained for 300 epochs to promote effective convergence and robust learning of the dataset. Additionally, a version trained with 150 epochs was evaluated to determine whether acceptable performance could be achieved with reduced computational resources and training time. Similarly, the larger YOLOv5m model was trained for both 150 and 300 epochs, enabling a comparative assessment of its performance and potential advantages in terms of model robustness. In general, computer vision processes involve training a machine learning model on a dataset composed of pre-classified and labeled images. During this training phase, the model learns to recognize distinctive patterns and features associated with each image category (Figure 11).
Figure 11.
Learning the model with classified and labelled images.
To ensure a meaningful and fair comparison between models of different sizes (YOLOv5s vs. YOLOv5m) and training durations (150 vs. 300 epochs), all configurations were trained under identical conditions using the same global dataset and data augmentation settings. Model performance was evaluated using standard object-detection metrics, including precision, recall, F1-score, and mean Average Precision (mAP0.5), as well as confusion-based error analysis (false positives and false negatives). In addition, training time and computational cost were considered as secondary criteria because one of the objectives was to select a model suitable for deployment on a resource-constrained embedded device (Raspberry Pi).
2.4. Inference Process in Model Validation with Different Datasets
Model validation was conducted to evaluate the performance and accuracy of the trained models using an independent dataset comprising images not included in the training phase. This validation set allowed for an objective assessment of the model’s ability to generalize to previously unseen data. Validation involved comparing the model’s predictions with the ground truth annotations and calculating standard performance metrics based on this comparison, such as precision, recall. The primary objective of the validation process was to confirm the model’s robustness and its applicability to real-world scenarios. All validation images were stored in JPEG format, accompanied by their corresponding annotations in TXT files compatible with YOLO, allowing for integration in digital processing (Figure 12).
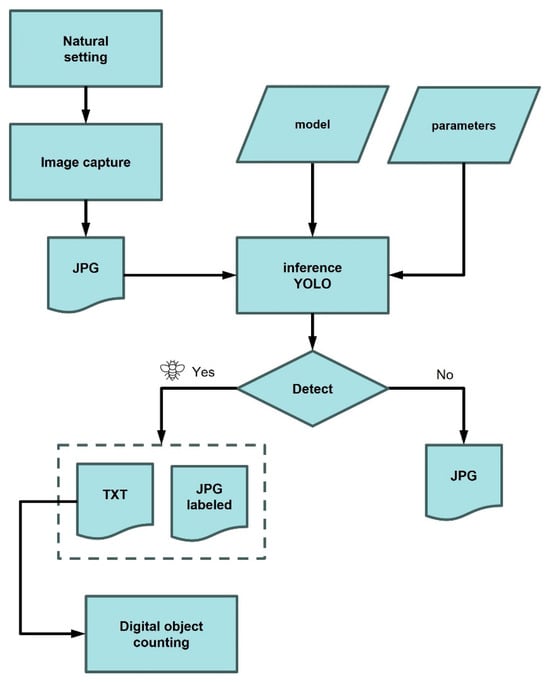
Figure 12.
Inference process.
2.5. Inference Process in the Validation of Models with Versions of YOLOv5s and YOLOv5m
The optimization of the YOLOv5 models was further evaluated through the inference process. This step consisted of evaluating the model’s ability to detect and classify specimens of B. oleae using an image dataset that had not been used during training or validation. As in the validation phase, model predictions were compared to ground truth notations, and key performance metrics, such as precision, recall, and confidence scores, were calculated to quantify accuracy. Inference was carried out within the Google Colab environment using the following script:
!python detect-py --weights/content/globalmodelM150.pt --conf 0.50 –source/content/(image for inference)
In this way, this script enabled the model to process input images and perform object detection, identifying and localizing instances of the olive fruit fly.
3. Results
3.1. Creation of the Field Dataset
During the processing of the field -acquired images, a key limitation of the dataset was identified: Although the total number of images was considerable, the presence of B. oleae individuals per trap was relatively low. This class imbalance posed a challenge to effective model training, potentially limiting the model’s ability to generalize and detect target species reliably.
To address this issue, a complementary dataset was developed under controlled laboratory conditions to increase the number of annotated olive fruit fly instances. As a result, a combined dataset of 2420 images (Figure 13) was assembled, increasing both the number and diversity of training samples and thereby increasing the robustness of the target detection model.
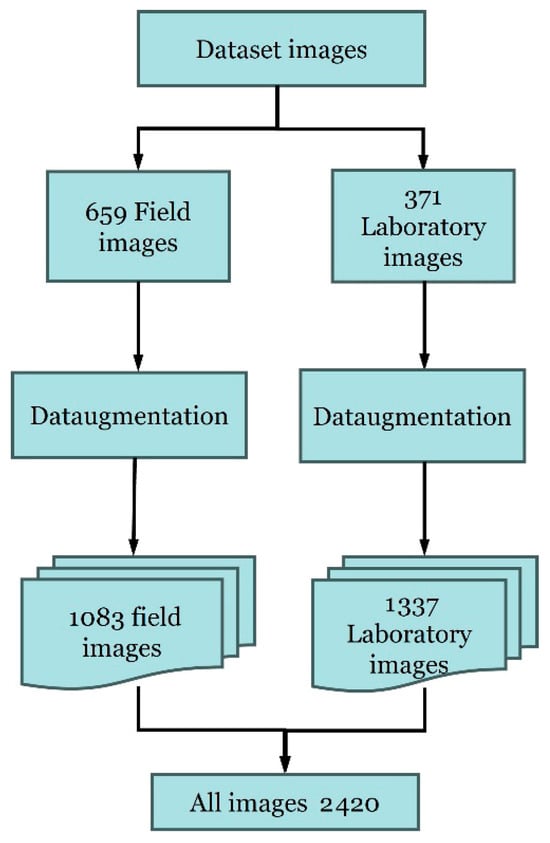
Figure 13.
Provenance of the dataset images.
3.2. Image Labelling
Although several annotation tools were evaluated—including dotdotgoose, Roboflow, and Edge Impulse—LabelImg was ultimately selected for the labeling process. The alternative tools, primarily web-based platforms, presented notable limitations regarding the permissible number and size of images, as well as the annotation format, which did not always support bounding boxes. Additionally, the requirement to upload images to external servers raised concerns about data privacy and control. Considering these constraints, LabelImg emerged as the most suitable option, offering a locally executable solution with the necessary flexibility for the task.
3.3. Training of Models
3.3.1. Model Training with Different Datasets
The results obtained in the generation of the models exceeded 0.97 accuracy in the detection of the olive fruit fly, even reaching 1 (100%) in model 2 (laboratory model). The first model (Figure 14A) created with the field dataset obtained an accuracy of 0.97 in detection. On the right-hand side of the curve, where the confidence threshold is high, the model is very selective, meaning that it only predicted as positive those instances where it was very confident, resulting in high accuracy but low recall. For the laboratory-derived model (Figure 14B), it was similar to the first one. In this case, it indicated a recall of 1 (100%) in all classes for a confidence threshold of 0.00. This means that the model correctly detected all relevant instances for a very low confidence threshold, differing slightly in the global model obtained, where the field and laboratory datasets were combined (Figure 14C). In this case, a recall of 0.99% was obtained.
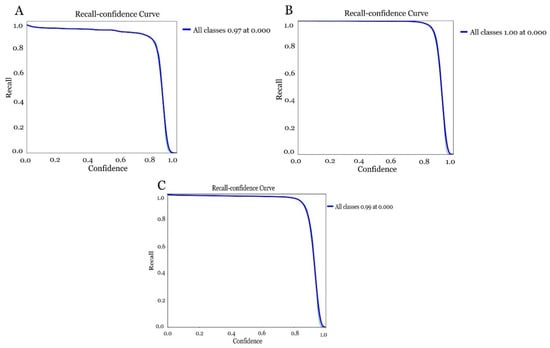
Figure 14.
Accuracy assessment of the different models for olive fruit fly detection by combining different datasets. (A) model obtained with the field dataset), (B) model obtained with the laboratory dataset and (C) model obtained with the global dataset changing field and laboratory images.
The sharp drop in recall near the confidence threshold of 1 indicated that the model began to be more conservative with its predictions, prioritising accuracy over recall as the threshold increased (Table 1).

Table 1.
Training the model with different datasets.
Looking at the confidence curve in the three models obtained for each dataset, it was observed that all three again exceeded the 0.95 confidence range. The field model (Figure 15A) did show a slight decrease with the 0.95 as opposed to the recall. The model was shown to perform with a specific confidence range achieving an F1-score close to 0.95 when the confidence is around 0.558. However, it was noted that when the confidence increases too much the performance of the model decreases, which can affect the model being too strict in its judgement, resulting in increased errors. The laboratory model (Figure 15B) achieved an F1-score of 1 (100%) when the confidence was around 0.674. In the case of the global model (field and laboratory images) (Figure 15C) it achieved an F1-score of 0.99 when the confidence was around 0.580, with performance decreasing as confidence increased (Table 1).
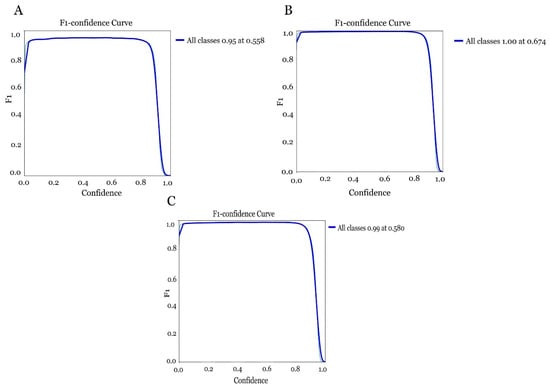
Figure 15.
Evaluation of the confidence curve in the different models for olive fruit fly detection combining different datasets. (A) model obtained with the field dataset, (B) model obtained with the laboratory dataset and (C) model obtained with the global dataset combining field and laboratory images.
3.3.2. Optimization of the Model with Versions of YOLOv5s and YOLOv5m
The results obtained in optimising the models with different versions and sizes of YOLOv5s to achieve better Raspberry pi performance differed in some aspects. The version of YOLOv5s with 300 epoch (Figure 16A), showed a solid performance, maintaining a high recall value (close to 1) for low and medium confidence thresholds with a processing time of 4.21 h. However, a sharp drop was observed when confidence thresholds were higher than 0.8. This model offered a good balance between accuracy and speed suitable for low-power hardware due to its smaller size. The version of YOLOv5s trained with 150 epoch (Figure 16B), showed a lower performance than the previous version of 300 epoch showing a steeper recall drop at high confidence thresholds. In this respect, although this model required less training time (1.98 h), it also presented more limitations in recognition. When confronting the model with the 300 epoch version of YOLOv5m (Figure 16C), it was observed that the recall-confidence curve performed the best, maintaining a high recall over a wider range of confidence thresholds. This reflected a better ability to generalise and learn complex patterns, making it ideal for demanding identification. On the downside, training with this version requires longer inference times (5.75 h) and thus higher memory consumption, which could affect the performance of the Raspberry Pi. Considering the last training of the model with the YOLOv5m version with 150 epoch (Figure 16D), this was shown to be the most unstable version with a steep drop in recall and thus a lower accuracy of the model using a time of 3.10 h.
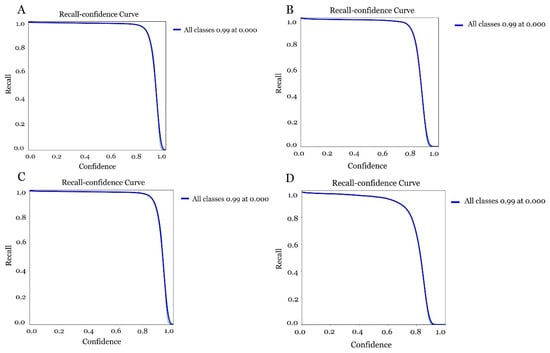
Figure 16.
Evaluation of the accuracy of the different models for olive fruit fly detection (A) model obtained with YOLOv5s 300 epoch, (B) model obtained with YOLOv5s 150 epoch, (C) model obtained with YOLOv5m 300 epoch and (D) model obtained with YOLOv5m 150 epoch.
Based on this evaluation, the YOLOv5s version was positioned as the optimal choice for implementation on a Raspberry Pi owing to its balance between efficiency and accuracy. This lightweight architecture makes YOLOv5s particularly suitable for deployment on resource-constrained edge devices such as Raspberry Pi, as it requires less GPU/CPU memory, reduces inference latency and energy consumption, and enables real-time or near-real-time operation without compromising detection performance. The m version with 300 epoch could also be recommended provided that optimisation techniques for low-power hardware are adopted.
Based on the results obtained between accuracy and sensitivity (F1-Score), it was observed that the model trained with YOLOv5s with 300 epoch (Figure 17A) reached a maximum F1-Score of 0.99 at a confidence threshold of 0.400, showing a robust balance between accuracy and sensitivity. However, the model trained with the same version and 150 epoch, (Figure 17B) presented a maximum F1-Score of 0.98 with a confidence threshold of 0.556. In this respect, it could indicate a lower ability to generalise certain cases despite a shorter training time. When the models were trained with the 300 epoch version of YOLOv5m, (Figure 17C) a very similar result to that obtained with the YOLOv5s version was observed. However, its architecture is heavier and therefore may be less suitable for implementation on the Raspberry Pi impacting inference time and memory consumption. The model that differed the most from the three previous models was the one obtained with the version of YOLOv5m with 150 epoch (Figure 17D). In this respect, an F1- Score of less than 0.96 at a confidence threshold of 0.360 was observed. Overall, the model still exhibits robustness and performs well despite being less stringent (Table 2).
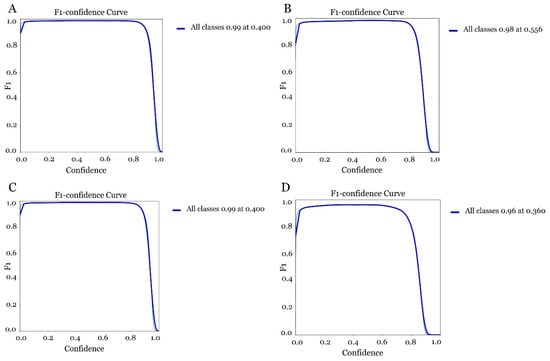
Figure 17.
Evaluation of the confidence curve in the different models for olive fruit fly detection. (A) model obtained with YOLOv5s 300 epoch, (B) model obtained with YOLOv5s 3150 epoch, (C) model obtained with YOLOv5m 300 epoch and (D) model obtained with YOLOv5m 150 epoch.
Table 2.
Training of models with different versions of YOLOv5 (s and m) and epochs (150 and 300 epochs).
Based on these results, the YOLOv5s model with 300 epoch stands out as the optimal choice due to its computational efficiency and performance to be implemented on Raspberry Pi.
3.4. Inference Process in the Validation of the Models with Different Datasets
The percentage of accuracy obtained in the different models differed when subjected to the inference process (Table 3). In this sense, the field model obtained a high percentage of accuracy when the images came from the field, but when the images came from the laboratory, the percentage of accuracy decreased. Nevertheless, the average hit rate was 86%. The same was true for the inference process of the laboratory-derived model. The percentage of accuracy was high when the images came from the laboratory but decreased when the images were from the field. Even so, the average hit rate was also high at 72.52%. The model obtained from the global dataset combining field and laboratory images obtained the highest hit rate with a minimum of 80%, proving to be the optimal model and validating this dataset for olive fruit fly detection with an average hit rate of 94%.
Table 3.
Inferences of the models with different datasets.
3.5. Inference Process in the Validation of Models with Versions of YOLOv5s and YOLOv5m
When the inference process was performed on the models with the 150 and 300 epoch versions of YOLOv5s and the 150 and 300 epoch version of YOLOv5s, the percentage of accuracy obtained in the different models differed (Table 4).
Table 4.
Model inference with YOLOv5s and m versions (300 and 150 epoch).
The model trained with the 300 epoch version of YOLOv5s showed a performance reaching 100% accuracy in most cases, with slight decreases in specific cases. However, the TS-150 model showed similar performance, although with slight differences. In contrast, the inferences made in the models trained with the YOLOv5m versions showed greater variability. In this sense, the result observed in the model with 300 epoch, achieved comparable results in many cases. On the other hand, the model trained with 150 epoch was the model with the worst performance, showing a lower percentage of accuracy.
For the evaluated data set, a model obtained with the version of YOLOv5s trained for a greater number of epochs, offers the best relationship between accuracy, robustness and computational efficiency, making it the ideal choice for practical applications in the field, especially on low-cost platforms with limited resources such as the Raspberry Pi. Overall, in all four models, false positives (FP), (determines a valid prediction when it is not) and false negatives (FN), (discards a test that it believes is not when it is) were observed in all models (Table 4), with a higher incidence in more challenging scenarios such as images with a high number of adhered insects, occlusions caused by wings or legs, insect deterioration over time, or minimal size differences between the target species and other trapped arthropods.
To visually illustrate these cases, (Figure 18 and Figure 19) presents an example where some insects were not detected (FN), despite being present in the adhesive panel. These errors are primarily associated with low-contrast regions, insects partially hidden by glue reflections, and very small specimens with minimal pixel representation.
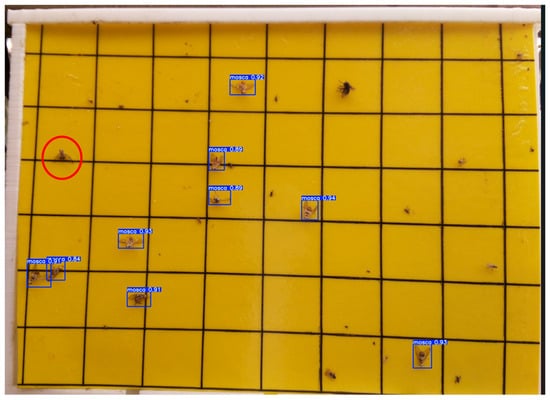
Figure 18.
Example of inference showing one false negative in a field image. Missed detections are associated with reduced visual contrast, small object size, or partial occlusion due to adhesive reflections.
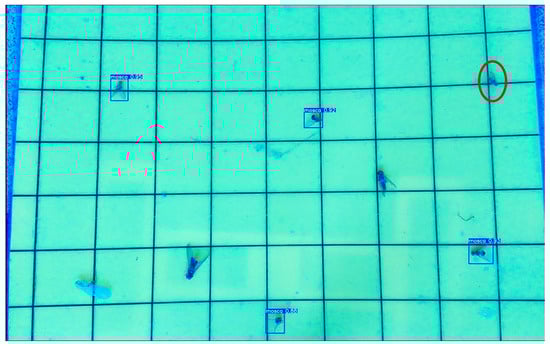
Figure 19.
Example of inference showing one false negative on a laboratory image. Missed detections are associated with reduced visual contrast, small object size, or partial occlusion due to adhesive reflections.
4. Discussion
The development of tools based on artificial intelligence (AI), specifically deep learning techniques (Deep Learning), is transforming the landscape of IPM [9,15,25,26,27] producing a great social and environmental impact, allowing researchers to face challenges related to pest control. Achieving success in creating accurate automated recognition systems for olive fruit fly detection is closely linked to the creation and existence of a robust and quality dataset [15,17]. The combination of field and laboratory images has proven to be essential for training models to operate efficiently under real-world conditions. Recent studies report that global models trained with combined datasets have achieved accuracies above 90%, validating their applicability [15,17,21]. The effectiveness of machine learning models developed for olive fruit fly detection highlights the critical importance of dataset quality and robustness in ensuring reliable performance. In this context, models trained exclusively on field or laboratory images exhibit limitations when applied across different environments. These constraints motivated the integration of both image types into a unified dataset, enhancing the overall robustness and adaptability of the resulting models. The global model, trained with field and laboratory images, showed performance, accuracy, and precision above 90%, giving the green light to effective operation in real field conditions. These values are consistent with previous deep-learning studies on agricultural pest detection, where reported accuracies typically range between 85% and 95% under controlled or semi-controlled imaging conditions [18,19,20,24]. This alignment reinforces the technical soundness of the proposed approach and confirms that the use of heterogeneous training data contributes positively to model robustness and real-world generalization.
Beyond reporting performance values, it is important to contextualize how the methodological approach of this study differs from previous research. Unlike most insect detection studies based solely on controlled laboratory datasets or synthetic image augmentation [18,19,20], our dataset integrates real field images with laboratory-generated samples that emulate operational acquisition conditions. This hybrid strategy addresses one of the main limitations identified in prior studies, where restricted scenario variability can lead to domain shift and decreased generalization when deployed in non-controlled environments [14,17,18]. Therefore, this work contributes to improving dataset representativeness, which is recognized as a key determinant for robust model generalization.
This presents a significant potential as it occurs for other pests [9,20] reporting the successful use of similar models for the detection of insects in greenhouses emphasizing that the quality of the dataset is the fundamental pillar for the effectiveness of the models in different contexts. Optimization of the machine learning architecture with YOLOv5 has emerged as a highly efficient solution for pest detection. From a methodological perspective, the selection of YOLOv5 aligns with trends in agricultural computer-vision systems, where one-stage detectors have demonstrated better operational feasibility than two-stage approaches (e.g., Faster R-CNN) in resource-constrained settings [14,19,20]. Although alternative architectures such as SSD or YOLOv8 could potentially be explored, a multi-model benchmarking analysis exceeded the scope of this study, which focused on dataset creation and embedded deployment feasibility.
Comparisons performed between light (YOLOv5s) and heavy (YOLOv5m) versions trained with different configurations of epochs demonstrated that the s version, optimized for low-cost platforms such as Raspberry Pi, offers the best ratio between accuracy, robustness and computational efficiency [14,21] crucial for practical field applications where hardware resources are limited [28]. Although alternative deep-learning architectures such as Faster R-CNN, SSD or YOLOv8 could also be considered, a multi-model benchmarking analysis was beyond the scope of this study, which focused on dataset development and embedded deployment feasibility. Under low-power edge-computing constraints, YOLOv5 provides a favourable trade-off between accuracy, inference efficiency and implementation simplicity compared with heavier or less robust alternatives [14,21,23]. For this reason, YOLOv5 was selected as the most balanced option for real-world deployment on resource-limited hardware. Furthermore, when considering long-term autonomous deployment on embedded IoT devices, it is essential to prevent progressive error accumulation and performance drift, especially in unattended sensing environments. Recent research highlights the need for systematic error monitoring strategies in long-duration edge–AI systems to ensure long-term operational reliability and data integrity, which aligns with the goals of the proposed trap-based monitoring solution [29]. This study shows how the incorporation of advanced AI techniques and the optimization of model training processes present an enormous potential that machine learning models can achieve for the accurate detection of olive fruit flies. Additionally, advances in techniques such as transfer learning and convolutional neural networks have allowed for the extension of the applicability of these models to pests of other crops such as tomato or rice [24,30]. These advances not only offer a promising tool for olive growing but also highlight the importance of continued efforts toward scalable and accessible technological solutions. In this regard, the development of a unified global dataset and the implementation of lightweight Deep Learning architectures emerge as key strategies for integrated pest management within the framework of sustainable agriculture.
Comparison and Interpretation of Results
The achieved recall and F1-scores (up to ≈0.99) confirm that YOLOv5-based models can provide robust detection of B. oleae under heterogeneous imaging conditions. The small variability observed among repetitions (standard deviation < 0.02) suggests consistent model behavior and satisfactory statistical confidence. Similar deep-learning approaches have been reported for pest recognition in general reviews [9,14,23]; and several YOLOv5-based studies have been proposed for different crops and species, such as rice or tomato pests [19,20,24]. In comparison, the proposed system achieved comparable or higher performance while using a smaller but more diverse dataset, and it was the only one validated on a low-cost embedded platform [24]. This indicates that dataset heterogeneity has a stronger influence on model generalization than dataset size alone.
5. Conclusions
This study developed a heterogeneous dataset and evaluated YOLOv5-based detection models specifically with the goal of enabling an electronic trap for monitoring B. oleae. The best configuration (YOLOv5s trained for 300 epochs) achieved F1 approximately 0.99 and could run inference on a Raspberry Pi with latency compatible with intermittent image capture strategies. These results demonstrate the technical feasibility of an embedded, low-cost detection module for IPM applications.
The dataset and pipeline were created to be reusable and reproducible; they provide a benchmark for the next stages of trap development, including hardware integration, field trials and continued model updating from trap-acquired data.
The dataset and training pipeline were designed for transparency and reproducibility, providing a benchmark for the next stages of trap development, including hardware integration, field validation, and continuous model improvement using images acquired from deployed traps.
Based on these promising results, future work will focus on expanding the dataset, testing more advanced detection architectures, and completing the design and deployment of an intelligent electronic trap for automated population monitoring and decision support within IPM frameworks.
6. Future Work
Future work will focus on expanding the dataset with additional field samples collected throughout multiple seasons and geographic locations, allowing for a broader representation of environmental variability and insect population dynamics. Further improvements will include the evaluation of more advanced deep learning architectures, lightweight model compression strategies, and on-device optimisation techniques to enhance inference efficiency on embedded platforms.
In parallel, the next development stage will focus on the complete design, engineering, and deployment of an intelligent electronic trap integrating the trained detection model with low-power image acquisition, wireless communication capabilities, and autonomous energy management. A functional prototype will be tested under real operational field conditions to evaluate durability, reliability, maintenance requirements, and long-term monitoring performance. Ultimately, the objective is to achieve a fully operational, scalable, and autonomous early-warning system that can be incorporated into Integrated Pest Management (IPM) frameworks to support data-driven decision-making in olive production systems.
Author Contributions
F.M.-A., L.M.C.-D., J.C.R.-F. and J.M.D.-C. Conceptualization and Methodology. F.M.-A., L.M.C.-D. and J.M.D.-C. data collection, curation, and analysis. M.Y.-Y. and E.Q.-M. Funding acquisition, Project Administration, Validation, and Visualization. All authors have read and agreed to the published version of the manuscript.
Funding
(1) This publication is part of the project TED2021-132458B-100, funded by MCIN/AEI/10.13039/501100011033 and by the European Union ‘NextGenerationEU’/PRTR. Recovery, Transformation and Resilience Plan—Funded by the European Union—NexGenerationEU. (2) Also, this work was partially financed by the EU under the Project “Commercialization of an Automated Monitoring and Control System against the Olive and Med Fruit Flies of the Mediterranean Region, FruitFlyNet-ii, STR_B_A.2.1_0043”, as part of the ENI CBC MED Mediterranean Sea Basin Programme 2014–2020. (3) Furthermore, we acknowledge financial support of the Spanish Ministry of Science and Innovation and the Spanish State Research Agency, through the Severo Ochoa and María de Maeztu Program for Centers and Units of Excellence in R&D (Ref. CEX2019-000968-M).
Data Availability Statement
The data presented in this study are available upon request to the corresponding author because some of the images belong to a project with several partners and others were taken for the purpose of writing this article. They come from different sources and are not stored in a common repository.
Acknowledgments
The ENIA International Chair in Agriculture, University of Cordoba (TSI-100921-2023-3), funded by the Secretary of State for Digitalization and Artificial Intelligence and by the European Union—Next Generation EU. Recovery, Transformation and Resilience Plan.
Conflicts of Interest
The authors declare no conflicts of interest. The funders had no role in the design of this study; in the collection, analyses, or interpretation of data; in the writing of the manuscript; or in the decision to publish the results.
References
- Vossen, P. Olive Oil: History, Production, and Characteristics of the World’s Classic Oils. HortScience 2007, 42, 1093–1100. [Google Scholar] [CrossRef]
- Malheiro, R.; Casal, S.; Baptista, P.; Pereira, J.A. A Review of Bactrocera oleae (Rossi) Impact in Olive Products: From the Tree to the Table. Trends Food Sci. Technol. 2015, 44, 226–242. [Google Scholar] [CrossRef]
- MAPA (Ministerio de Agricultura, Pesca y Alimentación). Información Sobre el Aceite de Oliva y la Aceituna de Mesa; Ministerio de Agricultura, Pesca y Alimentación: Madrid, Spain, 2023; Available online: https://www.mapa.gob.es/es/agricultura/temas/producciones-agricolas/aceite-oliva-y-aceituna-mesa/avances (accessed on 24 November 2025).
- Santiago-Álvarez, C.; Quesada-Moraga, E. The olive fruit fly. Oleae 2007, 26, 60–61. [Google Scholar]
- European Commission. Press Corner—European Commission: Ip_23_3565; European Commission: Brussels, Belgium, 2023. [Google Scholar]
- MAPA (Ministerio de Agricultura, Pesca y Alimentación). Guía de Gestión Integrada de Plagas; Ministerio de Agricultura, Pesca y Alimentación: Madrid, Spain, 2014. [Google Scholar]
- Sciarretta, A.; Perdikis, D.; Kfoury, L.; Travaglini, T.; Sotiras, M.-I.; Alcaide, F.M.; Ameur, M.B.; Choueiri, E.; Ksantini, M.; Ksentini, I.; et al. Spatial Dynamics of Olive Fruit Fly Adults in the Framework of a Monitoring Trap Network. Appl. Sci. 2025, 15, 6285. [Google Scholar] [CrossRef]
- Pedigo, L.P. Entomology and Pest Management, 2nd ed.; Prentice Hall: Upper Saddle River, NJ, USA, 1996; ISBN 978-0-13-373531-4. [Google Scholar]
- Chakrabarty, S.; Deb, C.K.; Marwaha, S.; Haque, M.A.; Kamil, D.; Bheemanahalli, R.; Dhillon, M.K.; Shashank, P.R. Application of Artificial Intelligence in Insect Pest Identification—A Review. Artif. Intell. Agric. 2025, 16, 44–61. [Google Scholar] [CrossRef]
- Lioy, S.; Carisio, L.; Manino, A.; Porporato, M. Climatic Niche Differentiation between the Invasive Hornet Vespa velutina nigrithorax and Two Native Hornets in Europe, Vespa crabro and Vespa orientalis. Diversity 2023, 15, 495. [Google Scholar] [CrossRef]
- Moreno-Alcaide, F.; Quesada-Moraga, E.; Valverde-García, P.; Yousef-Yousef, M. Optimizing Decision-Making Potential, Cost, and Environmental Impact of Traps for Monitoring Olive Fruit Fly Bactrocera oleae (Rossi) (Diptera: Tephritidae). J. Econ. Entomol. 2025, 118, 219–228. [Google Scholar] [CrossRef]
- Kalamatianos, R.; Kermanidis, K.L.; Karydis, I.; Avlonitis, M. Treating Stochasticity of Olive-Fruit Fly’s Outbreaks via Machine Learning Algorithms. Neurocomputing 2017, 280, 135–146. [Google Scholar] [CrossRef]
- Moreira, G.; Neves Dos Santos, F.; Cunha, M. Grapevine Inflorescence Segmentation and Flower Estimation Based on Computer Vision Techniques for Early Yield Assessment. Smart Agric. Technol. 2025, 10, 100690. [Google Scholar] [CrossRef]
- Pierre Nyakuri, J.; Nkundineza, C.; Gatera, O.; Nkurikiyeyezu, K. State-of-the-Art Deep Learning Algorithms for Internet of Things-Based Detection of Crop Pests and Diseases: A Comprehensive Review. IEEE Access 2024, 12, 169824–169849. [Google Scholar] [CrossRef]
- Shabrina, N.H.; Lika, R.A.; Indarti, S. Deep Learning Models for Automatic Identification of Plant-Parasitic Nematode. Artif. Intell. Agric. 2023, 7, 1–12. [Google Scholar] [CrossRef]
- Loyani, K.L.; Bradshaw, K.; Machuve, D. Segmentation of Tuta Absoluta’s Damage on Tomato Plants: A Computer Vision Approach. Appl. Artif. Intell. 2021, 35, 1107–1127. [Google Scholar] [CrossRef]
- Wang, K.; Chen, K.; Du, H.; Liu, S.; Xu, J.; Zhao, J.; Chen, H.; Liu, Y.; Liu, Y. New Image Dataset and New Negative Sample Judgment Method for Crop Pest Recognition Based on Deep Learning Models. Ecol. Inform. 2022, 69, 101620. [Google Scholar] [CrossRef]
- Mamdouh, N.; Khattab, A. YOLO-Based Deep Learning Framework for Olive Fruit Fly Detection and Counting. IEEE Access 2021, 9, 84252–84262. [Google Scholar] [CrossRef]
- Dai, M.; Dorjoy, M.M.H.; Miao, H.; Zhang, S. A New Pest Detection Method Based on Improved YOLOv5m. Insects 2023, 14, 54. [Google Scholar] [CrossRef]
- Rustia, D.J.A.; Chao, J.-J.; Chiu, L.-Y.; Wu, Y.-F.; Chung, J.-Y.; Hsu, J.-C.; Lin, T.-T. Automatic Greenhouse Insect Pest Detection and Recognition Based on a Cascaded Deep Learning Classification Method. J. Appl. Entomol. 2020, 145, 206–222. [Google Scholar] [CrossRef]
- Ahmad, I.; Yang, Y.; Yue, Y.; Ye, C.; Hassan, M.; Cheng, X.; Wu, Y.; Zhang, Y. Deep Learning Based Detector YOLOv5 for Identifying Insect Pests. Appl. Sci. 2022, 12, 10167. [Google Scholar] [CrossRef]
- Jacó, C.G.; Borges, D.L. Insect Pest Image Recognition: A Few-Shot Machine Learning Approach Including Maturity Stages Classification. Agronomy 2022, 12, 1733. [Google Scholar] [CrossRef]
- Teixeira, A.C.; Ribeiro, J.; Morais, R.; Sousa, J.J.; Cunha, A. A Systematic Review on Automatic Insect Detection Using Deep Learning. Agriculture 2023, 13, 713. [Google Scholar] [CrossRef]
- Huang, M.-L.; Chuang, T.-C.; Liao, Y.-C. Application of Transfer Learning and Image Augmentation Technology for Tomato Pest Identification. Sustain. Comput. Inform. Syst. 2022, 33, 100646. [Google Scholar] [CrossRef]
- Høye, T.T.; Ärje, J.; Bjerge, K.; Hansen, O.L.P.; Iosifidis, A.; Leese, F.; Mann, H.M.R.; Meissner, K.; Melvad, C.; Raitoharju, J. Deep Learning and Computer Vision Will Transform Entomology. Proc. Natl. Acad. Sci. USA 2020, 118, e2002545117. [Google Scholar] [CrossRef]
- Li, W.; Zheng, T.; Zhankui, Y.; Li, M.; Sun, C.; Yang, X. Classification and Detection of Insects from Field Images Using Deep Learning for Smart Pest Management: A Systematic Review. Ecol. Inform. 2021, 66, 101460. [Google Scholar] [CrossRef]
- Rubanga, D.P.; Loyani, L.K.; Richard, M.; Shimada, S. A Deep Learning Approach for Determining Effects of Tuta Absoluta in Tomato Plants. arXiv 2020, arXiv:2004.04023. [Google Scholar] [CrossRef]
- Rustia, D.J.A.; Hacinas, E.A.; Acero, L.A.; Querol, L.S.; Arcelo, M.; Amalin, D.M. Applying Generative Adversarial Networks for Sticky Paper Trap Image Generation and Object Detector Performance Enhancement. In Proceedings of the 2022 ASABE Annual International Meeting, Houston, TX, USA, 17–20 July 2022. [Google Scholar] [CrossRef]
- Zhao, H.; Yan, L.; Hou, Z.; Lin, J.; Zhao, Y.; Ji, Z.; Wang, Y. Error Analysis Strategy for Long-Term Correlated Network Systems: Generalized Nonlinear Stochastic Processes and Dual-Layer Filtering Architecture. IEEE Internet Things J. 2025, 12, 33731–33745. [Google Scholar] [CrossRef]
- Zhou, H.; Cai, D.; Lin, L.; Huang, D.; Wu, B.-M. Recognition of Multi-Symptomatic Rice Leaf Blast in Dual Scenarios by Using Convolutional Neural Networks. Smart Agric. Technol. 2025, 11, 100867. [Google Scholar] [CrossRef]
Disclaimer/Publisher’s Note: The statements, opinions and data contained in all publications are solely those of the individual author(s) and contributor(s) and not of MDPI and/or the editor(s). MDPI and/or the editor(s) disclaim responsibility for any injury to people or property resulting from any ideas, methods, instructions or products referred to in the content. |
© 2025 by the authors. Licensee MDPI, Basel, Switzerland. This article is an open access article distributed under the terms and conditions of the Creative Commons Attribution (CC BY) license (https://creativecommons.org/licenses/by/4.0/).