

Signals, Volume 6, Issue 3 (September 2025) – 20 articles
Cover Story (view full-size image):
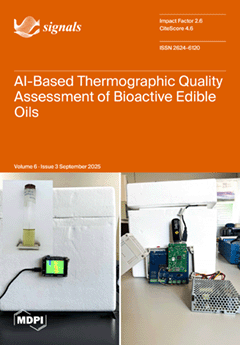
This study introduces a novel non-invasive framework for assessing the quality of four bioactive oils (olive oil, sunflower oil, tomato seed oil, and pumpkin seed oil) through infrared thermography and deep learning. The customized electronic system designed acquires thermographic signals under controlled temperature and humidity conditions. The acquisition system was used to extract thermal data. A hybrid deep learning model that integrates Convolutional Neural Networks (CNNs) with Long Short-Term Memory (LSTM) was built to classify the oils based on their stability, thermal reactivity, and potential health benefits. Signal analysis has shown that the AI-based method achieves an F1-score of 93.66%, providing a non-invasive and intelligent framework for the validation and traceability of nutritional compounds. View this paper
- Issues are regarded as officially published after their release is announced to the table of contents alert mailing list.
- You may sign up for e-mail alerts to receive table of contents of newly released issues.
- PDF is the official format for papers published in both, html and pdf forms. To view the papers in pdf format, click on the "PDF Full-text" link, and use the free Adobe Reader to open them.
Previous Issue
Next Issue