Article

Rocket Launch Detection with Smartphone Audio and Transfer Learning

by
Sarah K. Popenhagen
1,*,
Samuel Kei Takazawa
2 and
Milton A. Garcés
1
1
Infrasound Laboratory, University of Hawai’i at Mānoa, Honolulu, HI 96822, USA
2
Physics Division, Physical and Life Science Directorate, Lawrence Livermore National Laboratories, Livermore, CA 94550, USA
*
Author to whom correspondence should be addressed.
Signals 2025, 6(3), 41; https://doi.org/10.3390/signals6030041
Submission received: 11 May 2025 / Revised: 1 July 2025 / Accepted: 29 July 2025 / Published: 11 August 2025

Abstract

Rocket launches generate infrasound signatures that have been detected at great distances. Due to the sparsity of the networks that have made these detections, however, most signals are detected tens of minutes to hours after the rocket launch. In this work, a method of near-real-time detection of rocket launches using data from a network of smartphones located 10–70 km from launch sites is presented. A machine learning model is trained and tested on the open-access Aggregated Smartphone Timeseries of Rocket-generated Acoustics (ASTRA), Smartphone High-explosive Audio Recordings Dataset (SHAReD), and ESC-50 datasets, resulting in a final accuracy of 97% and a false positive rate of <1%. The performance and behavior of the model are summarized, and its suitability for persistent monitoring applications is discussed.

1. Introduction

Since the launch of Sputnik on 4 October 1957, humanity has successfully launched over six thousand rockets into orbit. As science and technology have advanced in the decades since, the specifications and capabilities of rocket engines have changed and grown while the underlying principles have remained constant. To escape Earth’s atmosphere, rockets must be accelerated to great velocities. To achieve this acceleration, propellants are burned in a combustion chamber. The resulting exhaust is the working fluid; it is accelerated through a propelling nozzle and expelled at hypersonic velocities to produce thrust. The nature and state of the propellants used can vary between makes and models of rockets, but these basic principles remain constant.
During the launch sequence of a rocket, acoustic waves are generated by a number of source mechanisms, resulting in a complex acoustic signature. For convenience, we will divide these acoustic waves into three categories: waves generated by the engine (engine noise), waves generated by exhaust (exhaust noise), and waves generated by turbulent flow excitation (jet noise). Engine noise, while the least intense of the three, is well-studied due to combustion instabilities leading to catastrophic engine failure, material fatigue, etc., generating distinct acoustic signatures. Through ignition and liftoff, exhaust noise is the primary source of acoustic energy. As exhaust is expelled from the rocket, it collides with ambient air, creating shock waves. For many rockets, the intensity of these waves is high enough to damage the rocket and/or nearby structures, and thus, water-based suppression of exhaust noise has been frequently employed on launch pads since the Space Shuttle program. As the rocket accelerates into supersonic velocities, jet noise generated by the increasing shear flow and resulting turbulent eddies overtakes exhaust noise and becomes the dominant source of acoustic energy.
Like other large-scale events such as earthquakes and explosions, rocket launches generate low-frequency (<300 Hz) sound as well as infrasound (<20 Hz) [1]. These components of acoustic rocket signatures can remain detectable over great distances due to the frequency dependence of atmospheric attenuation. Infrasound sensors are employed by the International Monitoring System (IMS) of the Comprehensive Nuclear-Test-Ban Treaty Organization to detect and monitor large-scale events, including rocket launches [2]. IMS infrasound stations have successfully collected signatures from a variety of events, including numerous rocket launches [3], but the sparsity of the network necessitated by its global coverage and the expense of traditional infrasound sensors result in these signatures being collected only after propagating vast distances. The result is that detections can only be made long after a rocket has launched, at which point much of the information the signature once carried about its source has been lost to attenuation.
Investigation of acoustic rocket signatures collected by the IMS shows that approximately 27% of all known orbital launches are not detected by any of the IMS’s infrasound stations [3]. Out of all rockets launched from the Kennedy Space Center and Cape Canaveral Space Force Station between 2009 and mid-2020, about 64% were detected in IMS infrasound data [3]. Analysis of the data shows that the detected signals traveled a mean distance of 2296 km before reaching an IMS infrasound station, with first arrivals 113.5 min after the reported launch time on average [3]. To achieve reliable detection while a rocket is still in the process of launching, propagation times dramatically shorter than this would be necessary (<5 min). While increasing the density of the IMS’s infrasound network could achieve this, the cost of the number of additional stations necessary (>50) would be very high.
To limit propagation times to <5 min, however, propagation distances must be limited to approximately <100 km. At these shorter ranges, the effects of attenuation are less severe, and the highly sensitive infrasound sensors utilized by the IMS may not be necessary. Instead, non-traditional, attritable sensors such as smartphones could be deployed between existing IMS stations and/or in regions of interest at a fraction of the cost of traditional IMS stations. Smartphone microphones have been used to successfully collect infrasonic and low-frequency signatures at the propagation distances in question [4], smartphone audio data have been used to train machine learning models to accurately detect explosion signatures [5,6] in previous studies, and a dataset of acoustic rocket signatures collected by smartphones at 10–70 km range [7] has been collected and released with the problem of near-real-time rocket launch detection in mind. In this work, we present a machine learning model designed and trained to detect acoustic rocket signatures in smartphone audio data from this dataset and two others, using the machine learning method transfer learning. In the following sections, we detail the methods used, examine the behavior of the model, evaluate its performance under different conditions, and discuss the suitability of this solution for persistent monitoring of rocket launches.

2. Data and Methods

2.1. Data Preparation

2.1.1. Aggregated Smartphone Timeseries of Rocket-Generated Acoustics (ASTRA)

The acoustic rocket signatures used to train and test the models in this work are from Aggregated Smartphone Timeseries of Rocket-generated Acoustics (ASTRA), a publicly available dataset containing 1089 smartphone audio recordings of 243 rocket launches [7]. The data in ASTRA were recorded with an 800 Hz sampling rate by Android smartphones stationed 10–70 km from launch pads at Cape Canaveral Space Force Station and the Kennedy Space Center. Along with the recordings themselves, the estimated signal start and peak times at each station, as well as the unique launch identification strings, were used. The process used to calculate these estimates is detailed in Popenhagen and Garcés (2025) [8], and an example of an ASTRA recording is shown in Figure 1.
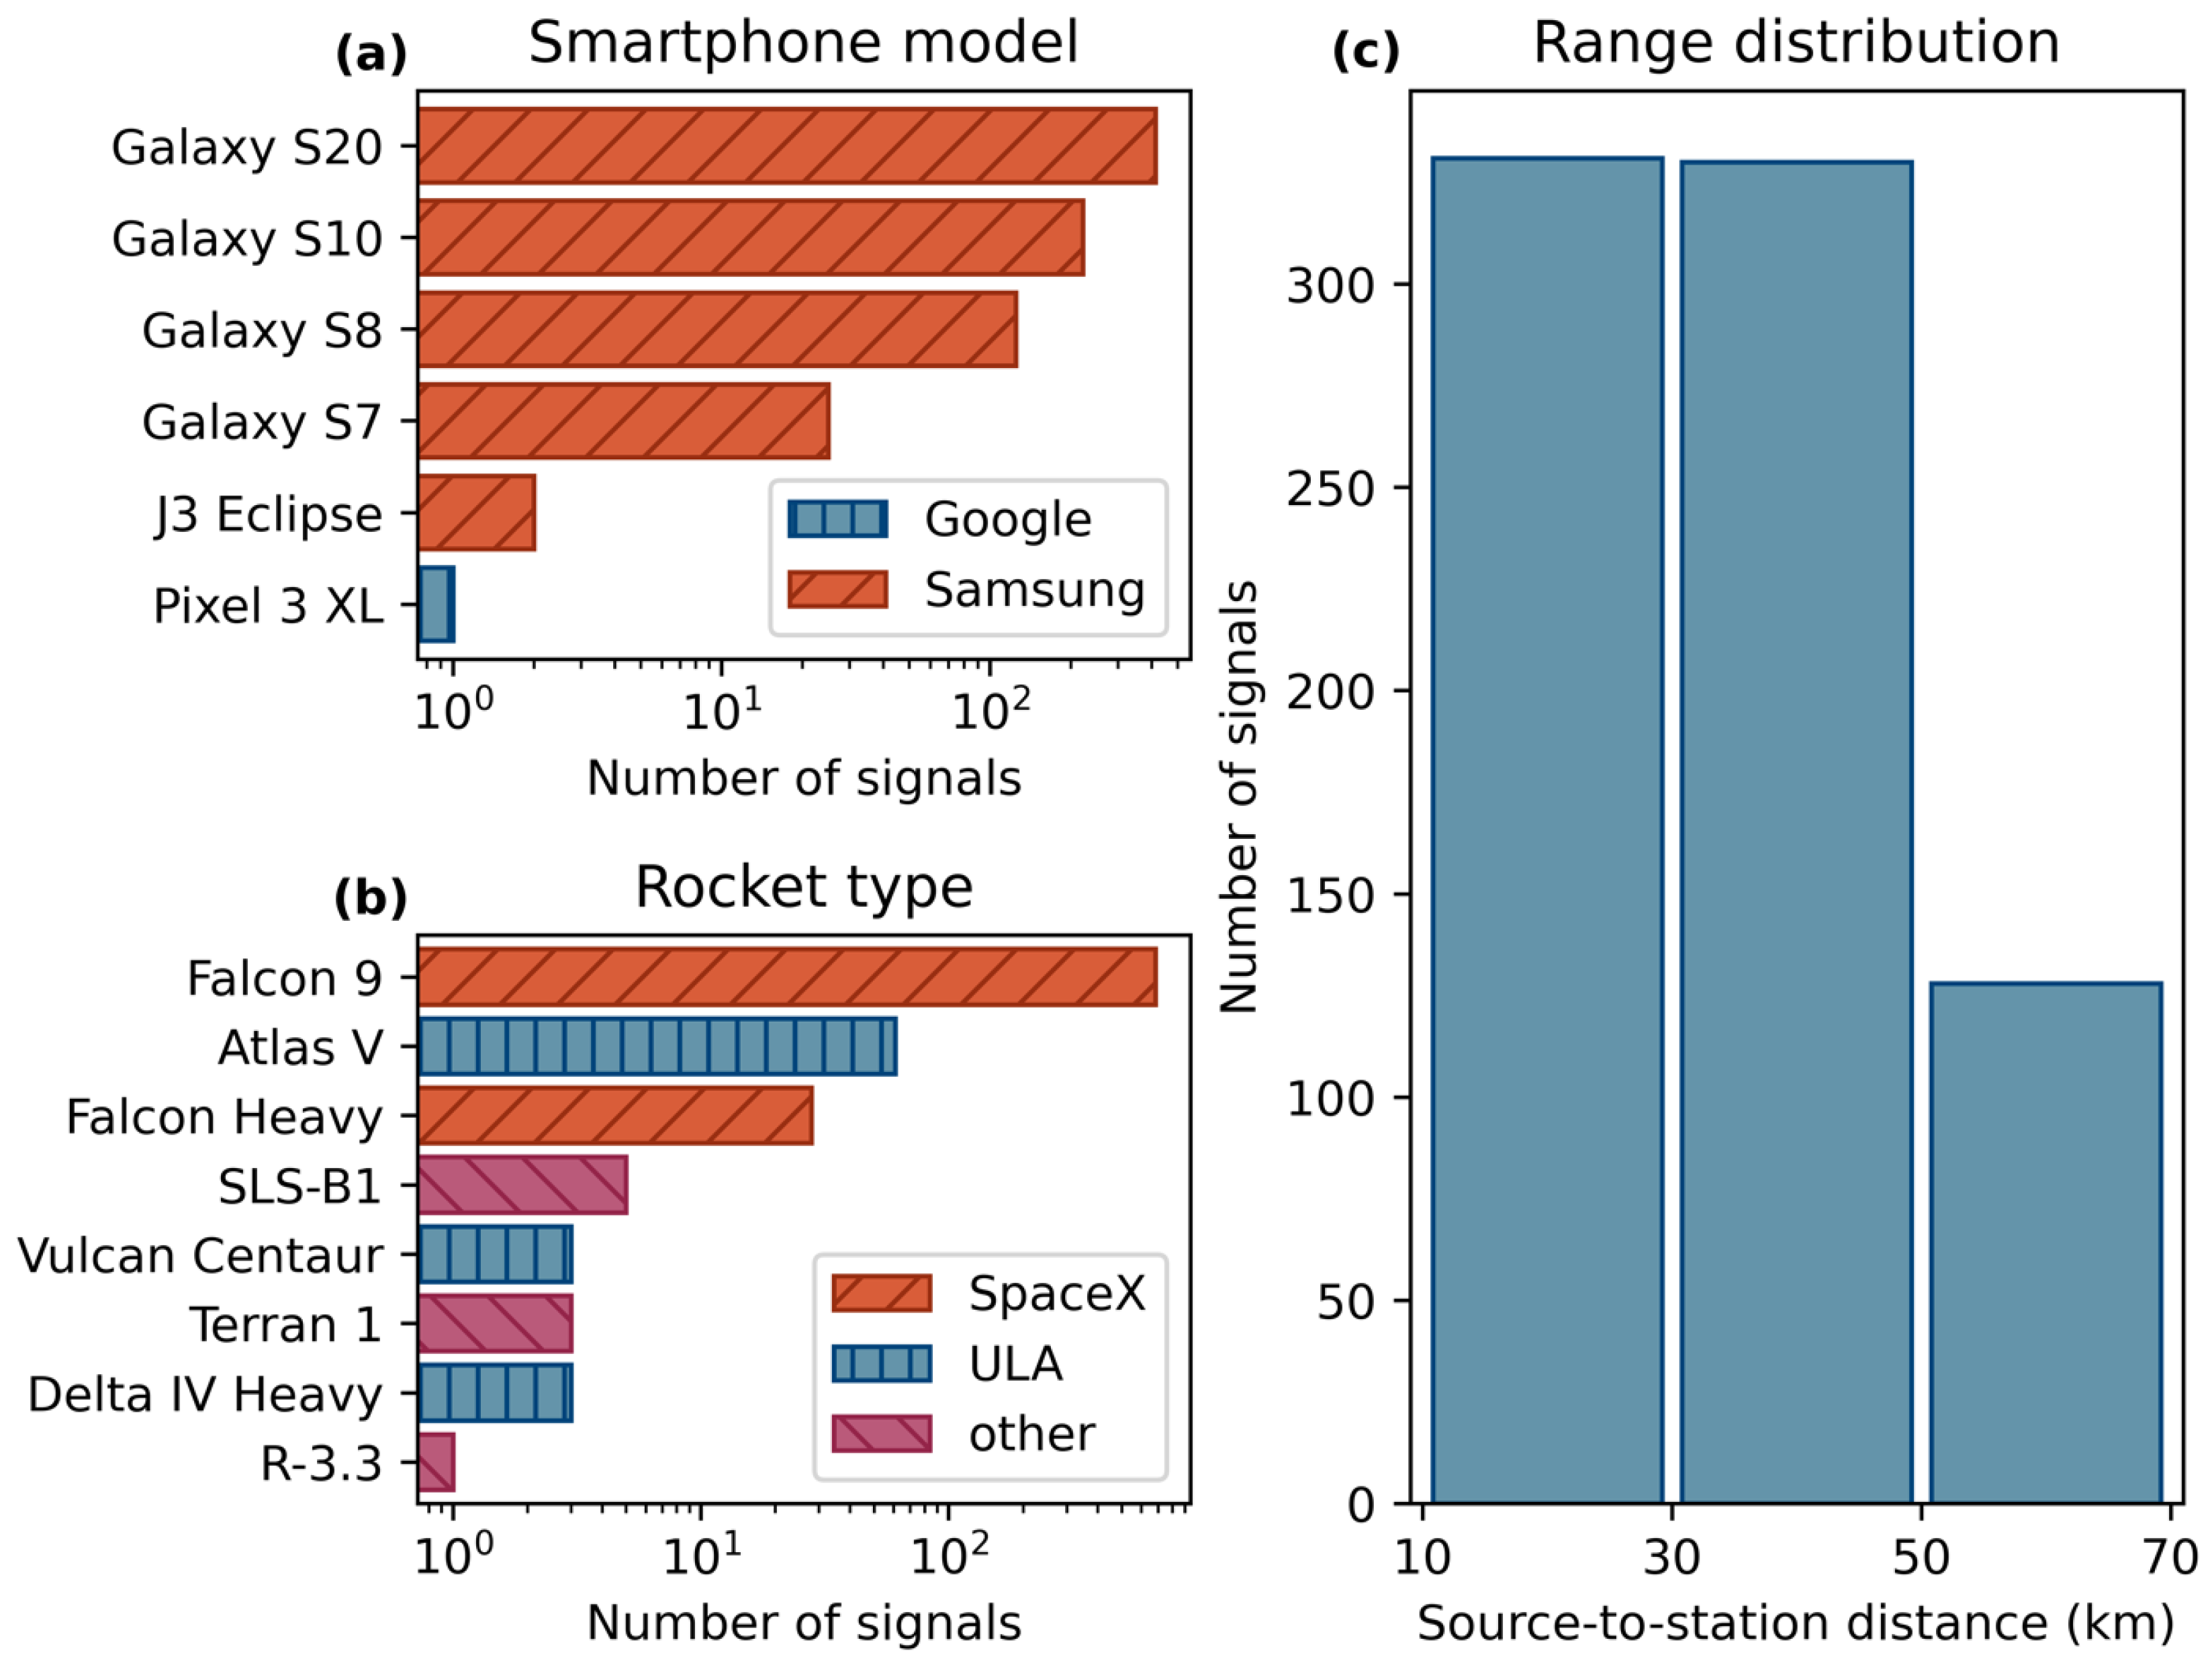
In preparation for machine learning, a subset of ASTRA was compiled by removing any recordings for which confidence in the alignment was decreased due to missing data or high environmental noise, reducing the dataset to 789 recordings from 233 launches. An overview of the smartphone models, rocket types, and range categories represented in this subset of ASTRA is shown in Figure 2. Both positive (labeled as ‘rocket’) and negative (labeled as ‘noise’) samples were taken from the high-confidence recordings. For the positive samples, a 4.8 s window centered on the estimated arrival time of the signal peak (~181 s in Figure 1) was selected and divided into five 0.96-second samples. If a recording contained data taken from >120 s before the associated estimate of the arrival time of the beginning of the signal, that segment was separated and divided into up to fifty 0.96-second samples for additional noise data.

2.1.2. Smartphone High-Explosive Audio Recordings Dataset (SHAReD)

The Smartphone High-Explosive Audio Recordings Dataset (SHAReD) [9] is an open-access dataset containing 326 multi-modal smartphone data points collected during 70 surface high-explosive events. In this work, only the smartphone microphone data were used. The explosion signals in SHAReD all have signal-to-noise ratios of >3, effective yields from 1 to 100 kg TNT, and ranges between 10 g and 4 tons. SHAReD audios were collected at sampling rates of either 800 Hz or 8000 Hz. For an in-depth overview of SHAReD, we direct the reader to its accompanying paper [4]. For each station during each event, SHAReD includes one 0.96-second ‘explosion’ waveform and one 0.96-second ‘silence’ waveform (sampled from before the explosion signal’s arrival). All 652 samples from SHAReD were labeled as ‘noise’.

2.1.3. Environmental Sound Data from ESC-50

The ESC-50 dataset is a collection of 2000 environmental sound recordings originally recorded as part of the Freesound project [10]. Each of the 2000 clips is 5 s in duration, has a sampling rate of 44.1 kHz, and is labeled as belonging to 1 of 50 semantic classes. There are exactly 20 clips from each class (e.g., ‘dog’, ‘snoring’, ‘chainsaw’, etc.), with some classes (‘thunderstorm’, ‘fireworks’, ‘airplane’, etc.) including low-frequency and/or infrasonic sources. ESC-50 is widely used as a benchmarking dataset for environmental sound classification models, and its inclusion has been shown to improve the robustness and performance of transfer learning audio classification models. In preparation for machine learning, five 0.96-second samples were taken from each ESC-50 clip, resulting in 10,000 samples, each of which was labeled as ‘noise’.

2.1.4. Data Fusion, Resampling, and Splitting

For the proposed use case of persistent monitoring with a network of stations, the effective false negative rate can be decreased rapidly by increasing the density of the network. For example, if we assume that false negatives at different stations are independent of each other and stations within that range have a false negative rate (FNR) of 5%, then the probability of a network-wide false negative decreases by a factor of 20 with every additional station in range.
The impact of the false positive rate (FPR), however, increases with network density. With 0.96-second samples and 50% overlap, each station makes 7500 predictions every hour. At our example rate of 5%, that would be 375 false positives per hour at every station, in which case true positive classifications would become the proverbial needle in the haystack. It is beneficial, then, to prioritize lowering the rocket detection model’s false positive rate over its false negative rate. For this reason, the training data were left intentionally unbalanced, including approximately 10 ‘noise’ samples for every ‘rocket’ sample in the training set. This imbalance was intended to encourage the model to favor false negatives over false positives, as well as increase robustness by exposing the model to a greater amount and variety of ‘noise’ data.
All audio samples from ESC-50 and the samples from SHAReD recorded at 8000 Hz were downsampled to 800 Hz to match the ASTRA audio samples, after which all samples from all three datasets were upsampled to 16 kHz to match YAMNet’s input requirements. The samples from ASTRA, SHAReD, and ESC-50 were each split randomly into training, validation, and testing sets, with target distributions of 80%, 10%, and 10%, respectively. To avoid evaluating the model on data it was trained on, all samples from each individual launch, explosion, or Freesound clip were isolated to one of the three sets using the unique event identification strings included in all three datasets. Due to this constraint, the target distributions were not always met exactly. The datasets were split in this manner a total of 15 times, resulting in 15 randomly split datasets on which to train and test the rocket detection model.

2.2. Yet Another Mobile Network (YAMNet)

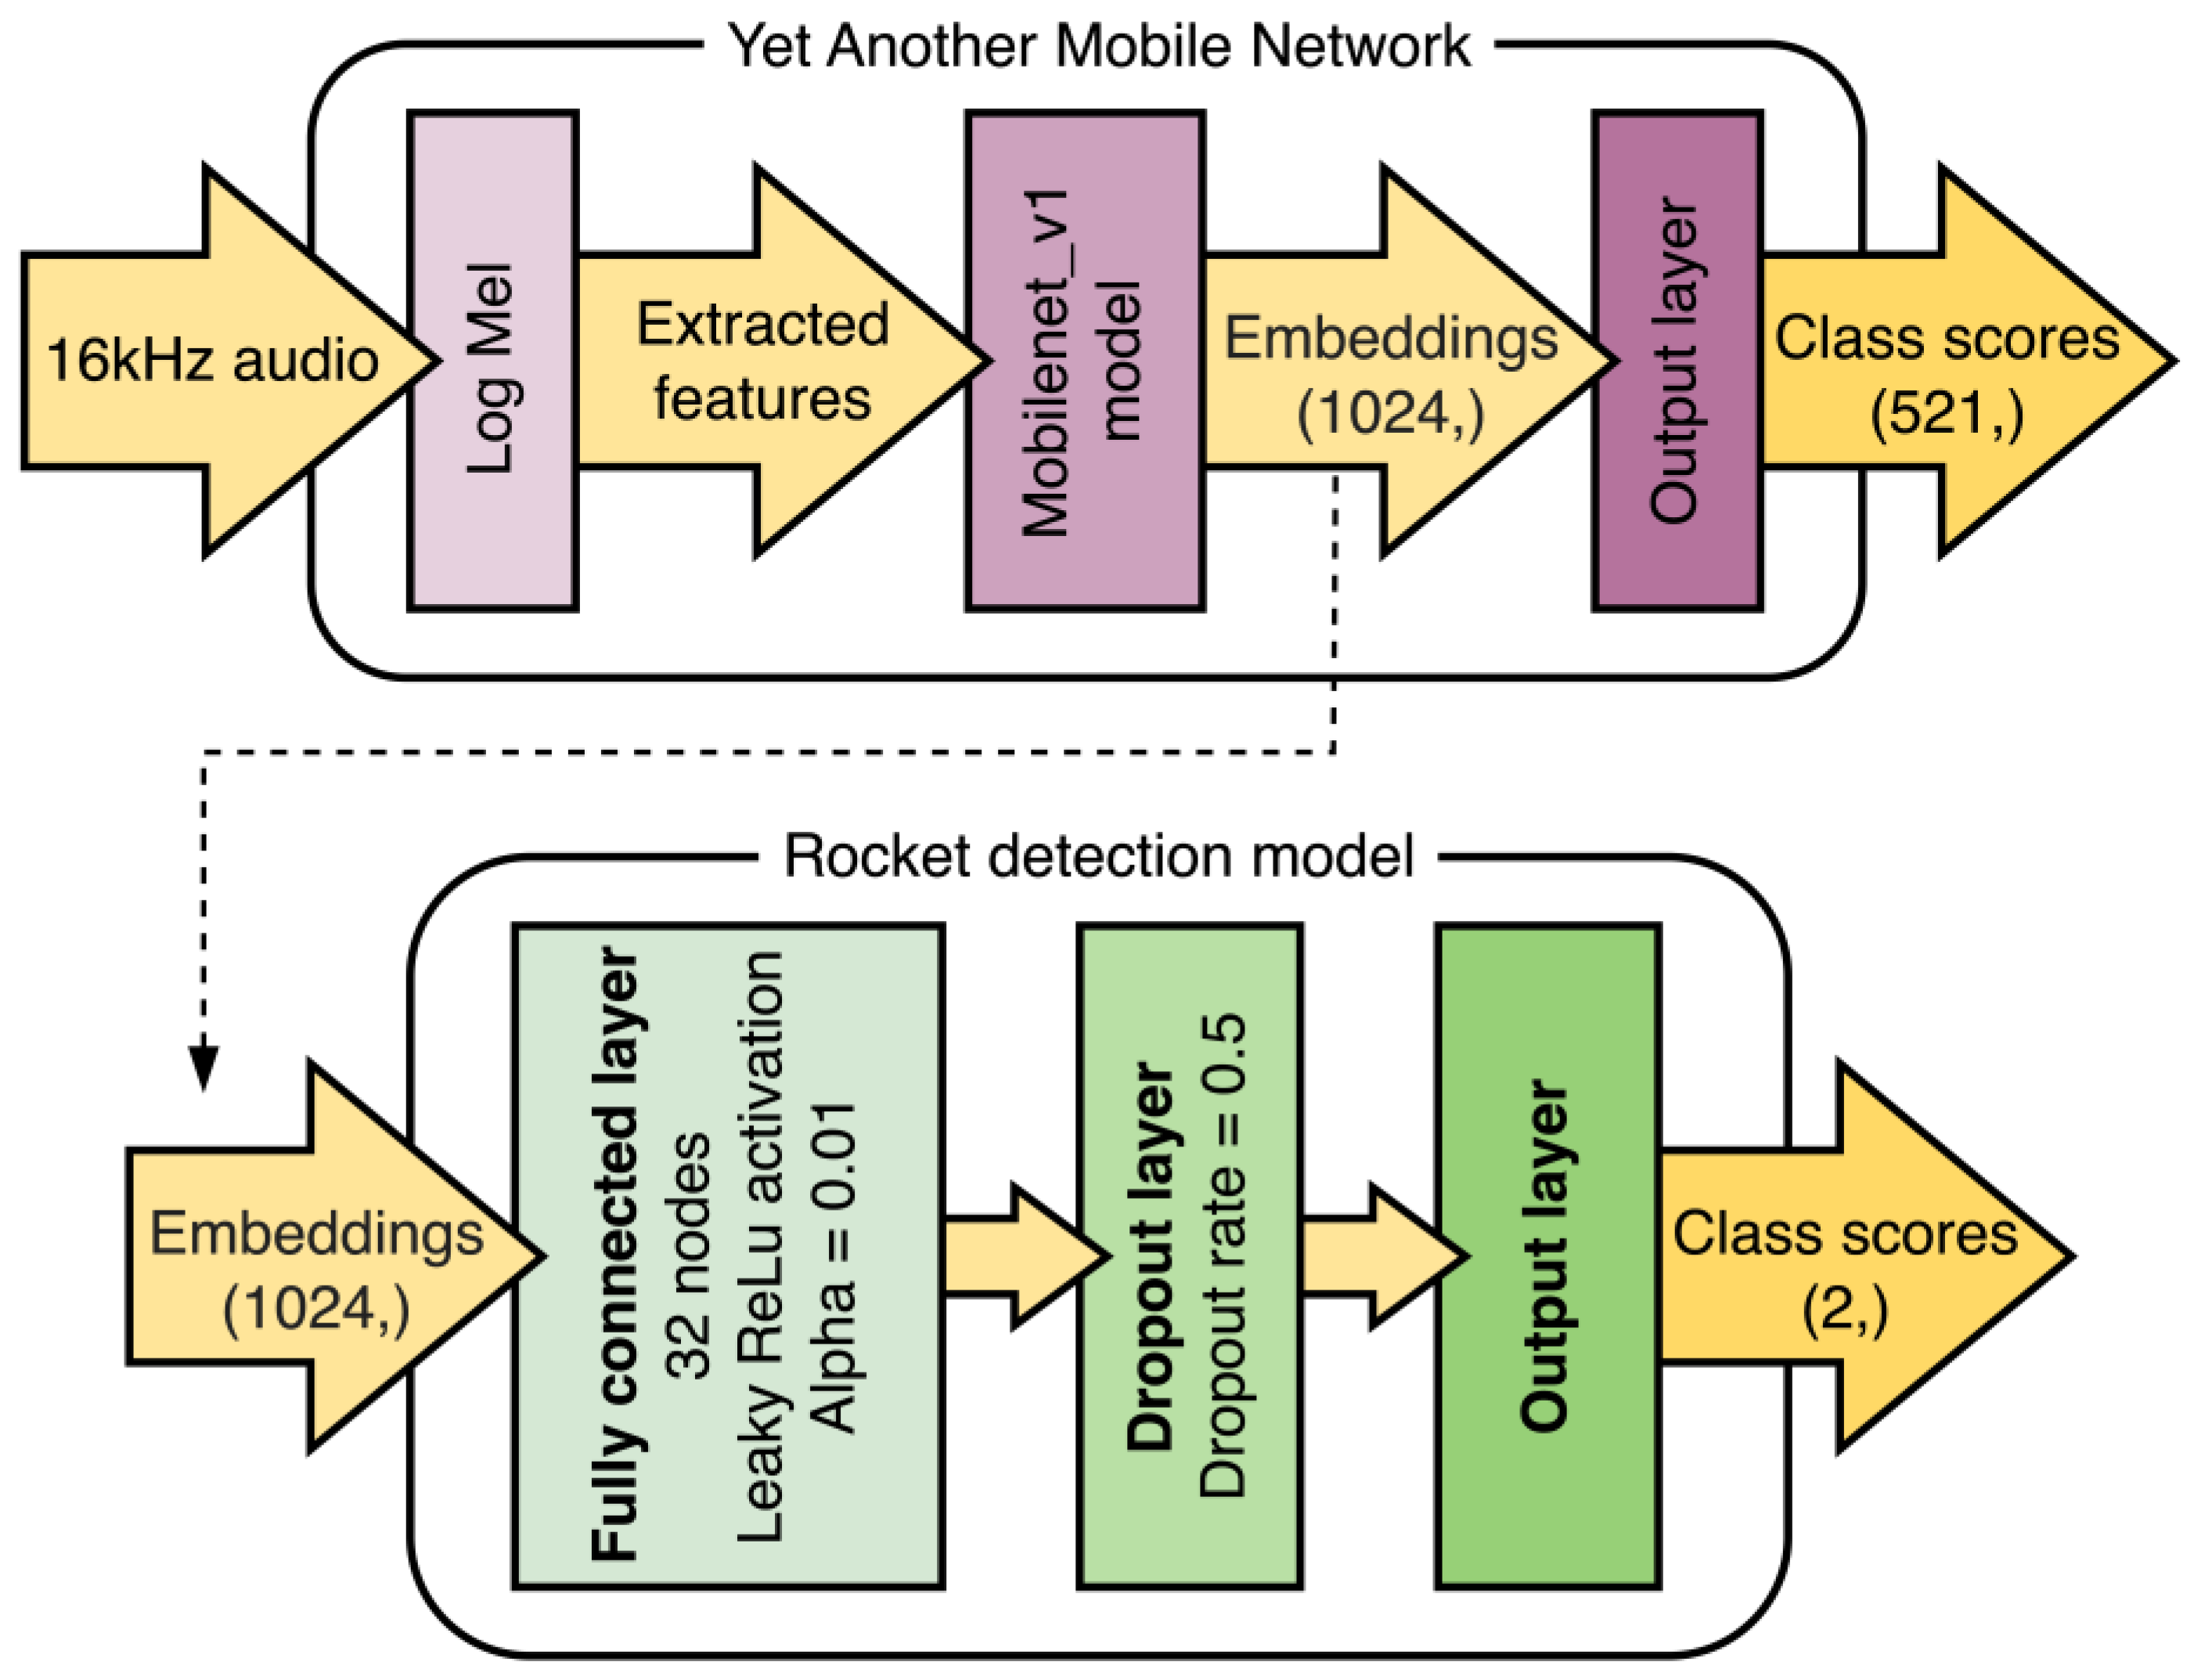
Google’s Yet Another Mobile Network (YAMNet) [11] is a publicly available deep neural network designed to classify audio data using Mobilenet_v1, a depth-wise-separable convolution architecture [12]. YAMNet is pre-trained on AudioSet, a human-annotated collection of more than 2 million 10-second audio clips pulled from YouTube videos [13], to predict 521 classes of audio events. The intended input of this model is audio data sampled at 16 kHz, from which a stabilized log Mel spectrogram with a frequency range of 125–7500 Hz is computed. The spectrogram is then divided with 50% overlap into 0.96-second-long segments, which are then fed into the Mobilenet_v1 architecture. The output of Mobilenet_v1 is averaged-pooled, resulting in 1024 embeddings, which are fed into a final output layer. The output layer calculates scores for the 521 classes, and predictions are made from those scores. For a visual representation of this process, see Figure 3.

2.3. Transfer Learning Model Design

Transfer learning is a machine learning method first developed by Stevo Bozinovski and Ante Fulgosi at the University of Zagreb in 1972 [14,15]. In theory, the technique improves learning efficiency by reusing knowledge gained from one task for a second, related task. The popularity of transfer learning has risen in recent years [16,17,18,19] due in part to the existence of publicly available models pre-trained on very large datasets for general tasks, which can be used to boost performance on a related, specific task if the volume of available training data for the specific task is limited [20].
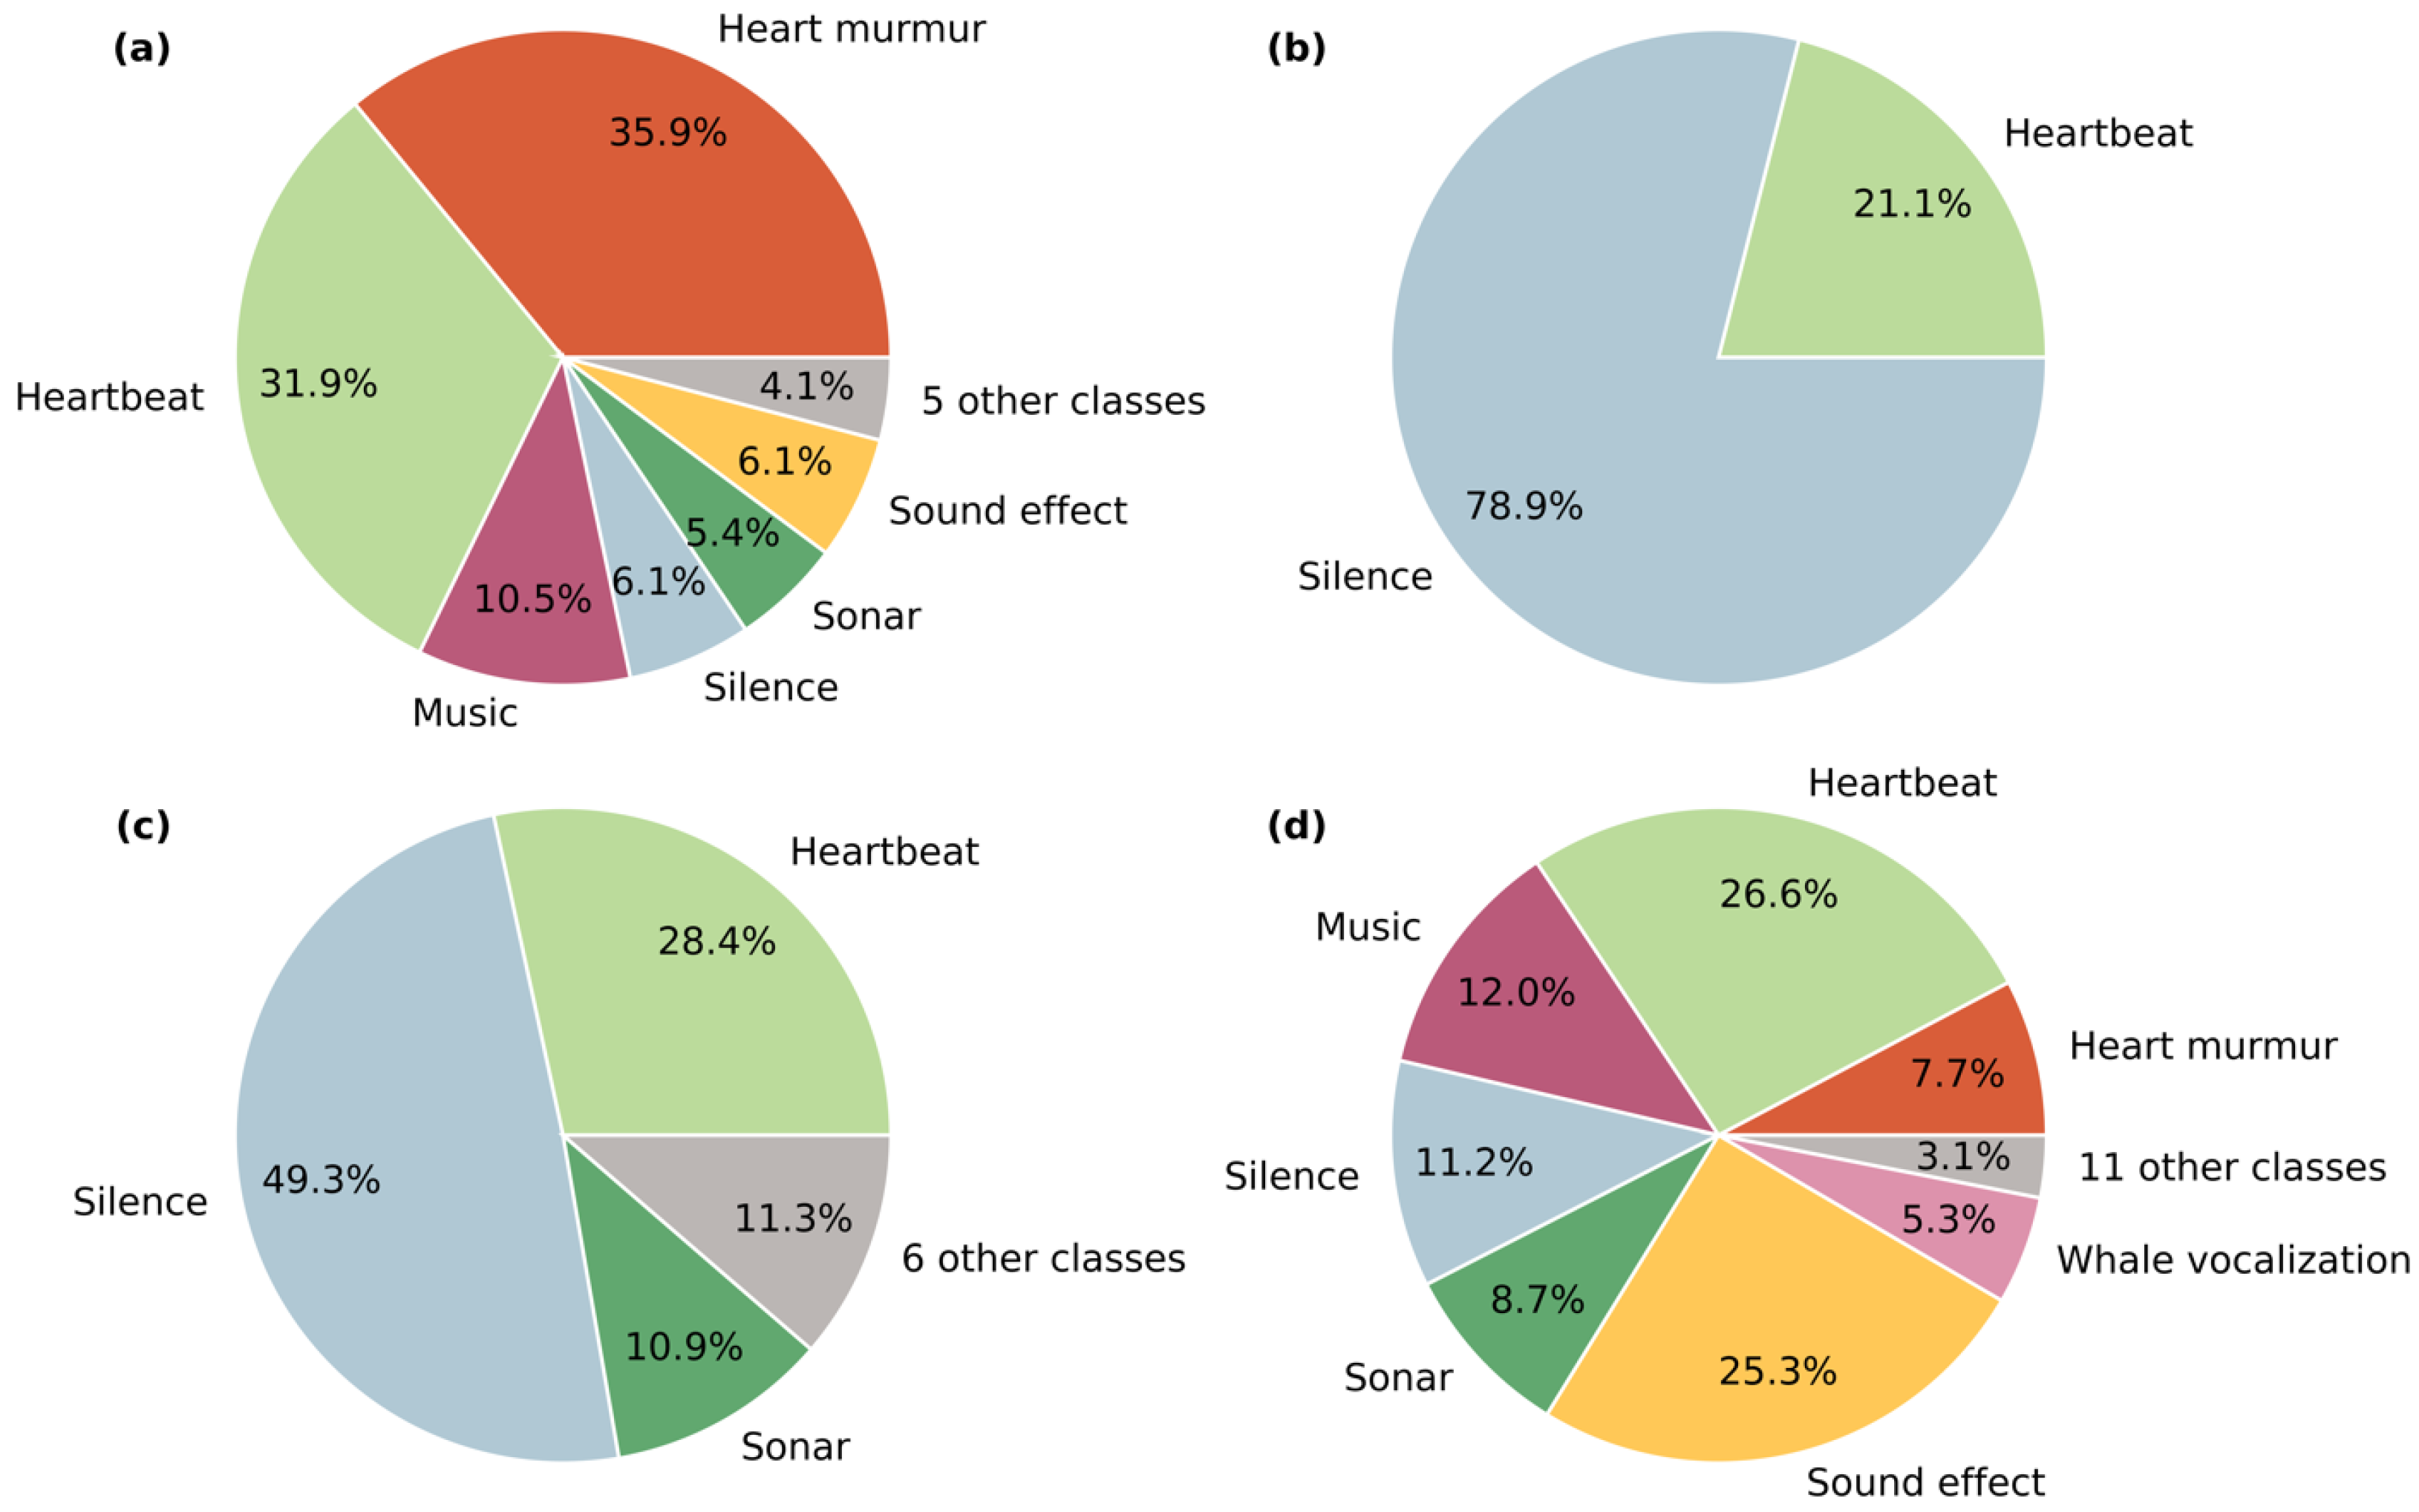
YAMNet is one such publicly available model. YAMNet is trained for the general task of audio classification, rather than the specific case of rocket detection. Before building, training, and testing the transfer learning model, the full dataset was run through YAMNet alone, and the resulting predictions were analyzed. The distributions of the classes predicted by YAMNet for data from ASTRA, SHAReD, and ESC-50 are shown in Figure 4. Due to the data having been upsampled from 800 Hz and thus being devoid of any content above 400 Hz, the highly inaccurate predictions we observe are unsurprising, even for the ESC-50 data, which contain types of sounds similar to those YAMNet was trained to classify. What is interesting, however, is that the distributions of predicted classes vary significantly between subsets of the dataset, indicating that YAMNet is able to see some differences between these subsets despite having no context for data collected at 800 Hz.
Transfer learning was chosen to compensate as much as possible for the limited quantity of rocket audio data. In theory, we can ‘transfer’ some of the knowledge YAMNet has on the general problem of audio classification to our more specific problem of rocket detection. To construct the transfer learning model, the final output layer of YAMNet was removed and replaced with a new rocket detection model. In essence, YAMNet is being used to preprocess the data, condensing it into the embeddings on which the rocket detection model is then trained.
The rocket detection model was constructed using three layers. The first of these layers was a fully connected layer with 32 nodes, utilizing leaky rectified linear unit (leaky ReLU) activation with an alpha value of 0.01. The second was a dropout layer added to minimize overfitting, and the final layer was an output layer with 2 nodes corresponding to the two classes (‘rocket’ and ‘noise’). A visualization of the rocket detection model is shown in Figure 3. Sparse categorical cross-entropy was used for loss, with the Adamax optimizer. The numbers of nodes in the fully connected layer, the activation function, the alpha value, and the optimizer were each selected after analyzing the results of cross-validation, with lower numbers of nodes being given preference to avoid overfitting. The number of epochs was set to 300, with early stopping implemented to further reduce the likelihood of overfitting.

3. Results

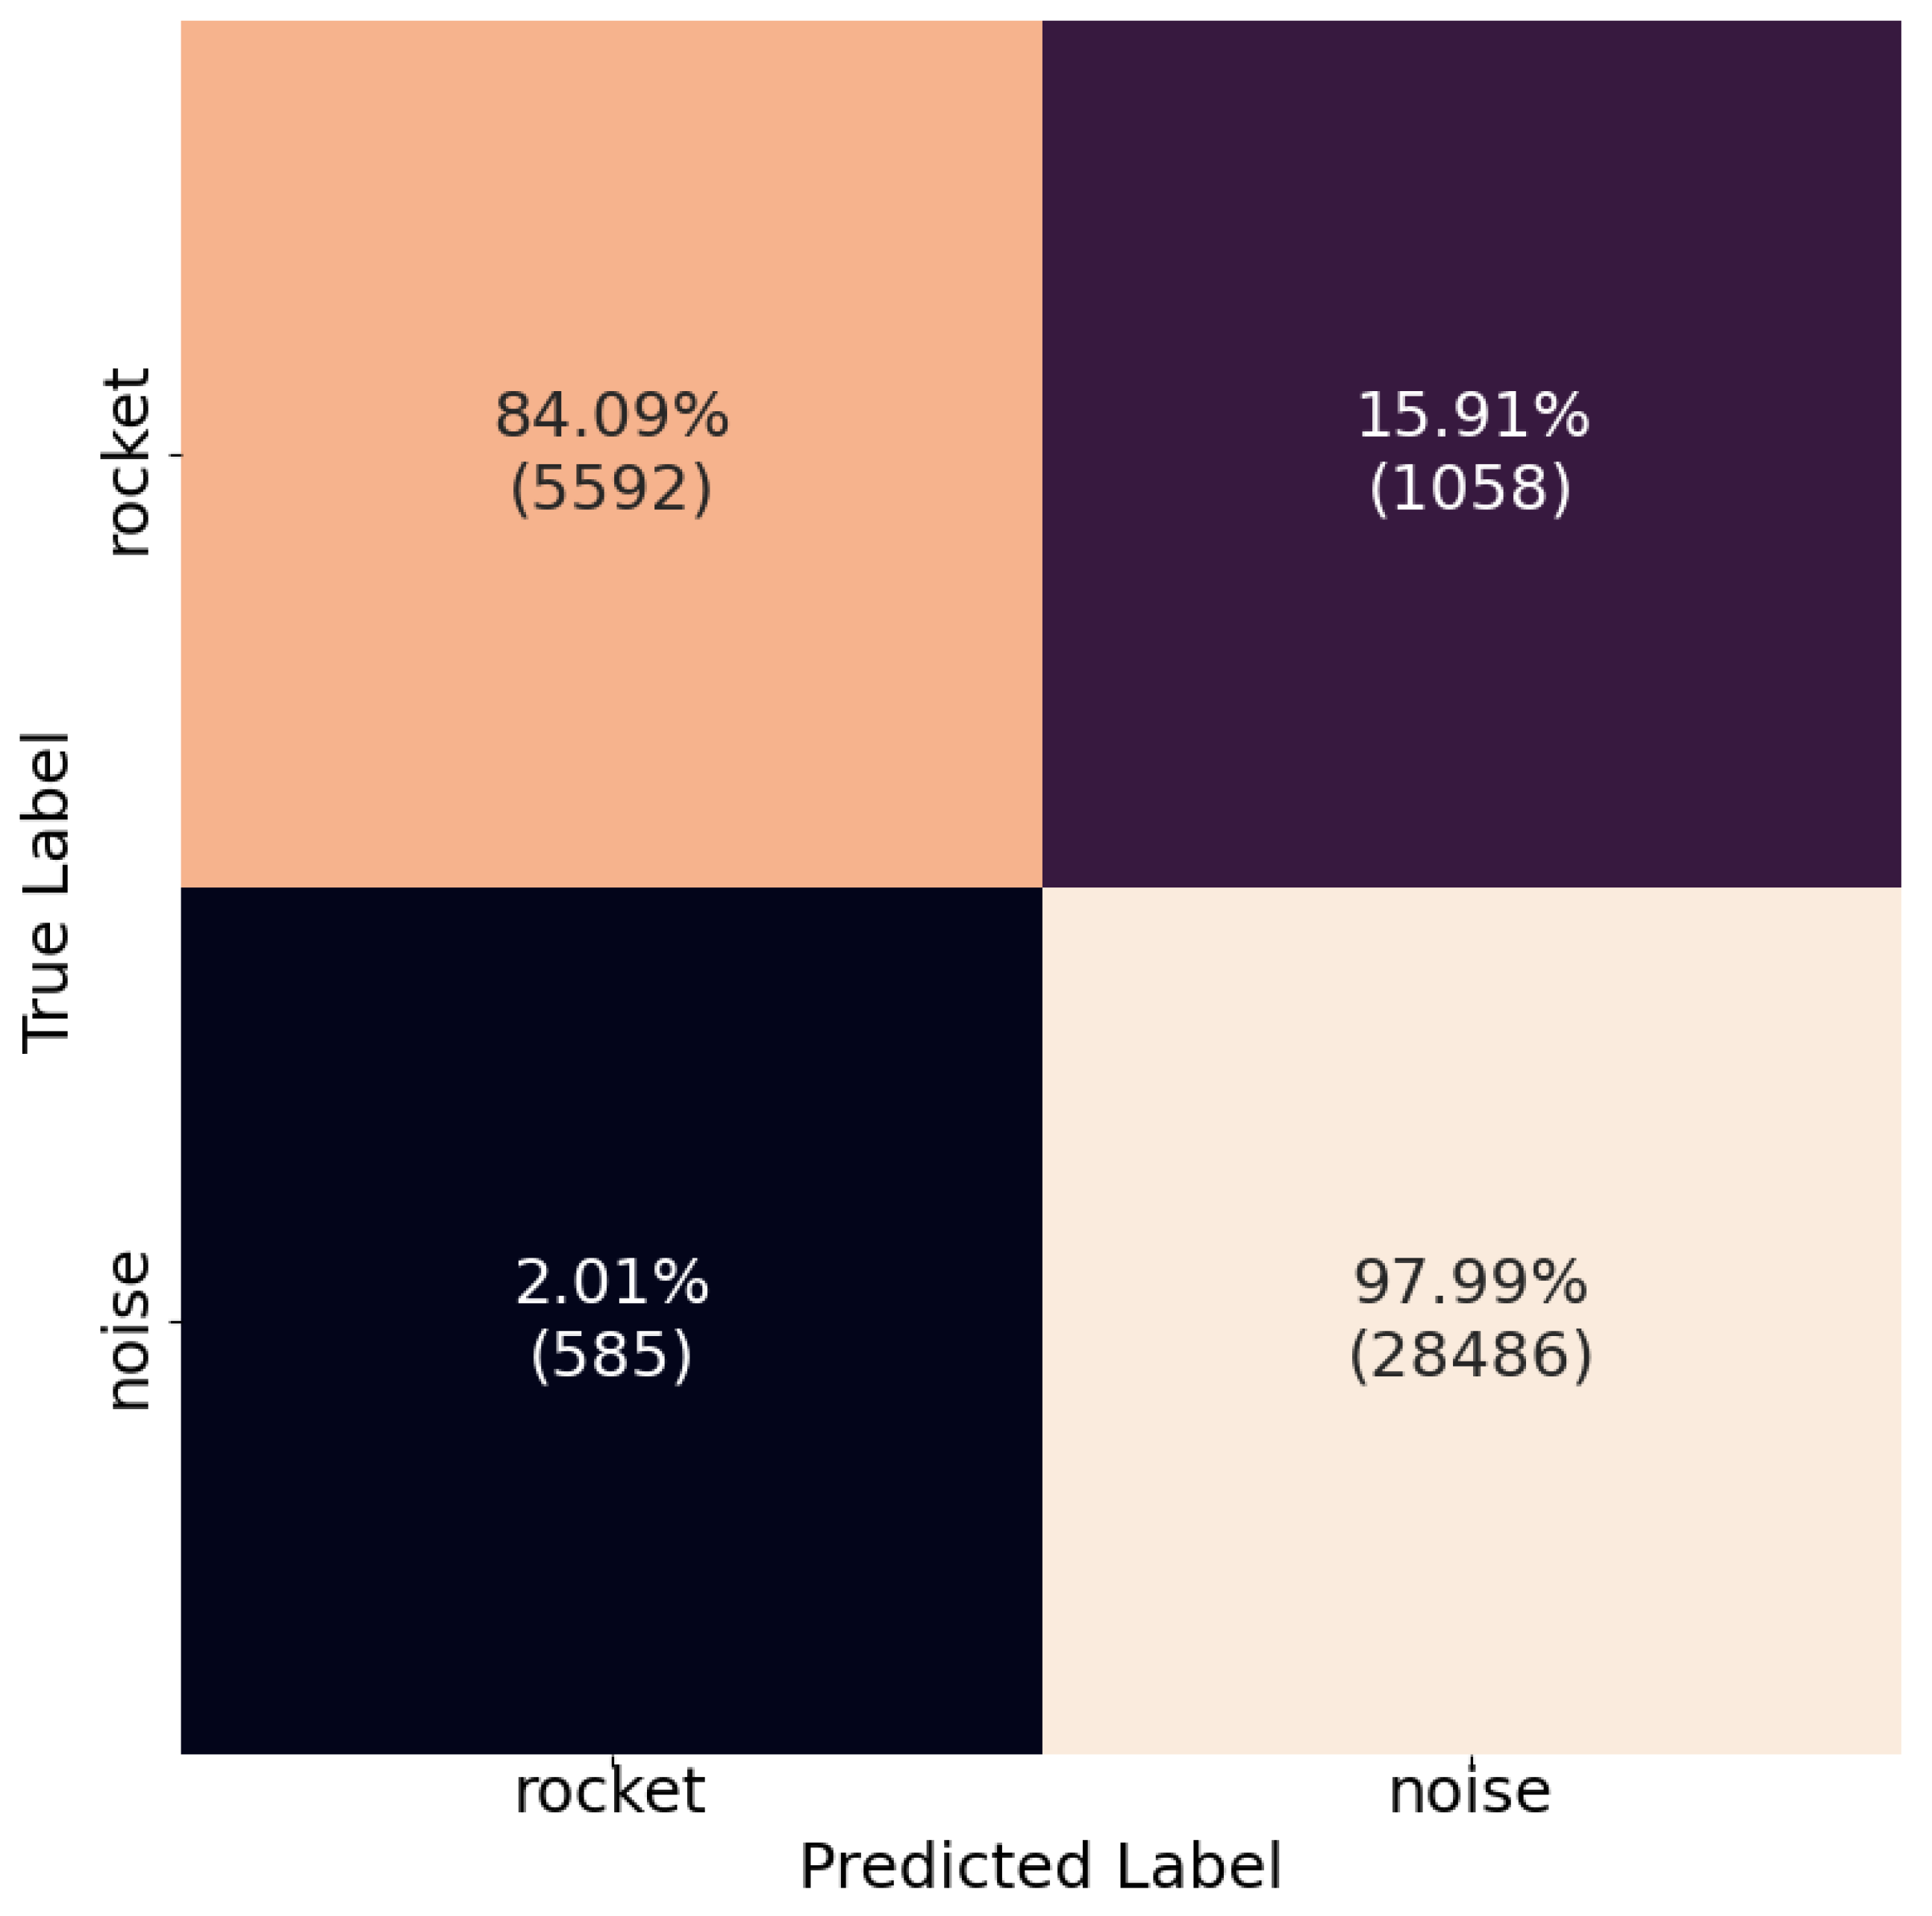
The model was evaluated using the samples assigned to the training set for each run, consisting of roughly 10% of the data from each of the three open-access datasets. As discussed in Section 2.1.4, all testing samples were taken from events (rocket launches, explosions, or Freesound clips) that were not included in the training or validation sets. The overall performance of the model is presented, along with the performance of the best-performing split. In some figures, results are shown using normalized confusion matrices, which show the true positive rate in the upper left corner and the true negative rate in the lower right corner. Since the categories are unbalanced, the confusion matrices are normalized for clarity, but the numbers of true and false predictions of positive and negative samples were preserved and are included in parentheses in the appropriate quadrants of the matrices.

3.1. Overall Performance

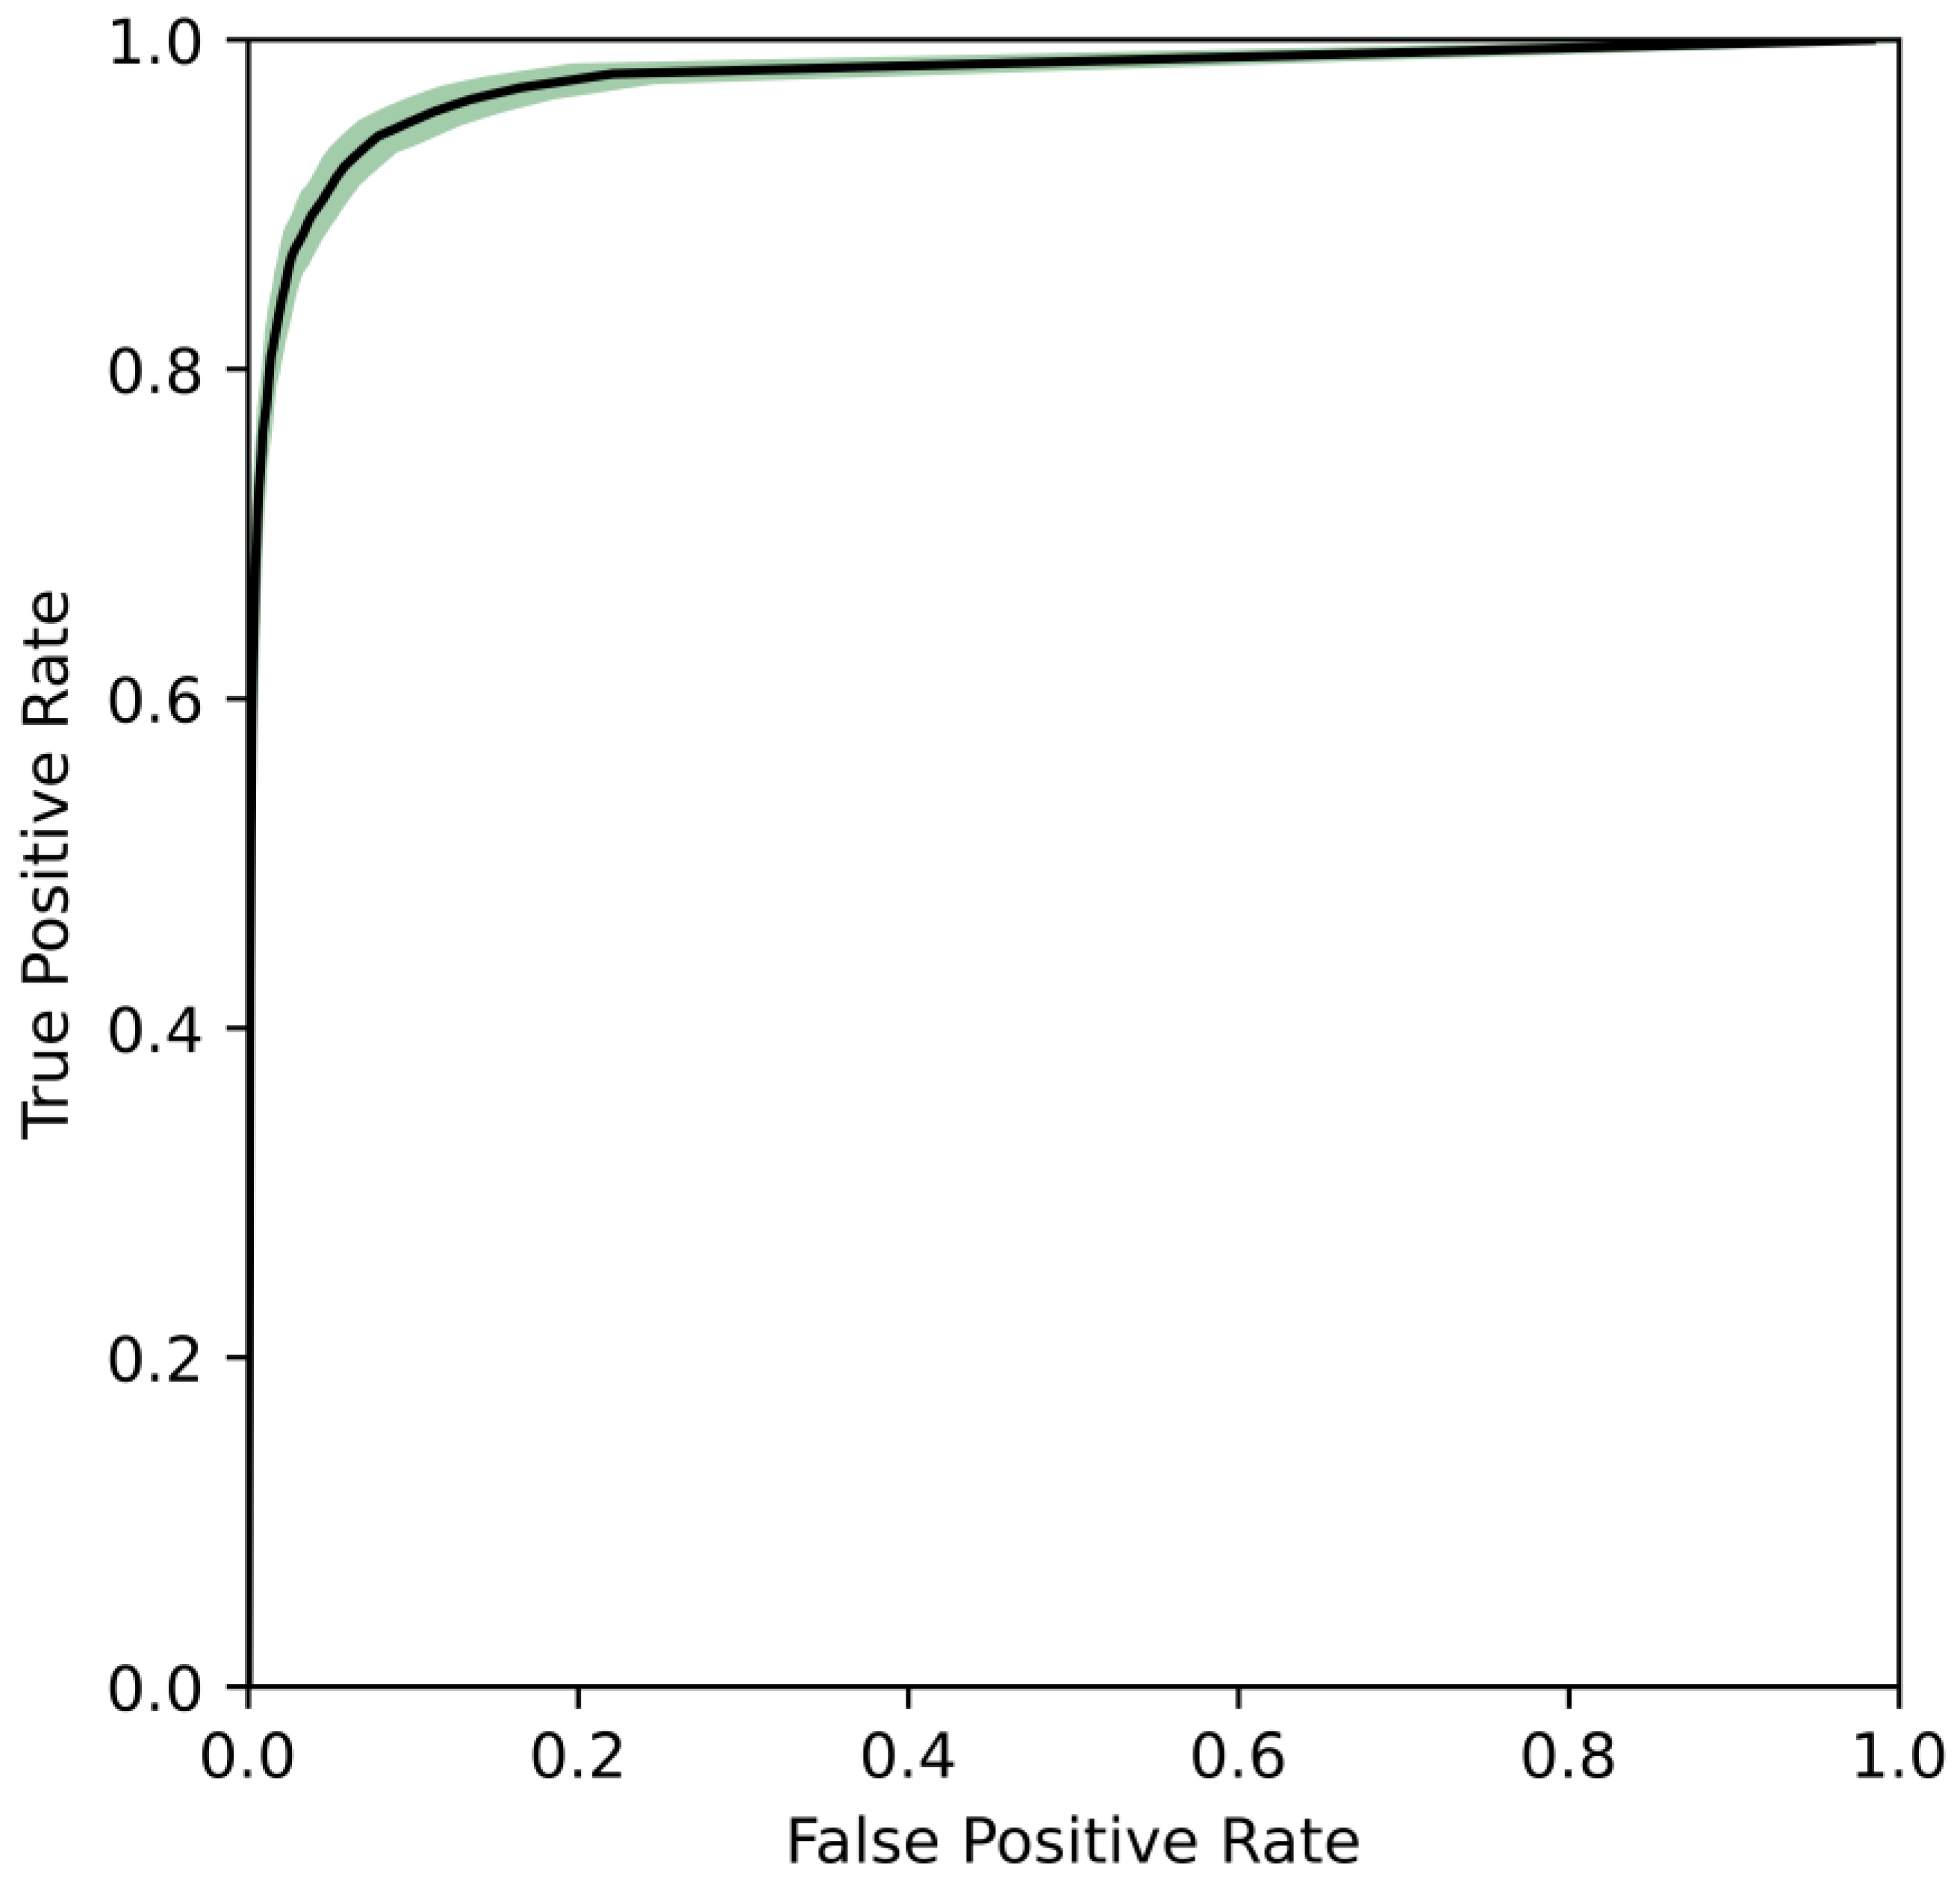
The accuracy of the model ranged between 93.53% and 97.00%, with the mean over all 15 splits lying at 95.40% accuracy. The mean performance of the model at a threshold of 0.5 is shown as a confusion matrix in Figure 5. The behavior of each model at different thresholds was evaluated, and the resulting 15 receiver operating characteristic (ROC) curves were found to have high similarity. The mean ROC curve is shown in Figure 6, along with the 95% confidence band. In Figure 7, a confusion matrix of the best-performing split is shown. When trained on this split, the model showed slightly better performance, but behaved similarly to the other models and showed no indications of overfitting. This model, which we refer to as the best split model, had an overall accuracy of 97.00% and a false positive rate of 0.98%.

3.2. Misclassification Analysis

To better understand the model’s behavior, it is important to remember that five positive samples were taken from each rocket recording, and that there are multiple recordings for most launches. In Table 1, the ASTRA events with false negatives in the best split model are listed, along with the other classifications from the event, which show that for every event with false negatives, there are always more true positives. For every recording in the best split model’s test set, there is at least one ‘rocket’ classification within 10 s of the estimated peak arrival time included in ASTRA. From an application perspective, then, there are no false negatives, only delayed true positives, and we can focus on reducing the false positive rate.
The simplest method of reducing the false positive rate is to increase the threshold for positive ‘rocket’ classifications slightly, from 0.5 to 0.6. With the increased threshold, the best split model’s false positive rate decreases from 0.98% to 0.76%. This improvement in the false positive rate is accompanied by an increase in the false negative rate from 15.59% to 19.66%. However, there is still at least one ‘rocket’ classification within 10 s of the estimated peak arrival time of each recording; thus, the practical effect of the increased false negative rate is minimal. The best split model’s remaining false positives after increasing the threshold are shown in Table 2. Upon examination, it is clear that false positives tend to appear chronologically isolated or in small clusters of five or fewer samples.
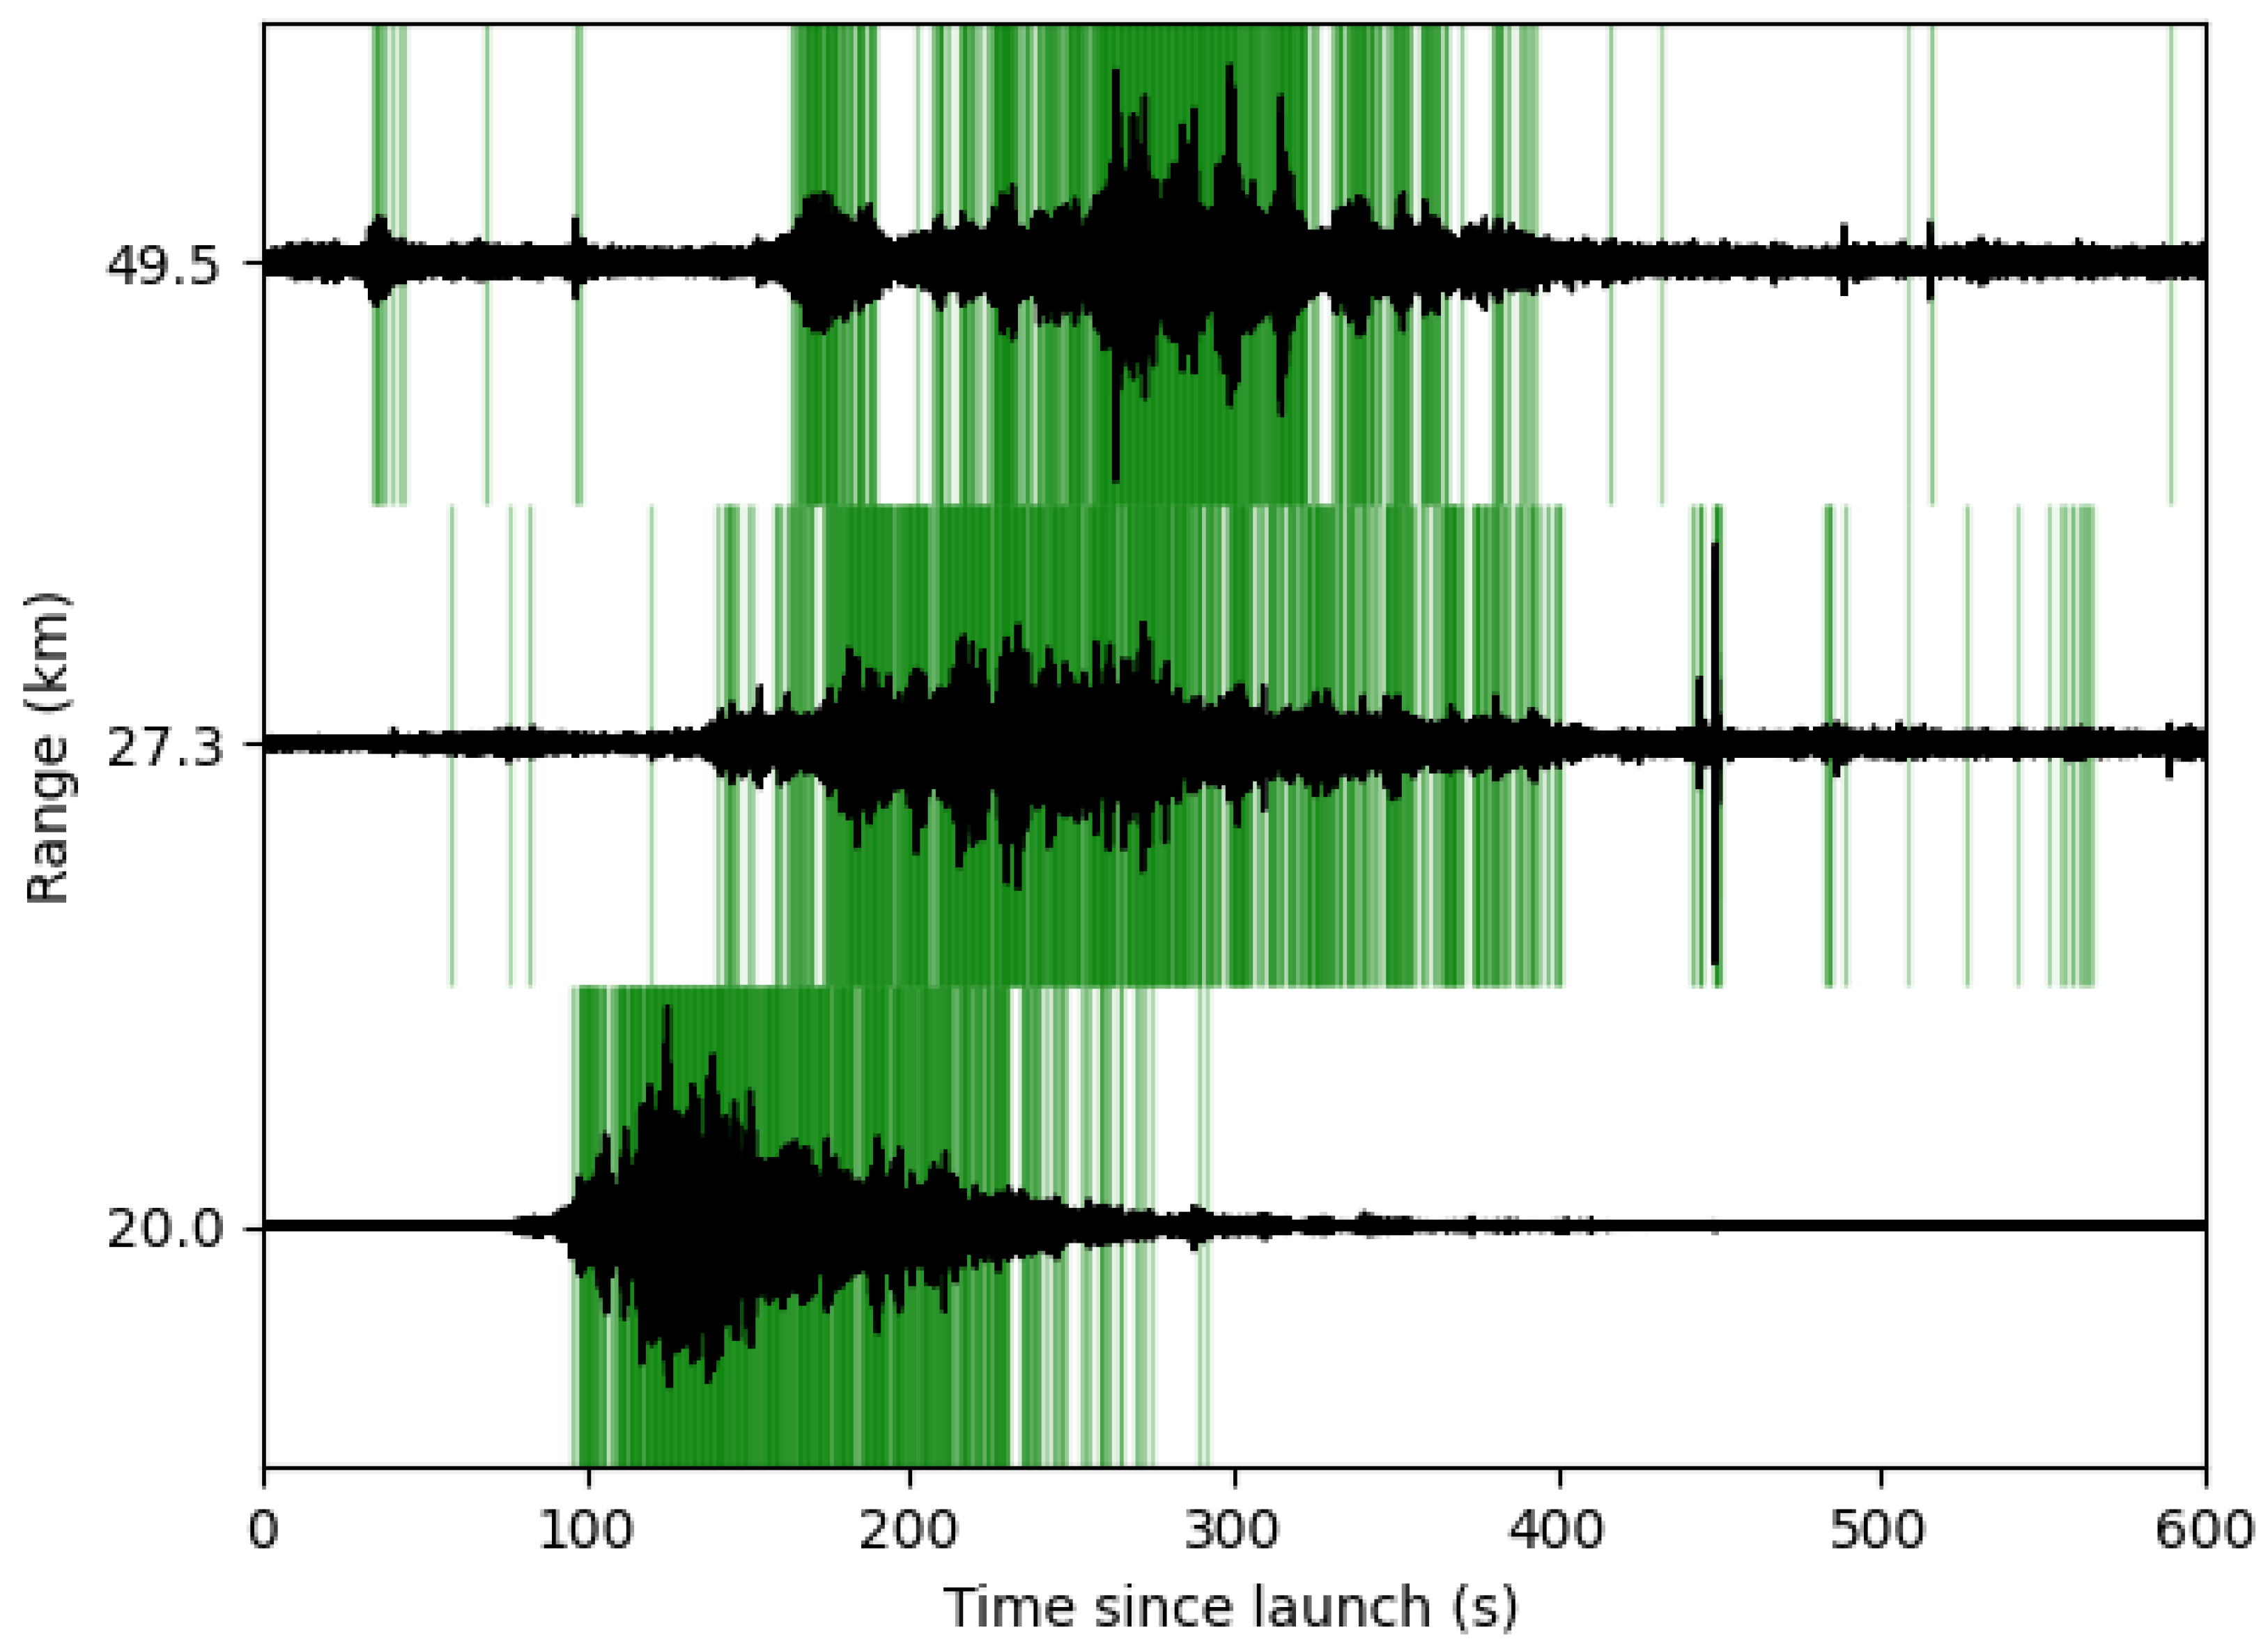
To visualize this behavior, we can plot the ‘rocket’ classifications as vertical green lines with a transparency inversely proportional to the model’s confidence in its classification. In Figure 8, all recordings from one of the launches in the testing set are plotted this way, showing a number of false positives before the arrival of the signal at two of the three stations.

4. Discussion

Mitigation of False Positives

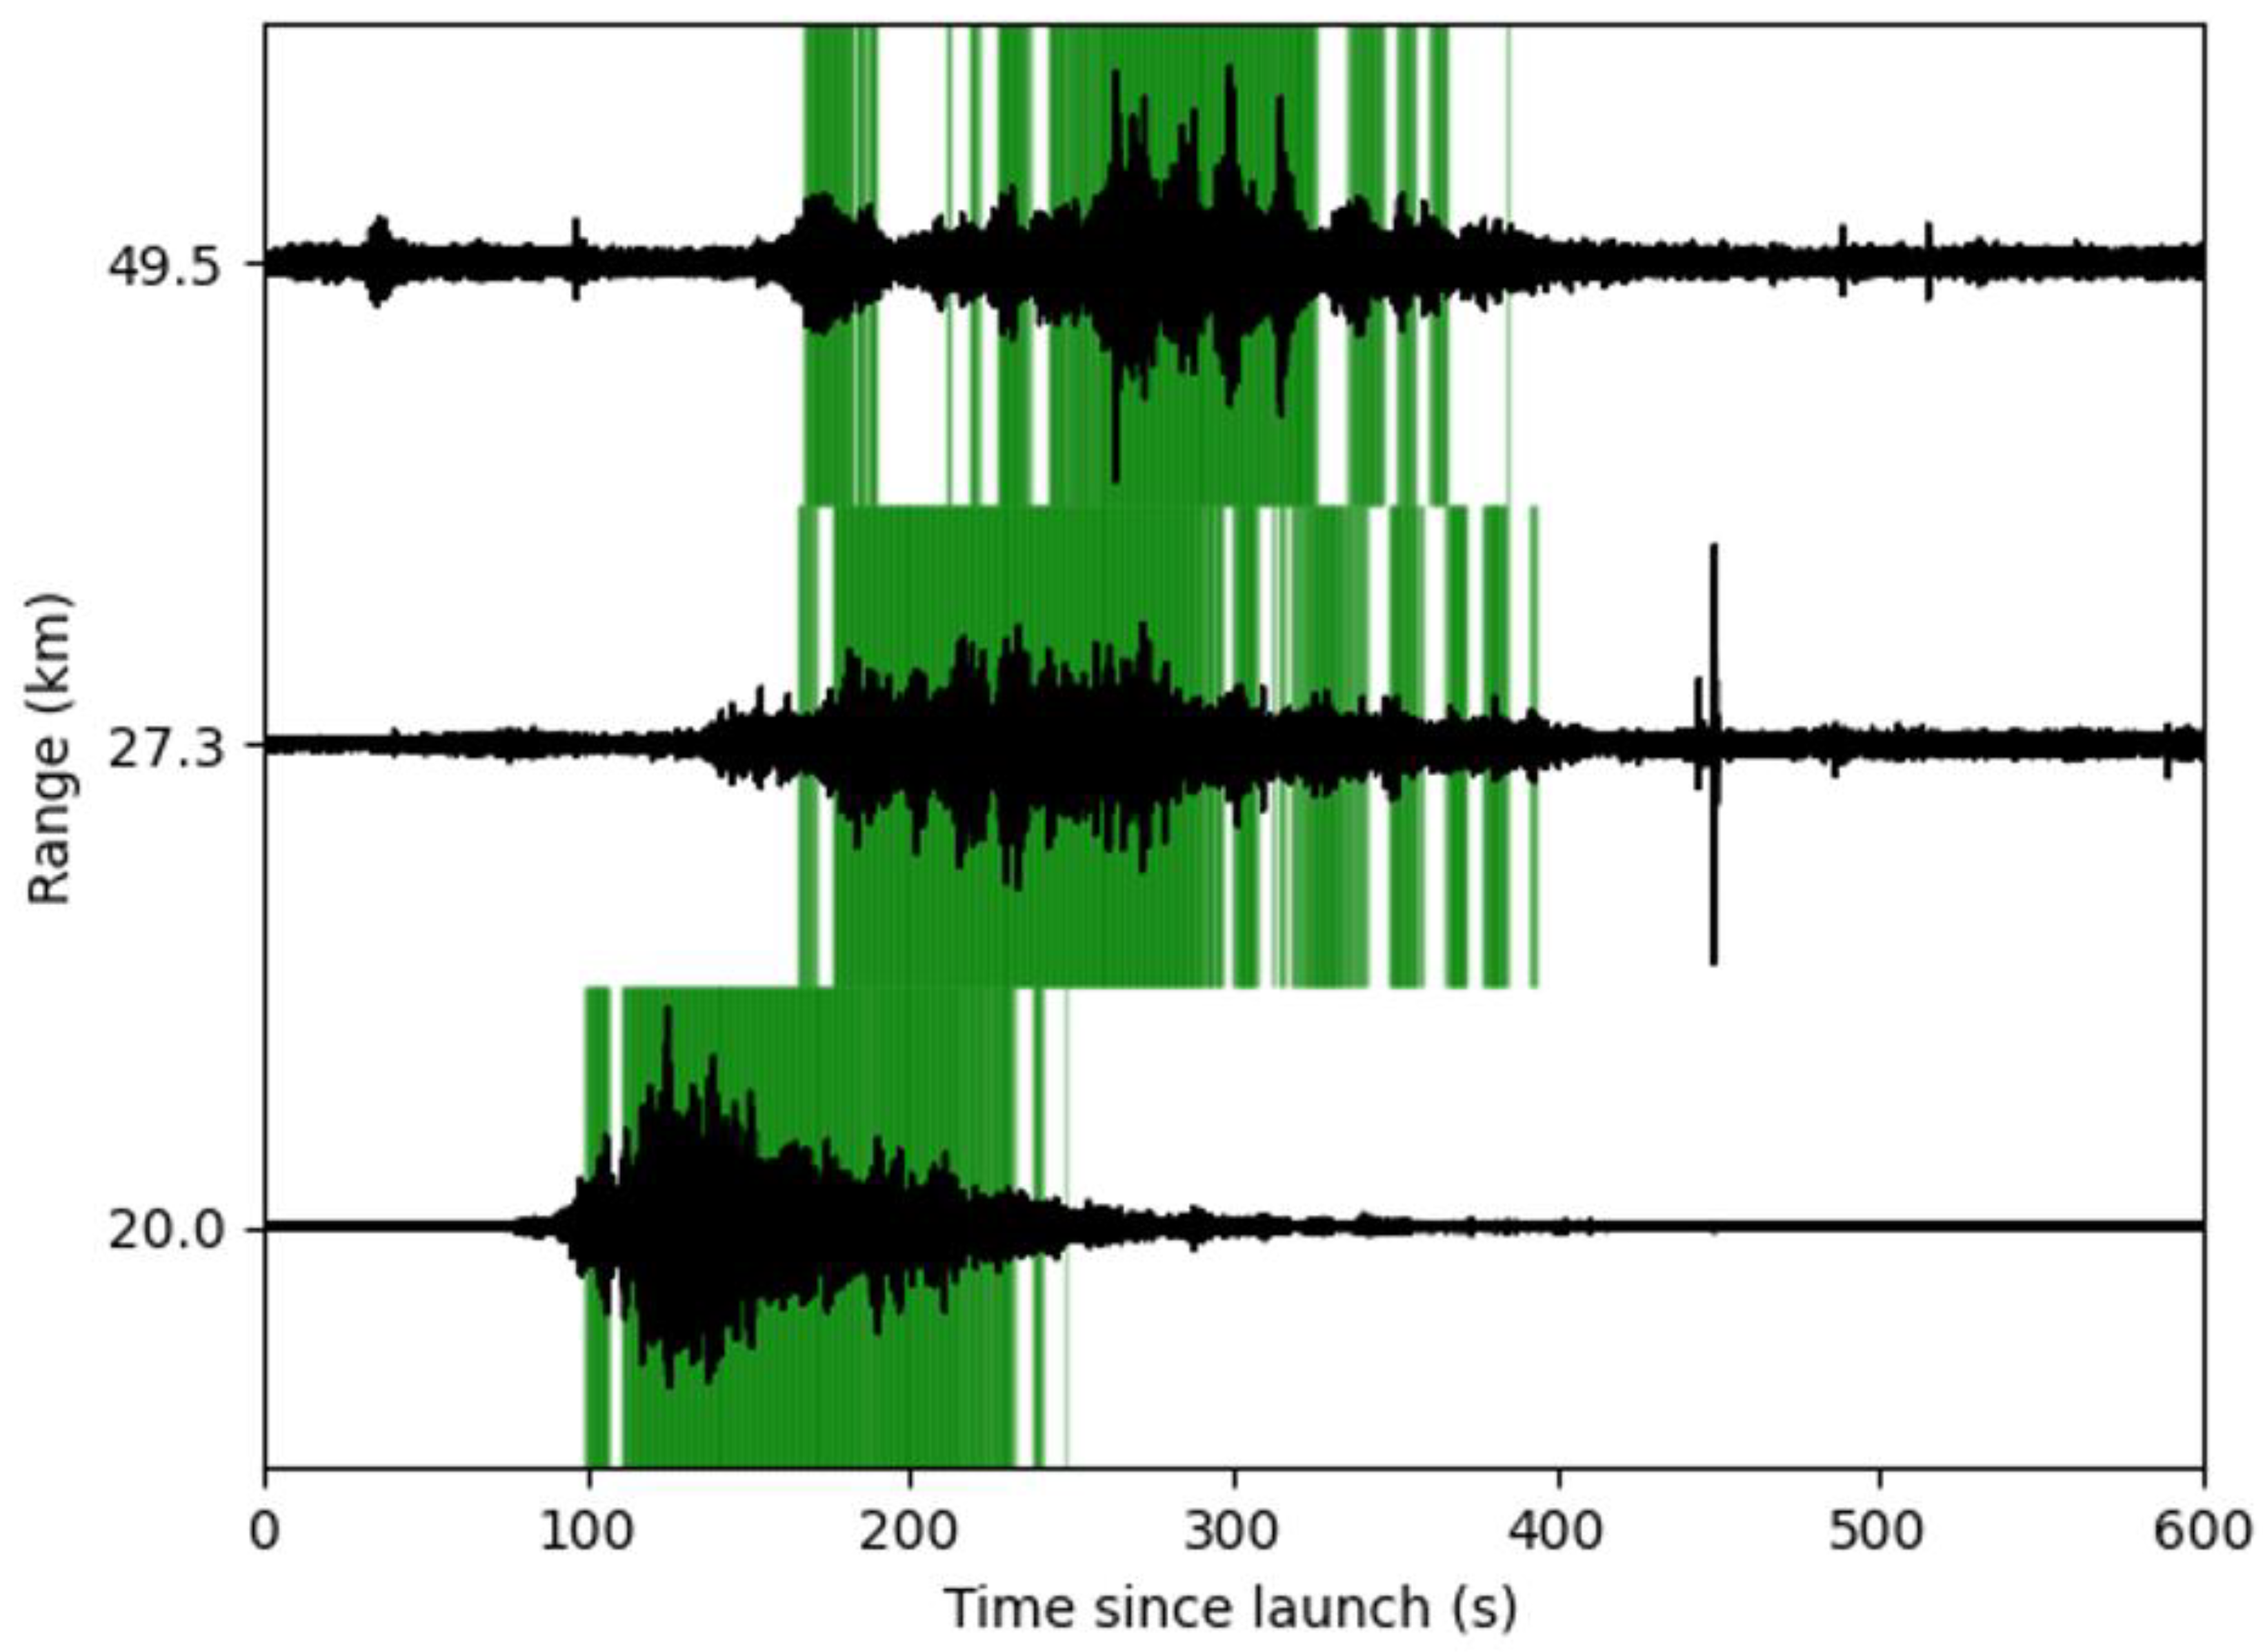
As previously discussed, false positives tend to appear isolated chronologically, in sharp contrast to true positives, which tend to occur consistently throughout the >100-second-long launch signal, with some false negatives interspersed. To reduce the number of chronologically isolated positives, we can set all scores less than the 0.6 threshold to 0 and apply a 4.8-second-long rolling median filter. In Figure 9, the waveforms from Figure 8 are plotted, now with only the ‘rocket’ classifications remaining after applying the median filter. After applying this method to the scores of all pre-launch segments of the ASTRA recordings included in the test set, the best split model’s false positive rate on pre-launch ASTRA data decreased from 0.76% to 0.11%.
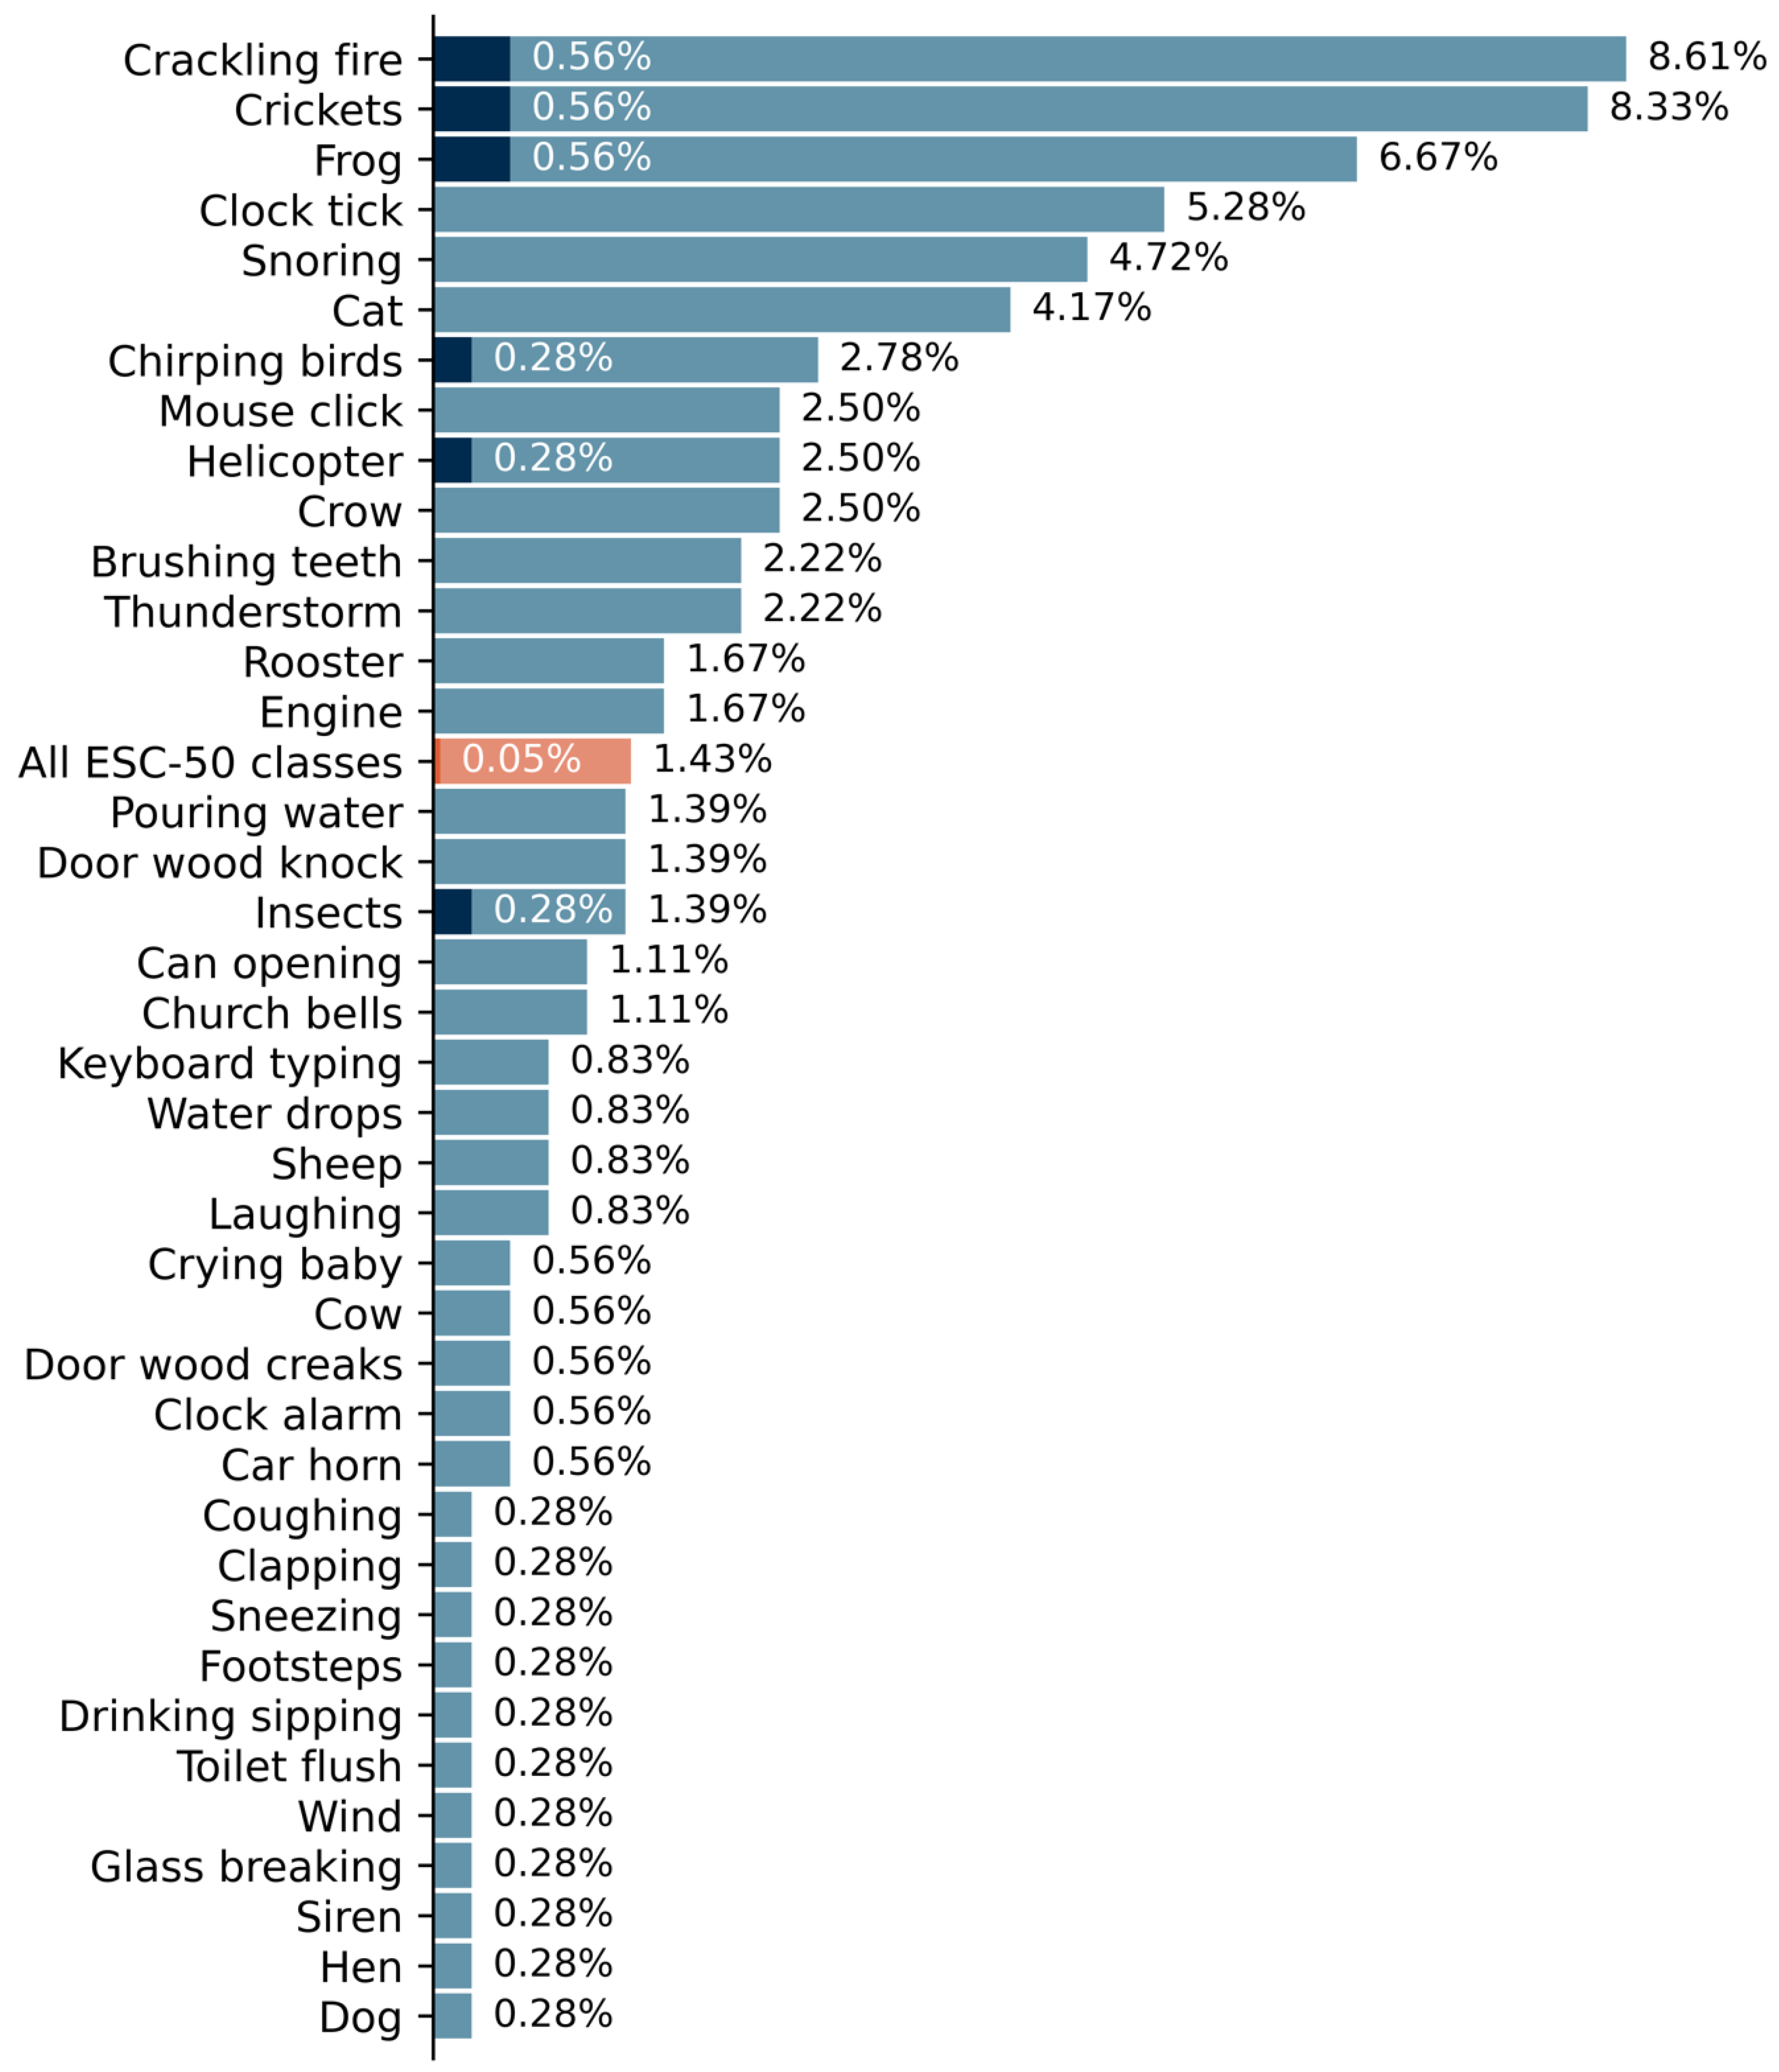
When applied to the ESC-50 data, this method also reduces false positives significantly, decreasing the false positive rate of ESC-50 data from 1.43% to 0.05%. Figure 10 shows the false positive rates before and after thresholding and median filtering for each ESC-50 class containing any samples misclassified by the best split model, as well as the mean false positive rates over all ESC-50 classes. As the recordings from SHAReD were each only 0.96 s long, we were unable to determine the effect of median filtering on those data. However, the model performed exceptionally well on SHAReD data even before adjusting the threshold, with no misclassifications by the best split model and false positive rates < 1% for all 15 models.
This improvement in the false positive rate has minor tradeoffs in two areas. First, the detection time is delayed from the first ‘rocket’ classification over 0.5 by a mean of 4.92 s. Considering the propagation times of ~1–5 min at these ranges, however, this delay is relatively small and would likely be well worth the marked decrease in false positives. Secondly, the false negative rate increased slightly after thresholding and median-filtering the scores. At a threshold of 0.5 and without median filtering, all 100 rocket launch signatures in the test set had at >1 positive classification within 10 s of the estimated peak arrival time. After increasing the threshold to 0.6 and applying the rolling median filter, this decreased slightly, with 1 of the 100 now having no ‘rocket’ classifications. As there were other stations recording during the launch in question, however, all of which had true positive ‘rocket’ classifications, the effect of this increase in the false positive rate is mitigated in practice by the density of the network, as discussed in Section 2.1.4.

5. Conclusions

After training and testing on 15 random train–test splits, we found that the transfer learning model’s behavior is exceptionally stable, with only slight variations in the results between different splits. Analyzing the behavior of the best split model in detail, it was discovered that despite the nominal false negative rate of 15.59%, the model made at least one ‘rocket’ classification within 10 s of the estimated arrival times of all 100 recordings in the training set. In addition, the already low false positive rate of 0.98% can be reduced even further by increasing the positive classification threshold from 0.5 to 0.6 and applying a 4.8-second-long median filter. The application of these two measures resulted in the best split model’s false positive rates on ESC-50 data decreasing from 1.43% to 0.05%, pre-launch ‘noise’ data from ASTRA decreasing from 0.76% to 0.11%, and the overall false positive rate decreasing from 0.98% to 0.072%. The increased threshold and addition of the median filter combined were found to increase the time between launch and detection by 4.92 s on average, but this delay is relatively short compared to the estimated propagation times (~60–200 s) and its negative effects would likely be outweighed by the benefits of the decreased false positive rate in most use cases. Applying the median filter also reduced the true positive rate slightly, resulting in the model failing to detect the launch within 10 s of the estimated peak arrival time of 1 of the 100 recordings in the dataset. The recording in question, however, was one of four recordings of the same launch, and the model was able to detect the launch successfully in the other three recordings. Thus, in practice, this increase in the false negative rate could be mitigated by ensuring that the network is sufficiently dense.
Although the initial success of this transfer learning model is encouraging, the dataset is too small to truly determine its usefulness for persistent monitoring. As more and more rockets continue to be launched every year, the amount of available data will likely increase rapidly in the next few years. When more data are available, retraining the model with recordings from a wider variety of rocket types and spaceports will likely improve both accuracy and robustness. Future work should include long-term deployment and testing of the model to fully evaluate its potential for monitoring, especially in different geographical zones and with a variety of smartphone makes and models. If further decreases in the false positive rate are required in the future, there are a number of different avenues to pursue, including training against additional sources of infrasound such as earthquakes or volcanic activity, incorporating ensemble learning, and combining input from multiple smartphones, which may also prove useful for trajectory modeling in the future. In addition, the use of YAMNet, which removes all information below 125 Hz frequency, may decrease accuracy, especially in environments with particularly high levels of noise in the 125–400 Hz range. If an audio classification model similar in size to YAMNet, which does consider lower-frequency content, becomes available in the future, it may be more effective to replace YAMNet with said model when constructing a transfer learning model for acoustic rocket detection.

Author Contributions

Conceptualization, S.K.P. and M.A.G.; Data curation, S.K.P.; Formal analysis, S.K.P.; Funding acquisition, M.A.G.; Investigation, S.K.P.; Methodology, S.K.P. and S.K.T.; Project administration, M.A.G.; Resources, M.A.G.; Software, S.K.P. and S.K.T.; Supervision, M.A.G.; Validation, S.K.P.; Visualization, S.K.P. and S.K.T.; Writing—original draft, S.K.P.; Writing—review and editing, S.K.P. and M.A.G. All authors have read and agreed to the published version of the manuscript.

Funding

This research was funded by the Department of Energy National Nuclear Security Administration under Awards Nos. DE-NA000390 (MTV) and DE-NA0003921 (ETI).

Data Availability Statement

ASTRA is available as a pandas DataFrame [21] and can be found in the Harvard Dataverse open access repository under the following Digital Object Identifier doi: 10.7910/DVN/ZKIS2K. The ERA5 temperature and wind data used in this study are available through the Copernicus Climate Change Service [22,23]. SHAReD can also be found and downloaded from the Harvard Dataverse, under the Digital Object Identifier doi: 10.7910/DVN/YOCYO2. The ESC-50 dataset is available online at https://github.com/karolpiczak/ESC-50, accessed on 13 October 2023.

Acknowledgments

The authors are grateful for the support of the U.S. Department of Energy, National Nuclear Security Administration, Office of Defense Nuclear Nonproliferation, Research and Development. They would also like to thank Garrett Apuzen-Ito, Helen Janiszewski, Sloan Coats, and Brian Powell for their comments and suggestions on this manuscript and work, as well as all those who supplied feedback on this project at MTV and ETI conferences. This work was performed under the auspices of the U.S. Department of Energy by Lawrence Livermore National Laboratory under Contract DE-AC52-07NA27344.

Conflicts of Interest

The authors declare no conflicts of interest.

Abbreviations

The following abbreviations are used in this manuscript:
IMSInternational Monitoring System
ASTRAAggregated Smartphone Timeseries of Rocket-generated Acoustics
SHAReDSmartphone High-explosive Audio Recordings Dataset
YAMNetYet Another Mobile Network
ReLUReticulated Linear Unit
MTVConsortium for Monitoring, Technology, and Verification
ETIConsortium for Enabling Technologies and Innovation

References

  1. Schwardt, M.; Pilger, C.; Gaebler, P.; Hupe, P.; Ceranna, L. Natural and Anthropogenic Sources of Seismic, Hydroacoustic, and Infrasonic Waves: Waveforms and Spectral Characteristics (and Their Applicability for Sensor Calibration). Surv. Geophys. 2022, 43, 1265–1361. [Google Scholar] [CrossRef] [PubMed]
  2. Hupe, P.; Ceranna, L.; Le Pichon, A.; Matoza, R.S.; Mialle, P. International Monitoring System Infrasound Data Products for Atmospheric Studies and Civilian Applications. Earth Syst. Sci. Data 2022, 14, 4201–4230. [Google Scholar] [CrossRef]
  3. Pilger, C.; Hupe, P.; Gaebler, P.; Ceranna, L. 1001 Rocket Launches for Space Missions and Their Infrasonic Signature. Geophys Res. Lett. 2021, 48, e2020GL092262. [Google Scholar] [CrossRef]
  4. Takazawa, S.K.; Popenhagen, S.K.; Ocampo Giraldo, L.A.; Cárdenas, E.S.; Hix, J.D.; Thompson, S.J.; Chichester, D.L.; Garcés, M.A. A Comparison of Smartphone and Infrasound Microphone Data from a Fuel Air Explosive and a High Explosive. J. Acoust. Soc. Am. 2024, 156, 1509–1523. [Google Scholar] [CrossRef] [PubMed]
  5. Thandu, S.C.; Chellappan, S.; Yin, Z. Ranging Explosion Events Using Smartphones. In Proceedings of the 2015 IEEE 11th International Conference on Wireless and Mobile Computing, Networking and Communications (WiMob), Abu Dhabi, United Arab Emirates, 19–21 October 2015; IEEE: New York, NY, USA, 2015; pp. 492–499. [Google Scholar]
  6. Thandu, S.C.; Bharti, P.; Chellappan, S.; Yin, Z. Leveraging Multi-Modal Smartphone Sensors for Ranging and Estimating the Intensity of Explosion Events. Pervasive Mob. Comput. 2017, 40, 185–204. [Google Scholar] [CrossRef]
  7. Popenhagen, S.K. Aggregated Smartphone Timeseries of Rocket-Generated Acoustics (ASTRA). Available online: https://doi.org/10.7910/DVN/ZKIS2K (accessed on 21 November 2024).
  8. Popenhagen, S.K.; Garcés, M.A. Acoustic Rocket Signatures Collected by Smartphones. Signals 2025, 6, 5. [Google Scholar] [CrossRef]
  9. Takazawa, S.K. Smartphone High-Explosive Audio Recordings Dataset (SHAReD). hosted on Harvard Dataverse. Available online: https://doi.org/10.7910/DVN/ROWODP (accessed on 28 January 2025).
  10. Piczak, K.J. ESC: Dataset for Environmental Sound Classification. In Proceedings of the 23rd ACM International Conference on Multimedia; Association for Computing Machinery, Brisbane, Australia, 26–30 October 2015; pp. 1015–1018. [Google Scholar]
  11. Plakal, M.; Ellis, D. YAMNet 2029. Available online: https://github.com/tensorflow/models/tree/master/research/audioset/yamnet (accessed on 13 October 2023).
  12. Howard, A.G.; Zhu, M.; Chen, B.; Kalenichenko, D.; Wang, W.; Weyand, T.; Andreetto, M.; Adam, H. MobileNets: Efficient Convolutional Neural Networks for Mobile Vision Applications. arXiv 2017, arXiv:1704.04861. [Google Scholar]
  13. Gemmeke, J.F.; Ellis, D.P.W.; Freedman, D.; Jansen, A.; Lawrence, W.; Moore, R.C.; Plakal, M.; Ritter, M. Audio Set: An Ontology and Human-Labeled Dataset for Audio Events. In Proceedings of the 2017 IEEE International Conference on Acoustics, Speech and Signal Processing (ICASSP), New Orleans, LA, USA, 05–09 March 2017; IEEE: New York, NY, USA, 2017; pp. 776–780. [Google Scholar]
  14. Bozinovski, S. Reminder of the First Paper on Transfer Learning in Neural Networks, 1976. Informatica 2020, 44, 291–302. [Google Scholar] [CrossRef]
  15. Bozinovski, S.; Fulgosi, A. The influence of pattern similarity and transfer of learning upon training of a base perceptron B2. In Proceedings of Symposium Informatica 3-121-5, Bled, Slovenia, 7–10 June 1976. [Google Scholar]
  16. Brusa, E.; Delprete, C.; Di Maggio, L.G. Deep Transfer Learning for Machine Diagnosis: From Sound and Music Recognition to Bearing Fault Detection. Appl. Sci. 2021, 11, 11663. [Google Scholar] [CrossRef]
  17. Tsalera, E.; Papadakis, A.; Samarakou, M. Comparison of Pre-Trained CNNs for Audio Classification Using Transfer Learning. J. Sens. Actuator Netw. 2021, 10, 72. [Google Scholar] [CrossRef]
  18. Ashurov, A.; Zhou, Y.; Shi, L.; Zhao, Y.; Liu, H. Environmental Sound Classification Based on Transfer-Learning Techniques with Multiple Optimizers. Electronics 2022, 11, 2279. [Google Scholar] [CrossRef]
  19. Hyun, S.H. Sound-Event Detection of Water-Usage Activities Using Transfer Learning. Sensors 2023, 24, 22. [Google Scholar] [CrossRef] [PubMed]
  20. Pan, S.J.; Yang, Q. A Survey on Transfer Learning. IEEE Trans. Knowl. Data Eng. 2010, 22, 1345–1359. [Google Scholar] [CrossRef]
  21. The Pandas Development Team Pandas-Dev/Pandas: Pandas. Available online: https://doi.org/10.5281/zenodo.3509134 (accessed on 21 November 2024).
  22. Hersbach, H.; Bell, B.; Berrisford, P.; Biavati, G.; Horányi, A.; Muñoz Sabater, J.; Nicolas, J.; Peubey, C.; Radu, R.; Rozum, I.; et al. ERA5 Hourly Data on Single Levels from 1940 to Present. Copernic. Clim. Change Serv. (C3s) Clim. Data Store (Cds) 2023, 10. [Google Scholar]
  23. Copernicus Climate Change Service (2023): ERA5 Hourly Data on Single Levels from 1940 to Present. Available online: https://cds.climate.copernicus.eu/datasets/reanalysis-era5-single-levels (accessed on 26 November 2024).
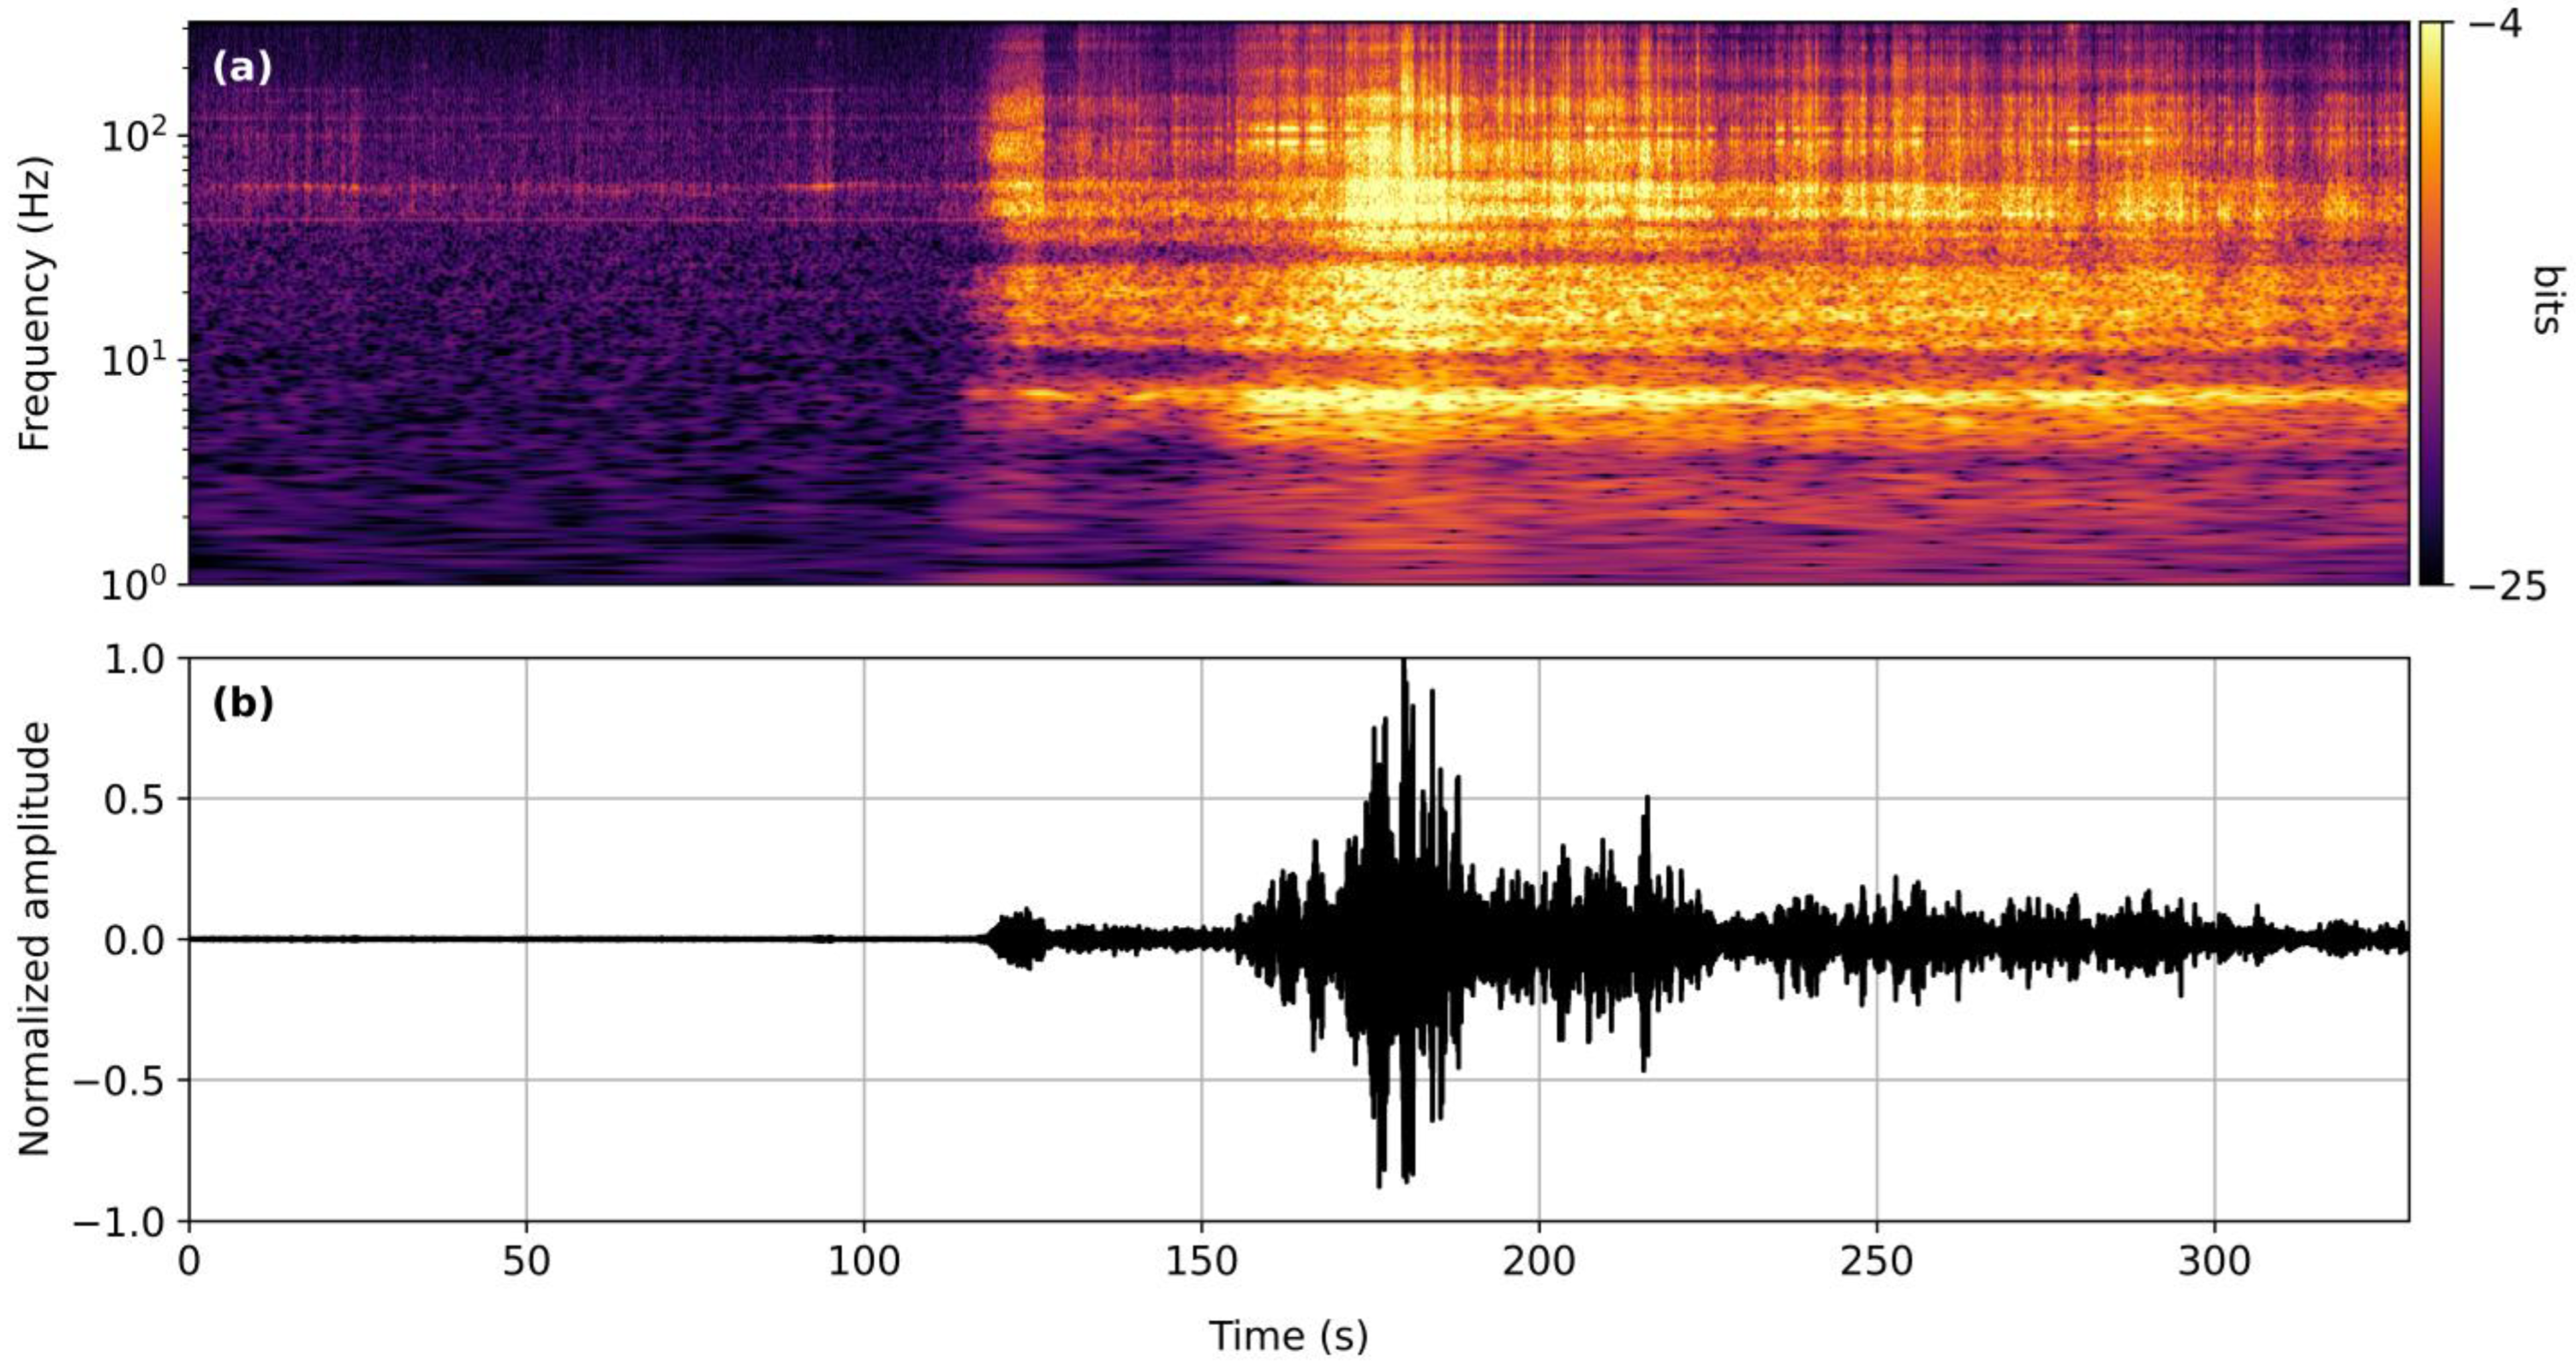
Figure 1. An acoustic rocket launch recording of NASA’s Artemis I launch at 24.4 km range and plotted relative to the reported launch time. The normalized waveform is shown in panel (b), and the continuous wavelet transform (CWT) power of the recording in panel (a).
Signals 06 00041 g001
Figure 2. Bar plots of the distribution of signals in the high-confidence subset of ASTRA (a) recorded on different makes and models of smartphones, (b) originating from different types of rockets, and (c) collected in different range categories.
Signals 06 00041 g002
Figure 3. Simplified visual representations of Google’s Yet Another Mobile Network (YAMNet) and the 3-layer rocket detection model. Layers are represented by rectangles, and their inputs and outputs are represented by arrows.
Signals 06 00041 g003
Figure 4. Pie charts showing the distributions of YAMNet’s predicted classes for (a) rocket launch audio from ASTRA, (b) ‘explosion’ (50%) and ‘silence’ (50%) audio from SHAReD, (c) pre-event audio from ASTRA, and (d) environmental audio recordings from the ESC-50 dataset. All data were upsampled to 16 kHz from 800 Hz sampling rate.
Signals 06 00041 g004
Figure 5. The confusion matrix of the model on all 15 test sets. Each quadrant shows the relevant rate as a mean percentage over all iterations, as well as the sum of the total number of samples in the category over all iterations in parentheses.
Signals 06 00041 g005
Figure 6. A receiver operating characteristic (ROC) curve showing the mean performance over all 15 test sets (solid black line) at different thresholds. The shaded green region around the mean curve shows the 95% confidence band.
Signals 06 00041 g006
Figure 7. The confusion matrix of the best-performing split. Each quadrant shows the relevant rate as a percentage, as well as the total number of samples in the category in parentheses.
Signals 06 00041 g007
Figure 8. Plot showing the best split model’s unfiltered performance on all signals from the SpaceX Falcon 9 launch, Transporter-4. The audio waveforms are plotted in black, and vertical green lines indicate ‘rocket’ classification scores > 0.6.
Signals 06 00041 g008
Figure 9. Plot showing the best split model’s median-filtered performance on all signals from the SpaceX Falcon 9 launch, Transporter-4. The audio waveforms are plotted in black, and vertical green lines indicate ‘rocket’ classification scores > 0.6 after median filtering is applied.
Signals 06 00041 g009
Figure 10. A horizontal bar plot representing the best split model’s false positive classifications of ESC-50 data, plotted according to class labels included with ESC-50. Light-colored bars represent the false positive rates before thresholding and median filtering, and dark-colored bars represent the same rates after thresholding and median filtering are applied. Results for individual classes are shown in blue and labeled with black text, while the overall results are shown in orange and labeled with white text.
Signals 06 00041 g010
Table 1. All events with ‘rocket’ samples misclassified as ‘noise’ by the best split model.
EventNo. False NegativesNo. Positive SamplesNo. True Positives
ASTRA_21873021
ASTRA_21931512
ASTRA_22012524
ASTRA_2211109
ASTRA_222102515
ASTRA_22452015
ASTRA_22542521
ASTRA_22622018
ASTRA_2273107
ASTRA_22951510
ASTRA_23012019
ASTRA_23242016
Table 2. All events with ‘noise’ samples misclassified as ‘rocket’ by the best split model.
EventNo. False PositivesNo. Negative SamplesNo. True Negatives
ASTRA_22555045
ESC50_1660352
ESC50_1667154
ESC50_1675154
ESC50_1683154
ESC50_1731253
ESC50_1761154
ESC50_1779253
ESC50_1808253
Disclaimer/Publisher’s Note: The statements, opinions and data contained in all publications are solely those of the individual author(s) and contributor(s) and not of MDPI and/or the editor(s). MDPI and/or the editor(s) disclaim responsibility for any injury to people or property resulting from any ideas, methods, instructions or products referred to in the content.