1. Introduction
Considered a vital component for transporting bulk materials, belt conveyor plays a crucial role in the mining industry. However, its operational state has led to persistent maintenance-related challenges, including significant damage to the equipment, thus requiring a failure analysis of the conveyor components, especially in non-stationary situations due to fluctuations in the material load during the operation of the conveyor [
1]. Among those elements, roller has been a central focus of investigations, demanding analyses of operating conditions, reliability evaluations, and data monitoring towards improving accuracy in decision-making, especially regarding such a crucial component [
2].
The adoption of predictive maintenance has emerged as a fundamental tool to ensure the integrity of the conveyor system, performed through the monitoring of physical parameters, thus enabling proactive interventions for preventing failures and optimizing operational reliability [
2,
3]. Vibration analysis represents one of the main approaches for fault identification; it uses techniques to monitor the signals of rotating machinery and detect any subsequent change in time, frequency, or time-frequency domains. Such a detailed analysis enables diagnosing potential component failures [
4].
Due to the non-stationary nature of the signal, conventional techniques (e.g., Fourier transform) show limited efficacy when separately analyzing characteristics in time and frequency domains. Alternative methods such as Wavelet Packet Decomposition (WPD) have emerged as more efficient solutions. WPD addresses vibration signals in the time-frequency domain, effectively analyzing signals with those nonlinear and non-stationary characteristics [
5,
6]. Due to the complexity of ensuring safe access for inspection and maintenance activities, rollers are often not properly prioritized during periods of scheduled downtime, resulting in their decreased efficiency and possibility of irreversible damage to other systems operations [
7].
The advent of Industry 4.0 has promoted more robust communication among remote monitoring systems, hence, a more efficient and proactive management of the integrity of industrial equipment [
3,
8]. Numerous studies are underway towards diagnosing conveyor belt roller failures through a variety of machine learning algorithms. Machine learning has emerged as an alternative for diagnosing faults through vibration analysis. It enables the creation of models that classify the characteristics of the signal, determining the integrity of the components with high precision [
9]. Notable examples of the main machine learning techniques already applied include Support Vector Machine (SVM) [
5,
10,
11,
12].
Towards an effective application of a model, its most significant characteristics (features) must be selected to reduce information redundancy and improve classification performance. Feature selection plays a key role in reducing the dimensionality of the database by preserving a subset of features with greater relevance in the classification process [
13].
One of the most used techniques is Principal Component Analysis (PCA), applied for dimensionality reduction in belt fault conveyor classification algorithms [
10]. However, Alharbi et al. [
9] pointed out that PCA has limitations related to difficulties in multiclass discrimination, particularly in more complex datasets. Kazemi et al. [
14] also addressed the limitations of traditional PCA in handling time-varying processes by introducing recursive updates to the correlation matrix. Although the ReliefF algorithm improves upon the original Relief by offering greater robustness to noise and multiclass datasets, it still has limitations. Specifically, it cannot eliminate redundant features and fails to capture conditional dependencies among variables, which may reduce its effectiveness in regression-based or interdependent feature domains, such as fault diagnosis in mechanical systems [
15].
Recent advances in artificial intelligence have significantly increased the application of machine learning in fault detection. Vakharia et al. [
16] applied Wavelet Packet Decomposition (WPD) combined with Gradient Boosting Decision Trees (GBDT) to diagnose faults in belt conveyor idlers, where the decision tree model inherently performed feature selection by ranking the most informative spectral features. Liu et al. [
17] utilized a lightweight attention-based model to detect faults in rotating machinery through acoustic signals, in which the attention mechanism automatically identified the most relevant time–frequency characteristics. In terms of idler fault diagnosis, Muralidharana et al. [
18] presented a method based on a decision tree algorithm, which used statistical metrics from idler vibration signals to train the model, achieving good performance in classifying four types of idler faults. Ravikumar et al. [
19] also applied decision trees to identify statistical features with a high capacity for diagnosing failures in conveyor belt rollers.
Therefore, alternative feature selection techniques can be explored for fault diagnosis. Two techniques that have been rarely reported in the literature for this purpose are the following: Analysis of Variance (ANOVA), which ranks the main features based on statistical criteria [
20], and decision trees, which are commonly used as classification techniques but not often applied as a feature selection method.
This study aims to assess the performance of the decision tree and ANOVA as feature selection methods for diagnosing belt conveyor idlers. Initially, Wavelet Packet Decomposition was applied to vibration signals from conveyor belt rollers for obtaining wavelet energy bands, used as features. The main features (most relevant energy bands) were selected by two different methods (decision tree and ANOVA). Comparison between machine learning models was conducted considering presence or absence of feature selection. SVM, the technique chosen for classification, aimed to identify the model with the best accuracy performance with and without the selection of features.
The paper is structured as follows:
Section 2 covers the basic principles of Wavelet Packet Decomposition as a feature extraction method;
Section 3 explains fundamentals of Support Vector Machine for classification models;
Section 4 describes application of decision tree and ANOVA for feature selection techniques;
Section 5 describes the experimental setup and methodology of the study, from data collection to failure diagnosis;
Section 6 reports the results and the main findings for multiclass learning, as well as comparative of accuracies achieved by the confusion matrix in different feature selection methods; finally,
Section 7 provides the main conclusions and suggestions for future studies.
2. Wavelet Packet Decomposition
The wavelet transform applies to base wavelet, analogously to the sinusoidal functions applied to Fourier transform. The main difference is the shape of sine waves, which are periodic functions with constant amplitude beyond the domain, whereas base wavelets are short-time periodicals with zero linear value outside the domain [
21].
The wavelet functions family is determined from the frequency domain, which can contract and expand the wavelet mother by means of the dilation and translation parameter for displaying high- and low-frequency characteristics in any time interval of the signal, respectively. To the end of avoiding data redundancy and calculations on all possible scales, the expansion and translation parameters can be discretized so that the signal analysis remains efficiently accurate. This process is known as Discrete Wavelet Transform (DWT) [
22].
According to Rhif et al. [
23], DWT is an analysis of non-stationary signals for the detection of structures of spatial and/or temporal domains and extraction of information through frequency variations. During its implementation, Multiresolution Analysis (ARM) was introduced for adapting discrete-time signals of finite length [
16]. However, due to restrictions on the functions allowed for MRA, an alternative is the adoption of Daubechies wavelet family of functions [
24].
Despite the flexibility of DWT’s resolution properties, one of the drawbacks is the poor resolution and discrimination between components of signals at higher frequencies. The creation of Wavelet Packet Decomposition (WPD) from the generalization of wavelet bases has emerged as alternative bases that inherit properties of orthonormality and time-frequency localization to the corresponding wavelet functions [
5]. WPD offers a richer analysis based on the decomposition of signals by digital filtering in all frequency bands, creating a set of frequency sub-bands applied for better discrimination of components in the entire frequency domain [
25].
The basic principle of WPD is the decomposition of the signal from the transform into low- to high-frequency bands, for which the energy of the spectrum was extracted. Energies from different frequency bands of a vibration signal can be used as features for enabling fault identification by an intelligent classifier algorithm. Equations (1)–(3) simplify wavelet function (W), wavelet coefficients (w), and band energy (E), respectively. The variable
n represents the decomposition level,
j is the scaling factor,
k is the translational factor, and
f(
t) is the time-domain sign [
5].
3. Support Vector Machine
Machine learning is the science that studies algorithms and statistical models towards computer systems performing certain activities with no programming with explicit commands. Several algorithms can be applied to machine learning, and each of them is more effectively suited to solving a given problem [
26]. Regarding classification algorithms, techniques such as Support Vector Machine can be applied.
Considered one of the main tools in science and industry, SVM is one of the pillars of artificial intelligence, due to its effectiveness in classifying a given application in relation to other techniques [
27]. It is a machine learning technique that creates a hyperplane with optimal separation of input vectors nonlinearly mapped in a high-dimensional Z feature space. Margins of maximum distance between the nearest vectors are constructed so that the optimal hyperplane can ensure a good generalization of the classes. Therefore, models that classify linearly separable and non-separable data can be generalized. Margins are created from a small piece of data called Support Vectors [
28].
A greater variety of decision surfaces, including nonlinear ones, can be constructed for solving the problem of nonlinearity. A decision function can, therefore, be created from the inner product [
28]. Regarding nonlinear decision surfaces, the inner product convolution shows variations, whereas for Radial Base Functions (RBF), the decision function
f(
x) is defined by Equation (4), where
αi is a Lagrangian multiplier, and
b is a linear coefficient.
Ky(|
x −
xi|) is a non-negative function width parameter, expressed by Equation (5).
In general, different types of decision functions can be mapped when the
K formula, also known as Kernel, is known. Such functions are very useful for dealing with cases of linearly non-separable data [
29].
5. Experimental Setup
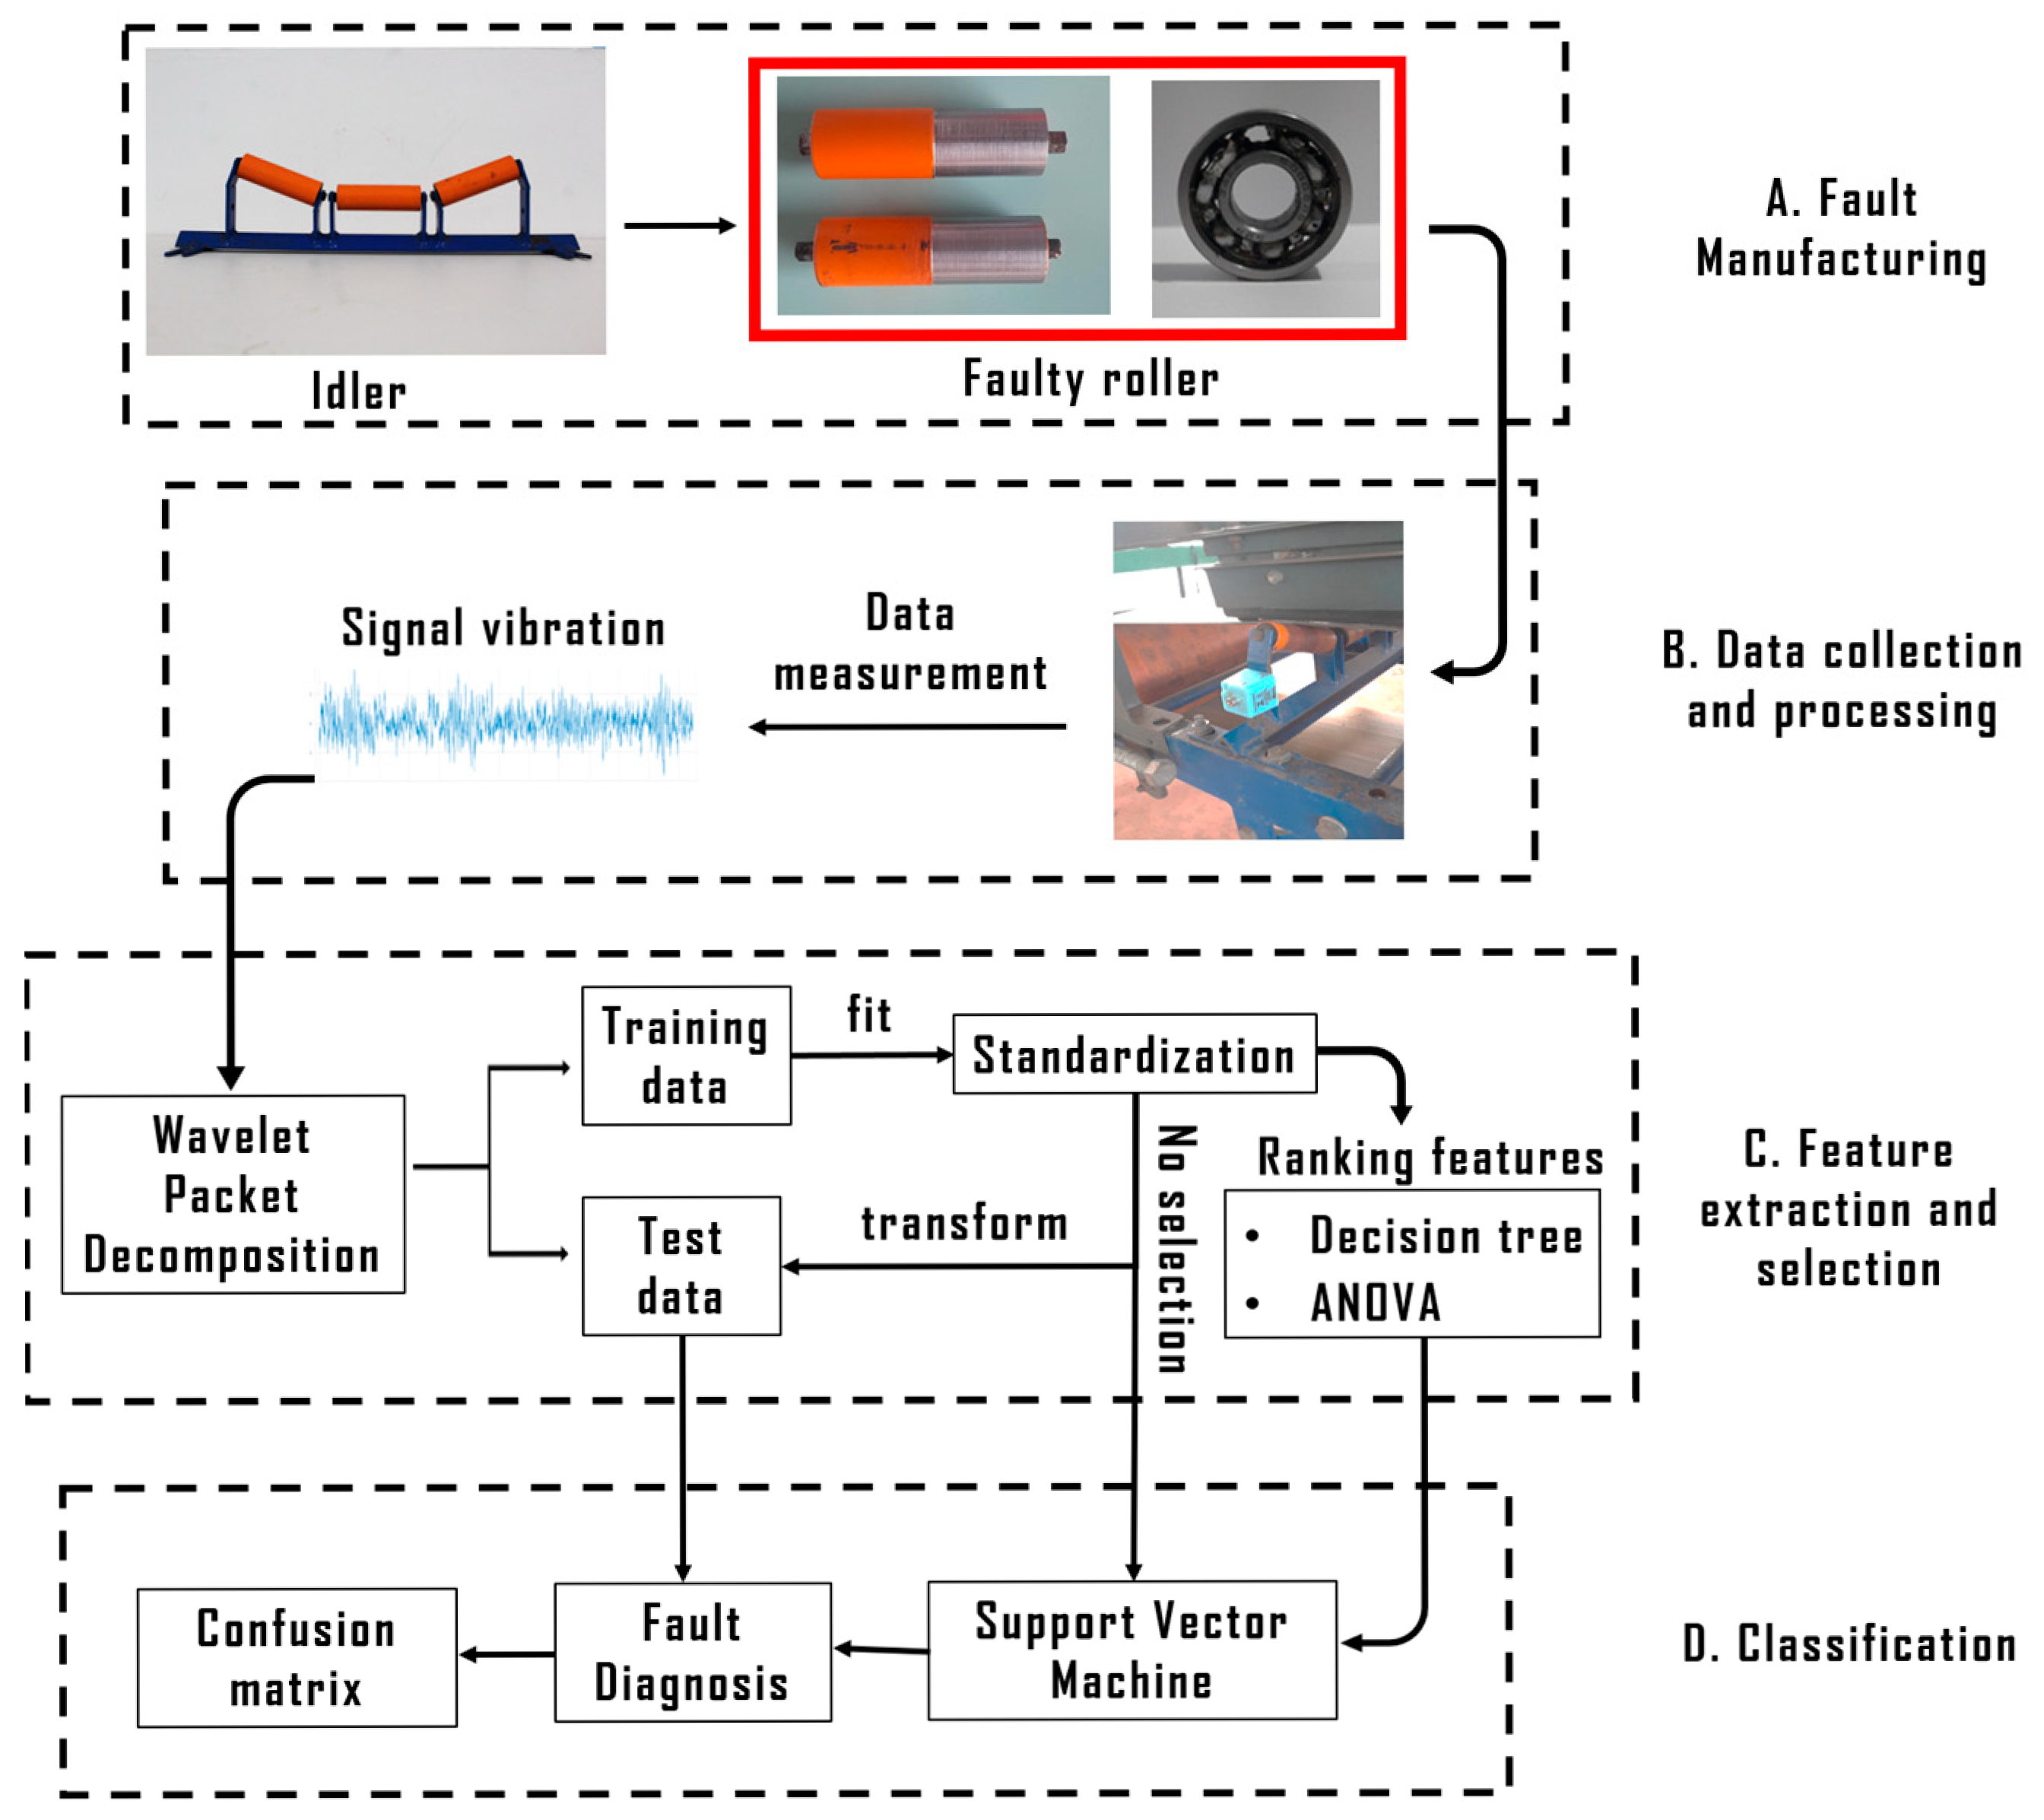
The methodology was developed through the following stages (represented in
Figure 1): Fault manufacturing, Data collection and processing, Feature extraction and selection, and Classification. Each stage is explained in detail in the following subsections. The equipment used for the application of the vibration analysis and failure classification study was a belt conveyor test rig, operating with an angle of inclination of eight-degree angle and 90 rpm speed, controlled by a frequency inverter.
5.1. Fault Manufacturing
The creation of roller defects was based on simulations in two of the main modes of roller failure, namely, shell surface wear and bearing defects. Initially, artificial defects were implemented on the surface of the rollers with two different severity levels by lathe machining. Enabling a margin of control of defects, specific wear modes in rolls were analyzed from the steps performed in the process of face plating of the roller surface. Two rollers were machined—one with 0.5 mm wear (defined as grade 1) and the other with 1 mm wear (defined as grade 2), as shown in
Figure 2.
Regarding the manufacture of artificial defects in the roller bearings, the roller was disassembled, and the bearings were removed. Two levels of defects simulated two different severity levels of the defect, where a hole was made for breaking the cage by a hammer drill with a 2.25 mm diameter. In the first severity level, only one of the roller bearings (defined as grade 1) failed, whereas in the second, a hole was drilled in each of the two bearings (defined as grade 2).
Figure 3 shows a comparison between a healthy bearing and a bearing with an artificial defect in the cage. The creation of defects in the roller bearing cage is an adaptation of the failure induction from the literature [
2].
5.2. Data Aquisition and Processing
During the experimental procedure, a sensor was installed on the side of the idler frame to measure the vibration of the rollers under each health condition (
Figure 4). In addition, both the sensor and the faulty rollers were positioned on different sides of the idler frame to ensure greater signal variability and a broader range of class labels.
The sensor selected for the monitoring of the rollers was DynaLogger HF+ model from Dynamox
® S.A manufacturer (Florianópolis, Brazil). The basic characteristics of the experimental setup for vibration signals acquisition (
Figure 5) are shown in
Table 1.
5.3. Feature Extraction and Selection
From the creation of a database of vibration acceleration in the time domain, the process of decomposition of the signals into energy bands was conducted by WPD. Fifteen levels of decomposition were configured, thus enabling the formation of 16 frequency bands for each sample (E1, …, E16). Initially, with the selection of member ‘db 8’, extracted from Daubechies family, coefficients and wavelet energy for each band were calculated as the selected wavelet function, represented, respectively, by Equations (2) and (3) presented.
The wavelet energy bands were pre-processed so that the training samples could fit into new values within a standardized range. Once the normalized wavelet energy had been calculated, a new database was extracted with each energy band representing a feature of the sample. For each sample, class labels were used to categorize the signal states as either normal or faulty, considering both failure modes and severity levels. Additionally, the algorithm was able to identify faults in rollers positioned on the opposite side of the stand relative to the accelerometer, allowing for the detection of lateral roller failures using only a single accelerometer per idler frame.
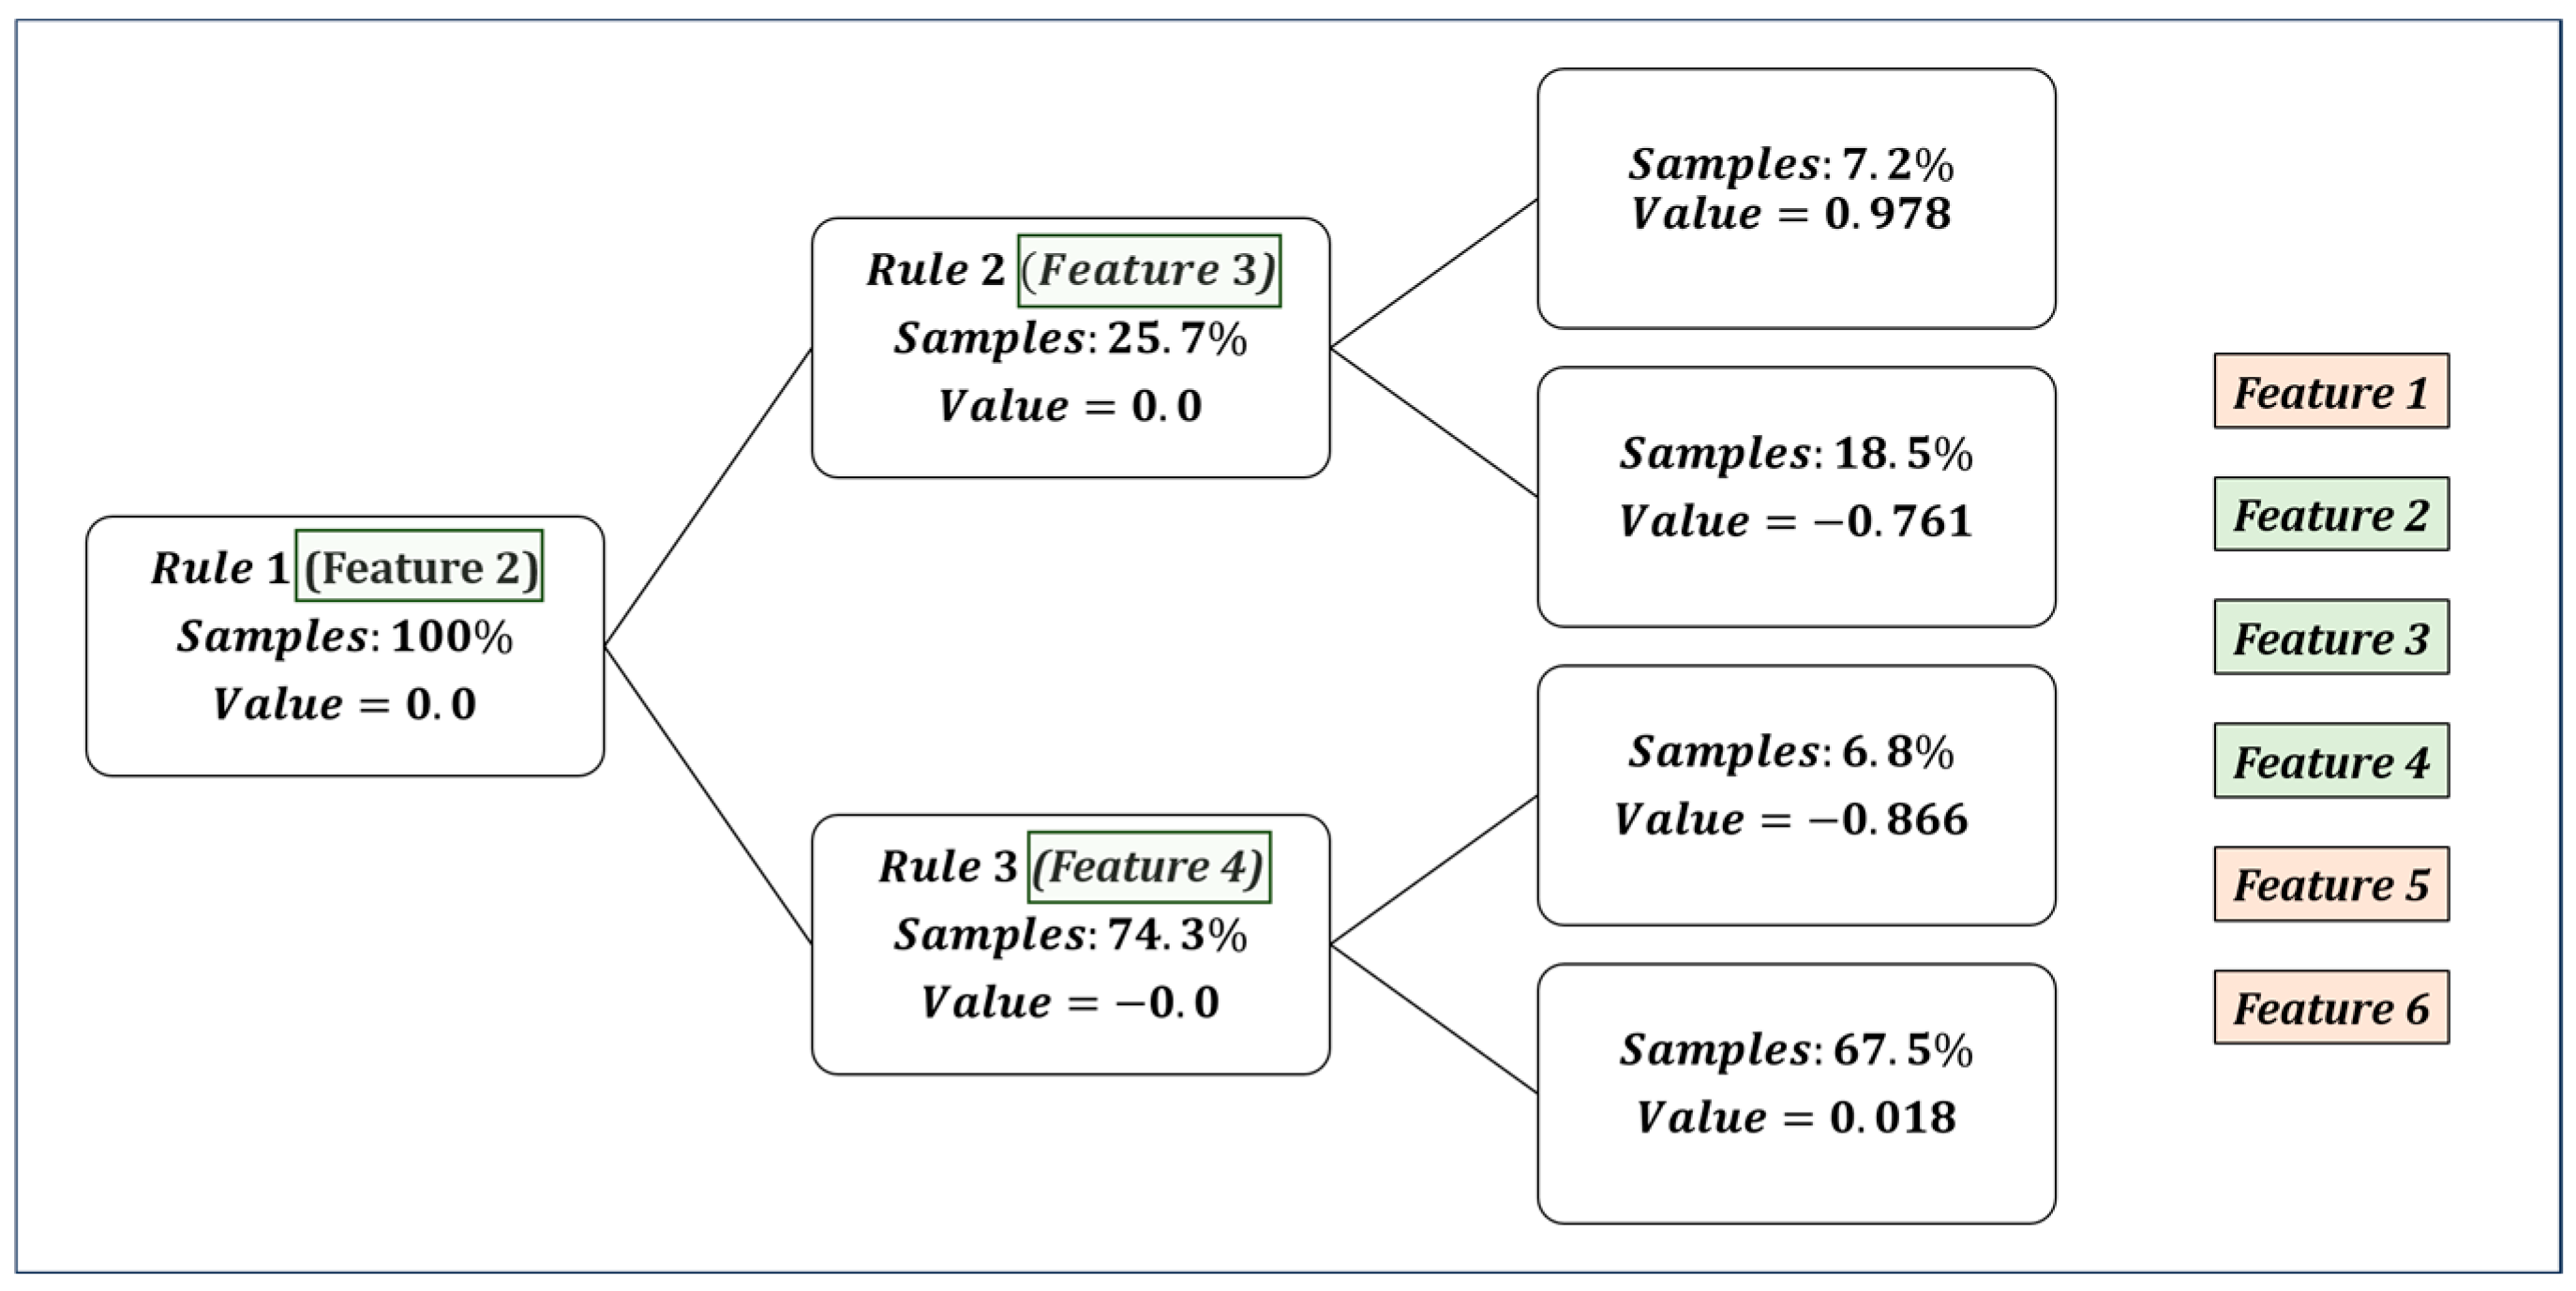
Furthermore, an undersampling step was applied, retaining 75% of the data to prevent overfitting during fault classification. Features were handled through feature selection with the decision tree. The decision tree algorithm was then applied from the database with the features obtained. The configuration of the parameters chosen for the decision tree algorithm is shown in
Table 2.
Figure 6 illustrates the rules established by the model, from features created by the energy bands for classification of the roller conditions. The most significant features chosen in the rules by the model were selected for the application of the techniques that create machine learning models for fault diagnosis.
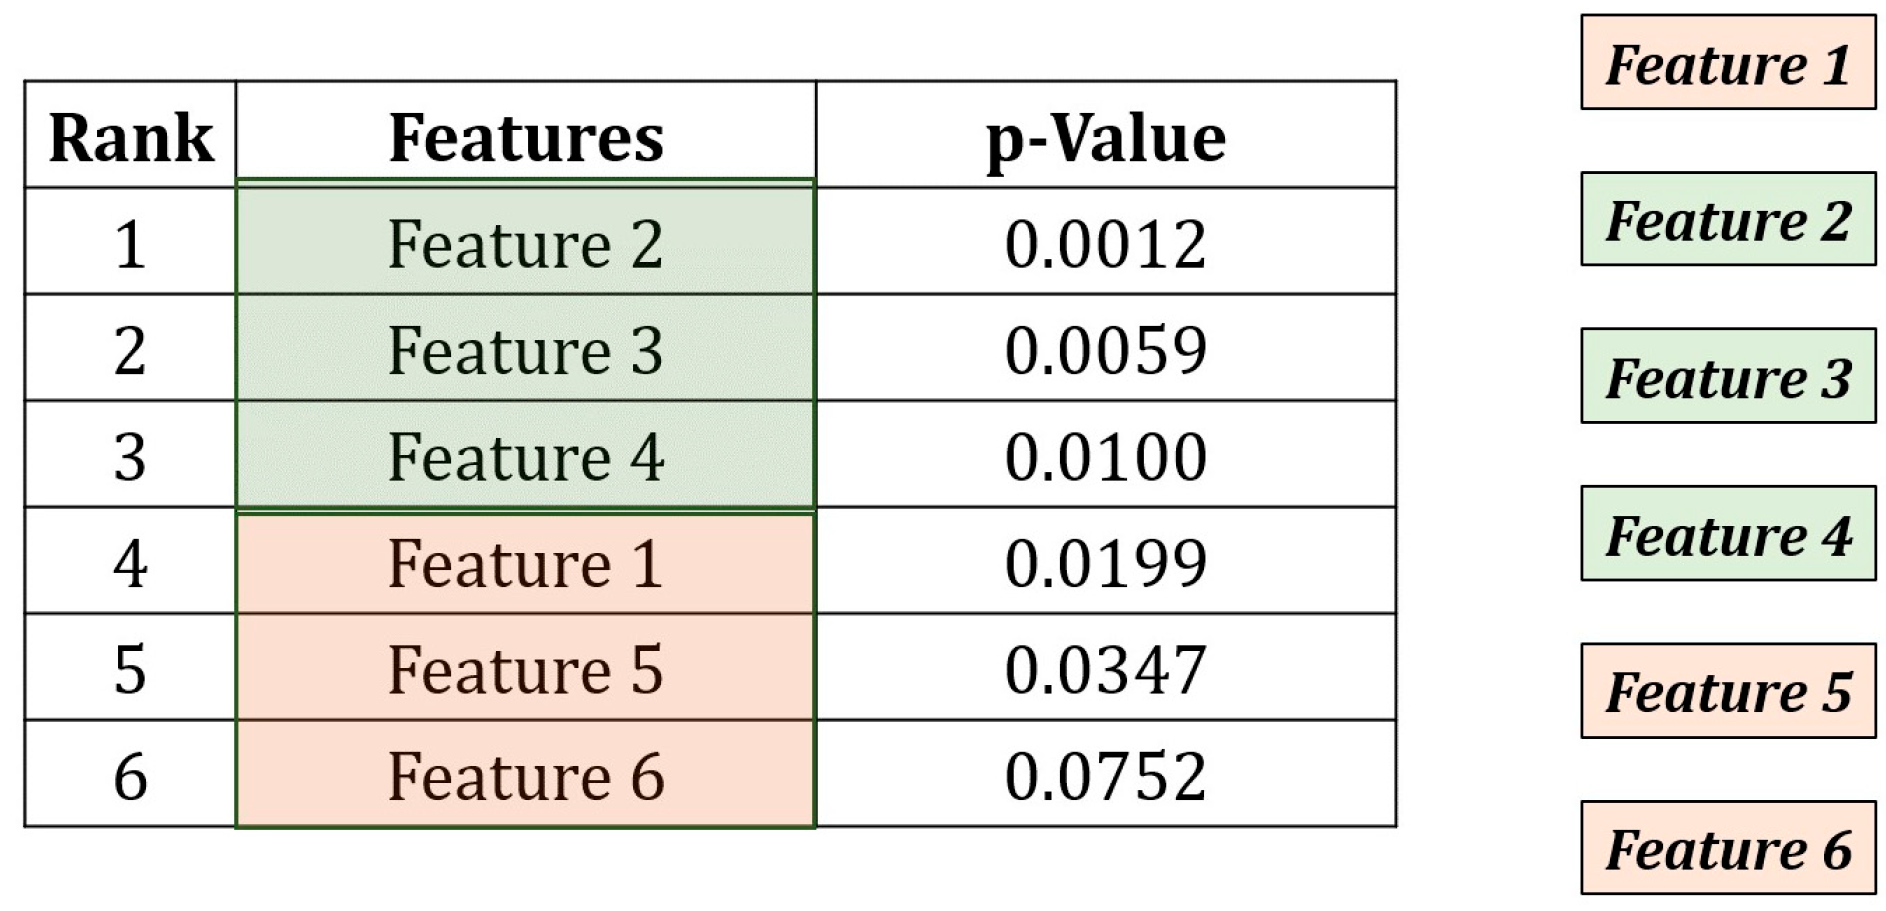
After a proper formatting of the new database with the normalized wavelet energy, the features were also selected by ANOVA for comparing averages among the nine different labels of the roller signals. Towards determining statistically significant differences,
F-test was calculated so that the variability of the data within the class and between classes could be understood. The
p-value, which indicates the probability of a class being separable, was also calculated (as represented in
Figure 7).
5.4. Classification
After the extraction and pre-analysis of features, the six most significant features were selected for comparisons of the diagnostic models with and without them. Data balancing was previously applied for balancing the quantity of data per class for data training towards improving the classification model to be used. The samples were divided into a 75/25% ratio for training and test data, respectively. Otherwise, data normalization was performed after the train-test split step, to avoid data leakage.
SVM was adopted as a learning technique, and algorithms were created for classifying the vibration signals in the vertical direction captured by the accelerometer, with and without the selection of features. A grid search step for hyperparameter optimization was realized based on the variation in main hyperparameters, as shown in
Table 3. Learning models performed diagnoses of the rollers, considering detection of failure, failure mode, severity level, and faulty roller position.
6. Results and Discussion
The selection of features for fault diagnosis by decision tree and ANOVA showed some similarities between the techniques. Among the 16 wavelet energy bands, the 7 most significant features for each technique selected as the 1st, 10th, 11th, 12th, 14th, and 16th band energies were best ranked, with only one divergent feature for both feature selection techniques.
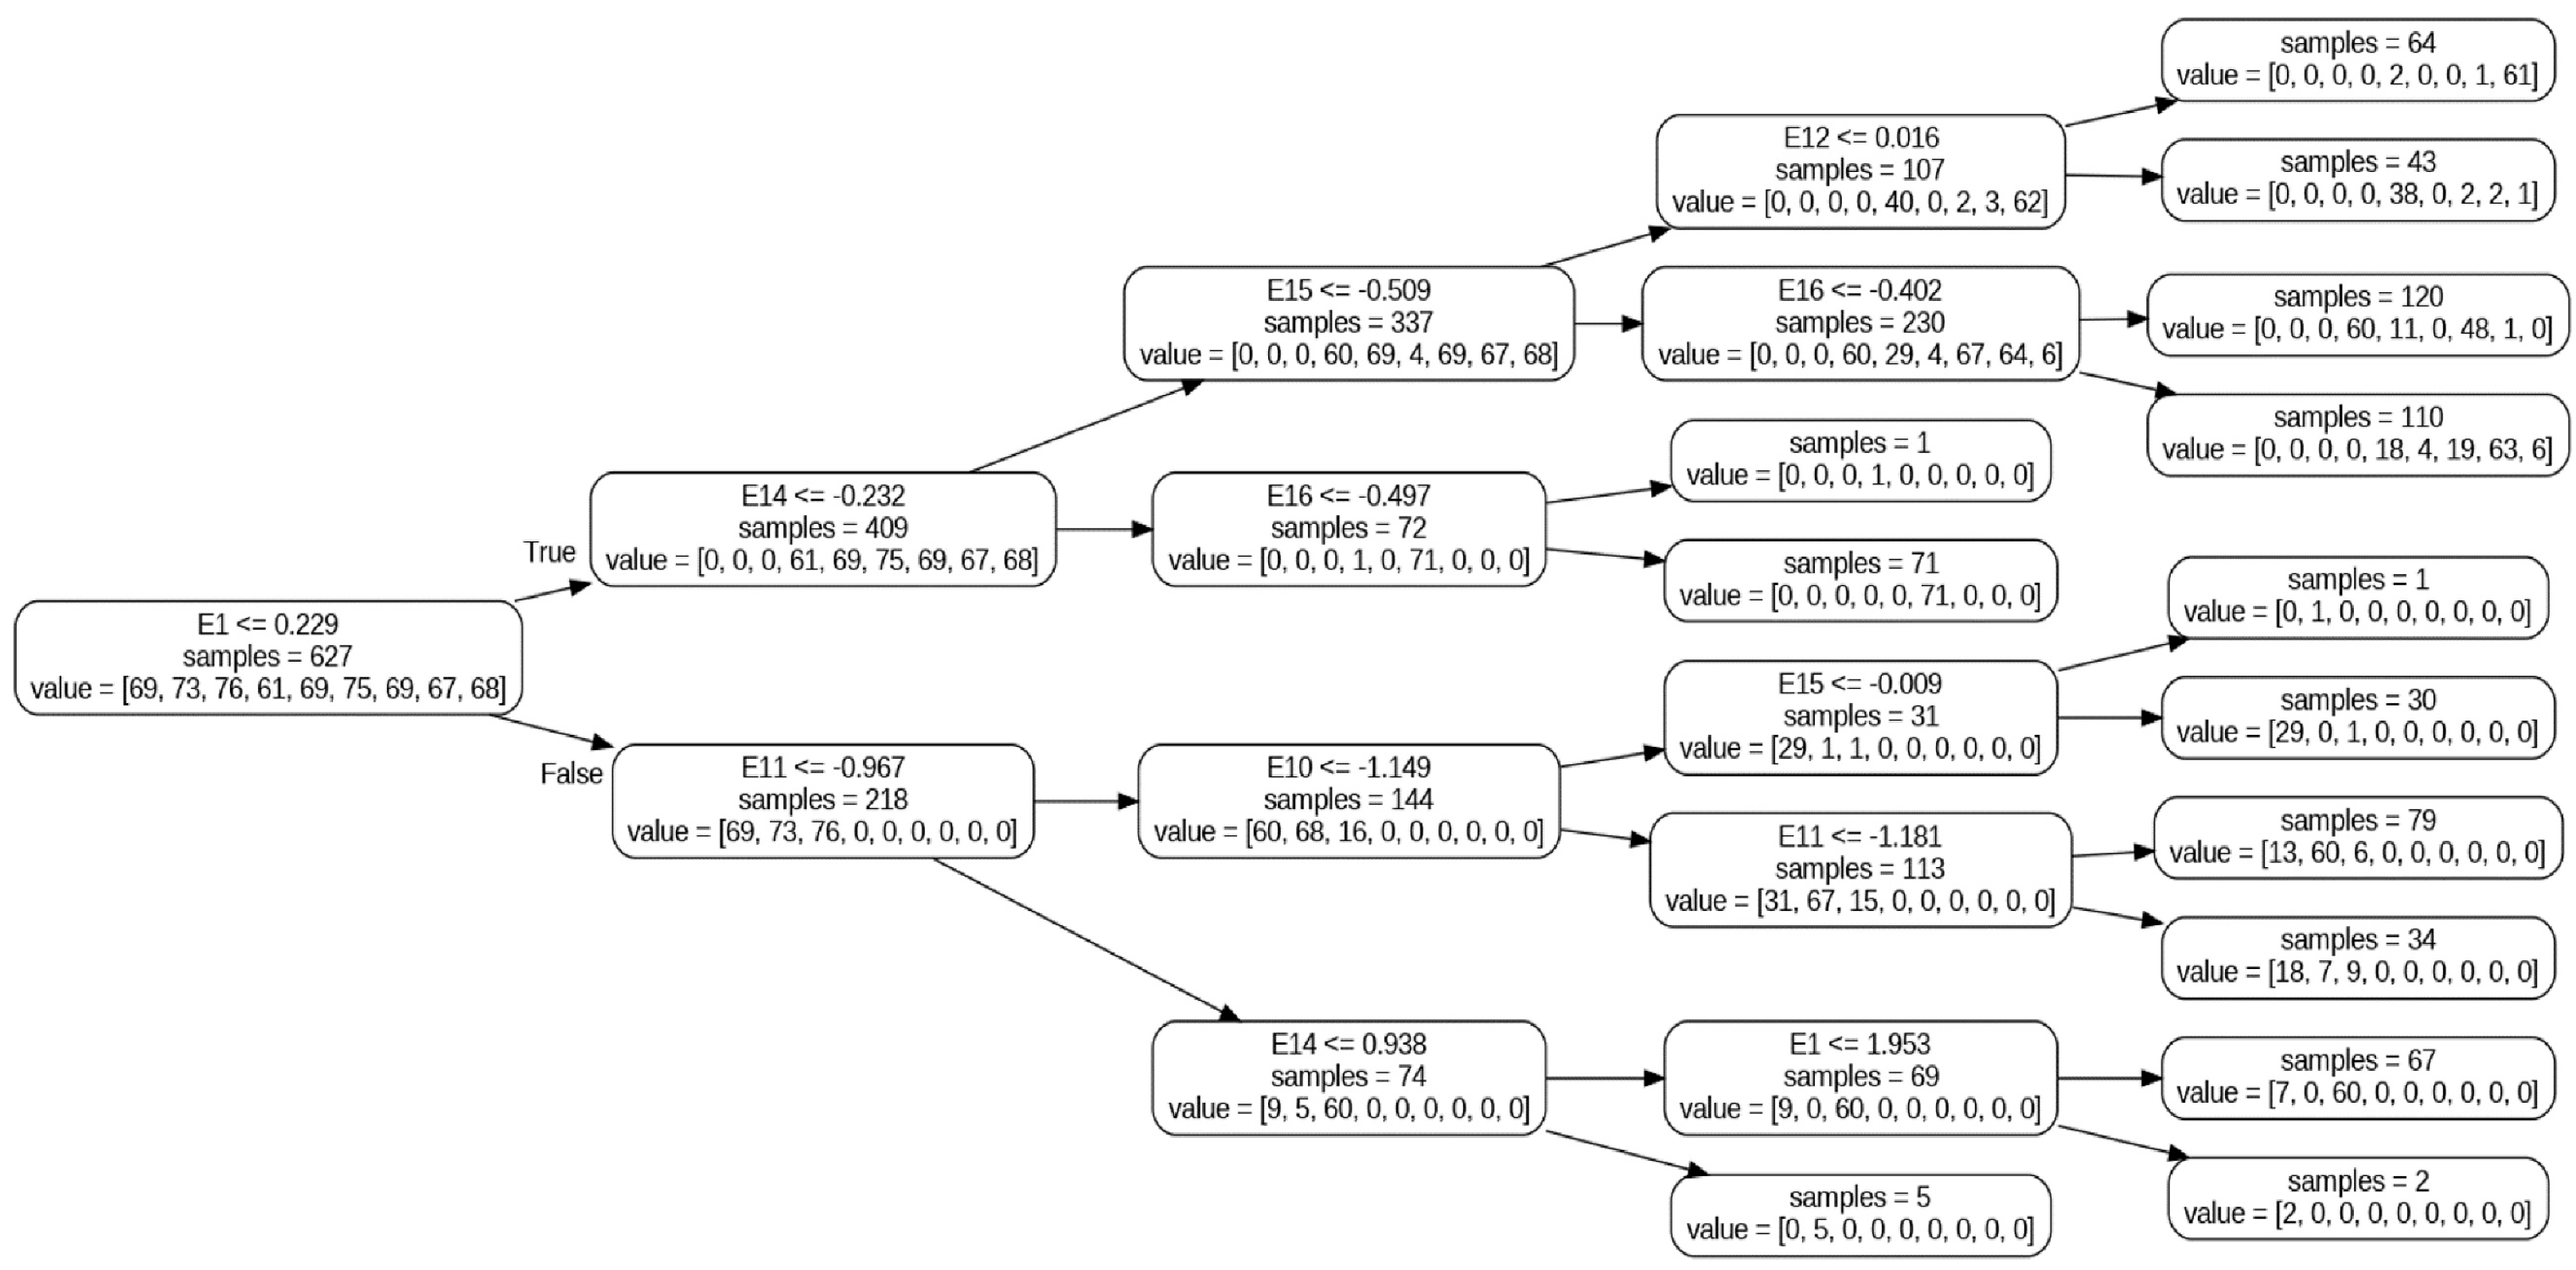
Regarding decision tree, in addition to the wavelet energies ranked, the 15th energy was also among the seven most significant features, as illustrated in
Figure 8. The root node of the tree displays the sampling distribution rule based on the 1st band energy, which is the feature of highest relevance for classification. The other features adjust the distribution among the nine classes and can assist in the identification of signal characteristics such as type of failure mode, severity level, and roll positioning.
According to ANOVA, unlike the decision tree, the 13th energy was ranked among the 7 most significant features. Another difference is the way features are ranked, since the decision tree shows only the most significant ones, eliminating those least relevant, whereas ANOVA ranks all band energies (see
Table 4). On the other hand, a similarity between techniques that can be highlighted is the selection of the 1st energy as the most relevant. However, all features had a
p-value below 0.05, indicating they are highly differentiable features, and implying that learning can be performed without feature selection, even though it shows a classification accuracy loss.
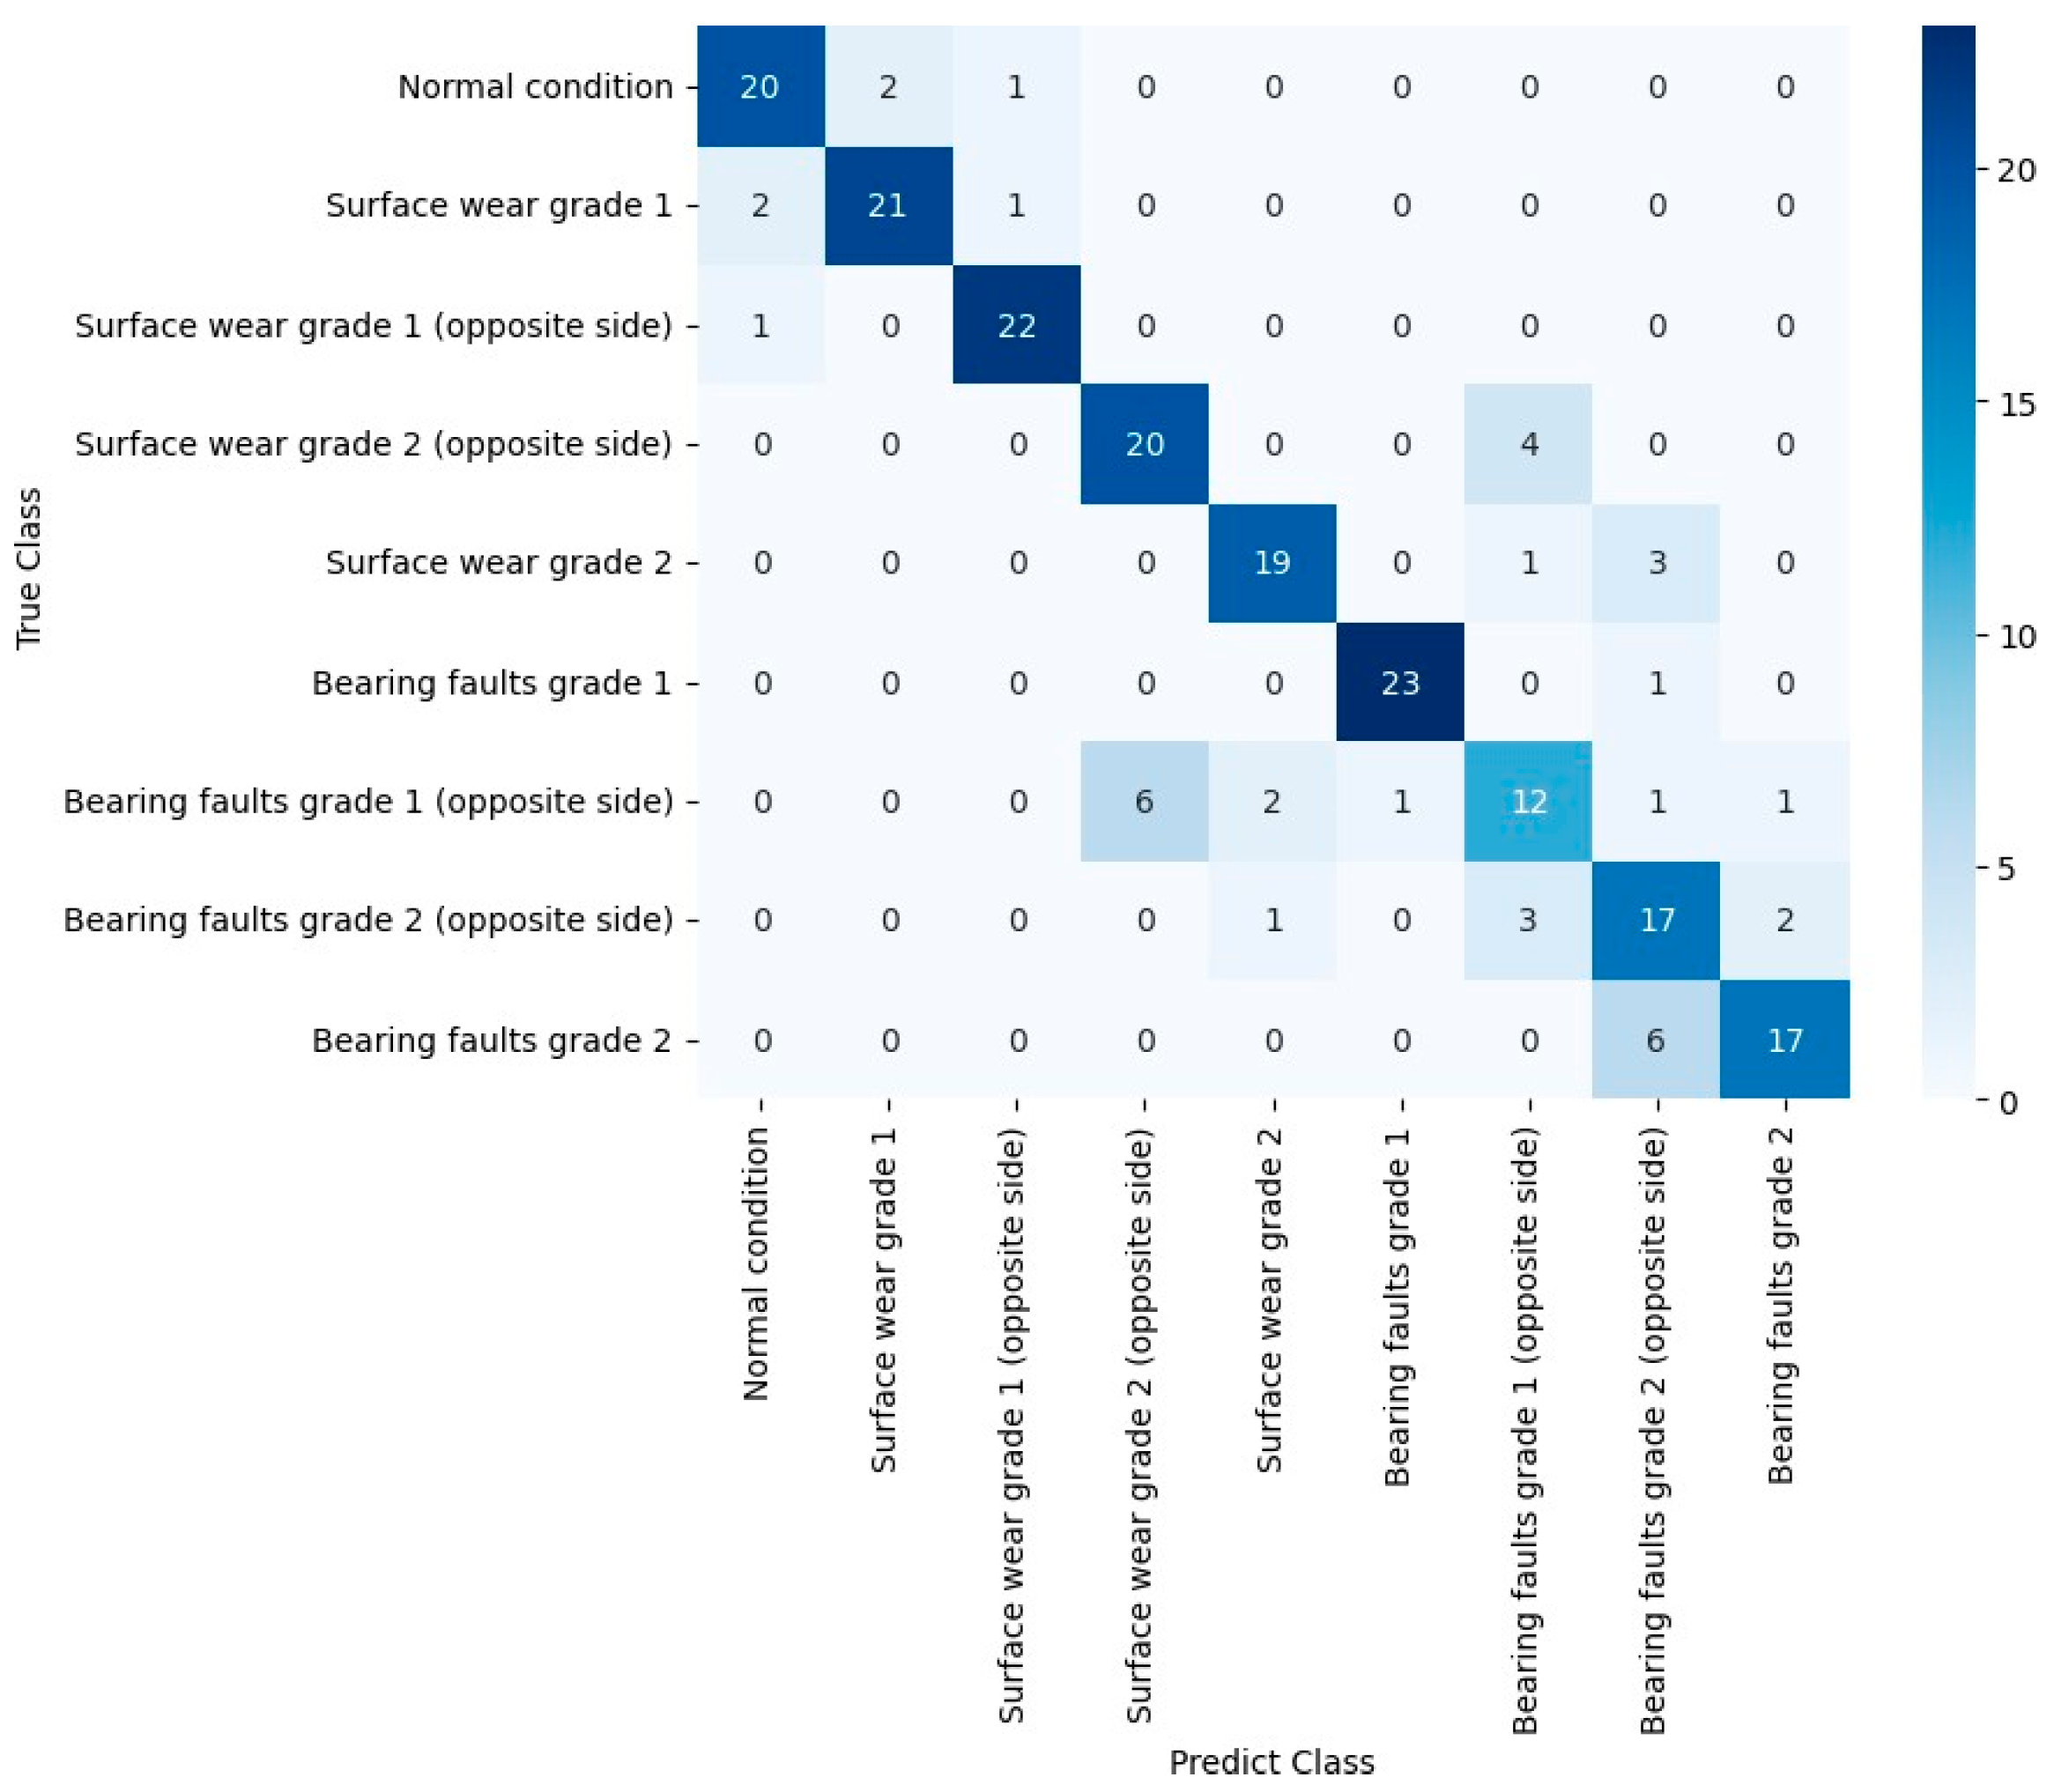
After selecting the seven most expressive features for fault diagnosis, SVM learning models were created with a variation in hyperparameter C in three cases, i.e., in a learning algorithm without feature selection, with the application of decision tree, and, finally, with the application of ANOVA. The best models were in the algorithms with the selection of features, implying a decrease in the amount of band energies for the learning of the diagnostic algorithm, reducing the noise that hampers the identification of each class. A confusion matrix was created for the best model in each case towards a better comparison between the predicted class and the actual one.
Figure 9 shows the confusion matrix of the SVM classifier model with no reduction in wavelet energy bands. The main diagonal shows the number of correct answers in each class, and the incorrect diagnoses of the predictor class in relation to the true class are presented. The detection of healthy signals showed no confusion in relation to faulty ones, except rollers with grade 1 surface wear condition, i.e., with wear levels in early stages, which implies a low number of errors due to false negatives.
Figure 10 displays the SVM classifier confusion matrix after selecting features by decision tree. Regarding false negatives, a similar behavior was exhibited in relation to the model with no feature reduction. However, the increase in the number of correct answers of the classifier model is remarkable, especially in relation to the classes of signals that showed defects in bearings.
Figure 11 shows the confusion matrix of the SVM model with feature selection by ANOVA. In addition to the similarity of the behavior of the model in relation to the other classifier models, the rate of correct answers increased in the diagnosis of the rollers in comparison to the model with no reduction, despite a decrease in accuracy in relation to the model with selection of features by decision tree.
Some indicators of the diagnosis of roller failures were evaluated from the confusion matrices, as shown in
Table 5. Despite the lowest false negative error rate of the model without feature selection, other indicators are superior in models with reduction in features, such as failure mode and severity level. Moreover, the selection of features promoted a more accurate identification of the defective roller on the idler frame.
7. Conclusions
In general, the machine learning models for diagnoses of failure in belt conveyor rollers have been improved by different feature selection techniques. Wavelet band energies were extracted from vibration signals measured on the idler frame for evaluations of the conditions of the rollers. From the extraction of features, decision tree and ANOVA were applied for their ranking, indicating divergence in only one of the seven most significant features and the main energy bands in the classification of the state of the rolls.
After the selection of the most significant features, different SVM classifier models were compared with and without feature selection techniques. The model applying a decision tree for the ranking of features showed the best indicators such as faulty roller position (97.7%), severity level (97.8%), and failure mode (93.9%). Therefore, applying feature selection can reduce computational costs without statistically compromising the performance of roller fault classification models. However, in cases involving false negatives, models without feature reduction achieved lower error rates (13%), as shown in
Table 5. This suggests that some wavelet band energies discarded during the feature ranking process may carry relevant information for distinguishing between healthy and faulty signals. In all models, errors due to false negatives were detected in the classification between healthy signals and defective signals with grade 1 superficial wear. Therefore, some signals evaluated with levels of wear in early stages, even if in low percentages, may not be detected by diagnostic models.
Towards future improvements, the diagnosis of rollers positioned in the central region of the stand should be included. Moreover, future work should consider applying different loads to the conveyor bench, evaluating the transferability of the trained model to other rigs or operational settings, and comparisons with real field signals should be considered to enhance the practical applicability of classification models and comparisons with traditional feature selection techniques.
