Highlights
What are the main findings?
- Research on automotive demand forecasting is fragmented across 63 vehicle and spare parts studies.
- AI and hybrid models outperform traditional methods for intermittent spare parts demand.
What are the implications of the main findings?
- External variables and AI or hybrid models improve forecasting accuracy and planning.
- Addressing gaps in data privacy, intermittent demand, and firm-level models enhances forecasts.
Abstract
The automobile industry is one of the world’s largest manufacturing sectors and a key contributor to economic growth. Demand forecasting plays a critical role in supply chain management within the automotive sector. Reliable forecasts are essential for production planning, inventory control, and meeting market demands efficiently. However, accurately predicting demand remains a challenge due to the influence of external factors such as socioeconomic trends and weather conditions. This study presents a systematic literature review of the forecasting methods employed within the automotive industry, encompassing both vehicle and spare parts demand. Following PRISMA guidelines, 63 publications were identified and analyzed, covering traditional statistical models such as ARIMA and SARIMA, as well as state-of-the-art artificial intelligence approaches, including artificial neural networks. The review finds that classical statistical models remain prevalent for vehicle demand forecasting, Croston’s method dominates spare parts forecasting, and AI-based techniques increasingly outperform conventional models in recent studies. Furthermore, the review compiles a broad set of external variables influencing demand and highlights the common challenges associated with demand forecasting. It concludes by outlining potential directions for future research.
1. Introduction
The automotive industry is one of the largest, most diverse, and impactful industries globally. Often regarded as the largest single manufacturing sector in the world, it encompasses a wide range of companies involved in the design, development, production, sales, and marketing of automobiles and their components. This industry plays a crucial role in the global economy. It is one of the most significant sectors by revenue, with its turnover matching that of the world’s sixth-largest economy. In the European Union alone, the automotive industry directly or indirectly employs around 13.8 million people, accounting for approximately 6% of total EU employment [1]. Numerous small- and medium-sized enterprises are also connected to the automotive sector, providing essential spare parts such as tires, batteries, and engines. Given its size and reach, the management strategies, organizational structures, and operational approaches within the automotive industry are highly influential, impacting various other business sectors [2,3].
Competition among automotive manufacturers, including those in the spare parts industry, has been intensifying rapidly. To remain competitive and increase profitability, businesses have consistently sought to accurately predict consumer demand for their products and match it with their supply. Accurate forecasting can significantly impact the performance of an organization by improving decisions across various components of the supply chain [4]. However, it is common for consumer demand to be inconsistent and unpredictable, as it is influenced by a variety of unknown and known factors, such as socioeconomic conditions and weather effects. As a result, many companies do not rely on mathematical forecasting methods and instead base their decisions on orders or inventory levels primarily on individual judgment, experience, or qualitative approaches [5].
Forecasting techniques in the automotive industry have traditionally focused on the sales of automobiles and automotive spare parts. While the sales of automobiles have historically received significant attention [6,7,8,9,10], recent studies have increasingly explored the forecasting of spare parts [11,12,13,14,15]. Automotive spare parts/components, such as seasonal tires, exhibit predictable fluctuations in sales at certain times of the year, driven by factors like weather and holidays. However, the demand for such products can experience significant fluctuations during peak demand periods [16]. Little to no demand characterizes the typical sales pattern for such products during specific periods of the year, followed by a significant increase in demand for the remainder of the year. This variability in demand makes pricing and inventory management challenging for retailers. Additionally, for some seasonal products, long replenishment lead time, compared to the short duration of the selling season, restricts retailers’ ability to replenish inventory during peak demand periods [17]. These factors make forecasting demand for seasonal products a complex and challenging task.
Most of the existing literature reviews on demand and sales forecasting are primarily focused on specific sectors such as power, tourism, and fashion industries [18,19,20]. To date, no systematic literature reviews (SLRs) have been found that focus specifically on forecasting within the automotive industry. Although some systematic review-type articles exist [21,22,23,24,25,26,27] they do not meet the criteria of a systematic literature review focused specifically on forecasting within the automotive industry. Therefore, this systematic literature review seeks to fill this gap, and aims to identify, organize, and summarize published scientific literature on forecasting within the automotive industry.
This study covers a review of the literature about demand forecasting for the automotive industry and its spare parts. It primarily focuses on the four research questions (RQs) outlined in Table 1 in Section 1, and the publication is partitioned into six sections. Section 2 provides an overview of the methodology used to compile the literature. Section 3 addresses RQ1 and RQ2 by reviewing recent studies, examining the various products and methods employed in forecasting. It further explores the key factors influencing forecasting models relevant to RQ2. Section 4 addresses the specific challenges commonly encountered when forecasting products in the automotive industry (RQ3) and suggests potential directions for future research (RQ4), and Section 5 concludes the paper.

Table 1.
List of the research questions (RQs) addressed in this review paper.
2. Materials and Methods
A systematic review of the literature encompasses the meta-analyses of studies published on a specific topic. Its primary rationale is to convert the large amount of data into easily comprehensible information, which can form the basis for informed policy decisions. Therefore, the steps adopted for a systematic review, such as collecting and filtering the literature, must be reproducible and free from significant selection bias. The present systematic literature review (SLR) was carried out in accordance with the Preferred Reporting Items for Systematic Reviews and Meta-Analyses (PRISMA 2020) guidelines [28,29,30], ensuring methodological rigor, transparency, and reproducibility. A complete PRISMA checklist was prepared to document compliance with all reporting items, and the review protocol was registered on the Open Science Framework (OSF) before data extraction. The PRISMA flow diagram (Figure 1) illustrates the detailed screening and selection process applied during the review.
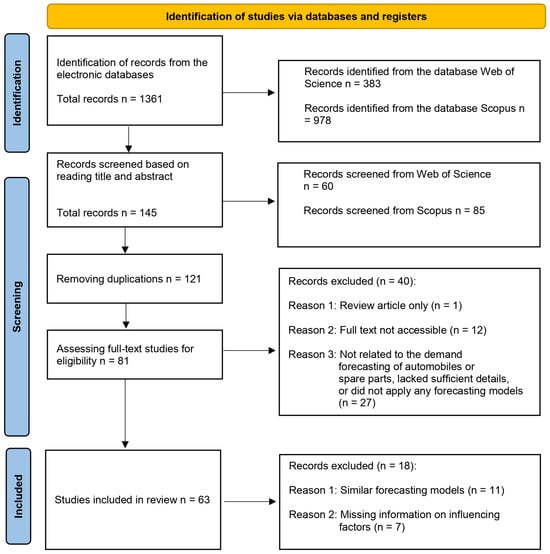
Figure 1.
Methodological framework of the systematic literature review following the PRISMA guidelines.
The overall protocol and analytical approach were further guided by established methodological sources, including Kitchenham and Charters [28] and Tranfield et al. [30], which recommends a structured and replicable framework for evidence-based synthesis.
2.1. Search Strategy and Databases
One of the first steps in the systematic review is the selection of the databases to collect the literature; it is recommended to select at least two electronic databases relevant to the topic [31]. For this study, we selected two databases: “Web of Science (WoS)” and “Scopus.” To search for these databases, a query string was developed using the Boolean condition (Table 2). This search yielded 383 publications on WoS and 978 publications on Scopus.
Table 2.
Information about query strings used to search the databases Web of Science and Scopus.
2.2. Screening and Selection Criteria
A quality assessment was conducted to ensure the inclusion of methodologically sound studies. Each publication was evaluated based on three quality dimensions: clarity of research objectives, appropriateness of the forecasting methodology, and relevance to automotive demand forecasting. Studies that did not meet these minimum standards were excluded during the eligibility stage.
During the screening process, some publications were excluded using a set of predefined criteria to ensure transparency and reproducibility. Publications were removed if they (i) did not explicitly address automotive or spare parts demand prediction, (ii) focused on topics such as unrelated manufacturing processes or general AI applications, (iii) lacked methodological rigor, such as absence of empirical data, statistical forecasting, or predictive modeling, (iv) fell outside the disciplinary scope of the study. Applying these criteria systematically reduced the initial pool of records (over 1200) to a final set of approximately 145 highly relevant and methodologically robust studies. Therefore, an initial screening was conducted manually based on the titles and abstracts to eliminate unrelated works. This process resulted in 60 relevant publications from WoS and 85 from Scopus. After merging the two datasets and removing duplicates, 121 unique publications remained. These were subjected to a thorough review process. Manual screening by thorough reading of the publications, including cross-referencing of citations, was performed to refine the selection further. A subsequent full-text evaluation was conducted to assess relevance. A total of 63 publications met the inclusion criteria and were incorporated into this study, as shown in Figure 1.
2.3. Choice of Analytical Methods
This study employed a combination of bibliometric and qualitative analytical approaches to ensure a rigorous and transparent synthesis of the reviewed literature.
VOSviewer (version 1.6.20, Centre for Science and Technology Studies, Leiden University, Leiden, The Netherlands) was used to identify thematic relationships among keywords and to visualize the structural composition of the research landscape. The software was selected because it objectively detects clusters of co-occurring terms, which facilitates the identification of dominant themes and emerging research areas in the field.
The PRISMA flow framework was adopted to document each stage of the literature selection process. This protocol minimizes selection bias and enhances methodological transparency, ensuring that the review procedure remains systematic and reproducible.
In addition, core bibliographic information such as year of publication, source type, and methodological orientation was compiled to assess the representativeness of the dataset and to support the subsequent trend analyses presented in the Results section.
By integrating quantitative mapping with qualitative content analysis, this mixed-methods design combines methodological rigor with interpretive depth, enabling the review to capture both statistical patterns and conceptual developments within the field of automotive demand forecasting research.
3. Results
This section presents the main findings of the systematic literature review, including an overview of the selected studies, the forecasting methods identified, and the explanatory variables used in automotive demand forecasting. A total of 63 studies met the inclusion criteria and were analyzed to identify methodological trends, model performance, and research patterns. The results are organized into sub-sections covering the publication characteristics, types of forecasting methods, and variables employed across studies.
3.1. Overview of the Selected Literature
All relevant references were retrieved from the WoS (383 records) and Scopus (978 records) databases; a short bibliographic analysis was conducted to obtain an overview of the publications and to validate the relevance; a co-occurrence analysis was conducted using VOS viewer on a dataset containing 10,061 keywords, applying a minimum co-occurrence strength threshold of 20, a maximum of 100 connection lines, and considered keywords that were repeated 35 times to ensure cluster stability. This process resulted in the identification of 26 significant keywords, which are visualized in a network map (Figure 2).
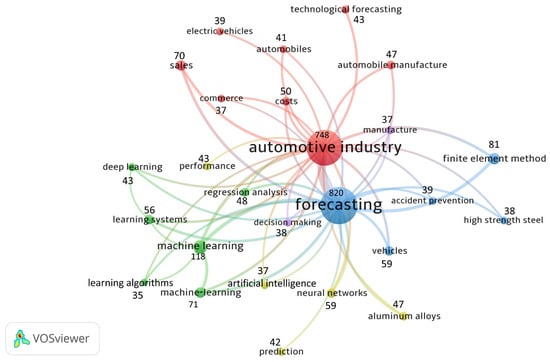
Figure 2.
The co-occurrence clustering view of the keywords as produced by VOS viewer.
The map shows four thematic groups, with central terms such as “automotive industry” and “forecasting” serving as hubs that link different research areas. Key groups include topics related to machine learning, artificial intelligence, and industrial manufacturing. The red cluster pertains to automotive industry topics, the blue cluster reflects engineering and analytical methodologies, the green cluster represents machine-learning techniques, and the yellow cluster encompasses predictive modeling and decision-support concepts.
Next, brief bibliographic analyses of the 63 selected articles were conducted to obtain an overview of the year of publication and the co-occurrence of the keywords. A co-occurrence analysis was conducted using VOS viewer on a dataset containing 511 keywords, applying a minimum co-occurrence strength threshold of 20, a maximum of 100 connection lines, and considering keywords that were repeated four times to ensure cluster stability. This process resulted in the identification of 22 significant keywords, which were visualized in a network map. As expected, keyword analysis of titles (Figure 3) reveals dominant terms such as “forecasting”, “sales”, “automotive industry”, “time series”, and “machine learning”, pointing to a prevalent interest in developing and applying predictive models for sales and demand estimation in the automotive industry. The map shows three thematic clusters. The blue cluster represents general forecasting and supply-chain concepts, the green cluster captures statistical and machine-learning methodologies, and the red cluster reflects sales-focused and automotive-industry applications.
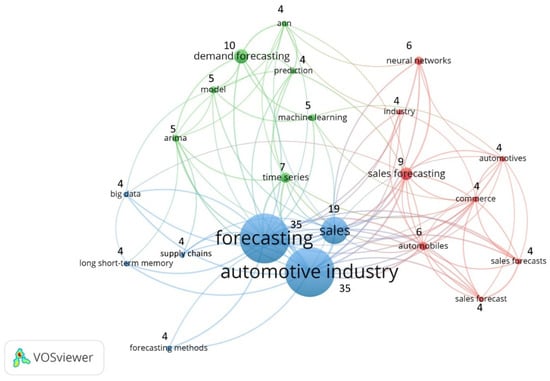
Figure 3.
The co-occurrence clustering view of the keywords of the selected 63 publications as produced by VOS viewer.
Figure 4 shows that the lighter blue bars represent earlier years with modest publication activity, while the darker green bars highlight the recent surge in output. The prominence of green bars indicates that most selected articles come from the last five years, reflecting the field’s growing research intensity. Examination of the publication years (Figure 4) indicates that a significant (>~60%) proportion of the 63 articles were published in the last five years (2021–2025).
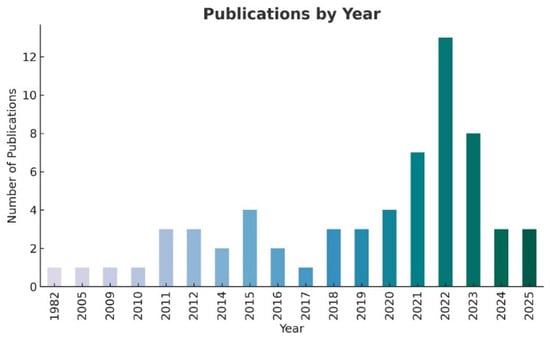
Figure 4.
The figure illustrates the frequency of publications across the years in which the articles were published.
Table 3 highlights the influential authors in automotive demand forecasting, identified through citation counts extracted from the Scopus database. The key thematic areas for these authors included intermittent demand and inventory modeling, production planning for make-to-order systems, econometric forecasting using external indicators, and machine learning approaches to multivariate and time series prediction. Most high-impact contributions are published as journal articles, reflecting the field’s emphasis on peer-reviewed research outputs. The geographic spread, spanning the UK, Austria, Russia, Portugal, the USA, France, and Slovenia, illustrates the dominance of forecasting research in Europe.
Table 3.
Leading authors and major research themes in automotive demand forecasting.
Of the 63 selected publications, 56 exclusively used quantitative forecasting methods. The methods covered in these 56 articles not only included the classical time series and statistical methods, such as simple moving average, Box, Jenkins or the Autoregressive Integrated Moving Average (ARIMA) model [39], exponential smoothing [40], the Holt–Winters (HW) model [41] but also included the state-of-the-art ML methods, such as artificial neural network (ANN)-based models [42].
The remaining seven publications applied either a qualitative method alone or a combined qualitative and quantitative approach. Although in the reviewed literature, qualitative approaches were less frequently employed compared to quantitative approaches, they can offer important insights in certain situations. The following sub-section examines the role and application of qualitative forecasting methods in the automotive industry.
Among the sixty-three studies included in this review, a broad range of forecasting techniques was employed to estimate automotive demand. These methods are grouped into six principal categories, which are discussed in the following sub-sections.
3.2. Forecasting Methods
The analysis of the selected studies revealed that researchers have applied a broad spectrum of forecasting approaches to predict automotive demand. To provide a clear and systematic comparison, these approaches were organized into six major categories: (1) qualitative methods, (2) traditional time series and statistical models, (3) artificial intelligence (AI)-based models, (4) mathematical models, (5) hybrid approaches, and (6) comparative performance analyses. The following sub-sections summarize each category, outlining their methodological characteristics, types of data used, and key findings reported in the reviewed literature.
3.2.1. Qualitative Methods
The seven publications reviewed under this sub-section ranged from 2015 to 2023. They covered the methods that relied on expert judgment, subjective assessments, and structured decision-making techniques. Compared to quantitative approaches, the primary advantage of qualitative forecasting methods lies in their ability to forecast the demand for a product without any historical data such as in the case of a new product [43]. However, such qualitative methods can be prone to bias and errors. Further, it may lack transparency and consistency, and sometimes these are also expensive to generate and employ for the forecasting process [44] (Table 4). This section describes qualitative methods, with a focus on approaches such as the Delphi method and scenario analysis [45,46].
Delphi Method
The Delphi method comprises selecting the domain experts and obtaining from them a reliable consensus of opinion through intensive questionnaires with a feedback loop [46]. Hird & Kreiling [44] used the Delphi method for resource forecasting in the automotive industry. In their approach, they first collected individual responses from selected experts, followed by the development of a group consensus. Next, this group consensus was then refined through a feedback loop among all group members, leading to a final consensus. Using the case scenario of three distinct products, they concluded that their proposed method led to the development of the forecasting tool, which was acceptable to all the respective group members.
The Delphi method can also be used to select the explanatory variables affecting the demand forecasting of the products. For instance, Salais-Fierro et al. [47] used an expert’s opinion to identify key factors influencing automobile sales in Mexico. These factors were then modeled in a forecasting model. The forecasting model with the expert’s identified factors demonstrated higher accuracy compared to models without them (Table 4). Similarly, to forecast the demand of new automotive sport utility vehicles (SUVs) in the Brazilian auto market, Yamamura et al. [48] proposed a method combining machine learning and an expert’s domain knowledge. Under this approach, they first used the knowledge of domain experts to construct the set of features that could affect the demand for SUVs. Next, these features were used as inputs in the artificial neural network (ANN) to forecast the market share of six newly launched SUV models. Their approach displayed an average MAPE of ~18%. They concluded that combining machine learning algorithms with domain knowledge can produce improved predictions without requiring large datasets, which is crucial for new product development. Similarly, Alalawin et al. [12] used the survey and questionnaire (Table 4) to identify the factors affecting price and demand forecasting of spare parts of hybrid electric vehicles (HEVs) in Jordan. Later, these factors were used as explanatory variables in multiple regression models (MLRs) in the forecasting process. They concluded that though the survey identified the factors reliably, in many instances, MLRs were not accurate enough.
Scenario Analysis
In the case of scenario analysis, forecaster creativity recognizes potential opportunities and threats within the environment by envisioning multiple outcomes and evaluating their potential impacts. This enables the assessment of any future potential gains and risks associated with various strategic choices [49]. Gansterer [35] (Table 4) used the real-world data obtained from the automotive manufacturer to simulate four scenarios; each scenario represents a different level of customer demand. These scenarios formed the basis of the sales forecast in the framework of aggregate production planning (APP) of the manufacturer. Zulkepli [50] (Table 4) developed car sale forecasts for Proton vehicles in Malaysia by making assumptions about key influencing factors, including population size and the average number of cars per person. They analyzed two different scenarios, namely, optimistic, and pessimistic, to project future sales.
Table 4.
Summary of studies using a qualitative approach in forecasting.
Table 4.
Summary of studies using a qualitative approach in forecasting.
| Study | Purpose of the Study | Method Used | Application |
|---|---|---|---|
| Alalawin et al. [12] | Price and demand forecasting of spare parts of HEVs | Survey | Factors affecting spare parts demand were assessed using a survey and a questionnaire. Later, these factors were included in MLRs. |
| Gansterer [35] | Investigate the impact of aggregate planning in MTO environment | Scenario analysis | Real-world data coming from the automotive supplier industry is used to define four demand scenarios. |
| Hird & Kreiling [44] | Resource forecasting in the automotive industry based on the Delphi method | Delphi | The Delphi method was directly used for forecasting the resources without applying any further quantitative methods. |
| Maulana & Farizal [51] | Demand forecasting of Toyota car in Indonesia | Delphi | Factors affecting demand forecasting were obtained following the Delphi method; later these factors were included in MLR. |
| Mishra & Mathew [43] | Understand the methodologies used by OEMs for color and trend forecasting when designing futuristic vehicle interior concepts. | Delphi | Experts’ opinions were directly used for the forecasting without applying any further quantitative method. |
| Salais-Fierro et al. [47] | Propose a forecasting method for automobiles by combining historical data and experts’ opinion | Delphi | Experts’ opinions were transformed by applying an ANN combining with fuzzy logic |
| Zulkepli [50] | Forecast the future demand for Proton cars in Malaysia | Scenario analysis | Made assumptions about the factors such as average lifespan of the population, the average units per person, to create two scenarios to forecast the car sales |
The overwhelming number (56 of 63) of forecasting studies that we reviewed used quantitative forecasting methods. These methods can broadly be categorized into (a) traditional time series and statistical methods—this category includes methods based on time series forecasting and Bayesian approach (Table 5); (b) artificial intelligence (AI)-based methods—this category includes methods such as random forest (RF), long- and short-term memory (LSTM) (Table 6); (c) other mathematical models (Table 7); and (d) hybrid methods (combining two or more techniques) (Table 8). Further, the vast majority of the comparative studies (Table 9) have applied more than one method of quantitative forecasting.
3.2.2. Traditional Time Series and Statistical Methods
The 16 publications reviewed under this sub-section ranged from 2011 to 2023. This section reviews studies that employ only statistical methods, including time series analysis and approaches relying on autoregression. The selection of forecasting methods depends on the demand type. Based on average demand interval (ADI) and the coefficient of variation (CV), the demand type can be classified into four categories: smooth, erratic, intermittent, and lumpy [15,52]. The choice of statistical method depends on the product’s demand type. For example, ARIMA is suitable for smooth and erratic demand, while Croston’s method [53] is preferred for intermittent demand. Other methods that fall within this category include simple moving average (SMA), simple exponential smoothing (SES), vector error correction (VEC), and vector autoregression (VAR).
Demand Forecasting of Automotive Spare Parts
In the reviewed literature, the demand for automotive spare parts varies significantly depending on the type, ranging from smooth to lumpy. For lumpy demand, while Croston’s method has been traditionally applied, Syntetos and Boylan [54] demonstrated that it can produce biased estimates. Consequently, they proposed an alternative in 2005, known as the Syntetos and Boylan Approach (SBA). They applied this new method, along with other Croston-based approaches, to monthly data over two years, covering 3000 stock keeping units (SKUs) in the automotive sector. Each tested method (Table 5) used an 11-month out-of-sample forecast horizon. To evaluate performance, they introduced various performance indices. Their results showed that their proposed SBA method outperformed others for intermittent demand and demonstrated that the relative geometric root mean square error (RGRMSE) provides consistent results across the datasets that they used. Similarly to the aforementioned study, Babai et al. [37] (Table 5) used the same set of intermittent data coming from the automotive industry, but extending the comparison to include additional forecasting methods, concluded that Syntetos and Babai’s method (TSB) showed a superior forecasting performance, considering the performance indices Mean Squared Error (MSE), Mean Absolute Scaled Error (MASE). They, however, reported that other Croston-based methods also performed competitively.
Not all automotive spare parts forecasting, in the studies that we covered, had intermittent demand; many also showed smooth demand, enabling the application of commonly used time series techniques such as ARIMA and exponential smoothing. For example, Ngadono & Ikatrinasari [55] used ARIMA to forecast (Table 5). The sale of PVB films for the automobile industry in Indonesia. PVB films are an essential component of laminated glass in automobiles. They used monthly sales data for the year 2017 and applied different ARIMA models (with different parameters) to forecast the monthly sales of PVB films for the year 2018. Similarly, Widitriani et al. [56] used simple exponential smoothing (SES) to forecast the monthly demand of the automotive spare parts for the distributor company based in Indonesia (Table 5). To this end, they used monthly data of 81 spare parts starting from January 2016 until June 2019. Further, they determined the alpha parameter of SES using the mathematical approach of golden section optimization. They assessed the performance of their approach only comparing the forecasting values and the observed values of in-sample periods. For this comparison, they used Mean Absolute Percentage Error (MAPE). Their approach had an average MAPE of 43.49% and ranged from 22.04% to 59.51%.
To take into account the non-stationarity and fluctuating characteristics of the auto parts sales data, Qin et al. [57] proposed the Empirical Mode Decomposition (EMD)-Prophet model (Table 5). For this purpose, they used the monthly sales data of the automotive spare parts, such as clean oil filter, fuel filter assembly, and gearbox oil, from January 2015 to September 2020. Their data displayed seasonality and periodicity, but there was no overall trend present in the data. From this data, they set aside the monthly data from May 2020 to September 2020 as the test data (to evaluate the performance of their derived models). Further, they also included other forecasting methods such as ARIMA, Prophet (without EMD) and EMD-ARIMA for comparative purposes. Their results showed that EMD-Prophet outperformed all the other forecasting models.
Demand Forecasting of Automobiles
In our reviews, it was observed that, unlike automotive spare parts, the sales of automobiles followed a smooth demand. Therefore, time series forecasting techniques such as ARIMA and SES are mainly used for forecasting. For instance, Chen [58] used automobile monthly sales data of the China Association of Automobile Manufacturers from January 2001 through June 2011 to build an ARIMA forecasting model (Table 5). They found the ARMA (3,2) model to be the most suitable model in their data. While they did not perform any out-of-sample forecasting, their model had an MAPE of ~8%.
Forecasting horizons play a vital role in planning the production process of automobiles. In the reviewed publications, studies applying statistical and time series methods targeted a wide range of forecasting horizons, ranging from one month in advance to 24 months in advance. For instance, Sa-ngasoongsong et al. [36] used monthly automobile (large and small vehicle segments) sales data in the U.S. from January 1975 to December 2010 to develop forecasting models for the long-term horizon (12 months’ sales in advance). Additionally, they used four monthly economic indicators (Table 10) in their forecasting models. For the long-term forecasting, they used nine different forecasting models (Table 5). Their results suggested that vector error correction (VECM) without exogenous variables outperformed all selected classical statistical and time series models in the long-term (12-step ahead) forecasting. The methods used in this study were extended further by Fantazzini & Toktamysova [33] (Table 5). They used monthly sales data of new car registration in Germany from January 2001 to June 2014 to build forecast models for a mid-to-long-term horizon (up to 24 months in advance). In addition to the eight economic indicators (Table 10), they also included Google search data in their forecasting models. They applied mathematical approaches similar to Sa-ngasoongsong et al. [36]. To identify the best multivariate forecasting models for each of the 10 brands that they investigated, altogether, they formulated 34 different types of forecasting models based on VECM, VAR, Bayesian VAR, univariate time series models, and periodic error correction approaches. They concluded that Bayesian VAR-based models performed well for short-term and medium-term forecasts (up to 12 months ahead), while bivariate models (based only on car sales and Google data) excelled in long-term forecasts (up to 24 months ahead). Notably, although these two studies had common forecasting methods, the best-performing method differed between them. One of the reasons for this could be the usage of different influencing factors affecting demand.
Researchers have also applied forecasting methods to determine the influencing factors affecting the demand. For example, Homolka et al. [59] aimed to determine the macroeconomic and socioeconomic indicators that can have significant predictive power in the development of a short-term (12 consecutive months in advance) horizon forecasting model of car sales. To this end, they used monthly car sales data of 21 European countries from January 2010 to December 2017. First, they used the Granger Causality test to determine if changes in specific economic indicators help predict changes in the car registration over time. Once they had identified such economic indicators, they used multivariate VAR models for short-term forecasting in each of the 21 countries. Overall, these multivariate VAR models demonstrated consistently good predictive performance. Similarly, Shahabuddin [9] aimed to improve the sales forecasting for the automotive industry by exploring the relationship between multiple economic variables such as durable industry demand, GDP, and population (Table 10) and automobile sales in the USA. To this end, he developed two multivariate regression models: one with lagged data and another without. He concluded that both models have high R2 values, indicating that these economic variables could be included in the forecasting model to improve accuracy (Table 5).
In addition to using socioeconomic indicators and Google data in the forecasting models, researchers have also used competitor information to investigate whether it can improve the forecasting accuracy of the model. For example, Chen et al. [60] compared the basic time series model, ARIMA, with the time series models incorporating the influence of online reviews in the forecasting of several Chinese automobile brands under the “R” category. They compared the three time series models: basic ARIMA (1,0,1), ARIMA with the variable representing brands’ sentiment (So), and ARIMA with the variable representing the sentiment associated with the competitive brands (SC). Their results showed that the ARIMA model with So and SC had the lowest MAPE compared to the other two models.
Researchers have also included events like the global financial crisis (GFC) of 2007 and COVID-19 outbreaks in their models to see how sales changed during those times, using forecasts to measure the impact. For example, Srivastava et al. [61] applied ARIMA to forecast the automobile sales in India for the years 2020 and 2021. Later, they compared the forecasted values and actual sales to assess the impact of COVID-19 outbreaks on sales. Similarly, Chaikajonwat [62] proposed four methods based on Holt’s method to forecast the automobile sales in Thailand by accommodating the COVID-19 pandemic event. They showed that Holt’s method correcting for seasonality and events demonstrated a lower (~8.64%) Mean Absolute Percentage Error (MAPE) compared to the standard Holt’s method (~16.27%), indicating improved forecasting accuracy. Makoni & Chikobvu [63] employed SARIMA to model to forecast new car sales in South Africa and to assess the impact of GCF on the new car sales. After training their SARIMA model on the historical data from January 1998 to July 2006, they forecasted the new car sales from August 2006 to December 2023. Subsequently, they compared the actual sales with the forecasted sales to assess the impact of GFC. Their best SARIMA model showed a very low MAPE value (0.0003%), suggesting very high accuracy in the model’s forecasting ability.
Table 5.
Summary of the forecasting studies applying only statistical methods.
Table 5.
Summary of the forecasting studies applying only statistical methods.
| Study | Type of Data | Methods Used | Performance Indices Used |
|---|---|---|---|
| Aydınalp Köksal et al. [64] | Yearly car registration in Türkiye from 1994 to 2018 | ARIMA | MAPE |
| Babai et al. [37] | Two years of monthly demand data for 3000 SKUs | CM, SBA, SY, TSB, SES, Naïve method | ME, MSE, MASE |
| Chen et al. [60] | Monthly sales data of the R automobile brand from July 2016 to April 2018 | ARIMA, ARIMA So, ARIMA with So + CompSentiment | MAPE |
| Chen [58] | Automobile monthly sales data from January 2001 to June 2011 | ARIMA | RMSE, MAE, MAPE, TIC, Bias Prop, Variance Prop, Covariance Prop |
| Fantazzini & Toktamysova [33] | Monthly sales data for twenty-two automobiles brands in Germany from January 2001 to June 2014 | VEC, VAR, Bayesian VAR, UTS, PECM, SETAR, LSTAR, Additive AR | MSPE MCS |
| Homolka et al. [59] | Monthly car sales data of 21 European countries from January 2010 to December 2017 | VAR | MSE, MAPE |
| Leenawong & Chaikajonwat [62] | Monthly data on car sales from January 2015 to December 2021 | THM, HMS, HME, HMSE | MAPE |
| Maistor et al. [65] | Monthly registration of passenger cars in the EU from 2000 to 2012 | AR(3), AR(7), SES | MAE, MSE, MAPE |
| Makoni & Chikobvu [63] | Monthly data on new car sales in South Africa from January 1998 to November 2022 | SARIMA | MAPE, RMSE |
| Mares & Janicko [66] | Quarterly retail sales of motor vehicles and motorcycles from 2000 to 2019 in Czech automotive sector | VARX, VECM, ARIMA | MAPE, RMSE |
| Ngadono & Ikatrinasari [55] | Forecasting of PVB films used in Laminated glass of an automobile | ARIMA | |
| Qin et al. [57] | Monthly sales data of oil filter assembly from January 2015 to September 2020. | Prophet, ARIMA, EMD-prophet, EMD-ARIMA | MAPE, RMSE |
| Sa-ngasoongsong et al. [36] | Automobile monthly sales in the U.S. during the period of January 1975 to December 2010 | Quadratic trend, IMA, ARIMA, ADL, ARIMAX VEC, VAR, VARX | RMSE, MAPE |
| Srivastava et al. [61] | Monthly data of automobile sales in India from 2012 to 2021 | ARIMA | Visual inspection |
| Syntetos & Boylan [32] | Two years of monthly demand data for 3000 SKUs | SMA, SES, CM, SBA | ME, Scaled ME RGRMSE, PB, PBt |
| Widitriani et al. [56] | Eighty-one products, data from January 2016 until June 2019 | SES | MAPE |
3.2.3. AI-Based Methods
The 14 publications reviewed under this sub-section ranged from the year 2011 to 2025. Machine learning (ML) and deep learning (DL) are subsets of artificial intelligence (AI). These techniques enable systems to enhance their performance over time by learning from experience, rather than relying on explicit programming. They could play a key role in forecasting by identifying patterns in historical data to make informed predictions about future events [55,56]. The specific methods that are used in the forecasting of automobile industry include, among others random forest (RF), support vector regression (SVR), artificial neural networks (ANNs) and extreme gradient boosting [56,57,58,59]. It is noteworthy that unlike the traditional time series methods, the selection of ML method does not depend on the type of demands (for example smooth vs. intermittent).
Demand Forecasting of Automotive Spare Parts
Bottani et al. [67] investigated three ML techniques, namely, ANN, AdaBoost, and Gradient Boost to forecast eighteen automobile components such as nose, front spoiler, arms, and brake disks (Table 6). The dataset included explanatory variables like championship, number of cars, and car life cycle. They found AdaBoost to provide the highest prediction accuracy with RMSE of 0.07. De Souza & Camilo-Junior [68] developed a forecasting model for a specific product and its product group for an automotive distributing company in Brazil (Table 6). To achieve this objective, they developed artificial neural network (ANN) models with varying architectures, incorporating different combinations of layers, neurons, and execution strategies. They concluded that even with little input data the models displayed relatively low MAPE (ranged from −7.8% to 1.42%). Kamranfard & Kiani [10] compared the ANN and the regression model for sales forecasting of brake rubber (Table 6). They reported that ANN (MAPE of ~465%) performed better than regression model (MAPE ~1062.8). Tebaldi et al. [69] employed ANN to forecast eighteen automobile components for an automobile company based in Italy (Table 6). They formulated two ANN forecasting models by incorporating various related influencing factors such as the number of races, the car life cycle, and several types of car championship. Moreover, the two ANN models differ primarily in how they partition historical data into training, testing, and holdout phases. Model 1 used a pre-fixed percentage for data allocation, while Model 2 introduced a partitioning variable for this purpose. Comparison of the errors in these two models indicated that Model 1 (with holdout phase) showed a lower error rate (35.9%) compared to Model 2 (51.5%) on the test dataset. Andersson & Siminos [14] used RF to forecast automobile spare parts (Table 6). They evaluated the prediction model over three horizons: 1, 3 and 6 months. They showed that their implementation of RF achieves the accuracy of 70% or above.
Demand Forecasting of Automobiles
Kato [70] used multivariate regression models (Table 6) to forecast the demand of two types of cars (namely, Hatchback and Minivan) monthly for up to 36 months ahead. To this end, they developed five multivariate regression models considering various socioeconomic factors such as yearly GDP and yearly population size as well as other external factors such as earthquakes and subsidies. They concluded that the models incorporating the eco car subsidies had the lowest total error and MAPE among all the tested models. Ramírez et al. [71] employed ML techniques to predict total industry volume (TIV) using macroeconomic indicators as predictors (Table 10). Additionally, they analyzed the impact of the COVID-19 pandemic on sales forecasts of automobile companies in Mexico. To this end, they applied linear regression, random forest (RF), and neural network approaches on the monthly sales data. They observed the lowest MSE (19.56) for RF among all the applied methods. Kim [72] aimed to develop a vehicle demand forecast model by incorporating various explanatory variables in ML and DL techniques. He applied techniques such as Stack ensemble learning, RF, ANN, and SGD. The evaluation of these methods revealed that the Stack learner’s performance (RMSE of 117.79) in predicting automobile retail demand outperforms the rest. Further, he found that among all exogenous variables (Table 10), house price and stock index had the most potent effect on the prediction of car sales. To consider the large number of features that can influence the demand of passenger car sales, Liu et al. [73] proposed Deep Factorization Machine-based non-parametric model (DFMNP). They showed that DFMNP had the lowest MAE and RMSE compared to other ML-based forecasting techniques such as MLP, convolutional autoencoder and factorization machines.
Forecasting models have also been employed to predict the market demand and adoption trends of unconventional vehicles, such as Low-Cost Green Cars (LCGCs) and new electric vehicles (NEVs). These models serve as essential tools for policymakers, automotive manufacturers, and investors as they help to make informed decisions based on projected consumer behavior [74,75]. For example, Anwar et al. [74] utilized LSTM for demand forecasting of LSGC cars in India. They explored the effect of different hyperparameter choices on model accuracy, such as Neuron units (values such as 6, 9, 12, 15), epochs (values such as 25, 50, 100 and 150), and dropout rates (such as 0.05, 0.1, 0.3 and 0.4). The results showed that LSTM could predict the demand of LSGC with an MAE of up to 977.6 and an MAPE of 6.8%. Arora et al. [75] employed deep learning models to predict EV stock in 2030 for Delhi. To this end, they applied three DL models: Vanilla LSTM, bidirectional LSTM, and convoluted neural networks (CNNs). They also included explanatory variables such as fuel price, per capita net state domestic product (NSDP). They observed the lowest RMSE of 0.0452 for bidirectional LSTM. To predict the monthly sales of NEV of a Chinese group, FAW, Liu et al. [76] applied four different algorithms namely, CNN, feedforward neural network (FNN), MLP, and ensemble method (combining the outputs of the mentioned three methods). Based on the performance indices obtained, they showed that the ensemble method (RMSE of 0.05) outperformed the individual method (RMSE ranged from 0.10 to 0.14).
Table 6.
Summary of the forecasting studies applying only AI methods.
Table 6.
Summary of the forecasting studies applying only AI methods.
| Study | Type of Data | Methods Used | Performance Indices Used |
|---|---|---|---|
| Anwar et al. [74] | Monthly car sales data from September 2013 to December 2021 | LSTM | MAE, MAPE |
| Arora et al. [75] | Yearly data from EV sales in Delhi from 2012 to 2020 | LSTM | RMSE |
| Bottani et al. [67] | Quarterly data from 2013 to 2018 of automobile components of an Italian automobile company | ANN, AdaBoost, Gradient Boost | R2, RMSE |
| De Souza & Camilo-Junior [68] | Weekly data consisting of a total of 465 samples. The samples consisted of a specific product and its group from an automotive distributing company in Brazil | ANN | MAPE |
| Godata & Irmawati [77] | Sales call recording data obtained from a Japanese automobile manufacturer | RF, LR, SVM, XGBoost, AdaBoost, DNN | Accuracy, Precision, Recall, F1-score, AUC-ROC |
| J. Andersson & E. Siminos [14] | Five years data of spare parts from an automotive industry | RF | |
| Kato [70] | Monthly sales time series data of the car body types from 2000 to 2016 | MRM | MAPE, Total error |
| Kim [72] | Monthly car sales data from January 2011 to October 2020 | LR, NN, RF, SGD, Ensemble method | MSE, RMSE, MAE, R2 |
| Liu et al. [73] | Monthly sales of passenger cars in a city from 2012 to 2017 | CAE, FM MLP DeepFM-based non-parametric model | RMSE, MAE |
| Liu et al. [78] | Monthly sales data of NEV from FAW group of China from 2019 to 2023 | CNN, FNN, MLP, Ensemble method (integrating the three algorithms) | MAE, MSE, RMSE, R2, EVS |
| M. Kamranfard & K. Kiani [10] | Monthly sales data (except for December months) of brake rubber from 1999 to 2007 for 1600 pickup trucks manufactured by Iran-based company | ANN, LR | MAPE |
| Ramírez et al. [71] | Monthly sales of automobiles in Mexico from 2010 to 2019 | LR, RF, NN | MSE, MEA, R2 |
| Shahabuddin [9] | Quarterly data from 1959 to 2006 on total automobile sales in the USA | MRM | R2 |
| Tebaldi et al. [69] | Quarterly data of eighteen automobile components from 2013 to 2018 | ANN | Simple difference between observed and real values |
Recent studies have also used customer behavior and emotional parameters to forecast product sales. For example, Godata & Irmawati [77] applied traditional and deep learning models to predict the success of automobile sales. A primary dataset of sales conversations was processed into numerical data based on 11 acoustic features, such as pitch and speech rate. This processed data was later provided as inputs to various traditional ML techniques and DL techniques. Their results suggested that DNN outperformed (accuracy ~77%) all other ML and DL techniques (accuracy ranged from ~50% to ~62%).
3.2.4. Mathematical Models
The five publications reviewed under this sub-section ranged from the year 1982 to 2022 (Table 7). In these publications, methods like gray prediction models, Group Method of Data Handling, and stochastic forecasting models are used. These methods are based on mathematical theories/assumptions that extend beyond traditional statistical or AI-based methods.
Group Method of Data Handling (GMDH)
It is a heuristic self-organizing approach that identifies the best solution by generating and evaluating many models with various combinations of input variables [78]. It is used for selection of variables that have a strong influence on forecasts. It is used in the forecasting of stock price prediction, weather forecast and energy demand estimation [79]. Nishikawa and Shimizu [6] applied GMDH to forecast the net car sales of the Japanese automotive industry (Table 7).
Stochastic Forecasting Models
A stochastic forecasting model is a statistical method used to predict future values by incorporating random variables and simulating various outcomes. Hong et al. [80] developed a stochastic forecasting model which is designed to estimate and predict the demand for service parts of an automotive industry by considering the inherent randomness in part failures and replacements (Table 7). It incorporates various parameters such as failure rates, replacement probabilities, and product population levels to provide an accurate forecast.
Table 7.
Summary of forecasting studies using mathematical models.
Table 7.
Summary of forecasting studies using mathematical models.
| Study | Type of Data | Methods Used | Performance Indices Used |
|---|---|---|---|
| Jun et al. [81] | Yearly private vehicle holdings of a given area from 2002 to 2014 | GM(1,1), BP neural network, combined model | MAE, MAPE |
| Li et al. [82] | Yearly automobile sales in China from 2006 to 2018 | GM(1,1), GM(1,1,4) | MRSPE |
| Nishikawa & Shimizu [6] | Time series data from the Japanese automotive industry for forecasting net car sales | GMDH | RMSE |
| Yongzhi [83] | Yearly historical car production from 2002 to 2009 of China, USA, and Japan | GM(1,1) | AARE, MAE, RMSE |
| Zhang & Wang [84] | Yearly sales data of Automobile spare parts from year 2011 to 2020 | GM(1,1) | Absolute value of relative error |
Gray Prediction Model
The gray prediction model is a forecasting model used to predict trends in systems with incomplete information. It is effective for short-term forecasting and small sample sizes. It has been widely used in prediction in various fields. Zhang and Wang [84] used GM(1,1) to predict the yearly sale of automobile spare parts Their models showed a prediction accuracy of 97%. Similarly, Yongzhi & Tan [83] used this model to predict the yearly sales of cars in China, USA, and Japan. Li et al. [82] proposed a new structure for gray system model, GM(1,1,4), to forecast the automobiles ownership in China. They showed that the simulation and prediction performance of the new model were better than those of traditional gray prediction models.
3.2.5. Hybrid Models
The two publications reviewed under this sub-section ranged from the year 2023 to 2024. Hybrid models combining traditional time series techniques such as ARIMA or mathematical models like GM(1,1) with ML and DL techniques like LSTM are becoming increasingly prominent in forecasting applications. Such models aim to leverage the strengths of both linear statistical methods and nonlinear learning algorithms to improve the accuracy of forecast across various domains [85]. These hybrid models can have various structures: (1) Parallel hybrid structure [86]: In this approach, raw data is given simultaneously to individual models. Later, their individual predictions are combined by giving weighted average. (2). Series hybrid structure, Zhang [87]: in this approach, time series is decomposed into linear and nonlinear parts and model them using classical time series techniques such as ARIMA and ML-based techniques such as MLP and LSTM, respectively. (3). Parallel–series hybrid structure [85]: this approach leverages the advantage of both the above-mentioned structures by first, in the parallel phase, giving data simultaneously to individual models and later, in the series phase, the output of first model along with the actual data are given to the second model in a sequential form.
ARIMA can also be combined with DL-based methods such as LSTM to increase accuracy. For example, Ning et al. [88] showed that series hybrid structure (by combining ARIMA and LSTM) performed superior to any of the individual models in forecasting the demand of new energy vehicles (NEVs) (Table 8). More recently, Wangkamphu [89] evaluated traditional, machine learning, and hybrid models for forecasting automotive battery sales in Thailand, also integrating economic indicators into the models (Table 10). They found that the hybrid ANN–LSTM approach achieved the highest accuracy, with an average MAPE of 8.83% (Table 8).
Table 8.
Summary of forecasting studies using hybrid models.
Table 8.
Summary of forecasting studies using hybrid models.
| Study | Type of Data | Methods Used | Performance Indices Used |
|---|---|---|---|
| Long et al. [90] | Monthly sales data of specific automobile brands from January 2019 to December 2022 | GM(1,1), LSTM, GM(1,1)-LSTM | RMSE |
| Ning et al. [88] | Monthly sales of NEV in China, starting from January 2018 to March 2023 | ARIMA, ARIMA-IO, LSTM, ARIMA-IO-LSTM, GBDT | MAE, RMSE, R2, em |
Other mathematical models such as GM(1,1) have also been paired with neural network models and LSTM to improve the forecasting accuracy. For instance, Long et al. [90] also showed that hybrid GM(1,1)-LSTM showed superior performance in forecasting car sales compared to the individual models.
3.2.6. Comparative Performance Studies
The 19 publications reviewed in this sub-section span from 2014 to 2024. With the increasing demand for accurate forecasting in the automotive industry, researchers have more frequently examined the comparative strengths of traditional statistical, machine learning, and other mathematical forecasting models. This section reviews studies that assessed these approaches across different areas of the automotive sector, focusing on performance metrics, model interpretability, and the contexts where one method may outperform another. The aim is to identify trends in forecasting methodologies by emphasizing common findings.
Demand Forecasting of Automotive Spare Parts
As mentioned elsewhere in the paper, predicting spare parts, especially with intermittent demand, is a complicated task. Comparative studies in this area provide valuable insights into how different approaches perform. The reviewed literature suggests that no single forecasting method consistently outperforms others across all situations. It often depends on factors such as data characteristics, demand patterns, influencing variables, and the forecasting horizon.
Studies have shown that traditional time series models can perform as well as machine learning methods. In fact, in some cases, it may even outperform ML. For example, Vargas & Cortes [91] compared classical time series forecasting methods (ARIMA and exponential smoothing) with ANN to forecast the monthly demand of automotive spare parts in Mexico (Table 9). They observed that compared to ANN, classical methods were more straightforward to implement. Further, they also reported that classical forecasting methods were more accurate overall, while ANN showed inconsistency in post-sample forecasts. Similarly, Farimani et al. [92] compared ARIMA with MLP for eight automotive spare parts. They showed that ARIMA achieved higher prediction accuracy in six of the eight cases (Table 9).
The forecasting horizon also influences the relative performance of methods. Gonçalves et al. [34] applied a multivariate approach to predict the demand for automotive components across different horizons. To achieve this, they incorporated internal leading indicators of demand shifts (Table 9). They assessed ARIMAX, the Naïve method, MLP, and ANN at various stages of the product life cycle, such as launch, maturity, and end-of-life. They found that although MLP achieved the highest accuracy, ARIMAX offered the most reliable forecasts during the launch stage.
Including relevant external factors can also influence method performance. Turkbayragi et al. [93] applied MLMs and ANN to identify key external drivers of aftermarket sales in the Turkish automotive sector. They demonstrated that ANN (MAPE of 8.26%) outperformed MLMs (MAPE of 19.52%). Similarly, Abdellatief et al. [94] used ANN to forecast automotive sales in the Egyptian market, incorporating several economic variables to improve accuracy. Their ANN model achieved a lower RMSE (190.9) compared to other approaches (Table 9).
Other studies have also shown an improvement in forecast accuracy by data structuring. For instance, Rozanec et al. [38] showed that combining similar product types into a single series during training stage yielded better results than training on individual spare part histories. In their six-week horizon forecasts, which included products with demand patterns from smooth to intermittent, SVR, voting ensembles, and RFR outperformed both other AI-based methods and traditional statistical approaches (Table 9).
Furthermore, Rozanec et al. [95] introduced a hybrid method, CatBoost, for products with lumpy and intermittent demand. They showed that, compared to various traditional and machine learning methods, CatBoost achieved significantly higher accuracy. Deep learning approaches, such as those based on LSTM, have also proven to be effective in forecasting. For instance, Oukassi et al. [96] demonstrated that an LSTM with sequence-to-sequence architecture outperformed ARIMA for automotive spare parts demand. Soto-Ferrari et al. [42] applied the Postponement Bagged LSTM (POSTBaLSTM) to printed circuit boards (PCBs) used in the automotive industry. They reported 43% reduction in forecast errors compared to traditional methods (Table 9).
To summarize, these studies suggest that although traditional time series models remain competitive for stable demand and specific forecast horizons, incorporating external factors, restructuring training data, and leveraging hybrid or deep learning-based approaches can yield substantial improvements. This is especially true for the product with complex and intermittent demand patterns.
Demand Forecasting of Automobiles
Several studies have examined forecasting approaches applied to automobile sales and registrations, often integrating external variables to improve accuracy. Hülsmann et al. [97] developed time series and machine learning models to predict new car registrations and sales in the USA and German markets, incorporating a range of exogenous variables influencing demand (Table 9). Among the methods tested, support vector machines (SVMs) emerged as the most reliable, achieving a MAPE of 7.65. Similarly, Lacic et al. [98] compared SARIMA, LSTM–RNN, simple linear, and naïve seasonal models to forecast monthly and annual car registrations for 33 brands in Austria (Table 9). Their results showed that SARIMA outperformed all other methods, including LSTM–RNN.
Researchers have focused on utilizing novel data sources and additional explanatory variables in their forecasting models. Wachter et al. [99] built multivariate regression models incorporating Google Trends data alongside economic indicators, finding that this combination improved monthly U.S. car sales forecasts by 27% compared to a seasonal autoregressive benchmark. Fortsch et al. [100] evaluated linear and nonlinear forecasting models for the U.S. automotive industry (Table 9), showing that including historical sales data from competitors significantly enhanced the accuracy of their linear models.
Hasheminejad et al. [101] investigated application of combining adaptive network fuzzy inference system and particle swarm optimization (ANFIS-PSO) (Table 9) to forecast the auto sales for the Iranian auto industry. They also used many explanatory variables in their model. Compared to the traditional methods such as ARIMA and DL method such as ANN, their approach showed higher predictive accuracy (~96%). Yang [102] used multiple linear regression and ARIMA to forecast the sales of new energy vehicles from 2023 to 2032. Additionally, they also identified several economic and technological factors such as the average amount of government subsidies, oil price, and urbanization level that influence the demand of NEVs.
Zhang et al. [103] formulated a quantitative model based on Markov chains to forecast the penetration of autonomous vehicles (AVs) in the automotive market of China. For comparison, they also used various time series, statistical and DL-based methods (Table 9). They showed that their method had the lowest MAPE and MAE among all the methods tested.
Table 9.
Summary of the forecasting studies comparing AI models with traditional time series models.
Table 9.
Summary of the forecasting studies comparing AI models with traditional time series models.
| Study | Type of Data | Methods Used | Performance Indices Used |
|---|---|---|---|
| Abdellatief et al. [94] | Monthly sales data of automotive sales in Egypt | ANN, ANFIS, MR | RMSE, MSE, MAE, R2 |
| Farimani et al. [92] | Monthly data from the Automotive parts industry over a 6-year period involving 187-Y family products | MLP, ARIMA | MSD, RMSE, MAD, MAPD |
| Fortsch et al. [100] | Seasonally adjusted monthly data obtained from the “U.S. Automotive News” from January 2006 to December 2015 | SUR, Nonlinear prediction model | MAPE, RMSE, R2 |
| Gonçalves et al. [34] | Weekly sales data for the automotive component, from 2008 to 2016 | ARIMAX, MLP, SVR, RF, Naïve method, Theta, ARIMA, Elman RNN, Automated ML | Normalized MAE |
| Hasheminejad et al. [101] | Annual car sales data in Iran from 1990 to 2020 | Two-step clustering, ANN, ANFIS-PSO | RMSE |
| Hülsmann et al. [97] | Quarterly automobile sales in the USA automobile market from 1970 to 2005. Monthly new car registration in Germany from 1992 to 2007 | MA, ESMA, Fourier method, OLS, SVM, Decision tree, KNN, RF | MAPE |
| Lacic et al. [98] | Monthly car registration data from Porsche Austria, covering thirty-three individual car brands from 2010 to 2016 | Simple linear baseline, Naïve seasonal, SARIMA, LSTM-RNN | MAE, RMSE, MAPE, MASE |
| Lin et al. [104] | Monthly automobile sales of Chinese automotive production from 2004 to 2011 | GM(1,1), ANN | AARE, MAE, RMSE |
| Oukassi et al. [96] | Weekly demand for over one year for fifty-four different automotive spare parts | LSTM with Seq-2-Seq architecture, ARIMA | MAE, RMSE |
| Rozanec et al. [38] | Monthly data for automotive spare parts for seven years | Naïve, MLR, SVR, MLP, Ridge regression, Lasso regression, Elastic Net, KNNR, DTR, RFR, GBRT, Voting ensemble, Stacked regression, Adaptive RF, Hoeffding tree, ES, Random walk, ARIMA(1,1,0), ARIMA(2,1,0), MA(3) | MASE, R2 |
| Rozanec et al. [95] | Daily demand of 279 automotive materials over a period of 3 years | Croston’s method, SBA, TSB, ADIDA, MC + RAND, NN + SES, ELM, VZadj, CatBoost | AUC-ROC, MASE, SPEC |
| Soto-Ferrari et al. [42] | Monthly demand for fabricating PCBs from February 2019 to February 2022 | ES, ARIMA, SVM, KNN, ANN, NNAR, RNN, LSTM, Stacked LSTM, Bagged LSTM | RMSE, MAPE, MAE |
| Turkbayragi et al. [93] | No information about collection of historical data of automotive aftermarket in Türkiye | ANN, MLR | MAD, MAPE, RMSE, RFSE |
| Vargas & Cortes [91] | Dataset is not described | ARIMA, ANN, ARIMA + ANN | MAPE |
| Wachter et al. [99] | Monthly car sales in the USA from January 2004 to January 2019 | MR, Seasonal AR base | MAE, RMSE |
| Wongkamphu et al. [89] | Monthly sale of automotive batteries from January 2018 to December 2023 | Holt’s linear trend, Holt–Winters seasonal, ARIMA, SARIMA, SARIMAX, ANN, LSTM, LSTM + ANN | MAE |
| Yang & Chen [105] | Monthly sales data of thirty-four key auto parts from a 4S shop in Shanghai, starting from January 2007 to April 2009 | SVR, ARIMA, MLR, Variable weight combined model | MAPE |
| Yang [102] | Annual sales of new energy vehicles in China, starting from 2013 to 2022 | MLR, ARIMA | |
| Zhang et al. [103] | Autonomous vehicle sales data of 44 months starting from May 2019 to December 2022 | MLR, ARIMA, VAR, SRNN, LSTM, Markov chain | MAE, MAPE |
3.3. Explanatory Variables Used in the Forecasting
The 21 publications reviewed under this sub-section ranged from 1982 to 2025. As described previously in this manuscript, the demand for automobiles and their spare parts is strongly affected by numerous factors. These factors can be included in the demand forecasting model to improve its accuracy. These factors can broadly be classified into two categories: internal (intrinsic) factors and external factors. In demand forecasting, intrinsic factors might include the product’s historical demand patterns, seasonality, trends, and the sales plan that are inherent to the product itself, independent of external influences. For example, Rozanec et al. [38] used the history of deliveries and sales plan of the product in the forecasting models. These can also include other leading indicators (for instance, other component/spare parts of the same system) whose shift in demand could affect the demand of the product itself [34]. External factors used in the forecasting models of the automotive industry can be economic indicators (Table 10), web and search data, or weather effects [105].
Table 10.
Overview of socioeconomic indicators applied in the forecasting models. Similar indicators are grouped and presented as a single entry.
Table 10.
Overview of socioeconomic indicators applied in the forecasting models. Similar indicators are grouped and presented as a single entry.
| Study | Macroeconomic Indicators | Consumer/ Household Indicators | Automotive Specific Indicators | Other Specific Indicators |
|---|---|---|---|---|
| Abdellatief et al. [94] | GDP per capita, exchange rate, inflation | – | Unit selling price | Petrol/diesel prices |
| Arora et al. [75] | NSDP | – | – | Fuel price |
| Köksal et al. [64] | GDP per capita, USD buying price | – | Unregistered vehicles | 15–64 age population |
| Fantazzini & Toktamysova [33] | GDP, Euro interbank rate, production index | CPI, consumer confidence, unemployment rate | – | Petrol price, building construction, |
| Hasheminejad et al. [101] | Dollar value, imports | Household income | – | Urban/rural population, urban households |
| Homolka et al. [59] | Short-term interest rate | Fuel price, public transport cost | Car registrations (domestic/export), Total confidence indicator | – |
| Hülsmann et al. [97] | GDP, interest rate, unemployment rate | Personal income, CPI | New car registration | Gasoline price, stock index, business confidence index |
| Kato [70] | Yearly GDP | – | – | Yearly population |
| Kim [72] | Interest rate, exchange rate, oil price, construction revenue | CPI, consumer spending, sentiment index, unemployment | Sales | Stock price index, construction revenue, house price |
| Mares & Janicko [66] | GDP (domestic/global), private consumption, fixed capital formation, industrial production, exports/imports | Average salary, retail sales, unemployment, | New car registration, vehicle manufacturing | – |
| Ning et al. [88] | GDP, disposable income | NEV subsidies, battery density | NEV ownership, driving range, charging pile ownership | Patents, lithium battery prices, gas prices, holidays |
| Nishikawa & Shimizu [6] | GNP | Household income, savings | Net car sales, registered cars, car exports | – |
| Ramírez et al. [71] | Global economic activity | Total daily salary | – | Relative price |
| Rozanec et al. [38] | GDP, PMI, copper price | unemployment | Car sales | Crude oil price, |
| Sa-ngasoongsong et al. [36] | – | CPI, unemployment rate | – | Gas prices, housing starts |
| Shahabuddin [9] | GNP, GDP, discount rate, cash money, money with institutional funds | Durable/non-durable consumption | – | Population |
| Türkbayragi et al. * [93] | CPI, PPI, exchange rates, trade turnover indices, | Economic/financial expectations, unemployment expectations, household spending | Vehicle traffic, spare part prices, repair sector data | Freight/passenger movement, bridge/highway stats, company data, Google search indices |
| Wachter et al. [99] | – | Consumer confidence, CPI, unemployment | – | Gasoline price, US stock market |
| Wongkamphu et al. 2025 [89] | GDP, GNI, inflation, loan rate, exchange rate | Income level | Car production, car ownership | Diesel/gasoline prices |
| Yang & Chen [105] | Monthly GDP | Disposable income, CPI | Vehicle production, family car capacity | – |
| Yang [102] | Per capita GDP | Disposable income | Oil price |
* Only key influencing factors are mentioned.
4. Discussion
In this systematic literature review (SLR), once the relevant publications had been identified and selected through the established inclusion and exclusion criteria (Figure 1), a short bibliographic analysis of the final dataset was conducted. This analysis included co-occurrence clustering of keywords, publication trends, and thematic patterns across the selected studies. The results (Figure 2 and Figure 3) revealed that the most frequently occurring keywords consistently align with the targeted research objectives of this review, thereby confirming the relevance of the collected literature with the intended scope of the study.
The analysis of 63 reviewed publications revealed that demand forecasting in the automotive industry covered a wide range of forecasting techniques from classical statistical and time series models to state-of-the-art artificial intelligence (AI)-based and hybrid approaches. In fact, studies like [47,48] also established the importance of qualitative methods like Delphi method in not only forecasting the automotive components but also in selecting the influencing variables affecting the vehicle demand. This approach especially is effective when carrying out the forecasting of the newly launched products [48].
Further, it also showed that, while traditional techniques, such as ARIMA, and exponential smoothing remain suitable and easy to implement for forecasting the product for stable or smooth demand such as in case of forecasting vehicles [56,57], AI-driven models, including random forests, LSTMs, and gradient boosting, have shown superior forecasting accuracy in certain cases such as products with complex demand patterns or in case of products having relatively large historical data [38,95]. Our analyses also revealed a clear shift in forecasting techniques used for the products with intermittent demand. For example, a seminal study such as [32] only used Croston’s intermittent demand forecasting. Recent studies, such as [56,57], also devised AI-based forecasting models suitable for intermittent demand forecasting. This shift reflects the increasing availability of large datasets, computational capacity, and the growing need to capture nonlinear relationships among influencing factors. Hybrid methods that integrate statistical rigor with machine learning flexibility show promise.
The findings of this review, to some extent, align with trends observed in other domains, such as energy forecasting [106], where AI and ensemble methods often outperform traditional models in case of large historical data. However, in the automotive context, challenges such as varying product life cycles and market volatility make method selection context dependent. Studies [34,91,92,93] comparing classical time series methods and ML methods for forecasting suggest that no single model universally dominates; rather, model performance depends on data granularity, forecast horizon, and inclusion of external factors such as fuel prices, GDP, or online sentiment. This reinforces the importance of model adaptability and multi-source data integration.
4.1. Challenges and Limitations
Demand forecasting, in general, is highly challenging because of several reasons, including frequent shifts in customer preferences, the evolution of new products, and the selection of appropriate forecasting methods [107]. These challenges became apparent in the automobile industry because a wide range of economic factors (such as fuel prices, global supply chain disruptions, interest rates) and environmental factors (such as climate policies, emission regulations) can swiftly shift product demand. This complexity makes it challenging to accurately forecast sales as multiple variables need to be considered simultaneously [33]. In multivariate models, selecting the right variables is crucial but can be subjective and lead to overfitting, which affects the model’s forecasting performance.
Inclusion of socioeconomic indicators such as GDP, exchange rates, and consumer confidence can complicate models as these factors are subject to change and can vary significantly across different regions. Events such as the global financial crisis (GFC) can significantly impact car sales, and many models do not account for such shocks, leading to inaccurate forecasts. Incorporating these factors into models remains a challenge [63].
Advanced forecasting models like the deep learning models such as LSTM require significant computational resources and time to train and tune, especially when dealing with large datasets. This can be a barrier for organizations with limited resources. Deep learning models, while powerful, lack interpretability, making it difficult to understand the underlying relationships between variables [91]. This can hinder the ability to make informed decisions based on the model’s output [42].
In many cases, intermitting demand of the automotive spare parts makes forecasting challenging. Studies have shown that traditional methods like Croston’s’ can produce biased estimates and therefore, alternative statistics, specifically for automotive spare parts, have been suggested [37,54]. A recent study by Rozanec et al. [95] proposed a hybrid approach, CatBoost, which outperformed the above-mentioned traditional methods.
The forecast horizon in the automotive industry can also pose a significant challenge because of long product development cycle. Ideally, the forecasts must extend several years into the future, thus increasing the risk of inaccuracy. While some models are effective for short-term forecasts, they may not perform well for long-term predictions due to the dynamic nature of the industry and changing economic conditions [33].
4.2. Future Directions
Review of the forecasting publications suggests that future research should focus on integrating advanced machine learning techniques, such as artificial neural networks (ANNs), AdaBoost, and Gradient Boost, to improve the accuracy of demand forecasts. These techniques have shown promise can be adapted widely for the automotive sector to enhance predictive capabilities [33]. Further, there is potential for wide adoption of hybrid models that combine traditional statistical methods with machine learning approaches. This integration can leverage the strengths of both methodologies to provide more robust and accurate forecasts [88,105].
Federated learning (FL), an approach in which the collaborating parties collectively train a shared model without exchanging their raw data, can also prove to be beneficial in improving the forecasting accuracy of the ML model. It not only presents a promising avenue but also preserves data privacy [108]. By allowing data to remain at its source and sharing only model updates, FL can leverage diverse datasets from various stakeholders without exposing sensitive or proprietary information. For instance, Yang et al. [109] showed that in forecasting the power-load, FL-based algorithm had the lowest MAPE when compared to other ML-based forecasting techniques such as XGBoost and SecureBoost. Complementing FL, dataspaces can facilitate secure and standardized data exchange across the automotive ecosystem while ensuring that organizations retain control of their data. Together, FL and dataspaces can enable richer, privacy-preserving data collaboration, ultimately improving the robustness and accuracy of forecasting models. In our 63 reviewed papers, we did not identify a single study implementing an FL-based approach in forecasting the automobile or its components. This highlights a significant research gap. Future studies could explore FL to combine data from distributed automotive sources.
While existing forecasting models often operate at macro or sectoral levels such as country-wide automobile sales or regional-wise automobile sales [33,105], they may fail to capture the nuanced operational, market, and supply chain realities faced by individual firms. By narrowing the focus to the firm level, researchers can develop models that incorporate specific variables such as sales history, production constraints, supplier performance metrics, and customer behavior trends. These tailored models would enhance the relevance and practical utility of forecasts, enabling managers to make more informed, timely, and strategic decisions. Further, incorporating real-time data from various sources, including IT systems and market trends, can significantly enhance the accuracy of forecasts. This approach allows for more dynamic and responsive forecasting models that can adapt to changing market conditions. In fact, expanding the range of exogenous variables considered in forecasting models can improve their predictive power. This includes factors such as economic indicators, consumer behavior trends, and technological advancements that influence automobile sales.
Lastly, efforts should also be made to overcome data limitations by increasing the size and diversity of datasets used in forecasting models. This includes collecting data that captures regional and industry-specific characteristics.
5. Conclusions
This study systematically and thoroughly reviewed the literature on forecasting in the automotive industry. In doing so, it successfully addresses the research questions that form its central objectives. In addressing RQ1, we aimed to investigate the broad range of forecasting methodologies and identify which models perform optimally with specific types of demand data. To this end, we reviewed a comprehensive set of forecasting approaches, encompassing both traditional time series models and advanced machine learning/deep learning techniques. This analysis offers insight into the evolution of forecasting methodologies over time, as well as provides key insights into how different demand patterns in the automotive industry (particularly intermittent versus smooth demand) influence the selection of appropriate forecasting models. Typically, demand forecasting within the automotive sector pertains to products with relatively smooth demand, for which most studies indicate that state-of-the-art machine learning methods tend to outperform classical time series approaches. However, evidence also indicates that for datasets with limited historical records, machine learning models may not always be the preferred choice. Furthermore, while traditional methods such as Croston’s technique and its variants have been commonly applied to forecast intermittent demand for automotive spare parts, recent research indicates that specific machine learning algorithms, such as CatBoost, can achieve superior performance in these scenarios.
In addressing RQ2, our objective was to identify and analyze the key influencing factors that impact the demand for automobiles and their spare parts. To this end, we systematically categorized the diverse explanatory variables employed across the reviewed studies into two main groups: internal factors (e.g., sales history, inventory levels) and external factors (e.g., economic indicators, fuel prices, weather conditions). Notably, certain variables, such as GDP and fuel prices, were consistently used in most studies, underscoring their significance in enhancing forecast performance.
In addressing RQ3, our objective was to identify common limitations and challenges in forecasting the products of the automobile industry. To this end, we identified several key challenges that persist in this domain, including data availability, model interpretability, forecasting horizon, and the complexity of integrating multi-source, real-time data. Identifying these challenges provides valuable guidance for researchers by highlighting critical areas where methodological advancements and practical solutions are needed. This, in turn, can drive the development of more robust and scalable forecasting models tailored to the unique demands of the automotive sector.
Furthermore, to address RQ4, this review offers insight into emerging trends in forecasting within the automotive industry. It identified several avenues that researchers can use to improve the forecasting accuracy in the automotive industry. These avenues include the application of hybrid models and the inclusion of diverse sets of influencing variables (such as online reviews, customer feedback).
Although comprehensive, this systematic review has certain limitations. First, the coverage of forecasting for automobile spare parts may not be exhaustive because some components that are essential to the broader automotive industry might have been unintentionally overlooked. Second, this review also has not dealt with how forecasting is associated with other important managerial decisions such as inventory control, replenishment, and pricing.
Despite its limitations, this review provides valuable directions for future research. Expanding the scope to cover a broader range of spare parts and linking forecasting models with wider operational strategies could provide deeper insights into improving supply chain performance. Future studies should also examine how new technologies such as connected vehicles and AI-based decision systems can improve the accuracy and flexibility of forecasts. As the automotive industry evolves toward electric and new energy vehicles, continued targeted reviews remain essential. Overall, this study lays a foundation for advancing data-driven forecasting methods that address the evolving needs of the automotive sector.
Author Contributions
N.R.: Conceptualization, Formal analysis, Validation, Investigation, Writing, Visualization. S.B.: Conceptualization, Writing—Review and Editing, Methodology, Supervision. M.P.: Conceptualization, Writing—Review and Editing, Methodology, Supervision. P.P.: Conceptualization, Writing—Review and Editing, Methodology, Supervision. All authors have read and agreed to the published version of the manuscript.
Funding
This work was financed by the Portuguese Foundation for Science and Technology (FCT) and UE/FEDER through COMPETE 2030, of projects COMPETE2030-FEDER-00778700, UID 00481/2025—Centre for Mechanical Technology and Automation, https://doi.org/10.54499/UID/00481/2025, and LA/P/0104/2020. It was also supported by projects 2022.05783.PTDC (https://doi.org/10.54499/2022.05783.PTDC) and 2023.14606.PEX (https://doi.org/10.54499/2023.14606.PEX), funded by the Portuguese Foundation for Science and Technology.
Acknowledgments
The author, Nehalben Ranabhatt, expresses sincere gratitude to Wilhelm Ruckdeschel, Head of the Center for Digitalization in Mobility Systems (ZDM) at DHBW Ravensburg, Campus Friedrichshafen, for his valuable mentorship and support. Appreciation is also extended to the ZDM Department for their assistance and encouragement throughout this research.
Conflicts of Interest
The authors declare that they have no known competing financial interests or personal relationships that could have appeared to influence the work reported in this paper.
Abbreviations
The following abbreviations are used in this manuscript:
| Forecasting Methods Abbreviations | ||
| Abbreviation | Full Form | Model Type |
| AdaBoost | Adaptive Boosting | ML |
| ANN | Artificial Neural Network | ML |
| Gradient Boost | Gradient Boosting | ML |
| Additive AR | Additive Autoregressive | Statistical |
| ADIDA | Aggregate–Disaggregate Intermittent Demand Approach | Statistical |
| ADL | Autoregressive Distributed Lags | Statistical |
| ANFIS | Adaptive Neuro-Fuzzy Inference System | ML |
| ANFIS-PSO | Adaptive Neuro-Fuzzy Inference System with Particle Swarm Optimization | ML |
| AR(3) | Autoregressive model with lag 3 | Statistical |
| AR(7) | Autoregressive model with lag 7 | Statistical |
| ARIMA | Autoregressive Integrated Moving Average | Statistical |
| ARIMA with So | ARIMA with the variable representing brands’ own sentiment (So) | Statistical |
| ARIMA with So + CompSentiment | ARIMA including both the brand’s own sentiment (So) and competitive brands’ sentiment | Statistical |
| ARIMA-IO | Autoregressive Integrated Moving Average with Intervention/Outlier | Statistical |
| ARIMA-IO-LSTM | Hybrid Model of ARIMA with Outlier Handling and LSTM | Hybrid |
| ARIMAX | Autoregressive Integrated Moving Average with Exogenous Variables | Statistical |
| Bagged LSTM | Bagged (Bootstrap Aggregated) Long Short-Term Memory | ML |
| Bayesian VAR | Bayesian Vector Autoregression | Statistical |
| BP Neural Network | Backpropagation Neural Network | ML |
| CAE | Convolutional Autoencoder | ML |
| CatBoost | Categorical Boosting | ML |
| CM | Croston’s Method | Statistical |
| CNN | Convolutional Neural Network | Statistical |
| DeepFM | Deep Factorization Machine | ML |
| DNN | Dense Neural Network | ML |
| DTR | Decision Tree Regressor | ML |
| Elastic Net | Elastic Net Regression | ML |
| ELM | Extreme Learning Machine | ML |
| Elman RNN | Elman Recurrent Neural Network | ML |
| EMD-ARIMA | Empirical Mode Decomposition combined with ARIMA | Statistical |
| EMD-Prophet | Empirical Mode Decomposition combined with Prophet | Statistical |
| ES | Exponential Smoothing | Statistical |
| ESMA | Exponential Smoothing Moving Average | Statistical |
| FM | Factorization Machines | ML |
| FNN | Feedforward Neural Network | ML |
| GBDT | Gradient Boosting Decision Tree | ML |
| GBRT | Gradient Boosted Regression Tree | ML |
| GM(1,1) | Gray Model of order (1,1) | Mathematical |
| GM(1,1) | Gray Model (First-order, One Variable) | Mathematical |
| GM(1,1,4) | Gray Model with Multi-Step Forecast Horizon | Mathematical |
| GMDH | Group Method of Data Handling | Mathematical |
| HME | Holt’s Method with Events | Statistical |
| HMS | Holt’s Method with Seasonality | Statistical |
| HMSE | Holt’s Method with Seasonality and Events | Statistical |
| IMA | Integrated Moving Average | Statistical |
| KNN | K-Nearest Neighbors | ML |
| KNNR | K-Nearest Neighbors Regressor | ML |
| LR | Logistic Regression | ML |
| LSTAR | Logistic Smooth Transition Autoregressive | ML |
| LSTM | Long Short-Term Memory | ML |
| LSTM-RNN | Long Short-Term Memory Recurrent Neural Network | ML |
| MA | Moving Average | Statistical |
| MC + RAND | Markov Chain + Random selection | Mathematical |
| MLP | Multilayer Perceptron | ML |
| MLR | Multiple Linear Regression | ML |
| MR | Multiple Regression | ML |
| MRM | Multivariate Regression Models | ML |
| NN | Neural Networks | ML |
| NN + SES | Neural Network + Simple Exponential Smoothing | Hybrid |
| NNAR | Neural Network Auto Regression | Hybrid |
| OLS | Ordinary Least Squares | ML |
| PECM | Periodic Error Correction Models | Statistical |
| PSO | Particle Swarm Optimization | Mathematical |
| RF | Random Forest | ML |
| RFR | Random Forest Regressor | ML |
| SARIMA | Seasonal Autoregressive Integrated Moving Average | Statistical |
| SBA | Syntetos and Boylan’s modified method | Statistical |
| SES | Simple Exponential Smoothing | Statistical |
| SETAR | Self-Exciting Threshold Autoregressive | Statistical |
| SGD | Stochastic Gradient Descent | ML |
| SMA | Simple Moving Average | Statistical |
| SRNN | Simple Recurrent Neural Network | ML |
| Stacked LSTM | Stacked Long Short-Term Memory | ML |
| SUR | Seemingly Unrelated Regression | Mathematical |
| SVM | Support Vector Machine | ML |
| SVR | Support Vector Regressor | ML |
| SY | Syntetos & Boylan [32] | Statistical |
| THM | Typical Holt’s Method | Statistical |
| TSB | Teunter–Syntetos–Babai Method Babai et al. [37] | Statistical |
| UTS | Univariate Time Series models | Statistical |
| VAR | Vector Autoregression | Statistical |
| VARX | Vector Autoregression with Exogenous Variables | Statistical |
| VECM | Vector Error Correction Model | Statistical |
| XGBoost | Extreme Gradient Boosting | ML |
| Evaluation Metrics Abbreviations | ||
| Abbreviation | Full Form | |
| AARE | Average Absolute Relative Error | |
| AUC-ROC | Area Under the Curve-Receiver Operating Characteristic | |
| Bias Proportion | Bias Proportion (of forecast error) | |
| Covariance Proportion | Covariance Proportion (of forecast error) | |
| EVS | Explained Variance Score | |
| MAD | Mean Absolute Deviation | |
| MAE | Mean Absolute Error | |
| MAPD | Mean Absolute Percentage Deviation | |
| MAPE | Mean Absolute Percentage Error | |
| MASE | Mean Absolute Scaled Error | |
| MCS | Model Confidence Set | |
| ME | Mean Error | |
| MRSPE | Mean Relative Simulation Percentage Error | |
| MSD | Mean Squared Deviation | |
| MSE | Mean Squared Error | |
| MSPE | Mean Squared Prediction Error | |
| Normalized MAE | Normalized Mean Absolute Error | |
| PB | Percentage Better | |
| PBt | Percentage Best | |
| PCBs | Printed circuit boards | |
| R2 | Coefficient of Determination (R-squared) | |
| RFSE | Running Sum of Forecast Error (RFSE) | |
| RGRMSE | Relative Geometric Root Mean Square Error | |
| RMSE | Root Mean Square Error | |
| Scaled ME | Scaled Mean Error | |
| SPEC | Stock Keeping-Oriented Prediction Error Cost | |
| TIC | Theil Inequality Coefficient | |
| Variance Proportion | Variance Proportion (of forecast error) | |
| General Abbreviations | ||
| Abbreviation | Full Form | |
| ANN | Artificial Neural Network | |
| EMD | Empirical Mode Decomposition | |
| HEVs | Hybrid Electric Vehicles | |
| MTO | Make-To-Order | |
| OEM | Original Equipment Manufacturer | |
| RQ | Research question | |
| SKUs | Stock keeping units | |
| EV | Electric Vehicle | |
| NEV | New Energy Vehicle | |
| NSDP | Net state domestic product | |
| GDP | Gross domestic product | |
| CPI | Consumer Price Index | |
| PMI | Purchasing mangers’ index | |
| GNI | Gross national income | |
References
- European Commission. Automotive Industry. In Single Market Economy. Available online: https://single-market-economy.ec.europa.eu/sectors/automotive-industry_en (accessed on 13 August 2025).
- Masoumi, S.M.; Kazemi, N.; Abdul-Rashid, S.H. Sustainable Supply Chain Management in the Automotive Industry: A Process-Oriented Review. Sustainability 2019, 11, 3945. [Google Scholar] [CrossRef]
- Orsato, R.J.; Wells, P. The Automobile Industry & Sustainability. J. Clean. Prod. 2007, 15, 989–993. [Google Scholar] [CrossRef]
- Fildes, R.; Ma, S.; Kolassa, S. Retail. forecasting: Research and practice. Int. J. Forecast. 2022, 38, 1283–1318. [Google Scholar] [CrossRef]
- Goodwin, P.; Hoover, J.; Makridakis, S.; Petropoulos, F.; Tashman, L. Business forecasting methods: Impressive advances, lagging implementation. PLoS ONE 2023, 18, e0295693. [Google Scholar] [CrossRef] [PubMed]
- Nishikawa, T.; Shimizu, S. Identification and forecasting in management systems using the GMDH method. Appl. Math. Model. 1982, 6, 7–15. [Google Scholar] [CrossRef]
- Kota, S.; Flynn, M.; Londal, G. Automotive Product Design and Development: Forecast and Analysis of the North American Auto Industry Trends Through 2007; SAE Technical Paper; SAE: Warrendale, PA, USA, 1999; ISBN 0148-7191. [Google Scholar]
- Kung, C.-Y.; Chao, C.; Chien, T.-L. An application of GM (1, 1) model for automobile industry. In Proceedings of the 2003 IEEE International Conference on Systems, Man and Cybernetics (SMC’03), Washington, DC, USA, 5–8 October 2003; pp. 3244–3250. [Google Scholar]
- Shahabuddin, S. Forecasting automobile sales. Manag. Res. News 2009, 32, 670–682. [Google Scholar] [CrossRef]
- Kamranfard, M.; Kiani, K. Sales forecast for pickup truck parts: A case study on brake rubber. In Proceedings of the 2012 2nd International eConference on Computer and Knowledge Engineering (ICCKE), Mashhad, Iran, 18–19 October 2012; pp. 180–184. [Google Scholar]
- Sanguansaringkhan, N.; Liu, H. Forecasting and inventory model for genuine automotive spare parts wholesale distributor. In Proceedings of the IIE Annual Conference, New Orleans, LA, USA, 30 May–2 June 2020; pp. 1–6. [Google Scholar]
- Alalawin, A.; Arabiyat, L.M.; Alalaween, W.; Qamar, A.; Mukattash, A. Forecasting vehicle’s spare parts price and demand. J. Qual. Maint. Eng. 2021, 27, 483–499. [Google Scholar] [CrossRef]
- Cruz, M.; Ramos, S.; Pina, M.; Costa, R. Order and Stock Costs Optimization in an Automotive Spare Parts Wholesaler. In Progress in Industrial Mathematics: Success Stories: The Industry and the Academia Points of View; Springer: Cham, Switzerland, 2021; pp. 145–170. [Google Scholar]
- Andersson, J.; Siminos, E. Spare parts demand prediction by using a random forest approach. In Proceedings of the IFIP International Conference on Advances in Production Management Systems, Trondheim, Norway, 17–21 September 2023; pp. 793–804. [Google Scholar]
- Chien, C.-F.; Ku, C.-C.; Lu, Y.-Y. Ensemble learning for demand forecast of After-Market spare parts to empower data-driven value chain and an empirical study. Comput. Ind. Eng. 2023, 185, 109670. [Google Scholar] [CrossRef]
- Rahman, M.A.; Sarker, B.R.; Escobar, L.A. Peak demand forecasting for a seasonal product using Bayesian approach. J. Oper. Res. Soc. 2011, 62, 1019–1028. [Google Scholar] [CrossRef]
- Soysal, G.P.; Krishnamurthi, L. Demand Dynamics in the Seasonal Goods Industry: An Empirical Analysis. Mark. Sci. 2012, 31, 293–316. [Google Scholar] [CrossRef]
- Kopyt, M. Power Flow Forecasts: A Status Quo Review. Part 2: Electricity Demand and Power Flow Prediction. Prz. Elektrotech. 2020, 1, 7–12. [Google Scholar] [CrossRef]
- Swaminathan, K.; Venkitasubramony, R. Demand forecasting for fashion products: A systematic review. Int. J. Forecast. 2024, 40, 247–267. [Google Scholar] [CrossRef]
- Zachariah, R.A.; Sharma, S.; Kumar, V. Systematic review of passenger demand forecasting in aviation industry. Multimed. Tools Appl. 2023, 82, 46483–46519. [Google Scholar] [CrossRef]
- Ferraa, O.; Touzi, B. AI and Supply Chain Resilience trends in the Automotive Industry: A Systematic Literature Review. In Proceedings of the 5th International Conference on Innovative Research in Applied Science, Engineering and Technology (IRASET), Fez, Morocco, 15–16 May 2025. [Google Scholar]
- Jebbor, I.; Hanaa, H.; Benmamoun, Z. Artificial Intelligence in Predicting Automotive Supply Chain Disruptions: A Literature Review. In Advances in Intelligent Systems and Digital Applications; Lecture Notes in Networks and Systems; Springer: Cham, Switzerland, 2025; pp. 11–21. [Google Scholar]
- Nha Trang, N.T.N.; Li, Y. Reverse supply chain for end-of-life vehicles treatment: An in-depth content review. Resour. Conserv. Recycl. Adv. 2023, 17, 200128. [Google Scholar] [CrossRef]
- Franco, M.A.; Groesser, S.N. A Systematic Literature Review of the Solar Photovoltaic Value Chain for a Circular Economy. Sustainability 2021, 13, 9615. [Google Scholar] [CrossRef]
- Haertel, C.; Donat, V.; Staegemann, D.; Daase, C.; Finkendei, M.; Turowski, K. The Application of Data Science at Original Equipment Manufacturers: A Literature Review. IEEE Access 2024, 12, 114584–114600. [Google Scholar] [CrossRef]
- Niyaz, M.T.; Qorri, D.; Kovács, K.; Juhasz, C. Research Trends in Workforce Planning in the Automotive Sector: A Comprehensive Review. Adm. Sci. 2025, 15, 140. [Google Scholar] [CrossRef]
- Prado, R.; Prado, E.P.V.; Grotta, A.; Barata, A.M. Benefits of the Enterprise Data Governance in Industry: A Qualitative Research. In Proceedings of the 23rd International Conference on Enterprise Information Systems (ICES), Prague, Czech Republic, 26–28 April 2021; Volume 2, pp. 699–706. [Google Scholar]
- Brereton, P.; Kitchenham, B.A.; Budgen, D.; Turner, M.; Khalil, M. Lessons from applying the systematic literature review process within the software engineering domain. J. Syst. Softw. 2007, 80, 571–583. [Google Scholar] [CrossRef]
- Page, M.J.; McKenzie, J.E.; Bossuyt, P.M.; Boutron, I.; Hoffmann, T.C.; Mulrow, C.D.; Shamseer, L.; Tetzlaff, J.M.; Akl, E.A.; Brennan, S.E. The PRISMA 2020 statement: An updated guideline for reporting systematic reviews. bmj 2021, 372, n71. [Google Scholar] [CrossRef] [PubMed]
- Tranfield, D.; Denyer, D.; Smart, P. Towards a methodology for developing evidence-informed management knowledge by means of systematic review. Br. J. Manag. 2003, 14, 207–222. [Google Scholar] [CrossRef]
- Siddaway, A.P.; Wood, A.M.; Hedges, L.V. How to Do a Systematic Review: A Best Practice Guide for Conducting and Reporting Narrative Reviews, Meta-Analyses, and Meta-Syntheses. Annu. Rev. Psychol. 2019, 70, 747–770. [Google Scholar] [CrossRef]
- Syntetos, A.A.; Boylan, J.E. The accuracy of intermittent demand estimates. Int. J. Forecast. 2005, 21, 303–314. [Google Scholar] [CrossRef]
- Fantazzini, D.; Toktamysova, Z. Forecasting German car sales using Google data and multivariate models. Int. J. Prod. Econ. 2015, 170, 97–135. [Google Scholar] [CrossRef]
- Gonçalves, J.N.; Cortez, P.; Carvalho, M.S.; Frazão, N.M. A multivariate approach for multi-step demand forecasting in assembly industries: Empirical evidence from an automotive supply chain. Decis. Support Syst. 2021, 142, 113452. [Google Scholar] [CrossRef]
- Gansterer, M. Aggregate planning and forecasting in make-to-order production systems. Int. J. Prod. Econ. 2015, 170, 521–528. [Google Scholar] [CrossRef]
- Sa-Ngasoongsong, A.; Bukkapatnam, S.T.; Kim, J.; Iyer, P.S.; Suresh, R. Multi-step sales forecasting in automotive industry based on structural relationship identification. Int. J. Prod. Econ. 2012, 140, 875–887. [Google Scholar] [CrossRef]
- Babai, M.Z.; Syntetos, A.; Teunter, R. Intermittent demand forecasting: An empirical study on accuracy and the risk of obsolescence. Int. J. Prod. Econ. 2014, 157, 212–219. [Google Scholar] [CrossRef]
- Rožanec, J.M.; Kažič, B.; Škrjanc, M.; Fortuna, B.; Mladenić, D. Automotive OEM demand forecasting: A comparative study of forecasting algorithms and strategies. Appl. Sci. 2021, 11, 6787. [Google Scholar] [CrossRef]
- Box, G.E.; Jenkins, G.M.; Reinsel, G.C.; Ljung, G.M. Time Series Analysis: Forecasting and Control; John Wiley & Sons: Hoboken, NJ, USA, 2015. [Google Scholar]
- Brown, R.G. Statistical Forecasting for Inventory Control; McGraw-Hill: Columbus, OH, USA, 1959. [Google Scholar]
- Winters, P.R. Forecasting Sales by Exponentially Weighted Moving Averages. Manag. Sci. 1960, 6, 324–342. [Google Scholar] [CrossRef]
- Soto-Ferrari, M.; Bhattacharyya, K.; Schikora, P. POST-BaLSTM: A Bagged LSTM forecasting ensemble embedded with a postponement framework to target the semiconductor shortage in the automotive industry. Comput. Ind. Eng. 2023, 185, 109602. [Google Scholar] [CrossRef]
- Mishra, M.; Mathew, D.J. A Qualitative Study on Color Trend Forecasting in the Futuristic Passenger Vehicles for Point-to-Point Commute in India. In Proceedings of the International Conference on Research into Design, Bangalore, India, 9–11 January 2023; pp. 51–59. [Google Scholar]
- Hird, A.; Kreiling, L. Expert judgement in resource forecasting. In Proceedings of the 23rd EurOMA Conference, Trondheim, Norway, 21 June 2016. [Google Scholar]
- Schoemaker, P. Scenario Planning: A Tool for Strategic Thinking. Sloan Manag. Rev. 1995, 36, 25–40. [Google Scholar]
- Rowe, G.; Wright, G. The Delphi technique as a forecasting tool: Issues and analysis. Int. J. Forecast. 1999, 15, 353–375. [Google Scholar] [CrossRef]
- Salais-Fierro, T.E.; Saucedo-Martinez, J.A.; Rodriguez-Aguilar, R.; Vela-Haro, J.M. Demand Prediction Using a Soft-Computing Approach: A Case Study of Automotive Industry. Appl. Sci. 2020, 10, 829. [Google Scholar] [CrossRef]
- Yamamura, C.L.K.; Santana, J.C.C.; Masiero, B.S.; Quintanilha, J.A.; Berssaneti, F.T. Forecasting new product demand using domain knowledge and machine learning. Res. Technol. Manag. 2022, 65, 27–36. [Google Scholar] [CrossRef]
- Mortlock, L.; Osiyevskyy, O. Strategic scenario planning in practice: Eight critical applications and associated benefits. Strategy Leadersh. 2023, 51, 22–29. [Google Scholar] [CrossRef]
- Zulkepli, J.; Fong, C.H.; Abidin, N.Z. Demand Forecasting for Automotive Sector in Malaysia by System Dynamics Approach. In AIP Conference Proceedings; AIP Publishing LCC.: Melville, NY, USA, 2015. [Google Scholar]
- Maulana, A.; Farizal, R.N. Car Demand Forecasting of Toyota in Indonesia: A Case Study Medium Price Category. In Proceedings of the Proceedings of the 7th North American International Conference on Industrial Engineering and Operations Management, Orlando, FL, USA, 12–14 June 2022. [Google Scholar]
- Syntetos, A.A.; Boylan, J.E.; Croston, J. On the categorization of demand patterns. J. Oper. Res. Soc. 2005, 56, 495–503. [Google Scholar] [CrossRef]
- Croston, J.D. Forecasting and Stock Control for Intermittent Demands. Oper. Res. Q. 1972, 23, 289–303. [Google Scholar] [CrossRef]
- Syntetos, A.A.; Boylan, J.E. On the bias of intermittent demand estimates. Int. J. Prod. Econ. 2001, 71, 457–466. [Google Scholar] [CrossRef]
- Ngadono, T.S.; Ikatrinasari, Z.F. Forecasting of PVB Film Using ARIMA. In Proceedings of the International Conference on Design, Engineering and Computer Sciences (ICDECS), Jakarta, Indonesia, 9 August 2018. [Google Scholar]
- Widitriani, N.P.S.; Parwita, W.G.S.; Meinarni, N.P.S. Forecasting system using single exponential smoothing with golden section optimization. J. Phys. Conf. Ser. 2020, 1516, 012008. [Google Scholar] [CrossRef]
- Qin, X.Y.; Ren, C.H.; Yu, Y. Auto parts sales forecast supporting business resource value-Added service. In Proceedings of the 2021 International Symposium on Computer Technology and Information Science, ISCTIS 2021, Guilin, China, 4–6 June 2021; pp. 158–164. [Google Scholar]
- Chen, D. Chinese automobile demand prediction based on ARIMA model. In Proceedings of the 2011 4th International Conference on Biomedical Engineering and Informatics, BMEI 2011, Shanghai, China, 15–17 October 2011; pp. 2197–2201. [Google Scholar]
- Homolka, L.; Ngo, V.M.; Pavelková, D.; Le, B.T.; Dehning, B. Short-and medium-term car registration forecasting based on selected macro and socio-economic indicators in European countries. Res. Transp. Econ. 2020, 80, 100752. [Google Scholar] [CrossRef]
- Chen, Y.; Yao, M.; Zhang, J. Research on Auto Sales Forecast Based on Online Reviews-Take R Brand Automobile as an Example. In Proceedings of the 2018 15th International Conference on Service Systems and Service Management, ICSSSM 2018, Hangzhou, China, 21–22 July 2018. [Google Scholar]
- Srivastava, S.; Sood, V.; Yuvraj, N. Analysing the Impact of COVID-19 on Automobile Sales in India Using ARIMA Modelling. In Proceedings of the Advances in Transdisciplinary Engineering, Cambridge, MA, USA, 5–8 July 2022; pp. 45–50. [Google Scholar]
- Leenawong, C.; Chaikajonwat, T. Event Forecasting for Thailand’s Car Sales during the COVID-19 Pandemic. Data 2022, 7, 86. [Google Scholar] [CrossRef]
- Makoni, T.; Chikobvu, D. Assessing and Forecasting the Long-Term Impact of the Global Financial Crisis on New Car Sales in South Africa. Data 2023, 8, 78. [Google Scholar] [CrossRef]
- Köksal, M.A.; Tekeli, Ş.E.; Ara Aksoy, S.; Kızıltan, A.; Kızıltan, M.; Duran, N.; Aslanoğlu, S.Y.; Öztürk, F.; Özyürek, N.; Doğan, P.; et al. Long term characterization of the vehicle stock in Turkey. Transp. Res. Part D Transp. Environ. 2021, 99, 102988. [Google Scholar] [CrossRef]
- Maistor, S.I.; Negrea, R.; Mocan, M.L.; Turi, A. Aspects of Forecasting for the European Automotive Industry. In Advances in Intelligent Systems and Computing; Springer: Cham, Switzerland, 2016; pp. 981–992. [Google Scholar]
- Mareš, D.; Janíčko, M. The Reliance of the Czech Economy on Its Automotive Sector. Cent. Eur. Bus. Rev. 2022, 11, 1. [Google Scholar] [CrossRef]
- Bottani, E.; Mordonini, M.; Franchi, B.; Pellegrino, M. Demand Forecasting for an Automotive Company with Neural Network and Ensemble Classifiers Approaches. In Advances in Production Management Systems: Artificial Intelligence for Sustainable and Resilient Production Systems, APMS 2021, Pt I; Dolgui, A., Bernard, A., Lemoine, D., von Cieminski, G., Romero, D., Eds.; IFIP Advances in Information and Communication Technology; Springer: Cham, Switzerland, 2021; Volume 630, pp. 134–142. [Google Scholar]
- de Souza, J.A.; Camilo-Junior, C.G. A sales forecasting model for an automotive distributing company. In Proceedings of the 2011 International Conference on Artificial Intelligence, ICAI 2011, Las Vegas, NV, USA, 18–21 July 2011; pp. 743–749. [Google Scholar]
- Tebaldi, L.; Pindari, S.; Bottani, E. Demand forecasting in an automotive company: An artificial neural network approach. In Proceedings of the 31st European Modeling and Simulation Symposium, EMSS 2019, Lisbon, Portugal, 18–20 September 2019; pp. 162–167. [Google Scholar]
- Kato, T. Demand Prediction in the Automobile Industry Independent of Big Data. Ann. Data Sci. 2022, 9, 249–270. [Google Scholar] [CrossRef]
- Ramírez, J.; Alarcón, J.; Calzada, G.; Ponce, H. Mexican automotive industry sales behavior during the COVID-19 pandemic. In Proceedings of the Advances in Soft Computing: 20th Mexican International Conference on Artificial Intelligence, MICAI 2021, Mexico City, Mexico, 25–30 October 2021; pp. 265–276. [Google Scholar]
- Kim, S. Innovating knowledge and information for a firm-level automobile demand forecast system: A machine learning perspective. J. Innov. Knowl. 2023, 8, 100355. [Google Scholar] [CrossRef]
- Liu, W.; Zhang, Z.; Bai, Y.; Liu, Y.; Yang, A.; Li, J. A deepfm-based non-parametric model enabled big data platform for predicting passenger car sales in sustainable way. IEEE Trans. Intell. Transp. Syst. 2023, 24, 16018–16028. [Google Scholar] [CrossRef]
- Anwar, M.T.; Heriyanto, L.; Permana, D.R.A.; Rahmah, G.M. Optimizing LSTM Model for Low-Cost Green Car Demand Forecasting. In Proceedings of the 2022 1st International Conference on Information System & Information Technology (ICISIT), Malang, Indonesia, 27–28 July 2022; pp. 90–95. [Google Scholar]
- Arora, A.; Murarka, M.; Rakshit, D.; Mishra, S. Forecasting Based Analysis of EV Market. In Proceedings of the 2022 22nd National Power Systems Conference (NPSC), New Delhi, India, 17–19 December 2022; pp. 719–724. [Google Scholar]
- Liu, Y.; He, S.; Chen, C. Forecasting Sales of China FAW New Energy Vehicles Using Ensemble Neural Networks. In Proceedings of the 2024 8th International Conference on Computing and Data Analysis, Wenzhou, China, 15–17 November 2024; pp. 68–74. [Google Scholar]
- Godata, G.B. A Comparative Study of Traditional and Deep Learning Models Using Emotional Customer Data in Automotive Sales Forecasting. In Proceedings of the 2025 International Conference on Advancement in Data Science, E-learning and Information System (ICADEIS), Bandung, Indonesia, 3–4 February 2025; pp. 1–6. [Google Scholar]
- Panahi, M.; Rahmati, O.; Rezaie, F.; Lee, S.; Mohammadi, F.; Conoscenti, C. Application of the group method of data handling (GMDH) approach for landslide susceptibility zonation using readily available spatial covariates. Catena 2022, 208, 105779. [Google Scholar] [CrossRef]
- Srinivasan, D. Energy demand prediction using GMDH networks. Neurocomputing 2008, 72, 625–629. [Google Scholar] [CrossRef]
- Hong, W.-C.; Lai, Y.-J.; Pai, P.-F.; Lee, S.-L.; Yang, S.-L. Composite of support vector regression and evolutionary algorithms in car-rental revenue forecasting. In Proceedings of the 2007 IEEE Congress on Evolutionary Computation, Singapore, 25–28 September 2007; pp. 2872–2878. [Google Scholar]
- Jun, W.; Yufa, T.; Ying, L.; Dianhua, Y. Combined forecasting of the vehicle holdings based on gray-neural network. In Proceedings of the The 27th Chinese Control and Decision Conference (2015 CCDC), Qingdao, China, 23–25 May 2015; pp. 6045–6050. [Google Scholar]
- Li, S.; Zhou, M.; Meng, W.; Zhou, W. A new grey prediction model for forecasting the automobiles ownership in China. J. Control Decis. 2021, 8, 155–164. [Google Scholar] [CrossRef]
- Tao, Y.; Xi, T. Using GM (1,1) model to forecast Chinese car production. In Proceedings of the 2010 International Conference on Computer Application and System Modeling (ICCASM 2010), Taiyuan, China, 22–24 October 2010; pp. V2-576–V2-579. [Google Scholar]
- Zhang, L.; Wang, Y. Research on Product Sales of Pacific Precision Forging Technology Co Based on Gray GM (1, 1) Model. In Proceedings of the 2022 6th Annual International Conference on Data Science and Business Analytics (ICDSBA), Changsha, China, 14–16 October 2022; pp. 330–334. [Google Scholar]
- Hajirahimi, Z.; Khashei, M. Hybrid structures in time series modeling and forecasting: A review. Eng. Appl. Artif. Intell. 2019, 86, 83–106. [Google Scholar] [CrossRef]
- Bates, J.M.; Granger, C.W. The combination of forecasts. J. Oper. Res. Soc. 1969, 20, 451–468. [Google Scholar] [CrossRef]
- Zhang, G.P. Time series forecasting using a hybrid ARIMA and neural network model. Neurocomputing 2003, 50, 159–175. [Google Scholar] [CrossRef]
- Ning, T.; Lu, B.; Ouyang, X.; Ouyang, H.; Chen, J. Prospect and sustainability prediction of China’s new energy vehicles sales considering temporal and spatial dimensions. J. Clean. Prod. 2024, 468, 142926. [Google Scholar] [CrossRef]
- Wongkamphu, S.; Phumchusri, N. Hybrid Approaches to Machine Learning for Improved Battery Sales Forecasting: A Case Study in Thailand. Eng. J. 2025, 29, 27–43. [Google Scholar] [CrossRef]
- Long, Y.; Xiao, Y.; Ren, H.; Lu, R. Manufacturing Big Data Modeling Algorithm Based on GM (1, 1)-LSTM and Its Application in Sales Forecasting. In Proceedings of the 2023 IEEE 12th Data Driven Control and Learning Systems Conference (DDCLS), Xiangtan, China, 12–14 May 2023; pp. 1171–1175. [Google Scholar]
- Vargas, C.G.; Cortés, M.E. Automobile spare-parts forecasting: A comparative study of time series methods. Int. J. Automot. Mech. Eng. 2017, 14, 3898–3912. [Google Scholar] [CrossRef]
- Farimani, N.M.; Parsafar, P.; Mohammadi, S. Evaluation performance of time series methods in demand forecasting: Box-Jenkins vs artificial neural network (Case study: Automotive Parts industry). J. Stat. Comput. Simul. 2022, 92, 3639–3658. [Google Scholar] [CrossRef]
- Türkbayrağí, M.G.; Dogu, E.; Esra Albayrak, Y. Artificial intelligence based prediction models: Sales forecasting application in automotive aftermarket. J. Intell. Fuzzy Syst. 2021, 42, 213–225. [Google Scholar] [CrossRef]
- Abdellatief, M.; Shaaban, E.M.; Abu-Raya, K.A. Egyptian Case Study-Sales forecasting model for automotive section. In Proceedings of the 2019 International Conference on Smart Applications, Communications and Networking (SmartNets), Sharm El Sheikh, Egypt, 17–19 December 2019; pp. 1–6. [Google Scholar]
- Rožanec, J.M.; Fortuna, B.; Mladenić, D. Reframing demand forecasting: A two-fold approach for lumpy and intermittent demand. Sustainability 2022, 14, 9295. [Google Scholar] [CrossRef]
- Oukassi, H.; Hasni, M.; Layeb, S.B. Long short-term memory networks for forecasting demand in the case of automotive manufacturing industry. In Proceedings of the 2023 IEEE International Conference on Advanced Systems and Emergent Technologies (IC_ASET), Hammamet, Tunisia, 29 April–1 May 2023; pp. 1–6. [Google Scholar]
- Hülsmann, M.; Borscheid, D.; Friedrich, C.M.; Reith, D. General sales forecast models for automobile markets based on time series analysis and data mining techniques. In Proceedings of the Advances in Data Mining. Applications and Theoretical Aspects: 11th Industrial Conference, ICDM 2011, New York, NY, USA, 30 August–3 September 2011; pp. 255–269. [Google Scholar]
- Lacic, E.; Traub, M.; Duricic, T.; Haslauer, E.; Lex, E. Gone in 30 days! Predictions for car import planning. it-Inf. Technol. 2018, 60, 219–228. [Google Scholar] [CrossRef]
- Wachter, P.; Widmer, T.; Klein, A. Predicting automotive sales using pre-purchase online search data. In Proceedings of the 2019 Federated Conference on Computer Science and Information Systems (FedCSIS), Leipzig, Germany, 1–4 September 2019; pp. 569–577. [Google Scholar]
- Fortsch, S.M.; Choi, J.H.; Khapalova, E.A. Competition can help predict sales. J. Forecast. 2022, 41, 331–344. [Google Scholar] [CrossRef]
- Hasheminejad, S.A.; Shabaab, M.; Javadinarab, N. Developing Cluster-Based Adaptive Network Fuzzy Inference System Tuned by Particle Swarm Optimization to Forecast Annual Automotive Sales: A Case Study in Iran Market. Int. J. Fuzzy Syst. 2022, 24, 2719–2728. [Google Scholar] [CrossRef]
- Yang, X. A Study on Forecasting Sales of New Energy Vehicles in China Based on Time Series Analysis. Highlights Sci. Eng. Technol. 2024, 98, 182–192. [Google Scholar] [CrossRef]
- Zhang, L.; Yao, X.; Xiao, Y.; Zhang, Y.; Cai, M. Mechanisms and implications of autonomous vehicle market penetration: Insights from a Markov forecasting model. Transp. Policy 2024, 156, 43–61. [Google Scholar] [CrossRef]
- Lin, B.; Wong, S.F.; Ho, W.I. Study on the production forecasting based on grey neural network model in automotive industry. In Proceedings of the IEEE International Conference on Industrial Engineering and Engineering Management, Selangor Darul Ehsan, Malaysia, 9–12 December 2014; pp. 355–359. [Google Scholar]
- Yang, Q.; Chen, Y. Auto parts demand forecasting based on nonnegative variable weight combination model in auto aftermarket. In Proceedings of the 2012 International Conference on Management Science & Engineering, 19th Annual Conference Proceedings, Dallas, TX, USA, 20–22 September 2012; pp. 817–822. [Google Scholar]
- Ardabili, S.; Abdolalizadeh, L.; Mako, C.; Torok, B.; Mosavi, A. Systematic Review of Deep Learning and Machine Learning for Building Energy. Front. Energy Res. 2022, 10, 786027. [Google Scholar] [CrossRef]
- Petropoulos, F.; Nikolopoulos, K.; Spithourakis, G.P.; Assimakopoulos, V. Empirical heuristics for improving intermittent demand forecasting. Ind. Manag. Data Syst. 2013, 113, 683–696. [Google Scholar] [CrossRef]
- Yurdem, B.; Kuzlu, M.; Gullu, M.K.; Catak, F.O.; Tabassum, M. Federated learning: Overview, strategies, applications, tools and future directions. Heliyon 2024, 10, e38137. [Google Scholar] [CrossRef]
- Yang, Y.; Wang, Z.; Zhao, S.; Wu, J. An integrated federated learning algorithm for short-term load forecasting. Electr. Power Syst. Res. 2023, 214, 108830. [Google Scholar] [CrossRef]


Disclaimer/Publisher’s Note: The statements, opinions and data contained in all publications are solely those of the individual author(s) and contributor(s) and not of MDPI and/or the editor(s). MDPI and/or the editor(s) disclaim responsibility for any injury to people or property resulting from any ideas, methods, instructions or products referred to in the content. |
© 2025 by the authors. Licensee MDPI, Basel, Switzerland. This article is an open access article distributed under the terms and conditions of the Creative Commons Attribution (CC BY) license (https://creativecommons.org/licenses/by/4.0/).