Abstract
Oranges are widely consumed worldwide and are highly valued both for their nutritional properties and their economic importance. In Mexico, particularly in the northeastern citrus-producing region, large amounts of peel are generated during industrial processing, representing a significant source of agro-industrial waste. This byproduct is naturally rich in compounds of interest, including flavonoids, polyphenols, and pectin, which motivates the development of sustainable recovery strategies. In this work, orange peel biomass was valorized using ultrasound-assisted extraction in combination with deep eutectic solvents (DESs). Among the evaluated formulations, the choline chloride–lactic acid DES at a 1:10 molar ratio produced the highest overall extraction yield (43.88% by dry weight/mass). The 2:1 formulation, however, was the most efficient for the recovery of phenolic compounds, reaching 4.12 mg GAE/g, and exhibited the greatest antioxidant activity (2.55 mmol Trolox/g) and the strongest antimicrobial response against clinically relevant microorganisms. This same DES ratio enabled the highest quantification of key phenolics such as naringin (1150.29 µg/g), caffeic acid (139.41 µg/g), and ferulic acid (379.96 µg/g). For polysaccharide extraction, the 1:1 DES ratio was the most effective, achieving a pectin yield of 48.24%. Overall, the findings demonstrate that DES, particularly when combined with ultrasound, offers a green and efficient approach for the integrated recovery of pectin, phenolic antioxidants, and antimicrobial compounds from citrus byproducts, contributing to environmentally sustainable biorefinery strategies.
1. Introduction
Orange cultivation is a key economic activity in northeastern Mexico, particularly in the state of Nuevo León. With 31,891 hectares of cultivated orange groves, this region contributes 82.7% of the state’s total orange production [1]. To increase the added value of orange production, industrial processing into juices, marmalades, and preserves has expanded, generating large quantities of orange peel waste annually. In the fourth quarter of 2017, Mexico harvested 2.05 million tons of oranges, with approximately 27% of this amount being peel waste [2]. Improper management of this biomass can cause significant environmental impacts, including soil acidification and the proliferation of pests [3].
Orange peel contains valuable phenolic compounds and flavonoids such as hesperidin, naringin, polymethoxyflavones, ferulic acid, and caffeic acid which have broad applications in the pharmaceutical and food industries [4]. It is also rich in polysaccharides, particularly pectin, hemicellulose and cellulose, which are major components of the plant primary cell wall widely used as a natural food additive, thickener, texturizer, emulsifier, stabilizer, and gelling agent [5]. Traditionally, maceration, Soxhlet extraction, and reflux have been employed to recover these compounds; however, such approaches require high temperatures and toxic solvents such as hexane or toluene [6]. In contrast, green extraction technologies aim to minimize solvent toxicity and energy consumption while efficiently recovering high value compounds [7]. Several environmentally friendly extraction techniques have been developed and evaluated under different operational conditions, including ultrasound-assisted extraction (UAE) [8], microwave-assisted extraction (MAE) [9], pressurized liquid extraction (PLE) [10], and supercritical fluid extraction (SFE) [11]. Among these, UAE enhances solvent penetration through cavitation, a phenomenon in which microbubbles collapse and disrupt cell walls, facilitating the release of target compounds [12]. This technique is highly efficient, requiring less solvent, shorter extraction times, and lower temperatures.
Deep eutectic solvents (DESs) have gained increasing attention as environmentally friendly alternatives to conventional solvents. These liquids are formed by combining two or more components that interact through hydrogen bonding or Van der Waals forces, resulting in a system with a melting point lower than that of the individual constituents. DESs exhibit several advantages, including thermal stability, low vapor pressure, high solubilizing power, and low toxicity, making them safer and more sustainable than traditional organic solvents [13,14].
Although UAE- and DES-based extractions have been widely recognized as promising green technologies, the combined use of UAE with choline chloride lactic acid DESs at different molar ratios has not been systematically examined for orange peel valorization. Previous studies have primarily focused on optimizing parameters such as temperature, solvent volume, or extraction time, while the influence of the choline chloride: lactic acid (ChCl:LA) molar ratio on solvent polarity, viscosity, and extraction efficiency remains insufficiently understood. Clarifying this relationship is essential for tailoring DES formulations that maximize the recovery of bioactive compounds while maintaining environmental compatibility.
Therefore, this study investigates the effect of four ChCl:LA molar ratios (1:10, 1:2, 1:1, and 2:1) on extraction efficiency, physicochemical properties of the solvents, and the recovery of bioactive compounds from orange peel using UAE. This approach not only provides insight into the structure function relationship of DES formulations but also contributes to the development of more efficient and sustainable extraction systems within the framework of a circular bioeconomy.
2. Materials and Methods
2.1. Sample Collection and Storage
Samples of biological material (orange peel) were collected from various locations in the metropolitan area of Nuevo León, including juice vendors and private households. Since all fruits had already been processed for juice extraction, the peel corresponded to physiologically mature oranges, ensuring a consistent ripeness stage. After collection, the material was thoroughly washed, manually inspected, and combined into a single composite batch to reduce variability associated with fruit origin. The peel was then dried under controlled conditions, ground to a uniform particle size, and stored in airtight containers at –20 °C until analysis, following standard procedures for citrus byproduct handling [7]. This homogenization procedure minimized analytical variability and ensured consistent and reproducible measurements throughout the study.
2.2. Pretreatment of Orange Peel
First, the orange peel was thoroughly washed with distilled water to remove impurities, and the excess moisture was eliminated. Then, the peel was cut into small pieces and dried in an air-circulated oven at 45–55 °C for 48 h. Once dried, the material was ground to obtain a uniform particle size ranging from 1 to 2 mm. Figure 1 illustrates the sample preparation process prior to extraction.
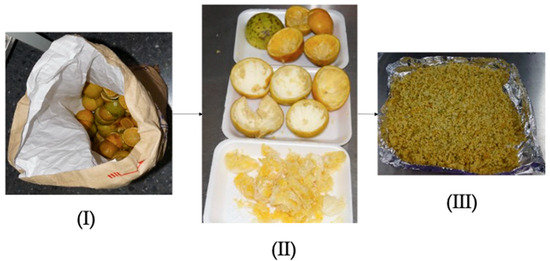
Figure 1.
Pretreatment of orange peel: (I) fresh orange peel residues collected after juice extraction; (II) cleaning and manual removal of remaining pulp; (III) slicing and drying of the peel at 50 °C until constant weight achieved.
2.3. Preparation of Deep Eutectic Solvents (DES)
Choline chloride (ChCl) and lactic acid (LA), both of analytical grade, were used to prepare the deep eutectic solvents (DES). Prior to preparation, solid ChCl (powder form) was placed in a desiccator at room temperature for 24 h to remove residual moisture, given its hygroscopic nature. Lactic acid, supplied as a food-grade liquid, was used as received.
Before mixing, both components were individually preheated at 80 °C to reduce viscosity and improve miscibility. The preheated ChCl and LA were then combined under continuous stirring at approximately 80 °C until a homogeneous and transparent liquid was obtained [15]. The DES formulations were prepared at the following molar ratios of ChCl:LA: 1:10 (A), 1:2 (B), 1:1 (C), and 2:1 (D).
2.4. Ultrasound-Assisted Extraction with Deep Eutectic Solvents
UAE was performed using a solid-to-solvent ratio of 1:30 (g/mL). For each extraction, 0.330 g of dried orange peel was mixed with 9.9 mL of the corresponding deep eutectic solvent (DES), adjusting the volume to maintain the established ratio. Ultrasonic treatment was applied at an intensity of 664 W/cm2, frequency of 20 kHz, 50% amplitude, and a pulse cycle of 0.5 s for a total extraction time of 1 min. The variable parameter in the extraction process was the molar ratio of choline chloride to lactic acid in the DES formulation. These parameters are summarized in Table 1.

Table 1.
Ultrasound-assisted extraction conditions using deep eutectic solvents.
Following sonication, the mixture was centrifuged at 4400 rpm for 15 min. The supernatant was then mixed with 190 mL of ethanol and 10 mL of distilled water to promote polysaccharide precipitation, and the solution was kept at 4 °C for 12 h. After a second centrifugation at 4000 rpm for 10 min, two distinct fractions were obtained: (i) a polysaccharide-rich precipitate (containing mainly pectin together with hemicellulose and cellulose residues); (ii) a DES, ethanol aqueous supernatant containing the non-precipitated soluble components. Both fractions were collected separately and dried in a convection oven at 50 °C until constant weight was achieved [16].
To facilitate the removal of the DES and recover the target compounds, the extract was passed through a column packed with Amberlite XAD-7 resin. This non-ionic, moderately polar adsorbent is effective for retaining phenolic and flavonoid compounds, which were the primary targets in this study due to their polar to moderately polar nature. A measure of 10 g of Amberlite resin was mixed with the DES extract and 50 mL of distilled water under constant agitation for 40 min. The resulting resin–extract mixture was then filtered and washed with 500 mL of distilled water to remove undesired components. Subsequently, 100 mL of ethanol (EtOH) were added to desorb the phenolic compounds from the resin. After recovering the phenolic compounds with ethanol, the solvent was evaporated under reduced pressure at 37 °C to obtain the crude extract.
The adsorbed extract was subsequently concentrated using a rotary evaporator under reduced pressure to ensure complete removal of the solvents used, and the extraction efficiency was calculated using Equation (1) [17].
where:
% Yield = (WAE/WMV) × 100
- WAE is the weight in grams of the crude extract obtained.
- WMV is the weight in grams of the plant material (orange peel).
2.5. Determination of the Physicochemical Properties of the Deep Eutectic Solvent (DES)
2.5.1. Density
The density of the solvents was determined using a 25 mL volumetric flask that had been previously tared. The mass of each sample was measured using an analytical balance (precision ±0.0001 g) at a controlled ambient temperature of 27 °C ± 0.5, corresponding to the average laboratory conditions in Monterrey, Nuevo León. Density (ρ) was calculated using Equation (2) [18]. Also, pH was determined properly.
where m represents the measured mass of the solvent (g), and V is the fixed volume of the volumetric flask, set at 25 mL.
ρ = m/V
2.5.2. Viscosity
Viscosity was determined using a DVE Brookfield rotational viscometer (AMETEK Brookfield, Middleboro, MA, USA), equipped with a #63 spindle. Prior to the analysis, the instrument was calibrated in accordance with the manufacturer’s specifications to ensure accurate measurement. Briefly, sample was placed in its designated container, maintaining a constant temperature throughout the test (27 °C ± 0.5). The viscometer was then set to the appropriate speed for the measurement, and viscosity values were recorded in centipoises (cP). This methodology enabled precise evaluation of the solvent’s rheological properties, which are critical for its characterization and potential use in extraction processes [18].
2.6. Antiradical Activity Using DPPH Reagent
The extracts were re-suspended in methanol at an initial concentration of 1 mg/mL. Then, 100 µL of each extract were transferred into individual wells of a 96-well microplate, followed by serial dilutions in methanol within the same plate. To each well, 100 µL of a freshly prepared 2,2-diphenyl-1-picrylhydrazyl (DPPH•) radical solution at a final concentration of 150 μM in 80% methanol were added. The reaction mixture was incubated for 30 min at room temperature, protected from light.
The negative control consisted of the DPPH• solution without extract, while all samples were tested in triplicate. Absorbance was measured at 517 nm using a microplate spectrophotometer. The percentage of inhibition was calculated using Equation (3) [19]:
where Acontrol is the absorbance of the negative control and Asample is the absorbance of the sample. Results were expressed as Trolox Equivalent Antioxidant Capacity (TEAC), in millimoles of Trolox per gram of extract (mmol Trolox/g), using a Trolox calibration curve prepared under the same experimental conditions.
% Inhibition = (Acontrol − Asample/Acontrol) × 100
2.7. Antimicrobial Activity
Agar Diffusion Assay
Gram-positive strains (Enterococcus faecalis (E. faecalis), Staphylococcus aureus (S. aureus), and Micrococcus luteus (M. luteus)) and Gram-negative strains (Escherichia coli (E. coli), Salmonella spp., Enterobacter cloacae (E. cloacae), and Acinetobacter baumannii (A.baumannii)) were activated. A bacterial inoculum from each strain was taken using a bacteriological loop in Mueller Hinton (MH) medium at pH 7.3, and incubated for 18–34 h at 37 °C. After incubation, the cell suspension was adjusted in 0.9% saline solution to a final concentration of 1.5 × 10⁸ CFU/mL [20].
The assay was performed on Petri dishes containing MH agar. Each microorganism was inoculated by surface swabbing, and 30 µL of each extract at a concentration of 1250 µg/mL were placed into wells of 6 mm diameter. As a positive control, 10 µL of gentamicin were deposited in the center of the plate, while dimethyl sulfoxide (DMSO) in the same proportion was used as the negative control. Plates were incubated at 37 °C for 24 h. After incubation, inhibition halos were measured in millimeters. The assay was carried out in triplicate, and results were expressed as the mean diameter of the inhibition zones ± standard deviation.
2.8. Determination of Phenolic Compounds, Total Phenolics, and Pectin
2.8.1. Quantification of Phenolics
The total phenolic content of the crude extracts was determined using the Folin–Ciocalteu reduction method. For this assay, 100 µL of each extract (15 mg/mL) were placed in a test tube, followed by the addition of 250 µL of Folin reagent (1 N), 1250 µL of Na2CO3 (20% w/v), and 400 µL of distilled water. The mixture was incubated at room temperature for 2 h, and absorbance was measured at 760 nm. Gallic acid (GA) was used as the calibration standard, yielding the linear regression equation y = 0.0571x + 0.0038 with a determination coefficient of R2 = 0.9872. Results were expressed as mg of GA equivalents (mg GAE) per g of extract. All assays were performed in triplicate [19].
2.8.2. Quantification of Pectin by Gravimetry
Pectin quantification was performed using acid hydrolysis and gravimetric determination. A 1:100 (w/w, solid–water) ratio of the polysaccharide precipitate was prepared in distilled water. Subsequently, 6 M hydrochloric acid (HCl) was added in sufficient volume to adjust the pH to 2. The mixture was heated at 85 °C under gentle stirring for 1 h, cooled to room temperature, and filtered. Solubilized pectin was precipitated using absolute ethanol in a 1:1 ratio. The precipitate was washed three times with absolute ethanol and centrifuged at 4000 rpm for 15 min. The resulting material was dried in a convection oven at 45 °C until constant weight was achieved. Extraction yield was expressed as a percentage relative to the initial dry weight, calculated using Equation (4) [21]:
where m1 represents the weight of the dry biological material (g) and m2 corresponds to the weight of the dried pectin (g). All assays were performed in triplicate.
2.8.3. FTIR Analysis for Pectin
An analysis of functional groups was performed using Fourier Transform Infrared Spectroscopy (FTIR) to identify the structural characteristics of the pectin extracted from orange peel powder. The spectra were obtained using an FTIR spectrometer (PerkinElmer Spectrum Two, Waltham, MA, USA) in the range of 4000 to 500 cm−1 [22].
2.8.4. Quantification of Compounds of Interest
Phenolic and flavonoid compounds of interest, including caffeic acid, naringin, quercetin, and ferulic acid, were quantified using calibration curves prepared with analytical-grade standards. The analyses were conducted by Ultra-High-Performance Liquid Chromatography (UHPLC). A volume of 10 µL of each sample (standard or extract) was injected into an LC-2030c 3D Plus Prominence-i (Shimadzu Corporation, Kyoto, Japan) system equipped with a photodiode array detector (PDA) detector. Separation was carried out using a gradient of acetonitrile and phosphoric acid (0.1% H3PO4) for 6 min at a flow rate of 0.5 mL/min.
2.9. Statical Analysis
All statistical analyses were performed using PAST 4.0. Prior to hypothesis testing, datasets were evaluated for normality and homogeneity of variance. When assumptions were met, differences among treatments were assessed using a one-way analysis of variance (ANOVA). Significant effects were further examined with a Tukey post hoc test to determine pairwise differences. Statistical significance was established at p < 0.05. Results are presented as mean ± standard deviation (n = 3).
3. Results and Discussion
3.1. Physicochemical Properties of Deep Eutectic Solvents (DES)
Table 2 presents the physicochemical properties of the DES formulations prepared with different molar ratios of choline chloride and lactic acid. Density showed a progressive decrease as the proportion of choline chloride increased, ranging from 1.200 g/cm3 in the 1:10 mixture (A) to 1.152 g/cm3 in the 2:1 mixture (D). The pH remained constant at 3 for the 1:10 (A) and 1:2 (B) formulations, increasing to 4 and 5 in the 1:1 (C) and 2:1 (D) mixtures, respectively, reflecting the influence of lactic acid concentration on the acid–base characteristics of the solvent.
Table 2.
Physical characteristics of the ChCl/LA DES mixtures evaluated in this study.
Viscosity exhibited the opposite trend, rising markedly from 0.048 Pa·s in the 1:10 DES to 0.296 Pa·s in the 2:1 mixture. This behavior is consistent with previous findings showing that viscosity in DES depends on factors such as the number of hydroxyl and carboxyl groups and the length of the alkyl chain, where more hydroxyl groups and longer chains typically increase viscosity [23].
Lactic acid acted as an efficient hydrogen bond donor (HBD) due to its relatively low molecular weight (90.08 g/mol) and melting point (16.8 °C), facilitating DES formation and reducing energy consumption compared with other organic acids such as citric acid (192.12 g/mol, 153 °C) [24,25]. ChCl/LA systems generally exhibit lower viscosity than other hydrogen bond acceptor (HBA)–HBD combinations because they form weaker hydrogen-bond networks [26]. The suitability of choline chloride–organic acid DES for extracting phenolic compounds from plant matrices has been well documented [27].
The extraction behavior of DES is highly dependent on their physicochemical properties, especially density and viscosity, both of which are influenced by molar ratio, molecular structure, and the strength of hydrogen bonding, Van der Waals forces, and electrostatic interactions between components [28]. Excessively high viscosity inhibits mass transfer, reducing extraction efficiency, whereas extremely low viscosity can weaken cavitation intensity during UAE, also decreasing extraction performance [29,30]. Temperature during DES preparation may further modulate density, influencing the diffusion of analytes during extraction [31].
In this study, decreasing lactic acid concentration increased solvent viscosity, with the highest value observed in the 2:1 DES. Despite its high viscosity, this formulation produced a greater extraction yield than the 1:2 DES, likely due to stronger cavitation events in denser media. Conversely, the 1:10 DES being the least viscous achieved the highest extraction yield overall. These findings indicate that lactic acid, at appropriate concentrations, enhances solubilization and release of bioactive compounds through strong hydrogen-bonding interactions within the plant matrix.
Overall, the contrasting physicochemical properties of the DES highlight their importance in determining extraction performance and underscore the need for optimizing solvent composition to target specific bioactive compounds effectively.
3.2. Extraction Yield of Crude Extract
Figure 2 shows the extraction yields obtained using different ChCl/LA molar ratios. The highest yield was achieved with the 1:10 DES (43.88 ± 0.90%), followed by the 2:1 (25.08 ± 0.42%) and 1:1 (17.23 ± 0.11%) mixture. The lowest yield was observed with the 1:2 DES (10.21 ± 0.74%). These results indicate that the proportion of lactic acid in the DES plays a critical role in determining extraction efficiency.
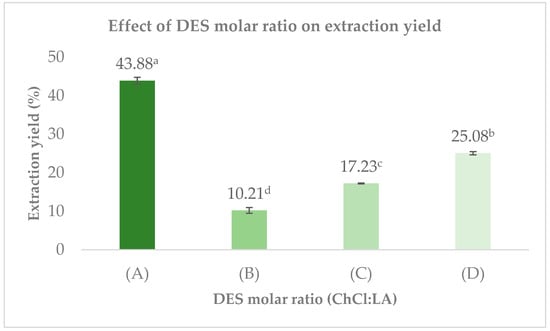
Figure 2.
The DES formulations were prepared using choline chloride and lactic acid at molar ratios of 1:10 (A), 1:2 (B), 1:1 (C), and 2:1 (D). Values represent mean ± SD (n = 3). Different letters (a–d) indicate significant differences between treatments (p < 0.5, Tukey’s test).
Although lactic acid content influences DES polarity and hydrogen-bonding capacity, its effect is not uniform across all analytes. While higher proportions of lactic acid can improve the solubility of certain low-molecular-weight compounds such as phenolics and flavonoids, as previously reported for lactic acid–based DES [32] this trend does not apply to all targets extracted in this study. In fact, pectin-rich polysaccharides were better recovered with the 1:1 DES rather than the more acidic mixtures, confirming that extraction behavior depends strongly on the chemical nature and molecular size of each compound class.
In addition, UAE significantly enhances extraction performance by generating cavitation bubbles that collapse near plant tissues, promoting solvent penetration and facilitating the release of intracellular compounds [33]. Solvent density also influences cavitation intensity; denser media generally promote stronger bubble collapse, potentially improving extraction efficiency [34]. This may explain why the 2:1 DES denser (and in this case also more viscous) than the 1:2 mixture achieved higher yields.
However, viscosity must be properly balanced, as excessive viscosity limits mass transfer and decreases extraction efficiency [29]. The 1:10 DES, being the least viscous formulation, allowed rapid diffusion and more effective cavitation, which likely contributed to its superior extraction performance compared with the other mixtures. These findings reinforce that extraction yield is determined by the combined effects of solvent physicochemical properties particularly viscosity, density, and polarity and cavitation dynamics during UAE.
After extraction, Amberlite XAD-7 resin was used to remove residual DES, ensuring that subsequent antioxidant and antimicrobial measurements reflected only the activity of the extracted compounds. This purification step aligns with green chemistry principles and enhances the potential applicability of the extracts in food and pharmaceutical products.
Although each DES was used only once in this study, recent research has shown that many DES can be recovered and reused for 2–3 extraction cycles while retaining over 90% of their original efficiency [35]. Reported recovery strategies include solid–liquid extraction, in situ liquid–liquid extraction, membrane filtration, and anti-solvent precipitation [36]. Incorporating solvent recovery in future work would further improve the environmental and economic sustainability of DES-based extraction systems.
3.3. Total Phenolic Content
Figure 3 shows the total phenolic content extracted using different solvents. The highest phenolic content was obtained with the ChCl/LA 2:1 mixture, reaching 4.12 ± 0.20 mg GAE/g of extract. These results surpassed those obtained with other solvents, such as ChCl/LA 1:2 and ChCl/LA 1:1, which yielded 3.77 ± 0.12 mg GAE/g and 3.05 ± 0.24 mg GAE/g, respectively. Conversely, the ChCl/LA 1:10 solvent showed the lowest phenolic content, with a value of 2.07 ± 0.12 mg GAE/g of extract. These findings indicate that the ChCl/LA 2:1 and ChCl/LA 1:2 mixtures formed the top group, outperforming ChCl/LA 1:1 and ChCl/LA 1:10.
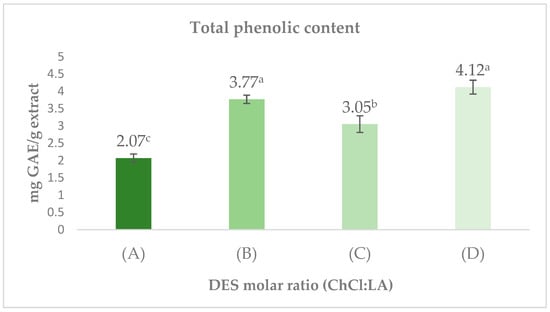
Figure 3.
Extracts of Choline Chloride (ChCl) and Lactic Acid (LA) at varying molar ratios: (A) ChCl/LA 1:10; (B) ChCl/LA 1:2; (C) ChCl/LA 1:1; (D) ChCl/LA 2:1. GAE = gallic acid equivalents. Values represent mean ± SD (n = 3). Different letters (a–c) indicate significant differences between treatments (p < 0.5, Tukey’s test). Results are expressed on a dry weight basis.
The enhanced extraction performance observed for the ChCl/LA DES at 2:1 and 1:2 molar ratios is likely related to their capacity to form extensive hydrogen-bond networks with polar analytes, which promotes the dissolution of phenolic constituents. Previous research has indicated that DES formulated with choline chloride and lactic acid display strong polarity and a marked affinity toward hydroxylated structures, making them highly suitable for the recovery of bioactive molecules [37]. For context, Leouifoudi et al. (2015) reported a total phenolic content (TPC) value of 0.950 mg GAE/g in ethanolic extracts of olive pomace [38], which is considerably lower than the concentrations quantified in this study. This comparison underscores the superior extraction efficiency of the DES/UAE approach. Ultrasound also plays a decisive role in these outcomes. The mechanical forces generated by cavitation such as localized pressure variations and microstreaming produce structural disruptions in plant tissues, thereby accelerating solvent access and enhancing the migration of phenolics into the liquid phase [39,40]. Oroian et al. demonstrated that UAE markedly outperforms conventional methodologies, reporting yields of 95.8 g extract per 100 g crude propolis, in contrast to 66.1 g obtained through maceration [39]. These findings confirm the contribution of cavitation-driven processes to the efficient release of bioactive constituents. In summary, the high phenolic content measured in the 2:1 and 1:2 DES treatments can be explained by the synergistic effect between DES composition particularly their hydrogen-bonding capacity and the mechanical intensification produced by ultrasound.
3.4. Antioxidant Capacity Assessed by the DPPH Assay
The antioxidant capacity of the extracts activity of the samples is shown in Figure 4. The highest antioxidant activity was observed with the ChCl/LA (2:1) mixture, reaching 2.55 ± 0.56 mmol Trolox/g. Meanwhile, the ChCl/LA (1:2) solvent demonstrated a similar antioxidant capacity to that of ChCl/LA (1:1), with values of 1.72 ± 0.15 mmol Trolox/g and 1.68 ± 0.14 mmol Trolox/g, respectively. In contrast, the extracts obtained with ChCl/LA (1:10) displayed the lowest antioxidant activity among the tested solvents, with a value of 1.48 ± 0.13 mmol Trolox/g.
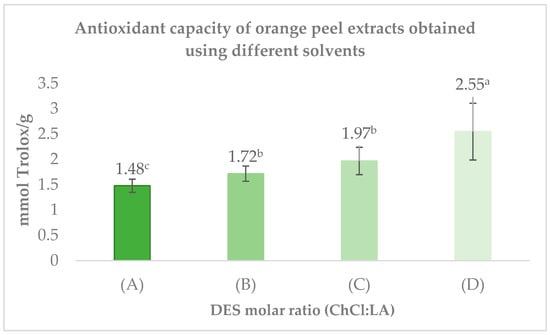
Figure 4.
Extracts of Choline Chloride (ChCl) and Lactic Acid (LA) at varying molar ratios: (A) ChCl/LA 1:10; (B) ChCl/LA 1:2; (C) ChCl/LA 1:1; (D) ChCl/LA 2:1. The bars represent mean ± SD (n = 3). Different letters (a–c) indicate significant differences between treatments (p < 0.5, Tukey’s test). Results are expressed on a dry weight basis.
These findings indicate that the ChCl/LA (2:1) mixture is the most effective solvent system for extracting antioxidant compounds from orange peel compared to the other molar ratios evaluated.
The superior antioxidant activity observed in the ChCl/LA 2:1 extract can be attributed to the enhanced extraction of bioactive compounds—particularly phenolics and terpenes enabled by its favorable molar ratio. DES composition strongly influences polarity, hydrogen-bonding capacity, and molecular interactions, all of which modulate solvent selectivity toward specific functional groups [41]. As a result, varying the ChCl/LA molar ratio can tune the affinity of the solvent for different phytochemicals, thereby affecting the antioxidant potential of the resulting extract [13].
In citrus matrices such as orange peel, relevant antioxidant compounds include limonoids and flavonoids. Previous work by Kolarević et al. (2020) demonstrated that choline-chloride–organic acid DES effectively solubilize these compounds, producing extracts with superior antioxidant activity compared with conventional solvents [42]. The contribution of individual molecules such as naringin is particularly important: this flavonoid contains hydroxyl groups at the 5- and 4′-positions, which readily donate hydrogen atoms to neutralize free radicals like DPPH, thereby reducing oxidative stress [43].
Overall, the strong antioxidant capacity observed for the 2:1 crude extract is attributed to the combined effects of solvent composition, polarity, and the ability of UAE-induced cavitation to enhance the release of phenolics and terpenes from the plant matrix.
3.5. Antimicrobial Activity by Well Diffusion Assay
Table 3 summarizes the antimicrobial activity of orange peel extracts obtained using different solvents against both Gram-positive and Gram-negative microorganisms. The antimicrobial potential of each extract was assessed using the well diffusion assay, with 1250 µg of extract dispensed into each well.
Table 3.
Antimicrobial activity of orange peel extracts by agar diffusion assay.
Among the tested samples, the extract prepared with ChCl/LA (2:1) exhibited the strongest antimicrobial activity, followed by ChCl/LA (1:2). Extracts obtained using ChCl/LA (1:10) and ChCl/LA (1:1) demonstrated moderate activity. Gentamicin was used as a positive control and displayed strong antimicrobial activity, whereas DMSO, used as the solvent control, exhibited no inhibitory effects.
These results confirm the antimicrobial potential of the extracts, with ChCl/LA at 2:1 and 1:2 molar ratios exhibiting the most pronounced inhibition zones, indicating greater antimicrobial effectiveness compared to the other treatments. The extracts demonstrated varying degrees of inhibition across bacterial strains. The ChCl/LA 2:1 DES showed the highest antimicrobial effectiveness, particularly against Staphylococcus aureus, Micrococcus luteus, Escherichia coli, Salmonella spp., and Enterobacter cloacae. According to Velázquez et al. (2010), inhibition zones greater than 12 mm indicate that bacteria are susceptible to the tested compound [44]; several strains approached or exceeded this threshold when treated with the 2:1 and 1:2 extracts.
A greater susceptibility was observed among Gram-negative bacteria (E. coli, Salmonella spp., E. cloacae), which may be attributed to the phenolic profile of the extracts. One of the key phenolics in orange peel is naringin, a flavanone glycoside known for its antibacterial potential. Zhao and Liu reported that naringin exerts antimicrobial activity through multiple mechanisms, including inhibition of nucleic acid synthesis, interference with enzyme activity, disruption of cytoplasmic membrane function, and inhibition of biofilm formation [45]. Naringin also compromises membrane integrity, increasing permeability and causing leakage of essential ions and metabolites, while promoting the formation of reactive oxygen species (ROS), further damaging proteins and nucleic acids.
The behavior observed in this study aligns with previous reports showing that flavonoids may exert greater antimicrobial activity against Gram-negative bacteria such as E. coli and Pseudomonas aeruginosa, compared with Gram-positive organisms like Enterococcus faecalis and S. aureus [46]. At the tested concentration (1250 µg per well), E. coli exhibited a 4 mm inhibition zone, while S. aureus showed 7 mm of inhibition—consistent with the moderate antibacterial effects typically observed in plant-derived extracts at similar concentrations.
It should be noted, however, that some of the inhibition zones observed in this study, particularly those between 2 and 4 mm, lie close to the detection limit of agar diffusion assays and may fall within the inherent variability of the method. Therefore, these small halos should be interpreted with caution, as they may not represent biologically meaningful antimicrobial activity. Overall, the results confirm that DES-based extracts particularly those formulated at 2:1 and 1:2 molar ratios exhibit promising antimicrobial activity and represent ecofriendly alternatives for the development of natural antimicrobial agents.
3.6. Quantification of Compounds
Calibration curves for naringin, caffeic acid, quercetin, and ferulic acid were constructed using UHPLC-DAD at concentrations between 1 and 400 µg/mL. The regression equations and coefficients of determination (R2) are shown in Table 4, all of which exceeded 0.98, confirming excellent linearity for quantitative purposes.
Table 4.
Standard analytes used in the calibration curves with the range used, curve equation and R2 of each compound.
Calibration curves were constructed using the peak areas of each standard measured by UHPLC coupled to a SPD-M30A photodiode array detector (Shimadzu Corporation, Kyoto, Japan) at different concentrations. The extracts were analyzed by UHPLC-DAD to quantify four phenolic compounds: caffeic acid, ferulic acid, quercetin, and naringin. The quantified values are shown in Table 5 and are expressed in micrograms per gram of extract.
Table 5.
Profile of phenolic compounds in dry extracts of orange peel obtained by ultra-high-performance liquid chromatography with a photodiode array detector.
Table 5 summarizes the concentrations of phenolic compounds obtained with each DES formulation. Among the quantified compounds, naringin was the most abundant across all extracts. The ChCl/LA 2:1 mixture yielded the highest naringin content (1150.29 ± 121 µg/g), followed by the 1:2 (791.57 ± 81.1 µg/g) and 1:10 (622.20 ± 25.9 µg/g) formulations. The lowest concentration occurred in the 1:1 DES (324.82 ± 12.3 µg/g). This pattern indicates a stronger extraction capacity at higher choline chloride proportions, likely due to enhanced solvent–analyte interactions.
Caffeic acid showed a similar trend, with ChCl/LA 2:1 producing the highest yield (139.41 ± 7.6 µg/g), whereas 1:10 and 1:1 DES only presented trace levels. Ferulic acid was also best extracted with the 2:1 DES (379.96 ± 24 µg/g), while quercetin showed comparable values among the 1:10, 1:2, and 1:1 mixture (66–68 µg/g), with no detectable amount in the 2:1 DES.
These differences highlight how the molar ratio directly shapes solvent polarity, hydrogen-bond network strength, and analyte affinity, ultimately determining extraction efficiency. ChCl/LA 2:1 consistently yielded the highest amounts—especially for naringin, caffeic acid, and ferulic acid suggesting that this ratio enhances the disruption of the plant matrix and the release of phenolic compounds. This agrees with reports indicating that DES based on choline chloride and organic acids efficiently solubilize phenolic compounds due to strong hydrogen bonding and high affinity for hydroxylated structures [47,48,49].
When compared with previous studies, the extraction performance achieved here is highly competitive. For instance, Stabrauskiene et al. (2022) reported 4310 ± 125 µg/g of naringin in grapefruit peel using 50% ethanol and UAE [50], whereas Gupta et al. reported 880 µg/g in Citrus sinensis peel [51]. The values obtained in the present study (up to 1150 µg/g) fall within this expected range, and in some cases exceed the yields reported for sweet orange peel.
Similarly, caffeic acid levels obtained here (139.41 ± 7.6 µg/g) greatly surpassed those reported by Moreira and De Souza (32.5 ± 0.5 µg/g) using Physalis angulata extracts under UAE [52]. Ferulic acid extraction was also markedly improved, yielding almost three times more than the 132 µg/g reported for Lycium barbarum using maceration [53].
Overall, the combination of ChCl/LA DES with UAE proved highly efficient for recovering phenolic compounds from orange peel. These results reinforce that DES composition, particularly at a 2:1 molar ratio, decisively influences extraction selectivity and yield. Moreover, the use of Amberlite XAD-7 resin after extraction ensured the removal of residual DES, allowing precise quantification and enhancing the suitability of the extracts for potential applications in food and pharmaceutical formulations fully aligned with green chemistry principles and sustainable biorefinery strategies.
In Table 5, “TR” indicates that the compound was detected in the UHPLC-DAD chromatogram, but its peak area fell below the limit of quantification (LOQ) and limit of detection (LOD) of the analytical method and therefore could not be reliably quantified. Based on previously validated UHPLC-DAD methods for phenolic compounds in citrus matrices, typical detection thresholds fall within the following ranges: naringin (LOD 0.02–0.05 µg/mL; LOQ 0.06–0.15 µg/mL), caffeic acid (LOD 0.01–0.03 µg/mL; LOQ 0.03–0.10 µg/mL), quercetin (LOD ~0.02 µg/mL; LOQ~0.06 µg/mL), and ferulic acid (LOD~0.03 µg/mL; LOQ~0.10 µg/mL). Peaks falling below these LOQ values were reported as trace (“TR”). These LOD/LOQ values are consistent with the detection limits observed under the UHPLC-DAD conditions used in this study.
3.7. Pectin Gravimetry and FTIR
The yield of pectin extracted from dried orange peel using different ChCl/LA solvent systems is shown in Table 6. The ChCl/LA 1:10 formulation resulted in the lowest extraction efficiency (1.73 ± 0.19%), followed by the 1:2 mixture (2.41 ± 0.26%). In contrast, the ChCl/LA 1:1 solvent exhibited the highest extraction yield (48.24 ± 5.01%), indicating that this molar ratio was the most effective for pectin recovery. The ChCl/LA 2:1 mixture showed moderate extraction efficiency (6.74 ± 0.79%).
Table 6.
Pectin extraction yield (%) from dried orange peel using different solvents.
The 1:1 ChCl/LA formulation produced the greatest pectin yield. This outcome is likely related to the proton-donating capacity of lactic acid, which promotes the cleavage of the linkages that anchor pectin to the plant cell wall matrix, thereby improving its liberation. Previous studies, such as Shafie et al. [54], have reported that the acidic environment generated by DES promotes pectin dissociation, thus increasing extraction efficiency. However, excessive acidity could potentially degrade the pectin structure, which might explain the lower yields observed with other DES formulations in this study. Another possible explanation for the reduced yields is solvent viscosity [29]. Measured pH values showed that the ChCl/LA 1:1 solvent had a pH of 4, while the other mixtures ranged between pH 3 and 5. Although previous research suggests that pectin extraction is typically more efficient under highly acidic conditions (pH 1–2.2) [55,56], the 1:1 DES (pH 4) exhibited the highest yield in this study. This suggests that, beyond pH, other parameters such as solvent viscosity and specific interactions between the solvent and the plant matrix also play crucial roles in pectin extraction efficiency [57,58].
Figure 5 shows the FTIR spectra of the pectin extracts obtained using the different DES formulations, compared with commercial pectin.
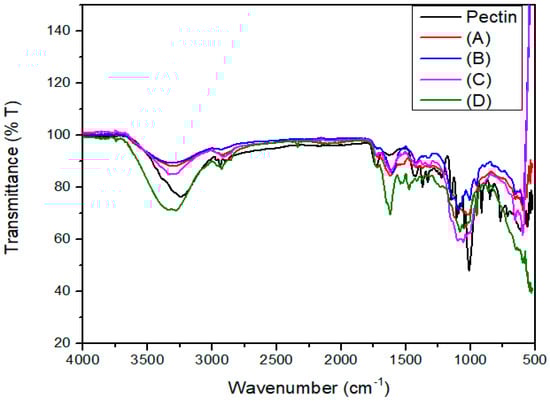
Figure 5.
FTIR spectra of pectin extracts obtained using different DES molar ratios and commercial pectin. Pectin (black line): commercial standard; (A) ChCl/LA 1:10; (B) ChCl/LA 1:2; (C) ChCl/LA 1:1; (D) ChCl/LA 2:1.
The FTIR spectrum of the pectin isolated under the conditions identified as optimal in this study shows a broad absorption band near 3400 cm−1, which is attributed to the O–H stretching vibrations of hydroxyl groups. This is consistent with findings reported by Manrique and Lajolo in pectin extracted from papaya peel [59]. Additionally, absorption bands in the region between 2926 and 2858 cm−1 were associated with stretching and bending vibrations of C–H bonds (CH, CH2, CH3 groups), as reported by Gnanasambandam and Proctor in commercial pectin samples [60], indicating the presence of methyl groups in the structure.
Key spectral features were also observed at 1743 and 1651 cm−1, corresponding to esterified carbonyl groups (C=O) and non-esterified carboxylate ions (COO−), respectively. These bands confirm that the extracted samples possess a chemical structure comparable to that of high-purity commercial pectin [55]. Furthermore, the intensity of the ester carbonyl band suggests that the extracted pectin is highly esterified, with a degree of esterification (DE) greater than 50%, consistent with findings reported by Liang et al. for pectin extracted from passion fruit peel [61].
4. Conclusions
In this study, UAE with DES based on choline chloride and lactic acid (ChCl/LA) at different molar ratios were evaluated for its efficiency in recovering pectin, bioactive compounds, as well as for assessing antimicrobial and antioxidant activities. The ChCl/LA 1:10 (A) mixture achieved the highest overall extraction yield, demonstrating its effectiveness in extracting soluble compounds from orange peel, while ChCl/LA 1:1 (C) formulation exhibited the greatest affinity for polysaccharides, yielding the highest pectin content. In contrast, ChCl/LA 2:1 (D) system showed the strongest antimicrobial activity and the highest recovery of compounds with potential pharmaceutical and food industry applications. Overall, the results indicate that ChCl/LA based DES can be tailored by adjusting the molar ratio to optimize specific extraction objectives, representing a sustainable and versatile alternative for the valorization of orange peel.
Author Contributions
Bioassays, A.D.-C.; conceptualization, E.V.-V.; antimicrobial methodology and supervision, C.R.-M. and C.L.-R.; antioxidant assay and supervision, S.A.G.-R.; extraction, chemical quantification and supervision, C.C.-Z., I.J.-R. and E.V.-V. All authors have read and agreed to the published version of the manuscript.
Funding
This research was funded by PROACTI-UANL project 8-CAAFE-2024, and the Government of the State of Nuevo León through I2T2/2025: C25-002.
Data Availability Statement
The original contributions presented in this study are included in the article. Further inquiries can be directed to the corresponding author.
Acknowledgments
A.D.-C thanks the master’s scholarship to CONAHCYT (1273651).
Conflicts of Interest
The authors declare no conflict of interest.
Abbreviations
The following abbreviations are used in this manuscript:
| DES | Deep Eutectic Solvent |
| UAE | Ultrasound-Assisted Extraction |
| MAE | Microwave-Assisted Extraction |
| PLE | Pressurized Liquid Extraction |
| SFE | Supercritical Fluid Extraction |
| CC | Choline Chloride |
| LA | Lactic Acid |
| GAE | Gallic Acid Equivalent |
| TPC | Total Phenolic Content |
| DPPH | 2,2-Diphenyl-1-picrylhydrazyl |
| TFC | Total Flavonoid Content |
| NaDES | Natural Deep Eutectic Solvent |
| μg/g | Micrograms per Gram |
| mmol | Millimole |
| HPLC | High-Performance Liquid Chromatography |
| FTIR | Fourier-Transform Infrared Spectroscopy |
| MeOH | Methanol |
| EtOH | Ethanol |
| HCl | Hydrochloric Acid |
| Na2CO3 | Sodium Carbonate |
| DMSO | Dimethyl Sulfoxide |
| CFU | Colony Forming Units |
| UHPLC | Ultra-High-Performance Liquid Chromatography |
| PDA | Photodiode Array |
| Rpm | Revolutions Per Minute |
| cP | Centipoise |
| GA | Gallic Acid |
| μL | Microliter |
| mL | Milliliter |
| °C | Degrees Celsius |
| Nm | Nanometer |
| DS | Standard Deviation |
| SD | Standard Deviation |
| TEAC | Trolox Equivalent Antioxidant Capacity |
| TR | Trace |
| DAD | Diode Array Detector |
| DE | Degree of Esterification |
| ROS | Reactive Oxygen Species |
| HBD | Hydrogen Bond Donor |
| HBA | Hydrogen Bond Acceptor |
References
- Zavala, G.; Servín, B. Productores citrícolas del Estado de Nuevo León, características, problemas y alternativas. Interstic. Soc. 2022, 24, 365–392. [Google Scholar] [CrossRef]
- Carrillo Tepole, J.M.; Moranchel Madrid, L.; Soto Innes Ayala, S.M.; Vásquez Payró, O. Extracción del Pigmento de la Cáscara de Naranja para su uso Como Tinta no Tóxica en Marcatextos; Universidad Iberoamericana Puebla: Puebla, Mexico, 2018; Available online: https://repositorio.iberopuebla.mx/handle/20.500.11777/3854 (accessed on 9 June 2025).
- Russo, C.; Maugeri, A.; Lombardo, G.E.; Musumeci, L.; Barreca, D.; Rapisarda, A.; Cirmi, S.; Navarra, M. The Second Life of Citrus Fruit Waste: A Valuable Source of Bioactive Compounds. Molecules 2021, 26, 5991. [Google Scholar] [CrossRef]
- Tomás, F.; Vallejo, F. Estudio del Metabolismo y Biodisponibilidad de las Flavanonas de Zumo de Naranja y el Efecto de los Tratamientos Tecnológicos y Biotecnológicos para Mejorar la Absorción. Ph.D. Thesis, Universidad de Murcia, Murcia, Spain, 2022. [Google Scholar]
- Prakash Maran, J.; Sivakumar, V.; Thirugnanasambandham, K.; Sridhar, R. Optimization of Microwave Assisted Extraction of Pectin from Orange Peel. Carbohydr. Polym. 2013, 97, 703–709. [Google Scholar] [CrossRef]
- Barotto, A.J. Extracción verde de aceites esenciales. Investig. Joven 2021, 7, 13231. Available online: https://revistas.unlp.edu.ar/InvJov/article/view/13231 (accessed on 15 June 2025).
- Khan, M.K.; Abert-Vian, M.; Fabiano-Tixier, A.S.; Dangles, O.; Chemat, F. Ultrasound-Assisted Extraction of Polyphenols (Flavanone Glycosides) from Orange (Citrus sinensis L.) Peel. Food Chem. 2010, 119, 851–858. [Google Scholar] [CrossRef]
- Chemat, F.; Rombaut, N.; Sicaire, A.G.; Meullemiestre, A.; Fabiano-Tixier, A.S.; Abert-Vian, M. Ultrasound-assisted extraction of food and natural products: Mechanisms, techniques, combinations, protocols and applications—A review. Ultrason. Sonochemistry 2017, 34, 540–560. [Google Scholar] [CrossRef]
- López-Salazar, H.; Camacho-Díaz, B.H.; Ocampo, M.L.A.; Jiménez-Aparicio, A.R. Microwave-Assisted Extraction of Functional Compounds from Plants: A Review. Bioresources 2023, 18, 6614–6638. [Google Scholar] [CrossRef]
- Mustafa, A.; Turner, C. Pressurized liquid extraction as a green approach in food and herbal plants extraction: A review. Anal. Chim. Acta 2011, 703, 8–18. [Google Scholar] [CrossRef] [PubMed]
- Reverchon, E.; De Marco, I. Supercritical fluid extraction and fractionation of natural matter. J. Supercrit. Fluids 2006, 38, 146–166. [Google Scholar] [CrossRef]
- Corona, E.; Martínez, N.; Ruiz, H.; Carranza, J. Extracción Asistida por Ultrasonido de Compuestos Fenólicos de Semillas de Chía (Salvia hispanica L.) y su Actividad Antioxidante. Agrociencia 2016, 50, 403–412. Available online: https://www.scielo.org.mx/scielo.php?script=sci_arttext&pid=S1405-31952016000400403 (accessed on 3 June 2025).
- Guadarrama Rangel, C.F. Síntesis y Caracterización de Disolventes Eutécticos Profundos Naturales para la Extracción de Contaminantes desde Fases Acuosas. Master’s Thesis, Universidad Nacional Autónoma de México, Mexico City, Mexico, 2024. Available online: https://ru.dgb.unam.mx/jspui/handle/20.500.14330/TES01000857772 (accessed on 9 June 2025).
- Sánchez, J.; González, E.; González, M. Formación y Caracterización de Disolventes Eutécticos Profundos: Aplicación de la Extracción de Moléculas de Interés. Bachelor’s Thesis, Universidad Politécnica de Madrid, Madrid, Spain, 2019. Available online: https://oa.upm.es/56070/ (accessed on 9 June 2025).
- Abbott, A.P.; Harris, R.C.; Ryder, K.S.; D’Agostino, C.; Gladden, L.F.; Mantle, M.D. Glycerol Eutectics as Sustainable Solvent Systems. Green Chem. 2011, 13, 82–90. [Google Scholar] [CrossRef]
- Dai, Y.; van Spronsen, J.; Witkamp, G.-J.; Verpoorte, R.; Choi, Y.H. Natural deep eutectic solvents as new potential media for green technology. Anal. Chim. Acta 2013, 766, 61–68. [Google Scholar] [CrossRef]
- Van Hung, P.; Anh, M.N.T.; Hoa, P.T.; Phi, N.T.L. Extraction and characterization of high methoxyl pectin from Citrus maxima peels using different organic acids. J. Food Meas. Charact. 2021, 15, 1541–1546. [Google Scholar] [CrossRef]
- Azaga, R.M.M. Surfactant Aggregation in DESs. 2018. Available online: https://ethos.bl.uk/OrderDetails.do?uin=uk.bl.ethos.762674 (accessed on 25 June 2025).
- Monroy-García, I.N.; Carranza-Torres, I.E.; Carranza-Rosales, P.; Oyón-Ardoiz, M.; García-Estévez, I.; Ayala-Zavala, J.F.; Morán-Martínez, J.; Viveros-Valdez, E. Phenolic profiles and biological activities of extracts from edible wild fruits Ehretia tinifolia and Sideroxylon lanuginosum. Foods 2021, 10, 2710. [Google Scholar] [CrossRef]
- Murray, P.R. The Clinician and the Microbiology Laboratory. Elsevier Ebooks 2015, 1, 191–223. [Google Scholar] [CrossRef]
- Alancay, M.M.; Lobo, M.O.; Quinzio, C.M.; Iturriaga, L.B. Extraction and physicochemical characterization of pectin from tomato processing waste. J. Food Meas. Charact. 2017, 11, 2119–2130. [Google Scholar] [CrossRef]
- Duwee, Y.S.; Kiew, P.L.; Yeoh, W. Multi-objective optimization of pectin extraction from orange peel via response surface methodology: Yield and degree of esterification. J. Food Meas. Charact. 2022, 16, 1710–1724. [Google Scholar] [CrossRef]
- Omar, K.A.; Sadeghi, R. Physicochemical Properties of Deep Eutectic Solvents: A Review. J. Mol. Liq. 2022, 360, 119524. [Google Scholar] [CrossRef]
- Sazali, A.L.; AlMasoud, N.; Amran, S.K.; Alomar, T.S.; Pa’ee, K.F.; El-Bahy, Z.M.; Yong, T.K.; Dailin, D.J.; Chuah, L.F. Physicochemical and Thermal Characteristics of Choline Chloride-Based Deep Eutectic Solvents. Chemosphere 2023, 338, 139485. [Google Scholar] [CrossRef] [PubMed]
- Vanegas Mantilla, C. Obtención de Bacterias Ácido-Lácticas Mediante Aislamiento en el Kéfir de Leche, para la Optimización en la Síntesis de Ácido Láctico por Fermentación. Master’s Thesis, Universidad de los Andes, Bogotá, Colombia, 2014. Available online: http://hdl.handle.net/1992/16476 (accessed on 5 September 2025).
- Liew, S.Q.; Ngoh, G.C.; Yusoff, R.; Teoh, W.H. Acid and Deep Eutectic Solvent (DES) Extraction of Pectin from Pomelo (Citrus grandis L. Osbeck) Peels. Biocatal. Agric. Biotechnol. 2017, 13, 1–11. [Google Scholar] [CrossRef]
- Alcalde, R.; Gutiérrez, A.; Atilhan, M.; Aparicio, S. An Experimental and Theoretical Investigation of the Physicochemical Properties on Choline Chloride–Lactic Acid Based Natural Deep Eutectic Solvent (NADES). J. Mol. Liq. 2019, 290, 110916. [Google Scholar] [CrossRef]
- Abbasi, N.M.; Farooq, M.Q.; Anderson, J.L. Investigating the Effect of Systematically Modifying the Molar Ratio of Hydrogen Bond Donor and Acceptor on Solvation Characteristics of Deep Eutectic Solvents Formed Using Choline Chloride Salt and Poly-alcohols. J. Chromatogr. A 2022, 1667, 462871. [Google Scholar] [CrossRef]
- Vidal Barrios, K.A. Funcionalización de Soportes Cerámicos Mediante Recubrimientos Nanométricos Obtenidos a partir de Disolventes Eutécticos Profundos (DES) para Remover CO2. Bachelor’s Thesis, Instituto Politécnico Nacional, Mexico City, Mexico, 2019. [Google Scholar]
- Dai, Y.; Witkamp, G.; Verpoorte, R.; Choi, Y.H. Tailoring Properties of Natural Deep Eutectic Solvents with Water to Facilitate Their Applications. Food Chem. 2015, 187, 14–19. [Google Scholar] [CrossRef]
- Abbott, A.P.; Capper, G.; Gray, S. Design of Improved Deep Eutectic Solvents Using Hole Theory. ChemPhysChem 2006, 7, 803–806. [Google Scholar] [CrossRef]
- Abdallah, M.M.; Cardeira, M.; Matias, A.A.; Bronze, M.R.; Fernández, N. Lactic Acid-Based Natural Deep Eutectic Solvents to Extract Bioactives from Marine By-Products. Molecules 2022, 27, 4356. [Google Scholar] [CrossRef]
- Airouyuwa, J.O.; Mostafa, H.; Riaz, A.; Maqsood, S. Utilization of natural deep eutectic solvents and ultrasound-assisted extraction as green extraction technique for the recovery of bioactive compounds from date palm (Phoenix dactylifera L.) seeds. Ultrason. Sonochem. 2022, 91, 106233. [Google Scholar] [CrossRef] [PubMed]
- Nazari-Mahroo, H.; Pasandideh, K.; Navid, H.; Sadighi-Bonabi, R. Influence of Liquid Density Variation on the Bubble and Gas Dynamics of a Single Acoustic Cavitation Bubble. Ultrasonics 2019, 102, 106034. [Google Scholar] [CrossRef] [PubMed]
- Ferreira, C.; Sarraguça, M. A Comprehensive Review on Deep Eutectic Solvents and Its Use to Extract Bioactive Compounds of Pharmaceutical Interest. Pharmaceuticals 2024, 17, 124. [Google Scholar] [CrossRef]
- Isci, A.; Kaltschmitt, M. Recovery and recycling of deep eutectic solvents in biomass conversions: A review. Biomass Convers. Biorefinery 2021, 12, 197–226. [Google Scholar] [CrossRef]
- Jiménez-Ortega, L.A.; Basilio Heredia, J. Disolventes Eutécticos Profundos: Un Nuevo Enfoque a la Química de Productos Naturales (Parte I). Gobierno de México, 3 February 2022. Available online: https://www.ciad.mx/disolventes-eutecticos-profundos-un-nuevo-enfoque-a-la-quimica-de-productos-naturales-parte-i/ (accessed on 25 April 2024).
- Leouifoudi, I.; Harnafi, H.; Zyad, A. Olive Mill Waste Extracts: Polyphenols Content, Antioxidant, and Antimicrobial Activities. Adv. Pharmacol. Sci. 2015, 2015, 714138. [Google Scholar] [CrossRef] [PubMed]
- Oroian, M.; Dranca, F.; Ursachi, F. Comparative Evaluation of Maceration, Microwave and Ultrasonic-Assisted Extraction of Phenolic Compounds from Propolis. J. Food Sci. Technol. 2019, 57, 70–78. [Google Scholar] [CrossRef]
- Azuola, R.; Vargas, P. Extracción de Sustancias Asistida por Ultrasonido (EUA). Tecnol. Marcha 2007, 20, 30–40. [Google Scholar]
- Ruesgas-Ramon, M.; García-Sosa, K.; Peña Rodríguez, L.M. Solventes Eutécticos Profundos Naturales (NaDES) y su Probable Función en las Plantas. BioTecnología 2023, 27, 2. [Google Scholar]
- Kolarević, L.; Horozić, E.; Ademović, Z.; Kundalić, B.Š.; Husejnagić, D. Influence of Deep Eutectic Solvents (DESs) on Antioxidant and Antimicrobial Activity of Seed Extracts of Selected Citrus Species. Int. Res. J. Pure Appl. Chem. 2020, 120–128. [Google Scholar] [CrossRef]
- Limón, D.; Díaz, A.; Mendieta, L.; Luna, F.; Zenteno, E.; Guevara, J. Los Flavonoides: Mecanismo de Acción, Neuroprotección y Efectos Farmacológicos. Mensaje Bioquímico 2010, 34, 143–155. [Google Scholar]
- Velázquez-Guadarrama, N.; Galindo, J.C.V.; Venegas, G.E.; Galindo, J.A.; Cerezo, S.G.; Frías, M.N. Resistencia a Linezolid en Staphylococcus aureus Resistente a Meticilina y Enterococos con Elevada Resistencia a Aminoglucósidos en un Hospital Pediátrico de Tercer Nivel. Bol. Med. Hosp. Infant. Méx. 2010, 67, 19–26. Available online: https://www.scielo.org.mx/scielo.php?script=sci_arttext&pid=S1665-11462010000100003 (accessed on 25 April 2024).
- Zhao, Y.; Liu, S. Bioactivity of Naringin and Related Mechanisms. Pharmacology 2021, 76, 359–363. [Google Scholar] [CrossRef]
- Seukep, A.J.; Zhang, Y.; Xu, Y.; Guo, M. In Vitro Antibacterial and Antiproliferative Potential of Echinops lanceolatus Mattf. (Asteraceae) and Identification of Potential Bioactive Compounds. Pharmaceuticals 2020, 13, 59. [Google Scholar] [CrossRef]
- Avilés, E.V.; Figueroa, I.I.; Martínez, E.S.; Camacho, M.C.B.; Flores, H.E.M.; Pérez, M.E.G. Polifenoles: Propiedades Antioxidantes y Toxicológicas. Universidad de Cuenca, 2017. Available online: https://publicaciones.ucuenca.edu.ec/ojs/index.php/quimica/article/view/1583 (accessed on 25 September 2025).
- Arriaga González, I. Evaluación del Efecto Anticancerígeno y Anti-inflamatorio de los Ácidos Fenólicos Presentes en Nejayote Derivado del Maíz Variedad Bolita. Master’s Thesis, CIIREG-IPN-Oaxaca, Oaxaca, Mexico, 2021. [Google Scholar]
- Álvarez, M.J.M.; Camacho, D.R.B.; Sánchez, M.P.; Matos, M.V.; García, D. Evaluación de la Actividad Antioxidante de Extractos de Flavonoides de Cáscara de Naranja en el Aceite de Soja Desodorizado. Interciencia 2004, 29, 532–538. Available online: https://www.redalyc.org/articulo.oa?id=33909611 (accessed on 25 September 2025).
- Stabrauskiene, J.; Marksa, M.; Ivanauskas, L.; Bernatoniene, J. Optimization of Naringin and Naringenin Extraction from Citrus × paradisi L. Using Hydrolysis and Excipients as Adsorbent. Pharmaceutics 2022, 14, 890. [Google Scholar] [CrossRef]
- Gupta, I.; Adin, S.N.; Aqil, M.; Mujeeb, M. QbD Based Extraction of Naringin from Citrus sinensis L. Peel and Its Antioxidant Activity. Pharmacogn. Res. 2023, 15, 145–154. [Google Scholar] [CrossRef]
- Moreira, G.C.; De Souza Dias, F. Mixture Design and Doehlert Matrix for Optimization of the Ultrasonic Assisted Extraction of Caffeic Acid, Rutin, Catechin and trans-Cinnamic Acid in Physalis angulata L. and Determination by HPLC-DAD. Microchem. J. 2018, 141, 247–252. [Google Scholar] [CrossRef]
- Inbaraj, B.S.; Lu, H.; Kao, T.; Chen, B. Simultaneous Determination of Phenolic Acids and Flavonoids in Lycium barbarum L. by HPLC–DAD–ESI-MS. J. Pharm. Biomed. Anal. 2010, 51, 549–556. [Google Scholar] [CrossRef]
- Shafie, M.H.; Gan, C. Could Choline Chloride–Citric Acid Monohydrate Molar Ratio in Deep Eutectic Solvent Affect Structural, Functional and Antioxidant Properties of Pectin? Int. J. Biol. Macromol. 2020, 149, 835–843. [Google Scholar] [CrossRef] [PubMed]
- García-García, P.M.; Galindo-Alcántara, A.; Del Carmen Ruiz-Acosta, S. Métodos de Extracción de Pectina en Frutos: Revisión Sistemática. Ecosist. Recur. Agropecu. 2023, 10, e3728. [Google Scholar] [CrossRef]
- Chen, S.; Xiao, L.; Li, S.; Meng, T.; Wang, L.; Zhang, W. The Effect of Sonication-Synergistic Natural Deep Eutectic Solvents on Extraction Yield, Structural and Physicochemical Properties of Pectins Extracted from Mango Peels. Ultrason. Sonochem. 2022, 86, 106045. [Google Scholar] [CrossRef]
- Pandharipande, S.; Makode, H. Separation of Oil and Pectin from Orange Peel and Study of Effect of pH of Extracting Medium on the Yield of Pectin. J. Eng. Res. Stud. 2012, 3, 6–9. [Google Scholar]
- Fakayode, O.A.; Abobi, K.E. Optimization of Oil and Pectin Extraction from Orange (Citrus sinensis) Peels: A Response Surface Approach. J. Anal. Sci. Technol. 2018, 9, 1. [Google Scholar] [CrossRef]
- Manrique, G.D.; Lajolo, F.M. FT-IR Spectroscopy as a Tool for Measuring Degree of Methyl Esterification in Pectins Isolated from Ripening Papaya Fruit. Postharvest Biol. Technol. 2002, 25, 99–107. [Google Scholar] [CrossRef]
- Gnanasambandam, R.; Proctor, A. Determination of Pectin Degree of Esterification by Diffuse Reflectance Fourier Transform Infrared Spectroscopy. Food Chem. 2000, 68, 327–332. [Google Scholar] [CrossRef]
- Liang, Y.; Yang, Y.; Zheng, L.; Zheng, X.; Xiao, D.; Wang, S.; Ai, B.; Sheng, Z. Extraction of Pectin from Passion Fruit Peel: Composition, Structural Characterization and Emulsion Stability. Foods 2022, 11, 3995. [Google Scholar] [CrossRef] [PubMed]


Disclaimer/Publisher’s Note: The statements, opinions and data contained in all publications are solely those of the individual author(s) and contributor(s) and not of MDPI and/or the editor(s). MDPI and/or the editor(s) disclaim responsibility for any injury to people or property resulting from any ideas, methods, instructions or products referred to in the content. |
© 2025 by the authors. Licensee MDPI, Basel, Switzerland. This article is an open access article distributed under the terms and conditions of the Creative Commons Attribution (CC BY) license (https://creativecommons.org/licenses/by/4.0/).