Abstract
Of all terrestrial ecosystems, peatlands store carbon most effectively in long-term scales of millennia. However, many peatlands have been drained for peat extraction or agricultural use. This converts peatlands from sinks to sources of carbon, causing approx. 5% of the anthropogenic greenhouse effect and additional negative effects on other ecosystem services. Rewetting peatlands can mitigate climate change and may be combined with management in the form of paludiculture. Rewetted peatlands, however, do not equal their pristine ancestors and their ecological functioning is not understood. This holds true especially for groundwater-fed fens. Their functioning results from manifold interactions and can only be understood following an integrative approach of many relevant fields of science, which we merge in the interdisciplinary project WETSCAPES. Here, we address interactions among water transport and chemistry, primary production, peat formation, matter transformation and transport, microbial community, and greenhouse gas exchange using state of the art methods. We record data on six study sites spread across three common fen types (Alder forest, percolation fen, and coastal fen), each in drained and rewetted states. First results revealed that indicators reflecting more long-term effects like vegetation and soil chemistry showed a stronger differentiation between drained and rewetted states than variables with a more immediate reaction to environmental change, like greenhouse gas (GHG) emissions. Variations in microbial community composition explained differences in soil chemical data as well as vegetation composition and GHG exchange. We show the importance of developing an integrative understanding of managed fen peatlands and their ecosystem functioning.
1. Introduction
Peatlands cover only 3% of the global land area. Yet, they contain more carbon in their peat than all forests combined [1]. This carbon store has accumulated over thousands of years, because plant material is only partially decomposed due to water saturated conditions lacking in oxygen. Of the 400 million hectares of peatland in the world, about 65 million hectares, i.e., 16% of the peatland area or about 0.4% of the global land area, are drained [1,2]. In Europe, the total peatland area is 593,727 km2 (5.4% of the total surface area), and almost half (46%) of this area is drained [3]. The area affected by drainage is probably even larger, as drainage ditches may also influence neighboring areas not drained themselves [4].
Drainage leads to aeration of the peat soil, resulting in aerobic decomposition and associated greenhouse gas (GHG) emissions. The global carbon dioxide (CO2) emissions from oxidative decomposition of drained peatlands have been estimated to total 1.15 × 10⁹ t CO2 [2], or about 3% of the total anthropogenic emissions in 2016 (39 × 109 t CO2) [5]. Drainage, moreover, leads to the release of nutrients and dissolved compounds into receiving waters and ultimately into the sea, to the loss of characteristic biodiversity, to reduced water retention and flood control, and to the loss of the paleo-archive [2,6].
Pristine peat holds large amounts of water (often > 95% Vol). Drainage removes water and as a result, the peatland subsides, reducing the capacity for water storage and regulation. Along with physical collapse and compaction, continued decomposition of the aerated peat results in height losses of up to several centimeters per year [7]. Microbial decomposition is accelerated by addition of lime, fertilizer, sand or clay [8] and height losses are further enhanced by wind and water erosion [9,10] and peat fires [11]. The ongoing subsidence of the peatland surface means that drainage ditches have to be deepened regularly to maintain the desired lower water table. In this way, subsidence may ultimately result in the loss of productive land when the drainage limit is reached, land becomes flooded or salt water intrudes from below [2]. The danger of peatland subsidence in coastal areas in combination with rising sea levels caused by climate change is increasingly recognized [12,13,14].
To decrease GHG emissions, nutrient loss, and the subsidence of peatlands, rewetting is an important tool. For decades, peatlands have been rewetted mainly for nature conservation purposes. Early on, the focus was to restore vegetation and, thus, biodiversity in general, in cutover bogs. This type of restoration became an important issue in peatland management from the 1970s onwards in countries such as Germany (peatland protection program in Lower Saxony/Germany in 1985 described in [15]), Ireland, the Netherlands, later followed e.g., by Finland and Canada [16,17]. More recently, the mitigation of GHG emissions as well as nutrient retention [18] has become a major incentive for rewetting, e.g., in North America [19] and Central Europe [20]. Rewetting has been shown to effectively decrease CO2 emissions because peat decomposition is prevented [21,22,23,24]. Thus, peatland rewetting has a large potential for reducing emissions [25] while providing additional benefits for biodiversity, flood control, or nutrient retention, amongst others [6,26].
However, not all rewetting efforts can serve climate and conservation purposes alone, as they are usually accompanied by loss of land for agriculture or forestry. Research on peatlands has so far strongly focused on Sphagnum-dominated, acid-oligotrophic, rainwater-fed raised bogs. Such peatlands dominate in boreal, (sub)arctic and temperate-oceanic regions [27]. However, mainly temperate continental, meridional and (sub)tropic regions suitable for agriculture face anthropogenic degradation of peatlands. In these regions, groundwater-fed, often base-rich and rather eutrophic fens dominate [2]. To prevent the loss of land for agriculture and forestry upon rewetting in these areas, we need land use options also on rewetted peatlands. This is the purpose of paludiculture, i.e., the sustainable and productive use of rewetted and wet peatlands [2]. When introducing paludiculture on formerly drained land, we are creating a novel ecosystem that is neither the same as rewetted, abandoned peatlands without agricultural use nor comparable to drained, agriculturally managed peatlands.
Rewetting of peatlands and especially of fens is a relatively new measure with little understood consequences, as many of the pilot sites are still in a transitional phase. Therefore, studies on restoration development or success are sparse [28,29,30] (but see, e.g., [31,32,33]) and it is largely unknown to what extent rewetting can turn fens back into their original state before drainage. Clearly, peat has been lost, and so far there is only scarce evidence that rewetting might generate new peat formation [23,34]. Moreover, drainage can alter peat properties and cause it to have low hydraulic conductivity [35] and become hydrophobic [36,37]. These processes are not easily reversible by rewetting (ibid.). What happens on rewetted peatlands that are used for paludiculture is even less well understood. However, it is important to comprehend these newly-formed ecosystems and their functioning in order to manage them sustainably.
As we have seen, both rewetting and agricultural management affect diverse aspects of peatland ecosystems. All these are intimately connected to each other as well as to water and nutrient management. This means that scientific principles for the sustainable cultivation of rewetted peatlands can only be developed with strong integration across disciplines. This is the core idea of WETSCAPES, a collaborative, interdisciplinary approach that aims at increasing our understanding of rewetted, agriculturally used fen peatlands in order to make recommendations for their sustainable use. In the following, we explain the approach and introduce the installed infrastructure and multitude of methodological approaches of the first WETSCAPES project. Further, we show how integration across disciplines may foster our understanding of the ecosystem functioning of rewetted fen peatlands and enable us to identify new research questions.
2. The WETSCAPES Approach
Both the change of water levels and agricultural use have a wealth of effects on the characteristics of fen peatlands (Table 1). So far, these have usually been studied in disciplinary approaches investigating one or sometimes two interlinked aspects at a time. For a first understanding of main causal relationships, this is a valid approach. However, this will not lead to a profound understanding of the peatland ecosystem as needed for finding sustainable management options. First approaches for interdisciplinary investigations of wetland management and restoration included the founding of the interdisciplinary research field ecohydrology, aiming at a better understanding of the interplay between hydrological factors and the restoration and development of wet or rewetted ecosystems [38]. Involved scientific fields are often vegetation science, hydrology and soil science. Despite the importance of such first interdisciplinary approaches, we argue that this is not sufficient, as it leaves out important aspects such as peat formation or the development of GHG emissions, which have to be taken into account when aiming for a better understanding of ecosystem functioning.

Table 1.
Conceptualized characterisation of differently managed fen peatlands with key unknowns marked by question marks. They were derived based on discussions among authors relying on their expertise in the different research fields.
Ecosystem functioning in fen peatlands is a result of interactions among many factors and biogeochemical processes. Therefore, it can only be understood following an integrative approach of the relevant fields of science (Figure 1). Addressing the interactions among water transport and chemistry, primary production, peat formation, matter transformation and transport, microorganisms and GHG exchange is important for developing an integrative understanding of managed fen peatlands as novel ecosystems and their services in terms of production (paludiculture), water protection, climate regulation, and soil conservation (Figure 1). To achieve such an understanding, in WETSCAPES, we integrate the expertise of the relevant fields of science to answer the following central research questions (titles are mirrored from Figure 1, involved fields shown in brackets):
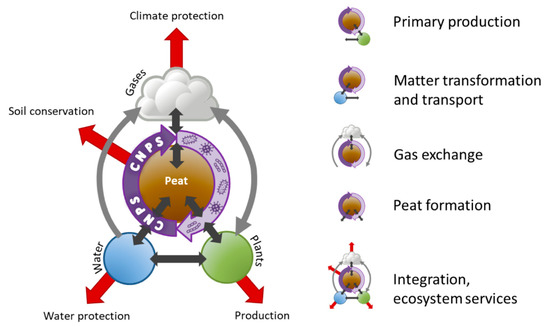
Figure 1.
Interactions of a peatland ecosystem. Here, primary production addresses the production of plant biomass. The production function is of particular importance for paludicultural systems. Peat formation means the potential re-growth of peat. Matter transformation and transport deals with nutrient cycling concerning the elements carbon (C), nitrogen (N), phosphorus (P) and sulfur (S). Gas exchange looks into the production and exchange of the greenhouse gases carbon dioxide, methane and nitrous oxide. The thin arrows represent the integration between the research areas, the red arrows represent ecosystem services.
- Primary production: How does the water level influence the production of above- and below-ground herbaceous and tree biomass? (plant ecology, ecosystem dynamics, soil physics, soil science, paleoecology)
- Matter transformation and transport: How are nutrients and water transported through the peat body? (soil physics, soil science, microbiology)
- Gas exchange: Which (microbial) processes lead to production and uptake of GHG and what are the driving factors? (microbiology, landscape ecology and grassland sciences for measuring GHG fluxes, soil science)
- Peat formation: How does the interplay of production and decomposition of above- and below-ground herbaceous and tree biomass drive peat growth? (plant ecology, ecosystem dynamics, paleoecology, soil physics, soil science, microbiology)
- Integration, ecosystem services: Can we develop indicators for ecosystem services of rewetted, agriculturally used peatlands? (input from all of the above, landscape ecology, paleoecology, geoinformatics, remote sensing)
Interacting Research Areas in the WETSCAPES Approach
Primary production: The production and decomposition of above- and belowground biomass are key factors in the carbon budget, because primary production of vascular plants (and in particular roots) determines the amount of carbon input into the fen peat [39]. Some temperate fen peatlands are treed, for instance with Black alder (Alnus glutinosa). For these, tree rings provide a unique opportunity to retrospectively study the influence of changing groundwater levels on tree growth [40,41]. Species identity and composition are potentially important drivers of production, peat formation, and GHG emissions. The growth and turnover of root biomass is particularly important for the formation or degradation of fen peat [42]. Vegetation composition and growth are influenced by the water table and nutrient availability, which again interact.
Microbiology: The microbiomes of peat soils are composed of bacteria, archaea and microbial eukaryotes and are important agents of carbon, nitrogen (N) and phosphorus (P) cycling. The phylogenetic composition and expression of catalyzing enzymes play a major role in peat formation and GHG emission [43,44]. Methane (CH4), for example, is almost exclusively produced by methanogenic archaea as an end product of anaerobic respiration [45,46]. Another functional group, the methanotrophic bacteria, oxidize a substantial fraction of the produced CH4, thus forming the so-called biological CH4 filter in soils [47,48,49]. The microbiome of temperate fens and the role of rewetting for the composition of microbial communities are currently widely unexplored. Effects of paludiculture use and interactions with other plant and soil factors are even less understood.
Soil physics: The actual soil water regime driven by site-specific soil physics and the resulting redox conditions are of pivotal importance for peat development as well as for bio-geochemical transformation processes in peat [50]. Both the quantitative (water storage) as well as the qualitative function (filter and buffer) of peat soils in the water cycle are major components of the overall ecosystem function of wetlands. The quantitative function is strongly related to the porosity and the soil water retention capacity of peat soils as these properties determine the landscape plasticity regarding large seasonal and annual variability of precipitation [51]. In comparison to mineral soils, little is known about the hydro-physical properties of peat soils, especially soil water retention properties [52]. Therefore, it is important to derive relations between organic matter content and parameters describing the soil water retention function. Qualitative aspects such as the water-based transport of nutrients from peatlands to adjacent water bodies provide important information for the sustainability of ecosystem services of peatlands. The saturated hydraulic conductivity (Ks) of peat soils is a driving parameter of water flux and solute transport. However, it is unknown how Ks varies in space and time [53]. Information on how Ks and other soil physical properties are auto-correlated is a necessity for the modelling of water flux and solute transport in heterogeneous porous media.
Soil chemistry: Plant nutrients enter fen peatland ecosystems mainly by lateral transport from surrounding agricultural landscapes through erosion, runoff and seepage and compared with bogs to a smaller extent by atmospheric deposition. Also, groundwater fluctuation, in situ mineralization of peat, and fertilization may introduce nutrients or make them available, in particular in drained peatlands. Long-term application of mineral fertilizer combined with peat mineralization due to artificial drainage may strongly increase the concentrations of plant nutrients in agriculturally used peatlands [54,55]. Furthermore, seasonal temperature variation, predominant plant species, soil and water chemistry all influence the plant nutrient status of peatlands [54,56,57]. Removing degraded peat surface layers has been recommended to decrease nutrient stocks to accelerate restoration of degraded peatlands [28,58]. A nutrient-rich peat layer, however, may also enhance peat formation and lead to high carbon sequestration [54]. Understanding the nutrient sources and dynamics in peatlands are prerequisites for understanding the implications of actions and optimizing restoration measures and to support water authorities and landscape managers in environmental decision making.
GHG exchange: In terms of reducing GHG emissions, maintaining water levels around soil surface seems to be optimal [59]. However, a water table near the surface requires active water management after rewetting to prevent flooding after decades of subsidence and will often be unfeasible due to pronounced differences in site topography. High CH4 emissions have been reported for some inundated fens during the first few years after rewetting [60,61,62], likely as a result of vegetation dieback and the increased availability of easily degradable carbon. Thus, information on the interactions among primary production, microbial processes, soil nutrients and GHG emissions of CH4 and CO2 and how they are changing under rewetting and paludiculture is required to inform sustainable management. Besides the carbon gases, the GHG nitrous oxide (N2O) may be emitted, especially from drained organic soils [63]. So far, it has been assumed that denitrifiers are the main contributors to N2O production in wet peatlands [64,65]. However, N2O can also be produced by fungal denitrification, co-denitrification or even more aerobic processes like nitrification, nitrifier denitrification, or aerobic denitrification depending on conditions [66]. Information on sources of N2O is largely missing for rewetted fens and paludicultures. These areas could also act as sinks for N2O. An uptake of N2O and further reduction to N2 has been occasionally measured in mineral soils [67], but so far, a systematic analysis of this sink function is missing for peatlands. Linking better knowledge of N2O sources and sinks with microbiome information, nutrient dynamics, hydrological information and plant growth as well as the development of other GHGs would greatly foster our ability to develop sustainable solutions for rewetted peatlands.
Peat formation: Peatlands owe their existence to the incomplete carbon and nutrient cycling that leads to the accumulation of peat [36]. In contrast to raised bogs, where peat growth is based on the relatively simple upwards growth of Sphagnum mosses [8,68], peat formation in fens seems to be driven by another mechanism: The roots and rhizomes of sedges, grasses and woody plants grow into an already existing, older matrix. The resulting displacement peat is therefore consisting of material from different times and requires other approaches in chrono-stratigraphical research. Existing models of peat formation [69,70,71], based on research of raised bogs, are therefore not suited to explain peat growth in fens. For a deeper understanding of the formation of displacement peat as well as of degradation due to drainage, a synopsis of palaeo records with results of microbiological and abiotic analyses as well as information on root growth is compulsory.
Remote sensing: Remote sensing allows us to assess and monitor a certain area of interest on different scales in space and time, and to temporally interpolate and upscale the observed factors and processes. Data from the spatial scale of unmanned aerial vehicles (plot or ecosystem) to the global scale of satellite data helps developing a broad variety of applications. Remote sensing informs various fields of research such as biology, soil sciences, hydrology, or ecology. Monitoring concepts for peatlands, however, are still missing, and only limited information and methods are available for effectively mapping and assessing the condition of these ecosystems [72].
3. The WETSCAPES Research Infrastructure and Methods
In WETSCAPES, all research centers around six main study sites featuring the same set of field installations and measurements. All study sites are located in Mecklenburg-Vorpommern in northern Germany (Figure 2). They cover the three most common peatland types in this region: Alder forest (A), percolation fen (P), and coastal fen (C). The six study sites are arranged in pairs: For each peatland type, two paired sites as comparable as possible were selected, one drained (D) and the other one rewetted (W, Figure 2). The upper peat in all sites is mostly strongly degraded due to ongoing or former soil drainage (Figure 3 and Table 2). Unfortunately, it was not feasible to have replications of study sites within the scope of the project due to two main obstacles. First, three comparable sites for one peatland type, especially for the rewetted state, were simply not available. Second, the resulting effort and costs would be far beyond the budget even of well-funded projects like WETSCAPES. As the best compromise, we decided to design the study as described to enable coverage of the three major peatland types while improving generalizability by working with a sound level of replicates on the selected sites (Figure 4).
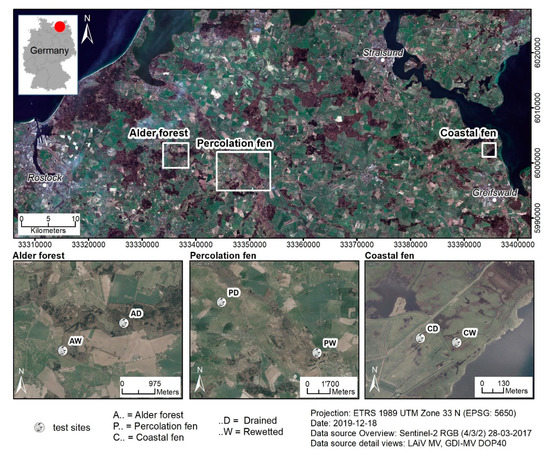
Figure 2.
Locations of the WETSCAPES study area (inset on the top left), the study site pairs in Mecklenburg-Vorpommern (top) and locations of the paired sites (one drained [D], one rewetted [W]) for the three major peatland types covered (bottom), from left to right: Alder forest (A), Percolation fen (P), Coastal fen (C).
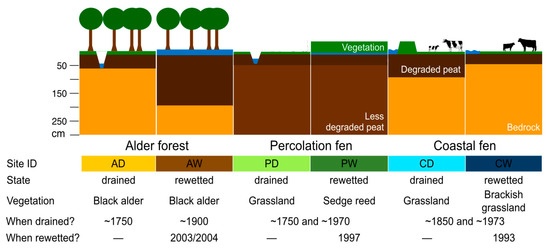
Figure 3.
General characteristics of the WETSCAPES study sites.
Table 2.
Some peat characteristics of the WETSCAPES study sites. Dry bulk densities refer to 10–20 cm below surface, all other peat chemical parameters to 0–20 cm below surface. NO3−-N in CD and CW was below detection limit.
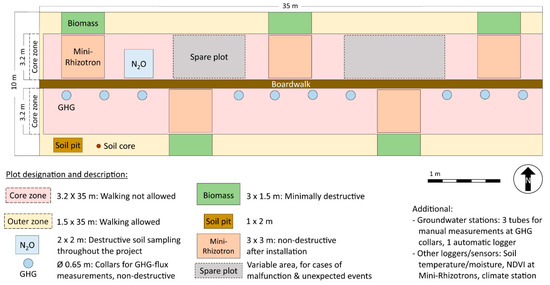
Figure 4.
Layout of the monitoring setup at the WETSCAPES study sites. The sites are oriented from east to west wherever possible, but in some cases, they are slightly tilted to be able to cover similar vegetation across the whole plot.
3.1. Study Sites
3.1.1. Alder Forest
Alder forests typically develop on the margin of different fen types, on the banks of rivers and creeks, and on shallow lake shores. Therefore, Black alder (Alnus glutinosa (L.) Gaertn.) does not necessarily grow on peat but can still be peat forming [36]. Black alder is able to tolerate stagnant water. In symbiosis with the bacterium Frankia alni, Black alder trees are able to fix atmospheric nitrogen. In northeastern Germany, alder forests constitute 20% of the area [73], occurring on different peatland types including those formed by terrestrialisation, surface flow, water rise, flooding and at springs. Due to drainage and agricultural utilization, the occurrence of alder forests has been strongly reduced (ibid.). The peat at the site AD (Alder forest drained) is rather shallow and strongly degraded (see Table 2 for details). The site has been forested at least since 1786 (Wiebekings map) and was likely drained for this purpose even earlier. Today, there is a mixed stand of Black alder and European ash (Fraxinus excelsior L.). The herb layer features a mixture of Urtica dioica L., Aegopodium podagraria L., Poa trivialis L., Rubus idaeus L., and Glechoma hederacea L. The site AW (Alder forest rewetted), where Black alder is the only tree species, likely followed the developments in the nearby ‘Bauernmoor’ despite being just outside the western boundary of this area. The trees here did not die when the ‘Bauernmoor’ was rewetted (see below). The herb layer at AW consists mainly of bare soil/open water (depending on water level) with interspersed Carex acutiformis and C. riparia, Hottonia palustris and Solanum dulcamara. The peat layer at AW is much thicker compared to AD and reaches well over 2 m (Table 2), although both are located in local depressions. The difference likely derives from mid-scale spatial heterogeneity in peat formation, presumably due to the height of the outlet base of the depressions relative to the general topography.
The history of the ‘Bauernmoor’ close to AW is well documented in maps since the end of the 17th century. Back then, it was used as a pasture and was only sparsely forested, although most likely already (partially) drained. At the end of the 19th century, forest pasture was abandoned and a Black alder-European ash forest developed. Around 1900, the area was effectively drained and afterwards managed as production forest. The wetter parts, however, were always dominated by Black alder and European ash. The poor maintenance of ditches has led to an increasing occurrence of waterlogging since the 1990s. In 2003, an active rewetting of the depression was initiated.
3.1.2. Percolation Fen
Percolation fens are the most common peatland type in the young Pleistocene moraine landscapes of the Southern Baltic region, covering for instance about 75,000 ha [74] of the total peatland area of about 290,000 ha in Mecklenburg-Vorpommern. They formed after the last glacial period (~11,000 years BP) in meltwater channels left by the retreating ice. Therefore, they fill almost all the wide valley bottoms that intersect the moraine plates like a net. Rising sea levels during the Littorina transgression (~7000 BP) flooded the valleys and caused the formation of deep Gyttja layers, i.e., subhydric muds that form by sedimentation of peat, algae and other detritus under limnic conditions. Later, when the water levels recessed, peat bodies of mainly reed and sedge origin developed on top of them. Percolation fens were especially suited for intensive agricultural use, since they were easy to be drained and initially very fertile [36]. Accordingly, after being moderately drained and used as a pasture from about 1750 onwards, comprehensive hydrological reconstructions were started in the Recknitz and Trebel valley to intensify cultivation of the fen areas in the 1960s. The works included channeling of the riverbeds, deepening and re-organization of the ditch system and construction of pumping stations. Finally, the existing fen areas were deeply ploughed, sown, and fertilized for use as intensive grasslands. After a few years of high agricultural production, the areas quickly degraded and yields decreased. As a result of the widespread and deep drainage, percolation fens in Mecklenburg-Vorpommern subsided by > 1 m within a few decades [36]. The early 1990s were characterized by a short period of abandonment in the Trebel valley following German reunification. Later, the area was rewetted together with over 3,000 ha of peatlands along the river valley in a program financed by EU-LIFE. The drained site PD was not in this project, but the rewetted site PW was.
The paired sites are located in different river valleys, PD in the Recknitz valley (from old slavic “little river” [75]), PW in the Trebel valley (from old slavic “river through cleared land”) that were connected during the Littorina transgression. The sites share a distance of about 8 km. PD is a quite uniform grassland, mainly consisting of Ranunculus repens and Deschampsia cespitosa with some Holcus lanatus and Poa trivialis. In contrast, the vegetation around PW is a diverse mosaic of several dominant stands that developed after rewetting in the early 1990s and can be considered near natural today [76]. Within the PW study site, the vegetation is dominated almost exclusively by Carex acutiformis with only scarce occurrences of Epilobium hirsutum.
The two percolation fens in the Recknitz and Trebel valley belong to the largest connected fen complexes in northeastern Germany, together covering ~109,000 ha (according to an analysis of the latest peatland map of Mecklenburg-Vorpommern). Today, they still contain up to 10 m deep peat. At the study sites, however, peat reaches less deep, to ~5 m at PD and to ~6 m at PW (WETSCAPES team, unpublished data). Around the water divide between the two rivers, the two combined valleys are ~5 km wide. The divide is very shallow, only about 2 m of elevation separate the rivers. The center of this area is covered by ~400 ha of > 1 m thick ombrotrophic peat, which started growing approx. 2000 years ago [77]. Very likely, hydrologically favorable conditions caused by ground water moving horizontally through this large peatland complex led to low nutrient levels in the peat on the water divide in the middle of the peatland and drove peat growth.
3.1.3. Coastal Fen
Coastal fens cover about 40,000 ha in Mecklenburg-Vorpommern because shallow coasts prevail in that late pleistocene landscape. Of these, 20,000 ha were covered with brackish grassland at the end of the 19th century, which are at the southern coast of the Baltic Sea thought to be of anthropozoogenic origin [79,80]. Without cattle grazing, which has been reported from coastal areas in the region since the 13th century, reed stands prevail in shallow coastal lagoons [81] and it is questionable whether these would sustain ongoing peat growth. Trampling by cattle hoofs increases soil bulk density and supports the incorporation of fresh litter, which is thereby protected from decomposition [80]. Thus, peat is built up, allowing these brackish grasslands to grow above the mean water line, in turn leading to better conditions for the growth of the relevant plants, creating a positive feedback loop [82]. Otherwise, brackish grasslands are ephemeral, short-lived, and only cover very small areas, for instance in front of cliffs or connected to beach walls [80]. In the long run, the anthropozoogenic brackish grasslands, with their relatively dense peat and comparably small carbon content, can only prevail under adapted grazing [80,82].
Both coastal fen sites are located between Greifswald and Stralsund on a small peninsula within two parts of a formerly continuous coastal flooding fen. The entire area has been diked by low summer dikes since 1850 to allow for pasture and agricultural use. In the 1920s, windmills were installed to drain the area. The dikes were enlarged in 1971–1974, at the same time the drainage system was extended. Only small areas in front of the dikes were still subject to regular flooding. In 1993, the old dikes were removed and today’s dikes built. One of our study sites (CW) is outside, the other (CD) is behind the dike. Thus, CW has been flooded regularly, mainly during winter, since 1993. Due to the non-permanent water logging and sediments being washed in with flooding and cattle grazing, the peat in both CW and CD is rather shallow and relatively dense (Table 2). The vegetation differs between CD, which consists of a productive grassland community mainly dominated by Deschampsia cespitosa, Calamagrostis epigejos, Agrostis stolonifera, and Elymus repens (L.) Gould s. str. and CW, which is dominated by A. stolonifera and E. repens, intermingled with Juncus gerardii.
3.2. Sampling Design and Field Setup
Within each study site, a representative study area with a size of 10 m × 35 m was set up, with the short sides facing east and west whenever possible (Figure 4). In order to avoid disturbances to the ground, a central boardwalk has been built in longitudinal direction. A core zone where disturbances are minimized extends 3 m to the north and south of the boardwalk. Destructive work is implemented in the outer zone. The area has been fenced to exclude pasture and wild animals. Biomass export is simulated through regular cutting and biomass removal where appropriate. Plots have been clearly defined for each measuring activity, with spare plots for potential later requirements (Figure 4). In the following, an overview of the used methodology is given per research area.
3.3. Methodological Approaches
Paleoecology: We aim to characterize the macroscopic and microscopic remains of peat in different preservation stages formed through drainage and rewetting and potentially including an intermixture of old and new material. By means of high-resolution analysis of peat components, different degrees of decay of belowground biomass are described and quantified. For that purpose, we took six peat monoliths at the selected sites, froze them, and cut them into 0.5 cm slices with the DAMOCLES device [83]. A subsampling of these slices allows for analyses of plant macro- and microfossils in close spatial linkage to additional microbiological, soil chemical and physical analyses. The macrofossil analysis describes and quantifies morphotypes to classify certain degrees of decay of biomass. The microfossil analysis covers pollen and non-pollen palynomorphs as micro algae, fungal spores, thecamoebae and diverse kinds of tissues. It focuses on the description and cataloguing of decay stages of biomass and tries to identify unknown objects [84,85,86,87]. Pollen assemblages are used to date the peat layers by comparison with undisturbed pollen records from other sites, and supporting 134Cs-datings for the youngest layers are planned. The dating of deposits enables the estimation of peat accumulation rate and peat loss by drainage.
Experimental plant ecology: We quantify biomass production and biomass decomposition above- and (even more importantly for peat formation) below-ground as well as the temporal dynamics of these processes. Minirhizotrons, transparent tubes permanently installed in the soil in which a scanner is inserted, provide a non-destructive in-situ method to directly study roots [88] and are used in short time intervals during the growing seasons in order to quantify root dynamics. In-growth cores, made of plastic mesh (2 mm mesh size) filled with autochthonous soil material are used to study annual root biomass production. Further, litter bags allow determining the short-term rate of decomposition of leaf and root litter for different periods of time from 6–24 months [39]. In addition, we use standard material (commercially available tea bags from Lipton, Unilever) to gather data about decomposition rates comparable among the different fen types [89]. Normalized Difference Vegetation Index (NDVI) sensors measure the reflected near-infrared light (700–1300 nm) aboveground, which is correlated with dynamics of aboveground plant activity [90].
Ecosystem dynamics: To analyze the longer-term ecosystem dynamics and to identify tolerance limits to changing groundwater levels for A. glutinosa and other main tree species in surrounding forest stands in AD and AW, we use tree ring analyses. These retrospective analyses are complemented by high resolution monitoring of tree-growth (biomass production) and transpiration using point-dendrometers and sap flow sensors in the alder forest sites. Root-dendrometers and litter traps complement the setup. We use the data to directly connect small scale, intra-annual water level and climatic fluctuations to tree-growth parameters. Furthermore, they might serve as explanatory variables for temporal changes in CH4 emissions of alder stems [91]. Finally, wood anatomical analyses comparing vessel characteristics of trees from dry and wet sites as well as dendrochemical analyses help to understand (1) intra-specific adjustments to changing environmental conditions and (2) the CH4 transmission pathway from the peat through the stem.
Microbiology: The microbiomes of all six sampling sites are analyzed in replicated peat soil samples, in seasonal and spatial resolution. Using quantitative polymerase chain reaction (qPCR) assays on specific marker genes, the functional groups of methanogenic archaea, methane oxidizing bacteria and methane oxidizing archaea are quantified by qPCR [92,93]. Amplicon sequence analysis of 16S and 18S rRNA genes describe the community structure and relative abundance of prokaryotes and eukaryotes in the peat soil microbiota to genus and even species level. Broad metatranscriptomic approaches give insights into the transcriptional activity of peat soil microbiomes and their dynamics in mesocosm experiments [94,95]. Data are interpreted in relation to water level, climatic variations and site characteristics and used to better understand organic matter decomposition, element cycling and GHG emissions.
Soil hydrology: Undisturbed soil samples were collected from each site to determine hydro-physical properties of peat including dry bulk density, organic matter content, total porosity, Ks, and soil water retention. The obtained experimental results are combined with reported values from previous studies to build a comprehensive database of hydro-physical properties for peat soils differing in degradation stage. In addition, multiple Ks-measurements were conducted in the field employing a direct-push falling head piezometer following either a regular grid or field structures such as ditches. Leaching tests and numerical modelling were performed on peat soils differing in organic matter content in order to investigate the nutrient transport behavior of peat soils.
Soil science: To better understand soil organic matter status and turnover in drained and rewetted fens, soil samples from all study sites are analyzed using a range of standard chemical analyses like inductively coupled plasma optical emission spectrometry (ICP-OES), as well as pyrolysis field ionization mass spectroscopy (Py-FIMS), X-ray absorption near-edge structure (XANES) spectroscopy, and liquid size-exclusion chromatography with organic carbon and organic N detection (LC-OCD-OND). Data are interpreted in conjunction with results from other groups to identify potential risks related to organic matter turnover (e.g., GHG emissions or P mobilization) and find management options that decrease the risks and increase opportunities, e.g., for biodiversity development or nutrient sink functions.
Carbon processing and exchange: Measurements of CO2 and CH4 exchange aim at establishing a full carbon balance for all study sites to investigate whether carbon exchange differs significantly between drained and rewetted peatlands of the same type. Our measurements include the quantification of three major processes of carbon exchange between soil and atmosphere: (i) net ecosystem exchange (NEE), i.e., the sum of photosynthesis and ecosystem respiration (RECO); (ii) RECO for subtracting RECO from NEE to derive values for gross primary production (GPP), i.e., the amount of carbon fixed by photosynthesis; (iii) CH4 exchange. The first two are used to model the exchange of CO2 between soil and atmosphere. Since we are not able to measure the GPP of the trees, possible for instance with an eddy covariance tower measuring above the tree canopy, we are using proxies derived from the dendroecological measurements described above to include the carbon uptake of the trees in our annual balances of GHG exchange. RECO and CH4 emissions are measured biweekly with opaque chambers while NEE measurements take place monthly using transparent chambers with shading hoods to get data across a range of values of photosynthetic photon flux density (PPFD). All chambers are constructed of polyurethane with flexible sidewalls connected to circular collars (n = 5 per site) that were installed in the soil at 10-cm depth four months prior to measurements. The chambers are height adjustable and measurements take place in non-steady-state through-flow mode [96]. For concentration measurements in the chamber, infrared gas analysers (LI-COR®) are used for NEE, and Cavity Ring-Down Spectrometers (Picarro® GasScouter, Los Gatos Research ® UGGA) for RECO and CH4. We also measure CH4 and N2O emissions through Alder trees using chambers installed on five trees per site at three different heights per tree.
Nitrogen processing and exchange: We analyze both the amount of N2O emitted from the six study sites over time as well as its main sources. The former is measured biweekly since July 2017. The latter is accomplished by measuring the stable isotopes of N2O at regular intervals, accompanied by lab incubations using the dual-isotope method [97,98]. N2O uptake will be analyzed using 15N methods [99]. Further incubation studies accompany field measurements to get a better insight into the factors driving N2O emission and uptake in rewetted, agriculturally used peatlands. The data is analyzed using insights from microbiologists and soil scientists. Together with data on CO2 and CH4, N2O data will be used in calculations of complete GHG balances in order to get information on climate protection services of the studied peatlands.
Remote sensing: Since ecological parameters such as biomass, plant composition, GHG emissions, or vegetation vitality cannot be directly measured with remote sensing sensors, proxies have to be defined in order to derive such parameters. Once the proxies are identified and validated, they are tested at different spatial scales and various points in time in order to derive information on the spatial and temporal development of the peatland sites. Besides exploring turnover processes at the study sites, we also aim to examine land use change over a long period of time by using old maps and recent geodata. We benefit from a large set of georeferenced maps dating back to 1786, including maps of Wiebeking, Schmettau, and the second Prussian Land Survey that cover whole Mecklenburg [100] and can be employed as a web map service via the research platform of the project VKLandLab [101]. In addition, for the eastern part of the federal state (Vorpommern), map sheets from the Swedish Land Survey are used [102] and analogue map sheets from the first Prussian Land Survey are digitally edited. By combining old maps and current geodata, the land use of the selected sites was reconstructed for several time points from the 17th century to the present and analyzed by means of descriptive statistics and landscape metrics in order to draw conclusions about the historic and recent ecosystem services provided by these landscapes.
Data integration: Research data form a valuable pool of information that is collected at high cost and should be available to all collaborators of large projects during the project period and publicly available after completion of the research. GeoNetwork is a widely used open source meta information system. Through the integration of GeoServer, it offers the possibility to provide Web Map Service and Web Feature Service via the Open Geospatial Consortium standards and to process data via so-called Web Processing Services. The integration of our data into this platform allows us to build up and use data on topography, soil, relief, and drainage from existing official and open spatial data infrastructures together with data of our terrestrial measurements and remote sensing data. A data portal based on GeoNetwork 3.4.0 has been created to guarantee uncomplicated data management and data exchange among all involved researchers. This enabled us to address over-arching research questions that we can only answer by integrating our data across research fields. Together with our data collection being carried out—to a very large part—on the same study sites, regular workshops with all project partners and the establishment of two integrators, one at each participating institution, who try to identify common research questions and push for collaborative data analysis, with easy access to each other’s data stored with sufficient meta information, is key for successful integrated research on ecosystem functioning.
3.4. Interdisciplinary Data Analysis
We here limit the description of data processing and analyses to those carried out to obtain the results presented below, rather than giving a complete overview. To compare the climatic conditions during our field phase with long-term climate data, we analyzed both based on data of the German Weather Service (DWD). The majority of these data is freely available and we used the grid product (resolution of 1 km2). The interpolation from station data to grid data is well described [103] and usually performs well due to a combination of geophysical parameters, mainly elevation and distance-based methods. We extracted the available monthly data for mean temperature and precipitation of the grid cells where our study sites are located. Then, we calculated the average values for the latest climate reference period (1981–2010), extracted the values for the study years (2017, 2018, 2019) and calculated the respective anomalies, i.e., the deviation from the 30-year averages.
The vegetation composition in all GHG measurement collars is recorded regularly (percentage cover of all plants). In addition, we recorded plant community composition in summer 2017 in circular plots with 1 m radius (A = 3.14 m2) at 10 locations nearby the fenced sampling stations both within and outside each study site, generating 20 additional vegetation records per site. The latter data together with the first records in the collars were used to compute an NMDS (non-metric multi-dimensional scaling) ordination with the metaMDS() function of the vegan package [104] for R 3.6.1 [105] with defaults. NMDS is among the best all-purpose ordination methods for analyzing patterns in vegetation [106]. Being based on the initial calculation of a similarity matrix (usually with Bray-Curtis index [107]), it may also be used with non-vegetation datasets. In a truly explorative way, we calculated NMDS ordination plots using an extensive soil and porewater chemistry dataset, and a rarely conducted microbial sampling with replicates in space and time.
The soil and porewater data derived from a peat sampling campaign during which we extracted samples at four locations per study site at varying depth sections (0–10, 10–20, 20–30, 30–40, 40–60, 60–80 cm). In locations where peat did not reach that deep, we stopped at the bottom of the peat using the same depth sections stated above. In locations with deeper peat, the samples of the depths 20–30 cm and 30–40 cm were combined. Extracts with 0.01 M CaCl2 solution were used for the determination of soil pH at a 1:2.5 ratio of soil-to-solution at room temperature. The samples were analyzed for carbon, N, and sulfur (S) with a CNS analyzer (Vario MICRO cube, Elementar Analysensysteme GmbH Langenselbold, Germany), and for aluminum, calcium, iron, potassium (K), magnesium (Mg), manganese, P, S, zinc, and sodium (Na) by ICP-OES (Jobin Yvon 238 Ultrace, Instruments S.A. GmbH, D-85630 Grasbrunn, Germany) after extraction with acid ammonium oxalate [108]. Extracts with 1 M KCl solution were analyzed for dissolved organic matter (DOM), dissolved organic nitrogen (DON) and total N (Dimatec DIMATOC 2000), organic carbon and N fractions (LC-OCD-OND analyzer, DOC-Labor Huber, Karlsruhe, Germany), as well as for NH4+-N and NO3−-N (Continuous flow analyzer; Seal Analytical AutoAnalyzer 3); extracts with the double lactate method were analyzed for plant available K, Mg, and P with ICP-OES. In addition, we analyzed 3 mg of the extracts after freeze-drying with Py-FIMS to get quantitative relative information on the distribution of multiple carbon species. The data are reported in relative ion intensities and include information on carbohydrates, phenols, lignin dimers and monomers, heterocyclic N-compounds, peptides and suberin. For details regarding soil chemical analyses, see [109]. For the NMDS, all data were included and the soil chemical parameters were treated as variables.
The microbial community data were derived from soil cores collected repeatedly in triplicates from each of the study sites. Subsamples were taken from each core in depths of 5–10 cm, 15–20 cm and 25–30 cm, resulting in 54 individual samples per sampling date. DNA was extracted with the Qiagen Powersoil DNA extraction kit. DNA was quantified with Qubit (for details, especially regarding the establishment of the taxonomies see [110]). For the NMDS, all prokaryote data were included, i.e., the analysis is based on 25,864 taxonomical units over 209 samples (3 samples per site (6) × 3 depths × 4 sampling dates (April, August, and November 2017 and February 2018, with some depths sections at some sites and dates failing to give usable data)).
4. First Integrative Results
During the first 30 months of the WETSCAPES project, the weather was unusual, starting off with a very wet second half of 2017, followed by a major drought year in 2018 and a slow recovery year in 2019 (Table 3). Notably, 2019 still had a precipitation anomaly of up to −100 mm when only the months until October were considered, but a wet November and December lead to an annual precipitation around the average of the climate period 1981–2010. The highest precipitation anomaly in 2017 occurred at the Alder sites with precipitation around +200 mm (~30%) above the average (670 mm) of the climate reference period (1981–2010). This was mirrored by the water levels (Figure 5), which were above (rewetted sites) or slightly below or around (drained sites) ground surface in late 2017 and early 2018 and then dropped fast since April 2018, with the drained sites generally showing stronger drawdowns than the rewetted ones. Some of the sites did not fully recover in the study period despite some event-driven spikes in the water level data series. Although all annual average temperatures were well above the 30-year averages of the climate reference period, the temperature anomalies were much larger in the years 2018 and 2019. On average, 2018 was more than 1.3 °C warmer, whereas 2019 was more than 1.5 °C warmer compared to the reference period, with the largest deviation (+1.72 °C) occurring at the coastal site.
Table 3.
Climatic variation, i.e., differences between annual average temperatures (temperature anomaly) and annual sum of precipitation (precipitation anomaly) during the observation years and the average values during the climate reference period (1981–2010). All data were derived from the grid product of the German Water Service (freely available). The values were calculated based on monthly sums for precipitation and monthly averages for temperatures, which were extracted from the grid cells within which the study sites are located. The coastal sites are located in the same grid cell, hence there is only one column.
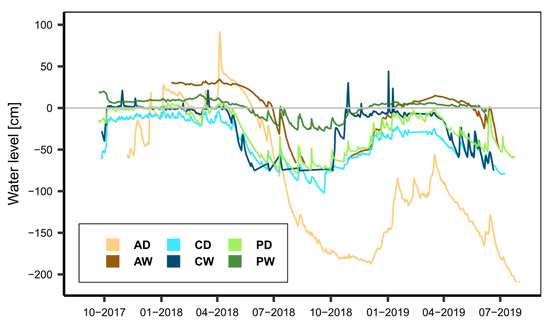
Figure 5.
Course of water levels in the study sites over the study period. Water levels are given relative to ground surface and were measured with SEBA Dipper PT (SEBA Hydrometrie) or CS457 connected to CS1000 datalogger (Campbell Scientific; the latter in the alder forest sites).
The vegetation of the study sites varied strongly among peatland types and hydrological states. Of all drained/rewetted pairs of sites, the percolation fens differed most from each other in terms of vegetation composition (Figure 6), whereas the strongest within-site variation could be found in sites PW and CD. The vegetation of each study site seems to be quite unique, as is already apparent from the mapping of the dominant plant species (Figure 6), with almost no overlap in species composition neither among peatland types nor between hydrological states (Figure 7c). The NMDS supports the patterns seen in the maps, with study sites with more variation in mapped structures (Figure 6) showing stronger spread in the ordination (Figure 7c), i.e., CD and PW. The coastal sites were most similar to each other (polygons connected in one point), whereas the percolation fens shared the largest distance in data space and had completely incongruent species composition. Wetness drove neither axis 1 nor axis 2 placement, since the rewetted sites were found at the ends of both axes.
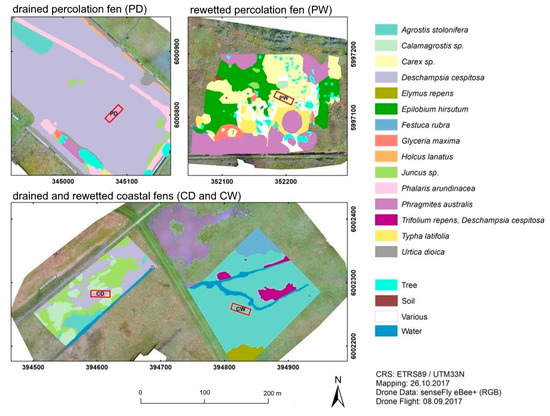
Figure 6.
Composition of dominant plant species surrounding the study sites in the drained percolation fen (PD), the rewetted percolation fen (PW) and the drained (CD) and rewetted (CW) coastal fen. The location of the study areas is indicated by red rectangles. The maps result from a survey of the study sites in October 2017 for stands dominated by vascular plants. These were then mapped using aerial photographs. Maps of vegetation structure are not available for the Alder sites, since aerial imagery is difficult to obtain below the tree canopies and mainly Alder would be visible from above.
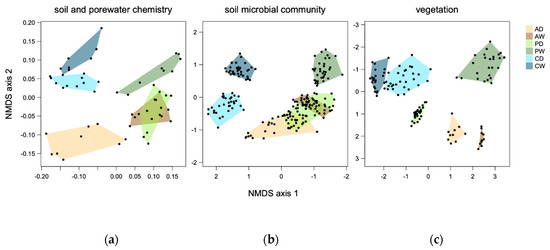
Figure 7.
NMDS ordinations based on different data sets. See methods for included variables. All NMDSs had comparatively low stress ((a): 0.12, (b): 0.10, (c): 0.05) and axes directions have been changed for soil microbial community on axis 1 and for vegetation on axis 2 to allow for easier comparison of patterns.
The NMDS plots of soil chemical variables and soil microbial community compositions of the prokaryotes looked similar but the patterns were not identical to the NMDS plot of the vegetation. The relative separation of PW from all other sites, but especially from CD and CW along axis 1 existed for all three groups of variables (Figure 7). This was combined with a similar spread within the sites, showing very different conditions among as well as medium variation within the study sites. The differentiation between the coastal sites was stronger for soil microbial communities than for the other parameters (Figure 7b). In contrast to the patterns in the NMDS plot of the vegetation, for the soil chemical variables, there was almost complete overlap between PD and AW, whereas the soil prokaryote communities in PD showed characteristics of both the communities in AD and AW.
A larger relative abundance of microbial groups with potentially anaerobic metabolism was observed in the rewetted sites [110]. The abundance of methanogens varied widely among the different sites and soil depths, ranging from approx. 1 × 10⁵ to 1 × 10⁷ mcrA genes per gram dry soil (Figure 8). As expected, the abundance of methanogens in rewetted sites was significantly larger than in the drained sites (Wilcoxon test; n = 54; p < 0.001), being in most cases > 10-fold larger in the top soils. However, there were large variations among the three sites: The coastal fen had the smallest abundance of methanogens with 106 to 105 mcrA gene copies per gram soil. In the percolation fen (107 and 106 mcrA copies per gram soil) and the drained alder forest (4×10⁵ mcrA copies per gram soil), the abundance showed no trend with depth, whereas abundance in the rewetted alder forest decreased with depth from 8 × 10⁶ to 9 × 10⁵ mcrA copies per gram soil. Also in the rewetted coastal fen, their abundance decreased with depth, whereas they increased in the drained and rewetted percolation fen. No significant tendency was detected in AD and CD.
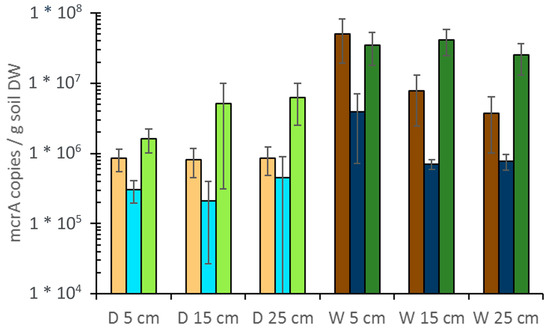
Figure 8.
Abundance of methanogens in drained (D) and rewetted (W) peat soils. Depth-resolved quantification of mcrA gene copies/g dry weight (DW). brownish: alder forest, blue: coastal fen, green: percolation fen. Primers used for qPCR: mlas-mod/mcrA-rev [111], DNA extracts were measured in concentrations of 2 ng/µl and 1 ng/µl in duplicates. Bars show the average of triplicate cores; error bars show standard deviation of triplicates.
GHG exchange at the study sites varied—at least for some gases—strongly among peatland types and/or hydrological states (Figure 9). CO2 exchange followed the vegetation seasons quite typically with larger GPP (negative values) and RECO (positive values) during the vegetation periods. Rewetted sites showed generally smaller CO2 emissions, with the exception of the Alder forests, where differences in CO2 exchange between wet and dry sites were minor. However, CO2 uptake of Alder trees based on dendro-ecological data has not been included here yet. Both GPP and RECO were largest at the coastal sites while the differences between the drained and rewetted states were largest in the percolation fens.
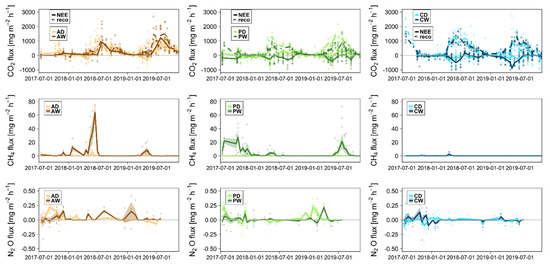
Figure 9.
Greenhouse gas exchange on all study sites over the course of the studied period; with dots showing measured fluxes, lines showing average fluxes and shaded area showing the standard deviation of fluxes at the measurement campaigns. Negative values represent uptake. Study sites are color coded (see legends). Top = CO2 exchange; dashed lines show RECO and solid lines show GPP. Middle = CH4 exchange. Bottom: N2O exchange. Please note the strongly varying y-axis scalings among gases.
The CH4 exchange patterns varied strongly among the peatland types, with generally larger CH4 production in rewetted sites (Figure 9). CH4 emissions were clearly smallest in the coastal sites where only few minor peaks occurred in CW over the whole period after flooding events, only two of which are visible at the scale used in Figure 9. In the rewetted percolation fen and Alder forest, there were periods with substantial CH4 emissions while the dry counterparts showed almost none. During the late vegetation season 2017 far into winter, CH4 emissions were quite large in PW. In 2018, however, the vegetation season peak was very small and in 2019 it was measured for a brief period in July, in both cases presumably caused by the ongoing drought conditions and the associated low water levels (Figure 5). In AW, there were only few CH4 emission events with no real seasonal pattern. N2O fluxes fluctuated around zero with some peak emission events showing no clear seasonal pattern (Figure 9). Some negative N2O fluxes were measured in all sites and may represent uptake events.
The total porosity of the investigated peat samples ranged from 0.6 to 0.9 cm3 cm–3 and the macroporosity (equivalent pore diameter > 50 μm; [112]) was found to vary from 0.04 to 0.12 cm3 cm–3. A synthesis of data from global boreal and temperate peatlands shows that total porosity and macroporosity are strongly related to bulk density (Figure 10a; R2 > 0.70, p < 0.001; [113,114]) and the data from our study sites fit nicely to the established relationship. However, in highly degraded peat soils (bulk density > 0.2 g cm–3), as we find them in our study sites, Ks varies strongly (Figure 10b).
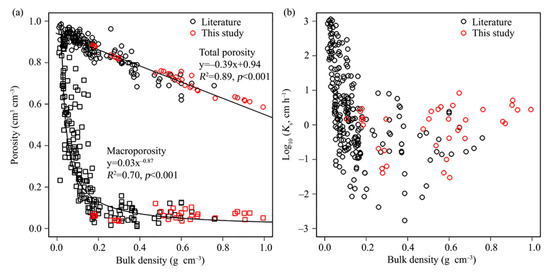
Figure 10.
Relationships between soil hydraulic variables as derived from extensive meta-analysis of the literature (black) and from our own measurements in the WETSCAPES study sites: (a) Porosity vs. bulk density with separation of micropores (squares) and total pores (circles); (b) Saturated hydraulic conductivity (Ks) vs. bulk density. For details on data acquisition and analysis, see [113].
5. Discussion and Outlook
The importance of climate variability calls for long-term studies. During the period studied in WETSCAPES so far, the climatic conditions were clearly exceptional when compared to the long-term average values of the last climate reference period, with a very wet autumn and winter 2017/2018 followed by a relatively fast drying out and two drought years 2018 and 2019. The latter is hidden in the annual data since precipitation from late autumn to the end of 2019 was more than average, making up the more than −100 mm anomaly present through October 2019. These conditions strongly influenced our data since our main control variable tested, the water level, showed little difference between drained and rewetted sites during parts of the study period (Figure 3). According to climate models, an increase in extreme events like droughts is expected [115,116]. Climate change can now even be detected in single weather events [117]. This means that “exceptional” years with strong anomalies are expected to occur more often in the future. While our data from a year with climatic conditions resembling the projected future provides a glimpse into ecosystem functioning under future conditions, sound conclusions call for long-term monitoring.
Addressing climate variability requires a combination of field monitoring and experimental approaches. Extreme weather and climate events may have profound implications for peatland ecosystems as shown for species and ecosystem management in general from a conservation perspective [118]. For a rewetted coastal peatland in northeastern Germany, the 2018 drought led to profound changes in the carbon balance that were partially compensated by major founding events in the vegetation that led to a longer photosynthetically active period (own observation). This all suggests a combination of diverse methodological approaches to draw generalizable conclusions based on synthesizing the results of field monitoring and experimental studies. This is in line with the core idea of WETSCAPES allowing to draw causal conclusions, i.e., high internal validity, based on a mesocosm experiment with controlled manipulation with research in the field with high external validity [119].
Indicators that reflect long-term effects like vegetation and soil chemistry show stronger differentiation between drained and rewetted state than variables with more immediate reaction to environmental change, like GHG emissions. Despite the drought and similar water levels in rewetted and drained sites, several variables studied like vegetation, microbial community composition, and soil chemical variables showed strong differentiation among the sites. Others, like GHG exchange, showed both strong differences between the hydrological states (CH4 PW >> PD) and unexpectedly similar values (e.g., CO2 CW ~ CD). The experienced specific climatic conditions may have played a major role in shaping these patterns. The plant communities at the sites were all strongly distinct. In part, the differentiation in coarse vegetation structures (Figure 6) and the differentiation in the NMDS based on plant species compositions (Figure 7c) seem to be driven by increased water levels of the rewetted sites. However, the relatively strong variation in land use on the drained/rewetted study site pairs likely had an influence as well. Judging from the plant composition, we expected large differences in soil characteristics and processes between PW and PD. However, the very clear differences in vegetation composition were not entirely mirrored in the soil chemical data and the microbial community data (Figure 7). In part, the overlap in the microbial communities of AW and PD may be related to the overlap in soil chemical conditions of the two sites. Quite likely, the latter is driven by the larger concentrations of N in the peat profiles (details in [109]) of AW and PD. However, although AD and AW showed no general overlap in soil chemical data, their microbial communities partially overlapped according to the NMDS ordination. This could be driven by microbial taxa that are strongly associated with Alder or trees in general.
Variation in microbial community composition can explain differences in soil chemical and other variables like vegetation composition and GHG exchange. The differentiation in vegetation along the wetness gradient is mirrored by larger numbers of potentially anaerobic microorganisms (Figure 7, detailed analyses of the microbial community data in [110]). Furthermore, the NH4+ concentrations in the rewetted soils were larger than at the drained ones, where NO3− concentrations were larger, except for CD. Larger NH4+ concentrations imply a decreased activity of nitrifiers at the rewetted sites. This should have an impact on sources and amounts of N2O emissions. The GHG exchange data series indicate indeed a generally slightly larger emission of N2O from the drained sites but so far, there are no reliable results on the microbial sources of N2O yet. The results of the microbial analyses support the difference among the coastal fens and the other sites that is very apparent in the vegetation analysis and mapping. This coincides with larger amounts of Na and K in the soil, probably due to the influence of the Baltic Sea. At the coastal sites, the NO3− concentrations were smaller than at the other sites. This could be due to the relationship between nitrifying and denitrifying organisms and the uptake of N by plants in these productive grassland communities (the high productivity can also be seen in the GHG exchange over time (Figure 9) with highest GPP of all sites in the vegetation period). For NO3−, movement with water is also possible and will be further investigated. Methanogens were more abundant in the rewetted sites, especially at the percolation fen. This is reflected in the CH4 emissions, which were largest here (see Figure 9 and [110] for an in-depth analysis of the relation between CH4 exchange and the microbial community composition).
Bulk density is a good proxy for soil pore structure and peat degradation state. The physical properties of the investigated peat samples varied over a wide range, confirming the pronounced diversity of peat [120,121]. Thus, water flow and transport properties should be evaluated separately for differently degraded peat soils [122]. Although the top soils in the investigated sites are in different degradation stages, the macroporosity and Ks were comparable (Figure 10). A previous study suggested that Ks does not necessarily decrease with an increase in bulk density because of the secondary porosity of peat (e.g., root channels, earthworm holes; [113]). The large correlation between Ks and macroporosity indicates that hydraulic properties of peat are highly affected by the pore structure. Thus, soil bulk density is an excellent descriptive parameter for soil pore structure. For boreal and temperate peatlands, the Ks values generally decrease with increasing soil bulk density. The values obtained from our study sites agreed well with the global relationships we established based on a meta-analysis [113], and thus confirm the general suitability of the derived functions for the estimation of soil hydro-physical properties.
Interdisciplinary approaches help us in answering old questions and developing new hypotheses. The NMDS plots from the WETSCAPES project in Figure 7 show how the integration of many disciplines can help us understand the manifold interactions in drained and rewetted fens used for agriculture and forestry. Combining data from a range of disciplines has on the one hand shown unsurprising interactions like those between relevant microbial communities and GHG emission. On the other hand, we have also found broadly similar patterns for vegetation, microbial communities and soil and pore water chemistry, pointing to similar driving forces behind these patterns. The range of data assembled improves our understanding of these driving forces. Furthermore, we derive correlations that can be tested within WETSCAPES and beyond to forecast ecosystem processes.
Interdisciplinary approaches help us to identify future directions of research on fen peatlands. The discussions in the WETSCAPES group have given rise to several further interdisciplinary ideas. For example, historical land use is being analyzed as well as the distribution of macro- and microscopic remains of peat over time both in relation to the ecosystem processes we measure today. Two further examples of future research directions that emerged from the interdisciplinary work in WETSCAPES shall illustrate the advantages of interdisciplinary peatland research. Re-establishing peat formation is, after all, the ultimate goal of peatland rewetting. To better understand the conditions required to achieve this goal, we need to comprehensively analyze the decomposition of biomass in the soil, combining data on root growth and decomposition with deep speciation of carbon and the analysis of N turnover as well as of the microbial community and their functional diversity. Another important motivation for peatland rewetting is to decrease GHG emissions. To better understand how microbes influence the production and emission of GHG in peatlands and in general we have to link GHG exchange (CO2, CH4, N2O) to microbial community composition and their functional diversity. Since both GHG measurements and gathering microbial data require huge efforts to get reliable results and have to be accompanied by the acquisition of further data on the environment to allow for comprehensive analyses of the relevant processes, interdisciplinary research is the solution. The joint analysis should be based on a wide range of data on microbial community composition and the diversity of the functionally most important groups, the paleoecological analysis of past peat turnover, the actual state of soil chemical variables as well as actual, i.e., measured exchange rates of CO2, CH4, and N2O plus the derived seasonal and annual balances of the exchange of these gases and their integration in GHG warming potentials.
A proper understanding of peat growth and ecosystem functioning in managed temperate peatlands is a prerequisite for managing them sustainably. Besides enabling an improved understanding of the growth of displacement peat in combination with results from other groups, the integration of our data will support our understanding of how peat has changed in managed temperate fens over time and how this has affected the processes therein. Understanding matter and nutrient fluxes in managed fen ecosystems is very important, especially with regard to the role of peatlands in the climate system and the export of nutrients to rivers, lakes and the sea. This is only achievable by analyzing these systems with a wide range of methods and disciplines. WETSCAPES is starting just that. The fact that almost all fen peatlands in temperate Europe are managed emphasizes the relevance of this research.
Author Contributions
Conceptualization, G.J., R.B., J.C., H.J., J.K., P.L., B.L., T.U., M.W. (Martin Wilmking), N.W.-M.; Methodology, S.A., A.A.-R., J.B.,F.B., G.B.-W., J.C., A.G., F.K., D.K., N.K., H.L., D.M., A.M., W.N., S.S. (Sandra Schenk), F.S., S.S. (Sarah Schwieger), M.S., L.T., H.W., M.W. (Micha Weil), D.Z.; Investigations, S.A., A.A.-R., J.B., F.B., G.B.-W., J.C., A.G., F.K., D.K., H.L., D.M., A.M., W.N., S.S. (Sandra Schenk), S.S. (Sarah Schwieger), M.S., L.T., H.W., M.W. (Micha Weil), D.Z.; Formal Analysis, S.A., A.A.-R., J.B., F.B., G.B.-W., J.C., A.G., F.K., D.K., H.L., D.M., A.M., W.N., S.S. (Sandra Schenk), S.S. (Sarah Schwieger), M.S., H.W., M.W. (Micha Weil); Writing - Original Draft Preparation, G.J., N.W.-M.; Writing - Review & Editing, S.A., A.A.-R., F.B., R.B., G.B.-W., J.C., H.J., F.K., J.K., F.S., F.T., H.W., M.W. (Martin Wilmking), D.Z.; Visualization, G.J., F.B., A.G., F.S., M.W. (Micha Weil); Funding acquisition, G.J., R.B., J.C., H.J., J.K., P.L., B.L., T.U., M.W. (Martin Wilmking), N.W.-M.; Project administration, F.S.; Supervision, G.J., R.B., H.J., J.K., P.L., B.L., T.U., M.W. (Martin Wilmking), N.W.-M. All authors have read and agreed to the published version of the manuscript.
Funding
This research was funded by the European Social Fund (ESF) and the Ministry of Education, Science and Culture of Mecklenburg-Western Pomerania within the scope of the project WETSCAPES (ESF/14-BM-A55-0027/16 to ESF/14-BM-A55-0035/16).
Acknowledgments
We are grateful to Christoph Jahnke, Christian Schmidt and all involved students for technical assistance in sampling and measuring within the project WETSCAPES. Furthermore, we thank our cooperation partners Erik Borg from German Arerospace Centre, Torsten Sachs from Helmholtz-Zentrum Potsdam Deutsches Geo Forschungs Zentrum GFZ, Dirk Michalik from Leibniz Institute for Catalysis and Ralph Meißner from Lysimeter Station Falkenberg of the Helmholtz Centre for Environmental Research.
Conflicts of Interest
The authors declare no conflict of interest. The funders had no role in the design of the study; in the collection, analyses, or interpretation of data; in the writing of the manuscript, or in the decision to publish the results.
References
- Joosten, H. The global peatland CO2 picture. In Peatland Status and Drainage Associated Emissions in All Countries of the World; Wetlands International: Wageningen, The Netherlands, 2009. [Google Scholar]
- Joosten, H.; Sirin, A.; Couwenberg, J.; Laine, J.; Smith, P. The role of peatlands in climate regulation. In Peatland Restoration and Ecosystem Services: Science, Policy and Practice; Bonn, A., Allott, T., Evans, M., Joosten, H., Stoneman, R., Eds.; Cambridge University Press: Cambridge, UK, 2016. [Google Scholar]
- Tanneberger, F.; Tegetmeyer, C.; Busse, S.; Barthelmes, A.; Shumka, S.; Moles Mariné, A.; Jenderedjian, K.; Steiner, G.M.; Essl, F.; Etzold, J.; et al. The peatland map of Europe. Mires Peat 2017, 19, 1–17. [Google Scholar]
- Poulin, M.; Rochefort, L.; Desrochers, A. Conservation of bog plant species assemblages: Assessing the role of natural remnants in mined sites. Appl. Veg. Sci. 1999, 2, 169–180. [Google Scholar] [CrossRef]
- Le Quéré, C.; Andrew, R.M.; Friedlingstein, P.; Sitch, S.; Pongratz, J.; Manning, A.C.; Korsbakken, J.I.; Peters, G.P.; Canadell, J.G.; Jackson, R.B.; et al. Global carbon budget 2017. Earth Syst. Sci. Data 2018, 10, 405–448. [Google Scholar] [CrossRef]
- Bonn, A.; Allott, T.; Evans, M.; Joosten, H.; Stoneman, R. Peatland Restoration and Ecosystem Services: Science, Policy and Practice; Cambridge University Press: Cambridge, UK, 2016. [Google Scholar]
- Couwenberg, J.; Dommain, R.; Joosten, H. Greenhouse gas fluxes from tropical peatlands in south-east Asia. Glob. Chang. Biol. 2010, 16, 1715–1732. [Google Scholar] [CrossRef]
- Clymo, R.S. Peat; Elsevier: Amsterdam, The Netherlands, 1983. [Google Scholar]
- Eggelsmann, R.; Blankenburg, J. Zur Entwicklung der Heidemoore am Nordhümmling in Niedersachsen. Available online: https://e-docs.geo-leo.de/handle/11858/7548 (accessed on 6 January 2020).
- Evans, C.D.; Chapman, P.J.; Clark, J.M.; Monteith, D.T.; Cresser, M.S. Alternative explanations for rising dissolved organic carbon export from organic soils. Glob. Chang. Biol. 2006, 12, 2044–2053. [Google Scholar] [CrossRef]
- Turetsky, M.R.; Donahue, W.F.; Benscoter, B.W. Experimental drying intensifies burning and carbon losses in a northern peatland. Nat. Commun. 2011, 2, 514. [Google Scholar] [CrossRef]
- Erkens, G.; van der Meulen, M.J.; Middelkoop, H. Double trouble: Subsidence and CO2 respiration due to 1,000 years of dutch coastal peatlands cultivation. Hydrogeol. J. 2016, 24, 551–568. [Google Scholar] [CrossRef]
- Hooijer, A.; Vernimmen, R.; Mawdsley, N.; Page, S.; Mulyadi, D.; Visser, M. Assessment of Impacts of Plantation Drainage on the Kampar Peninsula Peatland, Riau. Available online: https://www.deltares.nl/app/uploads/2015/12/Plantation-Impacts-Kampar-Peatland-DELTARES-2015.pdf (accessed on 10 March 2020).
- Hooijer, A.; Vernimmen, R.; Visser, M.; Mawdsley, N. Flooding Projections from Elevation and Subsidence Models for Oil Palm Plantations in the Rajang Delta Peatlands, Sarawak, Malaysia. Available online: https://www.preventionweb.net/files/45060_45060rajangdeltapeatlandsubsidencef.pdf (accessed on 10 March 2020).
- Schmatzler, B.; Schmatzler, E. Moorland. Moorlandschaften in Niedersachsen Nach Industriellem Torfabbau; Industrieverband Garten e.V.: Ratingen, Germany, 2010. [Google Scholar]
- Quinty, F.; Rochefort, L. Peatland Restoration Guide, Canadian Sphagnum Peat Moss Association: St. Albert, AB, Canada, 2003.
- Strack, M. Peatlands and Climate Change; International Peatland Society: Jyväskylä, Finnland, 2008. [Google Scholar]
- Scholz, M.; Trepel, M. Water quality characteristics of vegetated groundwater-fed ditches in a riparian peatland. Sci. Total Environ. 2004, 332, 109–122. [Google Scholar] [CrossRef]
- Chimner, R.A.; Cooper, D.J.; Wurster, F.C.; Rochefort, L. An overview of peatland restoration in North America: Where are we after 25 years? Restor. Ecol. 2017, 25, 283–292. [Google Scholar] [CrossRef]
- Andersen, R.; Farrell, C.; Graf, M.; Muller, F.; Calvar, E.; Frankard, P.; Caporn, S.; Anderson, P. An overview of the progress and challenges of peatland restoration in Western Europe. Restor. Ecol. 2017, 25, 271–282. [Google Scholar] [CrossRef]
- Wilson, D.; Blain, D.; Couwenberg, J.; Evans, C.D.; Murdiyarso, D.; Page, S.E.; Renou-Wilson, F.; Rieley, J.O.; Sirin, A.; Strack, M.; et al. Greenhouse gas emission factors associated with rewetting of organic soils. Mires Peat 2016, 17, 1–28. [Google Scholar]
- Wilson, D.; Farrell, C.A.; Fallon, D.; Moser, G.; Müller, C.; Renou-Wilson, F. Multiyear greenhouse gas balances at a rewetted temperate peatland. Glob. Chang. Biol. 2016, 22, 4080–4095. [Google Scholar] [CrossRef]
- Günther, A.; Huth, V.; Jurasinski, G.; Glatzel, S. The effect of biomass harvesting on greenhouse gas emissions from a rewetted temperate fen. GCB Bioenergy 2015, 7, 1092–1106. [Google Scholar] [CrossRef]
- Herbst, M.; Friborg, T.; Schelde, K.; Jensen, R.; Ringgaard, R.; Vasquez, V.; Thomsen, A.G.; Soegaard, H. Climate and site management as driving factors for the atmospheric greenhouse gas exchange of a restored wetland. Biogeosciences 2013, 10, 39–52. [Google Scholar] [CrossRef]
- Leifeld, J.; Menichetti, L. The underappreciated potential of peatlands in global climate change mitigation strategies. Nat. Commun. 2018, 9, 1071. [Google Scholar] [CrossRef]
- Bonn, A.; Reed, M.S.; Evans, C.D.; Joosten, H.; Bain, C.; Farmer, J.; Emmer, I.; Couwenberg, J.; Moxey, A.; Artz, R.; et al. Investing in nature: Developing ecosystem service markets for peatland restoration. Ecosyst. Serv. 2014, 9, 54–65. [Google Scholar] [CrossRef]
- Moen, A.; Joosten, H.; Tanneberger, F. Mire diversity in Europe: Mire regionality. In Mires an Peatlands of Europe; Joosten, H.T.F., Moen, A., Eds.; Schweizerbart Science Publishers: Stuttgart, Germany, 2017. [Google Scholar]
- Cabezas, A.; Pallasch, M.; Schönfelder, I.; Gelbrecht, J.; Zak, D. Carbon, nitrogen, and phosphorus accumulation in novel ecosystems: Shallow lakes in degraded fen areas. Ecol. Eng. 2014, 66, 63–71. [Google Scholar] [CrossRef]
- Knox, S.H.; Sturtevant, C.; Matthes, J.H.; Koteen, L.; Verfaillie, J.; Baldocchi, D. Agricultural peatland restoration: Effects of land-use change on greenhouse gas (CO2 and CH4) fluxes in the Sacramento-San Joaquin delta. Glob. Chang. Biol. 2015, 21, 750–765. [Google Scholar] [CrossRef]
- Lamers, L.P.M.; Vile, M.A.; Grootjans, A.P.; Acreman, M.C.; van Diggelen, R.; Evans, M.G.; Richardson, C.J.; Rochefort, L.; Kooijman, A.M.; Roelofs, J.G.M.; et al. Ecological restoration of rich fens in Europe and North America: From trial and error to an evidence-based approach. Biol. Rev. 2015, 90, 182–203. [Google Scholar] [CrossRef]
- Timmermann, T.; Margóczi, K.; Takács, G.; Vegelin, K. Restoration of peat-forming vegetation by rewetting species-poor fen grasslands. Appl. Veg. Sci. 2006, 9, 241–250. [Google Scholar] [CrossRef]
- Urbanová, Z.; Picek, T.; Hájek, T.; Bufková, I.; Tuittila, E.S. Impact of drainage and restoration on vegetation and carbon gas dynamics in Central European peatlands, extended abstract no. 214. In Proceedings of the 14th International Peat Congress, Stockholm, Sweden, 3–8 June 2012. [Google Scholar]
- Kotowski, W.; Acreman, M.; Grootjans, A.; Klimkowska, A.; Rössling, H.; Wheeler, B. Restoration of temperate fens: Matching strategies with site potential. In Peatland Restoration and Ecosystem Services: Science, Policy and Practice; Bonn, A., Allott, T., Evans, M., Joosten, H., Stoneman, R., Eds.; Cambridge University Press: Cambridge, UK, 2016. [Google Scholar]
- Hendriks, D.M.D.; van Huissteden, J.; Dolman, A.J.; van der Molen, M.K. The full greenhouse gas balance of an abandoned peat meadow. Biogeosciences 2007, 4, 411–424. [Google Scholar] [CrossRef]
- Zeitz, J.; Velty, S. Soil properties of drained and rewetted fen soils. Journal of Plant Nutrition and Soil Science 2002, 165, 618–626. [Google Scholar] [CrossRef]
- Succow, M.; Joosten, H. Landschaftsökologische Moorkunde, 2nd ed.; Schweizerbart: Stuttgart, Germany, 2001. [Google Scholar]
- Szajdak, L.; Szatyłowicz, J. Impact of drainage on hydrophobicity of fen peat-moorsh soils. In Mires and peat; Kļaviņš, M., Ed.; University of Latvia Press: Riga, Latvia, 2010. [Google Scholar]
- Wassen, M.; Grootjans, A.P. Ecohydrology: An interdisciplinary approach for wetland management and restoration. Vegetatio 1996, 126, 1–4. [Google Scholar]
- Moore, T.R.; Bubier, J.L.; Bledzki, L. Litter decomposition in temperate peatland ecosystems: The effect of substrate and site. Ecosystems 2007, 10, 949–963. [Google Scholar] [CrossRef]
- Smiljanić, M.; Seo, J.-W.; Läänelaid, A.; van der Maaten-Theunissen, M.; Stajić, B.; Wilmking, M. Peatland pines as a proxy for water table fluctuations: Disentangling tree growth, hydrology and possible human influence. Sci. Total Environ. 2014, 500–501, 52–63. [Google Scholar] [CrossRef]
- Scharnweber, T.; Couwenberg, J.; Heinrich, I.; Wilmking, M. New insights for the interpretation of ancient bog oak chronologies? Reactions of oak (Quercus robur l.) to a sudden peatland rewetting. Palaeogeogr. Palaeoclimatol. Palaeoecol. 2015, 417, 534–543. [Google Scholar] [CrossRef]
- Murphy, M.T.; Moore, T.R. Linking root production to aboveground plant characteristics and water table in a temperate bog. Plant Soil 2010, 336, 219–231. [Google Scholar] [CrossRef]
- Zak, D.; Roth, C.; Unger, V.; Goldhammer, T.; Fenner, N.; Freeman, C.; Jurasinski, G. Unraveling the importance of polyphenols for microbial carbon mineralization in rewetted riparian peatlands. Front. Environ. Sci. 2019, 7, 1–14. [Google Scholar] [CrossRef]
- Freeman, C.; Ostle, N.; Kang, H. An enzymic ’latch’ on a global carbon store. Nature 2001, 409, 149. [Google Scholar] [CrossRef]
- Thauer, R.K.; Shima, S. Methane as fuel for anaerobic microorganisms. Ann. N.Y. Acad. Sci. 2008, 1125, 158–170. [Google Scholar] [CrossRef]
- Welte, C.U. Revival of archaeal methane microbiology. mSystems 2018, 3. [Google Scholar] [CrossRef]
- Whalen, S.C. Biogeochemistry of methane exchange between natural wetlands and the atmosphere. Environ. Eng. Sci. 2005, 22, 73–94. [Google Scholar] [CrossRef]
- Larmola, T.; Tuittila, E.-S.; Tiirola, M.; Nykänen, H.; Martikainen, P.J.; Yrjälä, K.; Tuomivirta, T.; Fritze, H. The role of Sphagnum mosses in the methane cycling of a boreal mire. Ecology 2010, 91, 2356–2365. [Google Scholar] [CrossRef]
- Andersen, R.; Chapman, S.J.; Artz, R.R.E. Microbial communities in natural and disturbed peatlands: A review. Soil Biol. Biochem. 2013, 57, 979–994. [Google Scholar] [CrossRef]
- Rezanezhad, F.; Price, J.S.; Quinton, W.L.; Lennartz, B.; Milojevic, T.; Van Cappellen, P. Structure of peat soils and implications for water storage, flow and solute transport: A review update for geochemists. Chem. Geol. 2016, 429, 75–84. [Google Scholar] [CrossRef]
- Robinson, D.A.; Jones, S.B.; Lebron, I.; Reinsch, S.; Domínguez, M.T.; Smith, A.R.; Jones, D.L.; Marshall, M.R.; Emmett, B.A. Experimental evidence for drought induced alternative stable states of soil moisture. Sci. Rep. 2016, 6, 20018. [Google Scholar] [CrossRef]
- Wallor, E.; Rosskopf, N.; Zeitz, J. Hydraulic properties of drained and cultivated fen soils part i—horizon-based evaluation of van genuchten parameters considering the state of moorsh-forming process. Geoderma 2018, 313, 69–81. [Google Scholar] [CrossRef]
- Baird, A.J. Field estimation of macropore functioning and surface hydraulic conductivity in a fen peat. Hydrol. Process. 1997, 11, 287–295. [Google Scholar] [CrossRef]
- Berger, S.; Gebauer, G.; Blodau, C.; Knorr, K.-H. Peatlands in a eutrophic world—Assessing the state of a poor fen-bog transition in southern Ontario, Canada, after long term nutrient input and altered hydrological conditions. Soil Biol. Biochem. 2017, 114, 131–144. [Google Scholar] [CrossRef]
- Menberu, M.W.; Marttila, H.; Tahvanainen, T.; Kotiaho, J.S.; Hokkanen, R.; Kløve, B.; Ronkanen, A.-K. Changes in pore water quality after peatland restoration: Assessment of a large-scale, replicated before-after-control-impact study in finland. Water Resour. Res. 2017, 53, 8327–8343. [Google Scholar] [CrossRef]
- Koerselman, W.; Van Kerkhoven, M.B.; Verhoeven, J.T. Release of inorganic N, P and K in peat soils; effect of temperature, water chemistry and water level. Biogeochemistry 1993, 20, 63–81. [Google Scholar] [CrossRef]
- Craft, C.B.; Richardson, C.J. Relationships between soil nutrients and plant species composition in Everglades peatlands. J. Environ. Qual. 1997, 26, 224–232. [Google Scholar] [CrossRef]
- Zak, D.; Goldhammer, T.; Cabezas, A.; Gelbrecht, J.; Gurke, R.; Wagner, C.; Reuter, H.; Augustin, J.; Klimkowska, A.; McInnes, R. Top soil removal reduces water pollution from phosphorus and dissolved organic matter and lowers methane emissions from rewetted peatlands. J. Appl. Ecol. 2018, 55, 311–320. [Google Scholar] [CrossRef]
- Jurasinski, G.; Günther, A.B.; Huth, V.; Couwenberg, J.; Glatzel, S. Ecosystem services provided by paludiculture—greenhouse gas emissions. In Paludiculture—Productive Use of Wet Peatlands; Wichtmann, W., Schröder, C., Joosten, H., Eds.; Schweizerbart Scientific Publishers: Stuttgart, Germany, 2016. [Google Scholar]
- Hahn, J.; Köhler, S.; Glatzel, S.; Jurasinski, G. Methane exchange in a coastal fen in the first year after flooding—A systems shift. PLoS ONE 2015, 10, e0140657. [Google Scholar] [CrossRef][Green Version]
- Hahn-Schöfl, M.; Zak, D.; Minke, M.; Gelbrecht, J.; Augustin, J.; Freibauer, A. Organic sediment formed during inundation of a degraded fen grassland emits large fluxes of CH4 and CO2. Biogeosciences 2011, 8, 1539–1550. [Google Scholar] [CrossRef]
- Franz, D.; Koebsch, F.; Larmanou, E.; Augustin, J.; Sachs, T. High net CO2 and CH4 release at a eutrophic shallow lake on a formerly drained fen. Biogeosciences 2016, 13, 3051–3070. [Google Scholar] [CrossRef]
- Tiemeyer, B.; Albiac Borraz, E.; Augustin, J.; Bechtold, M.; Beetz, S.; Beyer, C.; Drösler, M.; Ebli, M.; Eickenscheidt, T.; Fiedler, S.; et al. High emissions of greenhouse gases from grasslands on peat and other organic soils. Glob. Chang. Biol. 2016, 22, 4134–4149. [Google Scholar] [CrossRef]
- Augustin, J.; Münchmeyer, U.; Russow, R. Nitrous oxide and dinitrogen losses from flooded fen peat with and without reed canarygrass (Phalaris arundinacea l.) and common reed (Phragmites australis (cav.) trin. Ex steud.) plants. In Plant Nutrition: Food Security and Sustainability of Agro-Ecosystems Through Basic and Applied Research; Horst, W.J., Schenk, M.K., Bürkert, A., Claassen, N., Flessa, H., Frommer, W.B., Goldbach, H., Olfs, H.W., Römheld, V., Sattelmacher, B., Eds.; Springer: Berlin/Heidelberg, Germany, 2011. [Google Scholar]
- Lohila, A.; Aurela, M.; Hatakka, J.; Pihlatie, M.; Minkkinen, K.; Penttilä, T.; Laurila, T. Responses of N2O fluxes to temperature, water table and N deposition in a northern boreal fen. Eur. J. Soil Sci. 2010, 61, 651–661. [Google Scholar] [CrossRef]
- Wrage-Mönnig, N.; Horn, M.A.; Well, R.; Müller, C.; Velthof, G.; Oenema, O. The role of nitrifier denitrification in the production of nitrous oxide revisited. Soil Biol. Biochem. 2018, 123, A3–A16. [Google Scholar] [CrossRef]
- Chapuis-Lardy, L.; Wrage, N.; Metay, A.; Chotte, J.-L.; Bernoux, M. Soils, a sink for N2O? A review. Glob. Chang. Biol. 2007, 13, 1–17. [Google Scholar] [CrossRef]
- Rydin, H.; Jeglum, J.K. The Biology of Peatlands, 2nd ed.; Oxford University Press: Oxford, UK, 2013. [Google Scholar]
- Frolking, S.; Roulet, N.T.; Tuittila, E.; Bubier, J.L.; Quillet, A.; Talbot, J.; Richard, P.J.H. A new model of holocene peatland net primary production, decomposition, water balance, and peat accumulation. Earth Syst. Dynam. 2010, 1, 1–21. [Google Scholar] [CrossRef]
- Smith, J.; Gottschalk, P.; Bellarby, J.; Chapman, S.; Lilly, A.; Towers, W.; Bell, J.; Coleman, K.; Nayak, D.; Richards, M.; et al. Estimating changes in Scottish soil carbon stocks using Ecosse. I. Model description and uncertainties. Clim. Res. 2010, 45, 179–192. [Google Scholar] [CrossRef]
- Clymo, R.S.; Turunen, J.; Tolonen, K. Carbon accumulation in peatland. Oikos 1998, 81, 368–388. [Google Scholar] [CrossRef]
- Malak, D.A.; Hilarides, L. Available online: https://www.swos-service.eu/wp-content/uploads/2016/06/SWOS_Wetlands-delimitation-guidelines_FINAL_v1.1.pdf (accessed on 10 March 2020).
- Barthelmes, A. Vegetation dynamics and carbon sequestration in holocene alder (Alnus glutinosa) carrs in NE Germany. Ph.D. Thesis, Universität Greifswald, Greifswald, Germany, 2009. [Google Scholar]
- Ratzke, U. Der Moorstandortkatalog Mecklenburg-Vorpommern—eine Grundlage für das Moorschutzprogramm. TELMA Ber. Dtsch. Ges. Moor Torfkunde 2000, 30, 195–203. [Google Scholar]
- Kühnel, P. Die slawischen Ortsnamen in Meklenburg. Jahrbücher des Vereins für Mecklenburgische Geschichte und Altertumskunde 1881, 46, 3–168. [Google Scholar]
- Koch, M. Studying Vegetation and Vegetation Change in Low-Land Fens of North-Eastern Germany-Methods and Case Studies. Ph.D. Thesis, University of Rostock, Rostock, Germany, 2017. [Google Scholar]
- Bönsel, A. Revitalisierung von Regenmooren in Nordostdeutschland: Überblick und Perspektiven. Available online: https://e-docs.geo-leo.de/handle/11858/7288 (accessed on 6 January 2020).
- Von Post, L. Swedish geological peat survey with the results obtained so far (in Swedish). Sven. Mosskult. Tidskr. 1922, 36, 1–27. [Google Scholar]
- Krisch, H. Zur Kenntnis der Pflanzengesellschaften der Mecklenburgischen Boddenküste. Feddes Repert. 1974, 85, 115–158. [Google Scholar] [CrossRef]
- Jeschke, L. Vegetationsdynamik des Salzgraslandes im Bereich der Ostseeküste der DDR unter dem Einfluß des Menschen. Hercynia NF 1987, 24, 321–328. [Google Scholar]
- Härdtle, W. Vegetationskundliche Untersuchungen in Salzwiesen der Ostholsteinischen Ostseeküste; Arbeitsgemeinschaft Geobotanik: Kiel, Germany, 1984. [Google Scholar]
- Dijkema, K.S. Salt and brackish marshes around the baltic sea and adjacent parts of the North Sea: Their vegetation and management. Biol. Conserv. 1990, 51, 191–209. [Google Scholar] [CrossRef]
- Joosten, H.; Klerk, P.D. DAMOCLES: A dashing monolith cutter for fine sectioning of peats and sediments into large slices. Boreas 2007, 36, 76–81. [Google Scholar] [CrossRef]
- Barthelmes, A.; de Klerk, P.; Prager, A.; Theuerkauf, M.; Unterseher, M.; Joosten, H. Expanding NPP analysis to eutrophic and forested sites: Significance of NPPs in a holocene wood peat section (NE Germany). Rev. Palaeobot. Palynol. 2012, 186, 22–37. [Google Scholar] [CrossRef]
- Barthelmes, A.; Prager, A.; Joosten, H. Palaeoecological analysis of Alnus wood peats with special attention to non-pollen palynomorphs. Rev. Palaeobot. Palynol. 2006, 141, 33–51. [Google Scholar] [CrossRef]
- Prager, A.; Barthelmes, A.; Theuerkauf, M.; Joosten, H. Non-pollen palynomorphs from modern alder carrs and their potential for interpreting microfossil data from peat. Rev. Palaeobot. Palynol. 2006, 141, 7–31. [Google Scholar] [CrossRef]
- Prager, A.; Theuerkauf, M.; Couwenberg, J.; Barthelmes, A.; Aptroot, A.; Joosten, H. Pollen and non-pollen palynomorphs as tools for identifying alder carr deposits: A surface sample study from NE-Germany. Rev. Palaeobot. Palynol. 2012, 186, 38–57. [Google Scholar] [CrossRef]
- Johnson, M.G.; Tingey, D.T.; Phillips, D.L.; Storm, M.J. Advancing fine root research with minirhizotrons. Environ. Exp. Bot. 2001, 45, 263–289. [Google Scholar] [CrossRef]
- Keuskamp, J.A.; Dingemans, B.J.J.; Lehtinen, T.; Sarneel, J.M.; Hefting, M.M. Tea bag index: A novel approach to collect uniform decomposition data across ecosystems. Methods Ecol. Evol. 2013, 4, 1070–1075. [Google Scholar] [CrossRef]
- Pettorelli, N.; Vik, J.O.; Mysterud, A.; Gaillard, J.-M.; Tucker, C.J.; Stenseth, N.C. Using the satellite-derived NDVI to assess ecological responses to environmental change. Trends Ecol. Evol. 2005, 20, 503–510. [Google Scholar] [CrossRef]
- Gauci, V.; Gowing, D.J.G.; Hornibrook, E.R.C.; Davis, J.M.; Dise, N.B. Woody stem methane emission in mature wetland alder trees. Atmos. Environ. 2010, 44, 2157–2160. [Google Scholar] [CrossRef]
- Poulsen, M.; Schwab, C.; Borg Jensen, B.; Engberg, R.M.; Spang, A.; Canibe, N.; Højberg, O.; Milinovich, G.; Fragner, L.; Schleper, C.; et al. Methylotrophic methanogenic thermoplasmata implicated in reduced methane emissions from bovine rumen. Nat. Commun. 2013, 4, 1428. [Google Scholar] [CrossRef]
- Söllinger, A.; Schwab, C.; Weinmaier, T.; Loy, A.; Tveit, A.T.; Schleper, C.; Urich, T. Phylogenetic and genomic analysis of Methanomassiliicoccales in wetlands and animal intestinal tracts reveals clade-specific habitat preferences. FEMS Microbiol. Ecol. 2015, 92, 1–12. [Google Scholar]
- Tveit, A.T.; Urich, T.; Frenzel, P.; Svenning, M.M. Metabolic and trophic interactions modulate methane production by arctic peat microbiota in response to warming. Proc. Natl. Acad. Sci. USA 2015, 112, E2507–E2516. [Google Scholar] [CrossRef]
- Urich, T.; Lanzén, A.; Qi, J.; Huson, D.H.; Schleper, C.; Schuster, S.C. Simultaneous assessment of soil microbial community structure and function through analysis of the meta-transcriptome. PLoS ONE 2008, 3, e2527. [Google Scholar] [CrossRef]
- Livingston, G.P.; Hutchinson, G.L. Enclosure-based measurement of trace gas exchange: Applications and sources of error. In Biogenic Trace Gases: Measuring Emissions from Soil and Water; Matson, P.A., Harriss, R.C., Eds.; Blackwell Science Ltd: Oxford, UK, 1995. [Google Scholar]
- Kool, D.M.; Van Groenigen, J.W.; Wrage, N. Source determination of nitrous oxide based on nitrogen and oxygen isotope tracing: Dealing with oxygen exchange. Methods Enzymol. 2011, 496, 139–160. [Google Scholar]
- Wrage, N.; van Groenigen, J.W.; Oenema, O.; Baggs, E.M. A novel dual-isotope labelling method for distinguishing between soil sources of N2O. Rapid Commun. Mass Spectrom. 2005, 19, 3298–3306. [Google Scholar] [CrossRef]
- Welti, N.; Siljanen, H.; Biasi, C.; Martikainen, P.J. Quantification of Nitrous Oxide (N2O) Uptake in Boreal Forest Soils by Combining Isotopic and Microbial Approaches; EGU General Assembly: Vienna, Austria, 2015. [Google Scholar]
- Koch, M.; Jurasinski, G.; Bäthge, J.; Glatzel, S. Raumzeitliche Analyse der Entwicklung von Wäldern und Forsten in Mecklenburg. In Virtuelle Forschungsumgebung für die Kulturlandschaftsforschung auf Basis von Internet-GIS-Technologie; Bill, R., Ed.; Wichmann: Offenbach am Main, Germany, 2012. [Google Scholar]
- VKLandLab. Vklandlab-Demo. Available online: http://kvwmap.geoinformatik.uni-rostock.de/VKLandLab/index.php?gast=45 (accessed on 17 January 2020).
- SVEA-Pommern. Karten und Texte der Schwedischen Landesaufnahme von Pommern 1692–1709. Eine GIS-Gestützte Auswahledition des Ersten Deutschen Katasters im Internet. Available online: http://www.svea-pommern.de (accessed on 17 January 2020).
- Müller-Westermeier, G. Numerische Verfahren Zur Erstellung klimatologischer Karten; Selbstverlag des Deutschen Wetterdienstes: Offenbach am Main, Germany, 1995. [Google Scholar]
- Oksanen, J.; Blanchet, F.G.; Friendly, M.; Kindt, R.; Legendre, P.; McGlinn, D.; Minchin, P.R.; O’Hara, R.B.; Simpson, G.L.; Solymos, P.; et al. Vegan: Community Ecology Package. R Package Version 2.5–6. Available online: https://CRAN.R-project.org/package=vegan (accessed on 17 January 2020).
- R Core Team. R: A Language and Environment for Statistical Computing. Available online: https://www.R-project.org/ (accessed on 17 January 2020).
- Faith, D.P.; Minchin, P.R.; Belbin, L. Compositional dissimilarity as a robust measure of ecological distance. Vegetatio 1987, 69, 57–68. [Google Scholar] [CrossRef]
- Bray, J.R.; Curtis, J.T. An ordination of the upland forest communities of southern Wisconsin. Ecol. Monogr. 1957, 27, 325–349. [Google Scholar] [CrossRef]
- Schwertmann, U. Differenzierung der Eisenoxide des Bodens durch Extraktion mit Ammoniumoxalat-Lösung. Zeitschrift für Pflanzenernährung, Düngung, Bodenkunde 1964, 105, 194–202. [Google Scholar] [CrossRef]
- Negassa, W.; Acksel, A.; Eckhardt, K.-U.; Regier, T.; Leinweber, P. Soil organic matter characteristics in drained and rewetted peatlands of northern Germany: Chemical and spectroscopic analyses. Geoderma 2019, 353, 468–481. [Google Scholar] [CrossRef]
- Weil, M.; Wang, H.; Bengtsson, M.; Günther, A.; Jurasinski, G.; Couwenberg, J.; Negassa, W.; Zak, D.; Urich, T. Rewetting of three drained peatlands drives congruent compositional changes in pro-and eukaryotic microbiomes through environmental filtering. BioRxiv 2019, 848192, 1–23. [Google Scholar]
- Steinberg, L.M.; Regan, J.M. Mcra-targeted real-time quantitative pcr method to examine methanogen communities. Appl. Environ. Microbiol. 2009, 75, 4435–4442. [Google Scholar] [CrossRef]
- Schindler, U.; Behrendt, A.; Müller, L. Change of soil hydrological properties of fens as a result of soil development. J. Plant Nutr. Soil Sci. 2003, 166, 357–363. [Google Scholar] [CrossRef]
- Liu, H.; Lennartz, B. Hydraulic properties of peat soils along a bulk density gradient—A meta study. Hydrol. Process. 2019, 33, 101–114. [Google Scholar] [CrossRef]
- Liu, H.; Zak, D.; Rezanezhad, F.; Lennartz, B. Soil degradation determines release of nitrous oxide and dissolved organic carbon from peatlands. Environ. Res. Lett. 2019, 14, 094009. [Google Scholar] [CrossRef]
- Rahmstorf, S.; Coumou, D. Increase of extreme events in a warming world. Proc. Natl. Acad. Sci. USA 2011, 108, 17905–17909. [Google Scholar] [CrossRef]
- Stott, P. How climate change affects extreme weather events. Science 2016, 352, 1517–1518. [Google Scholar] [CrossRef]
- Sippel, S.; Meinshausen, N.; Fischer, E.M.; Székely, E.; Knutti, R. Climate change now detectable from any single day of weather at global scale. Nat. Clim. Chang. 2020, 10, 35–41. [Google Scholar] [CrossRef]
- Maxwell, S.L.; Butt, N.; Maron, M.; McAlpine, C.A.; Chapman, S.; Ullmann, A.; Segan, D.B.; Watson, J.E.M. Conservation implications of ecological responses to extreme weather and climate events. Divers. Distrib. 2019, 25, 613–625. [Google Scholar] [CrossRef]
- De Boeck, H.J.; Vicca, S.; Roy, J.; Nijs, I.; Milcu, A.; Kreyling, J.; Jentsch, A.; Chabbi, A.; Campioli, M.; Callaghan, T.; et al. Global change experiments: Challenges and opportunities. BioScience 2015, 65, 922–931. [Google Scholar] [CrossRef]
- Kechavarzi, C.; Dawson, Q.; Leeds-Harrison, P.B. Physical properties of low-lying agricultural peat soils in England. Geoderma 2010, 154, 196–202. [Google Scholar] [CrossRef]
- Liu, H.; Janssen, M.; Lennartz, B. Changes in flow and transport patterns in fen peat following soil degradation. Eur. J. Soil Sci. 2016, 67, 763–772. [Google Scholar] [CrossRef]
- Liu, H.; Forsmann, D.M.; Kjærgaard, C.; Saki, H.; Lennartz, B. Solute transport properties of fen peat differing in organic matter content. J. Environ. Qual. 2017, 46, 1106–1113. [Google Scholar] [CrossRef] [PubMed]
© 2020 by the authors. Licensee MDPI, Basel, Switzerland. This article is an open access article distributed under the terms and conditions of the Creative Commons Attribution (CC BY) license (http://creativecommons.org/licenses/by/4.0/).