Article

Mass Balances of a Drained and a Rewetted Peatland: on Former Losses and Recent Gains

1
Peatland Studies and Palaeoecology, Institute of Botany and Landscape Ecology, University of Greifswald, partner in the Greifswald Mire Centre, Soldmannstr. 15, 17487 Greifswald, Germany
2
Landscape Ecology and Site Evaluation, Faculty of Agricultural and Environmental Sciences, University of Rostock, J.-v.-Liebig-Weg 6, 18051 Rostock, Germany
3
Grassland and Fodder Sciences, Faculty of Agricultural and Environmental Sciences, University of Rostock, J.-v.-Liebig-Weg 6, 18051 Rostock, Germany
*
Author to whom correspondence should be addressed.
Soil Syst. 2020, 4(1), 16; https://doi.org/10.3390/soilsystems4010016
Submission received: 16 January 2020 / Revised: 2 March 2020 / Accepted: 10 March 2020 / Published: 16 March 2020

Abstract

:
Drained peatlands are important sources of greenhouse gases and are rewetted to curb these emissions. We study one drained and one rewetted fen in terms of losses—and, after rewetting—gains of organic matter (OM), carbon (C), and peat thickness. We determined bulk density (BD) and ash/OM (and C/OM) ratios for 0.5 cm thick contiguous slices from peat monoliths to calculate losses. Whereas one site has lost 28.5 kg OM m−2 corresponding to annual emissions of ~10 t CO2 ha−1 a−1 over 50 years of effective drainage, the other site has lost 102 kg OM m−2, corresponding to an annual loss of ~30 t CO2 ha−1 a−1 for 30 years of intensive drainage and 6 t CO2 ha−1 a−1 during ~225 years of weak drainage before that. Height losses ranged from 43 to 162 cm. In the 20 years after rewetting, 2.12 kg C m−2 was accumulated, equaling an average annual uptake of ~0.4 kg CO2 m−2 a−1. The results indicate that rewetting can lead to carbon accumulation in fens. This sink function is only small compared with the high emissions that are avoided through rewetting.

1. Introduction

Peatlands cover ~3% of the Earth’s land surface, but store about double the amount of carbon in all forests (~30% of the land area, [1]). An estimated 15% of these peatlands are drained for land use and release stored carbon to the atmosphere, causing global emissions of approximately 2 × 10⁹ t CO2 each year [1,2]. Rewetting is a cost-effective measure to reduce these emissions and is seen among the most effective solutions in combating the current climate crisis [3]. Much of the research on rewetted peatlands has focussed on Sphagnum-dominated, acid-oligotrophic, rainwater-fed bogs, and insights from rewetted minerotrophic fen sites are less ubiquitous [4,5].
Here, we focus on percolation fens in river valleys, a peatland type widespread in North-Eastern Germany, Northern Poland, Belarus, and Ukraine [6,7]. Their wide distribution and suitability resulted in most of these peatlands being drained for agriculture. In North-Eastern Germany, first low-intensity drainage activities started during the 18th century. High-intensity, deep drainage was carried out in the majority of the mires in North-Eastern Germany during the so-called ‘complex meliorations’ of the 1960s and 1970s. For more than 20 years, peatlands have been rewetted in the North-Eastern German federal state of Mecklenburg-Western Pomerania in the framework of a large-scale programme, not only for nature conservation purposes and the protection of biodiversity at the species and landscape level, but also to reduce greenhouse gas emissions [8].
One of our study sites has been rewetted more than 20 years ago, the other one has remained drained. We studied the uppermost peat layers of 42 and 55 cm of both sites in high resolution with respect to peat composition and matter content to answer the questions: (i) How much peat has been lost through drainage? and (ii) how much new material has accumulated after rewetting?

2. Materials and Methods

2.1. Sites

We studied two sites in a percolation fen complex in the connected valleys of the Rivers Recknitz and Trebel in North-Eastern Germany [9]. The drained site PD is dominated by grassland vegetation with Holcus lanatus L. (~80% cover), Ranunculus repens L. (~60% cover), Poa trivialis L. (~30% cover), and Deschampsia cespitosa (L.) P.Beauv. (~15% cover). The site is used for fodder production, and mown once per year. The formerly drained and now rewetted site PW is dominated by Carex acutiformis Ehrh. (~1 m height, 80% cover), Phalaris arundinacea L. (~40% cover), and scattered individuals of Carex rostrata Stokes, Epilobium hirsutum L., Equisetum fluviatile L. emend. Ehrh. and Lythrum salicaria L. The site is protected for nature conservation and not managed. Slight human-induced changes in the hydrology of the whole mire system date back to at least 1744, but significant peat losses probably only occurred since 1967, when deep drainage ditches (~1.5 m) allowed for high-intensity grassland use [10,11]. Site PW was rewetted in 1997 and the water table has been close to the ground surface since then [12].

2.2. Cores and Analyses

We dug out one monolith per site in July (PW) and August of 2017 (PD) and stored it at −17 °C. The uppermost 42 cm (PD) and 55 cm (PW) of the monoliths were cut into contiguous 0.5 cm slices at −4 °C using a paper cutter (‘DAMOCLES’; cf. [13]). The slices were volumetrically subsampled for analyses of bulk density, organic matter and carbon content and analyses of macro- and micro-remains in selected depths. Subsamples of 3 cm3 were weighted for bulk density and ignited by 550 °C to measure the loss of organic matter (OM). Carbon content and C/N ratios of dried and milled samples were determined for the PW core only, using a Carbon/Nitrogen/Phosphorous-Analyser (PyroCube of Elementar, Langenselbold, Germany).
Samples for analysis of macro-remains (3 cm3) were slurried with purified water and examined under an incident light microscope (Carl Zeiss Jena Technival 2) with 10–40 × magnification. For tissue and moss remains, volume percentages were estimated with reference to the total volume. Seeds, fruits, and intact mollusc shells were counted. The following literature was used in identification: for tissue and moss remains: [14,15,16,17,18], for fruits and seeds: [15,19,20].
At each site, we collected above ground remains for AMS 14C dating, yielding 0.3 mg C at PD and 0.7 mg C at PW (Table 1). The radiocarbon dates were calibrated to calendar years using the software CALIB v. 7.0.4. To arrive at a single point date estimate, we calculated the weighted average of the probability distribution function [21].
Preparation of the samples for analysis of micro-remains (2 cm3) included treatment with 25% HCl, 10% KOH, sieving (120 µm) and acetolysis (7 min); samples rich in silicates were additionally treated with HF (cf. [22]). Samples were mounted in silicone oil and counted with 400× magnification using a Zeiss Axioskop 40. The micro-remain counts are presented in concentrations of particles per volume. The following literature was used in identification: for pollen: [23], for non-pollen palynomorphs (NPP): [24,25,26,27]. In order to differentiate clearly between plant taxa and pollen types, the latter are displayed in small capitals [28].

2.3. Calculation of Losses and Gains

For the calculation of losses due to drainage we considered two mechanisms: the loss of organic matter (OM) by decomposition and the loss of height (thickness) through compaction due to loss of water, matter and structure incl. pore volume.
First, we recalculated the original OM content. For this purpose, we assumed that the amount of ash is constant in the same type of peat at a site over time and that the absolute amount of ash in the peat is not changing during drainage. If OM is lost, the original OM amount can thus be recalculated by using the OM/ash ratio of an untouched peat as follows:
O M o = O M r e f a s h r e f × a s h m
where OMo is the original OM content, OMref/ashref is the ratio of the OM per ash values of the untouched reference peat, and ashm is the measured ash content of the drained peat.
The loss of OM is the difference between the calculated original OMo and the measured OMm value. We assumed that the lowermost samples in our two cores were (largely) unaffected by drainage and had retained their original ash content. We derived OMo for samples closer to the ground surface and calculated loss for each of the 0.5 cm samples. Sample values were then added up to total OM loss.
The same method was applied to calculate original carbon (C) content and loss from PW. Whereas C contents for PW were measured and the total C loss was calculated separately from OM loss, C loss for PD was estimated with the common assumption that C makes up 50% of OM. To derive CO2 emissions, we converted C values into CO2 by multiplying with 44/12 (molar mass ratio). Yearly losses were calculated by dividing the total loss by the emission time.
To calculate the loss of height (thickness), we used two methods, which allowed for cross-checking of the results. Method 1 is again based on measured matter contents. Here, we assume that the bulk density of a certain peat type at a site is constant over time. This assumption seems particularly valid for percolation fens [6,29]. If the upper peat is compacted after drainage through the loss of water, matter, and structure, the original peat thickness per sample can be calculated by using the bulk density of an untouched peat as follows:
I o = O M o + a s h m B D r e f
where lo is the original thickness and BDref is the bulk density of the reference peat. With our contiguous sampling, the sum of the calculated original thicknesses of all samples provides the original thickness of the whole section of peat. Thickness loss is then the difference between the calculated and the measured thickness of the peat.
Our Method 1 calculations are closely related to those presented by Ewing & Vepraskas [30]. Whereas we first explicitly calculate original OM using Equation (1), and use this original OM to calculate height loss using Equation (2), Ewing & Vepraskas [30] use the ash-to-BD ratio of the oxidized and compacted peat layer vs. that of the lower peat layer to calculate height loss directly.
Method 2 is based on peat age and accumulation rate. We calculate the former peat thickness by multiplying the age of a dated depth by the mean accumulation rate of percolation mires of 0.56 mm/a [29]. Thickness loss is then the difference between the calculated and the recent thickness of the peat above the dated depth.
The C storage after rewetting was calculated by adding up the measured C contents of the newly deposited layer.

3. Results

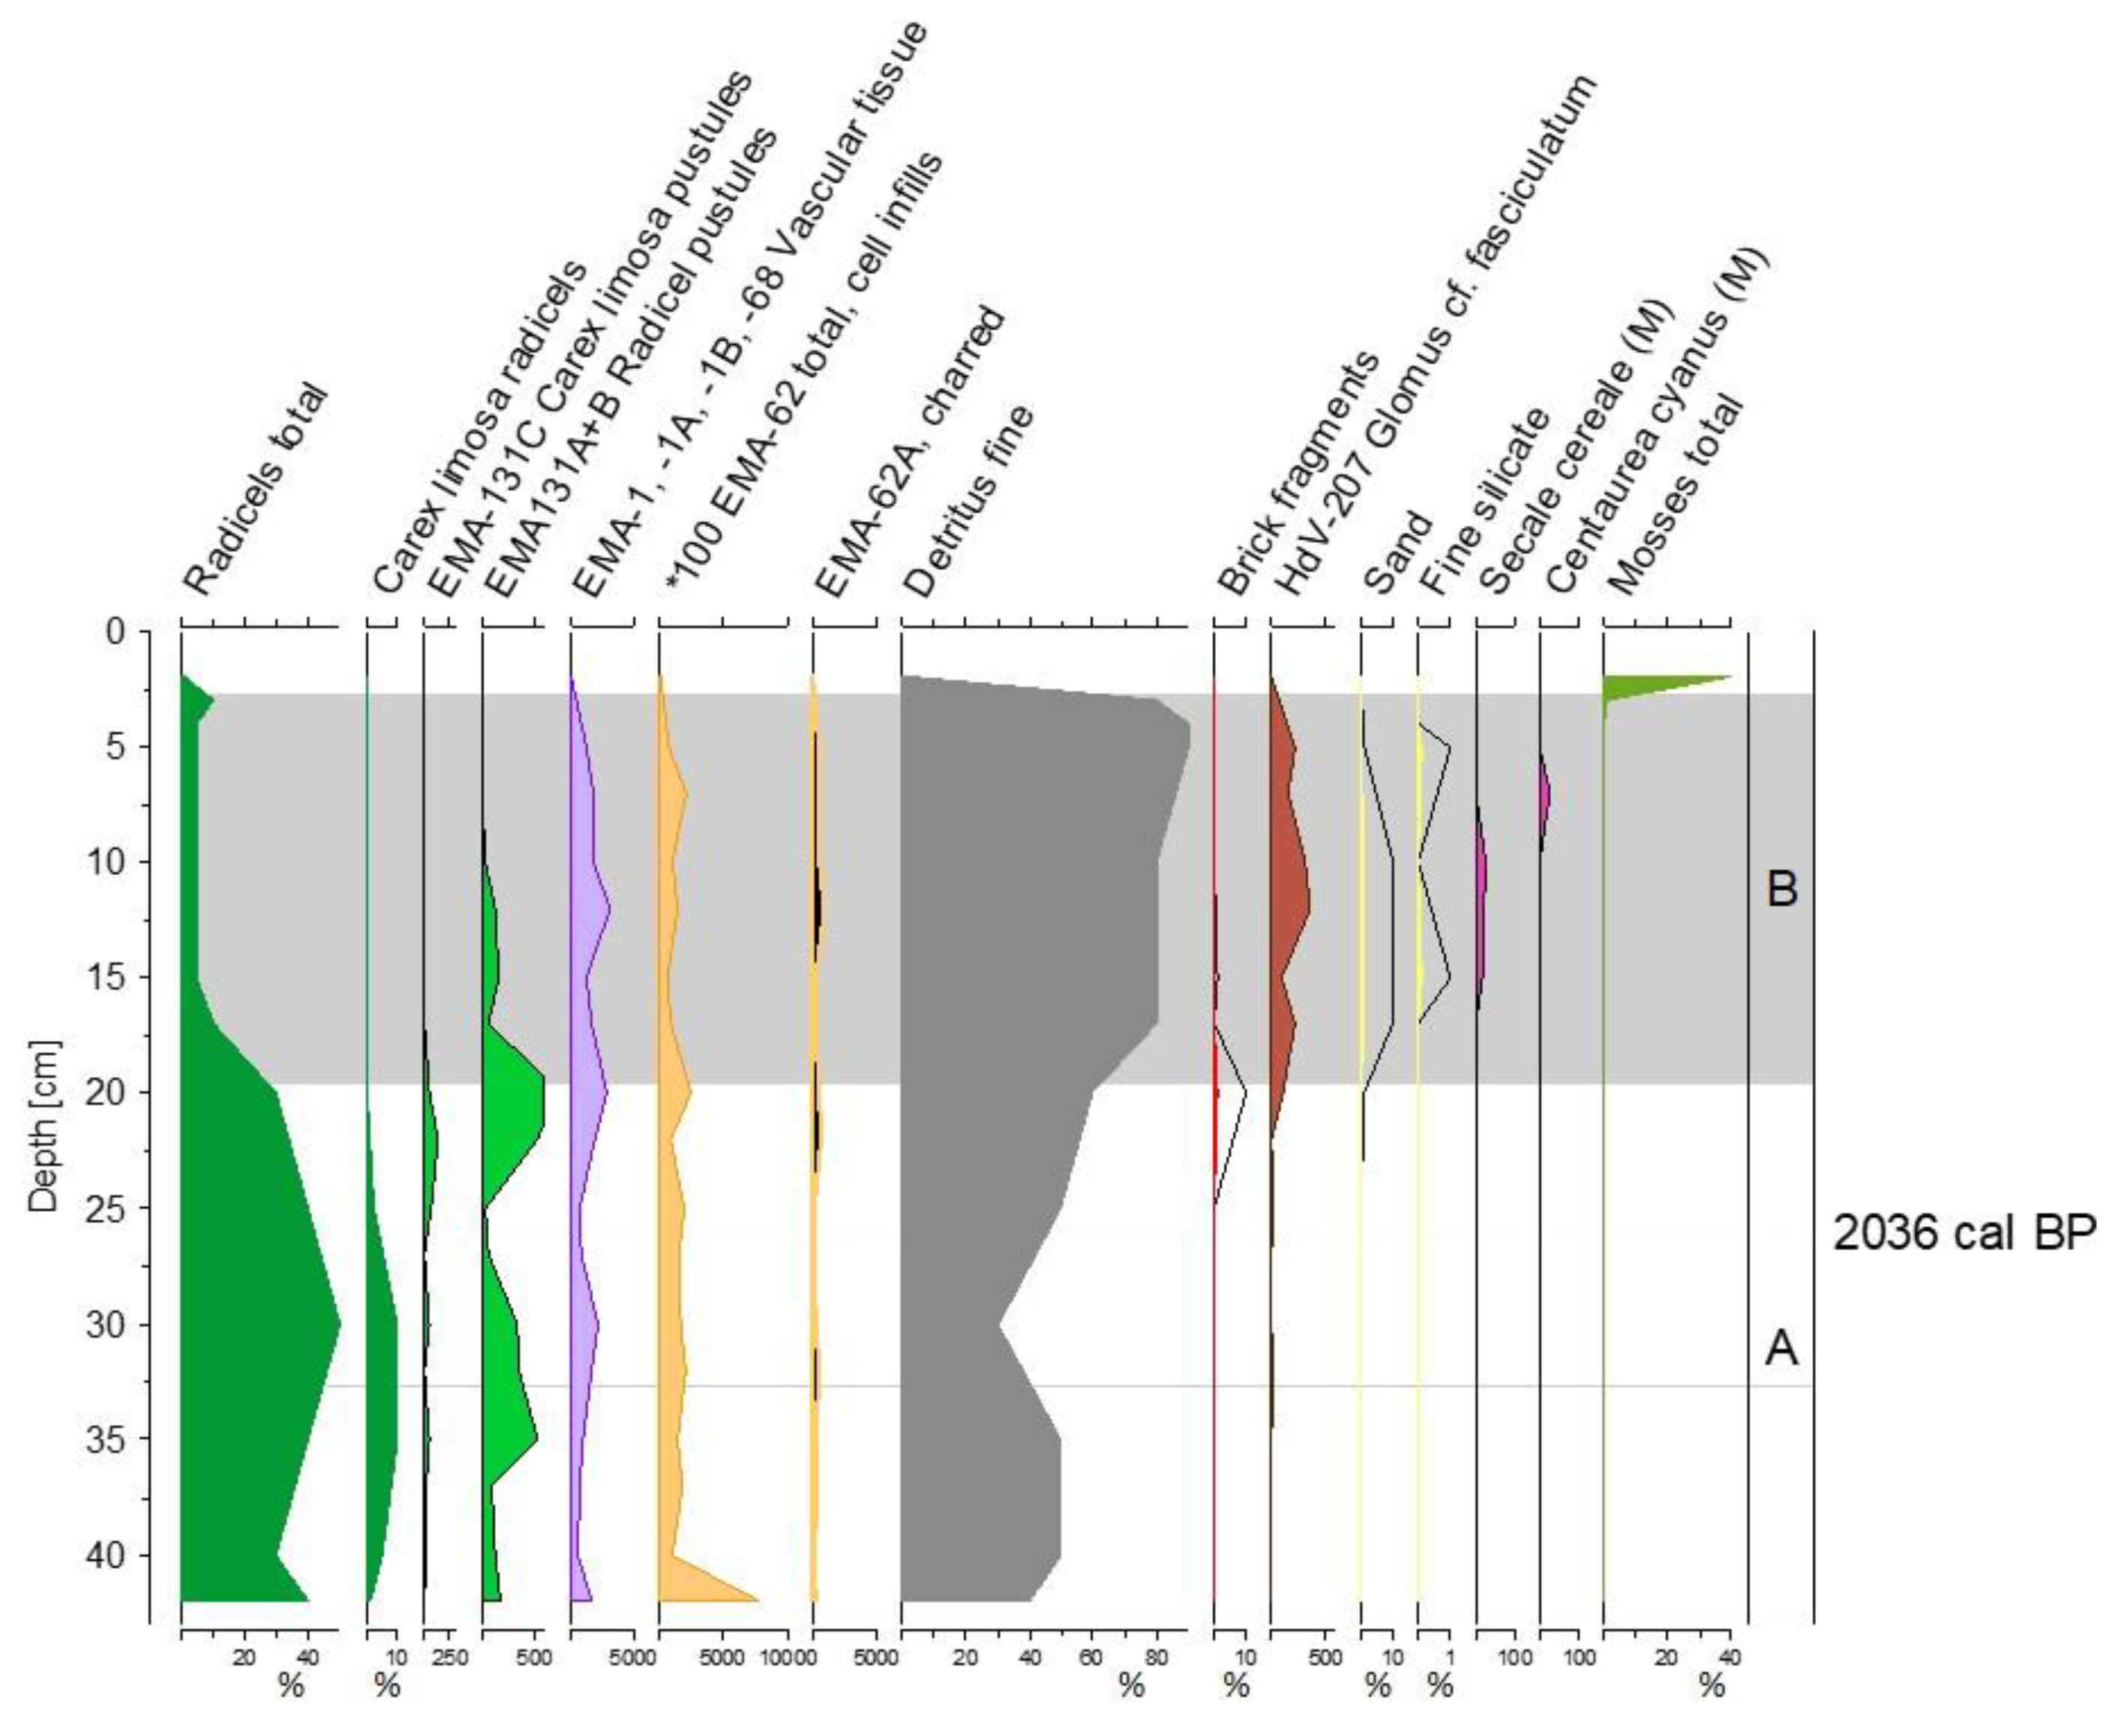
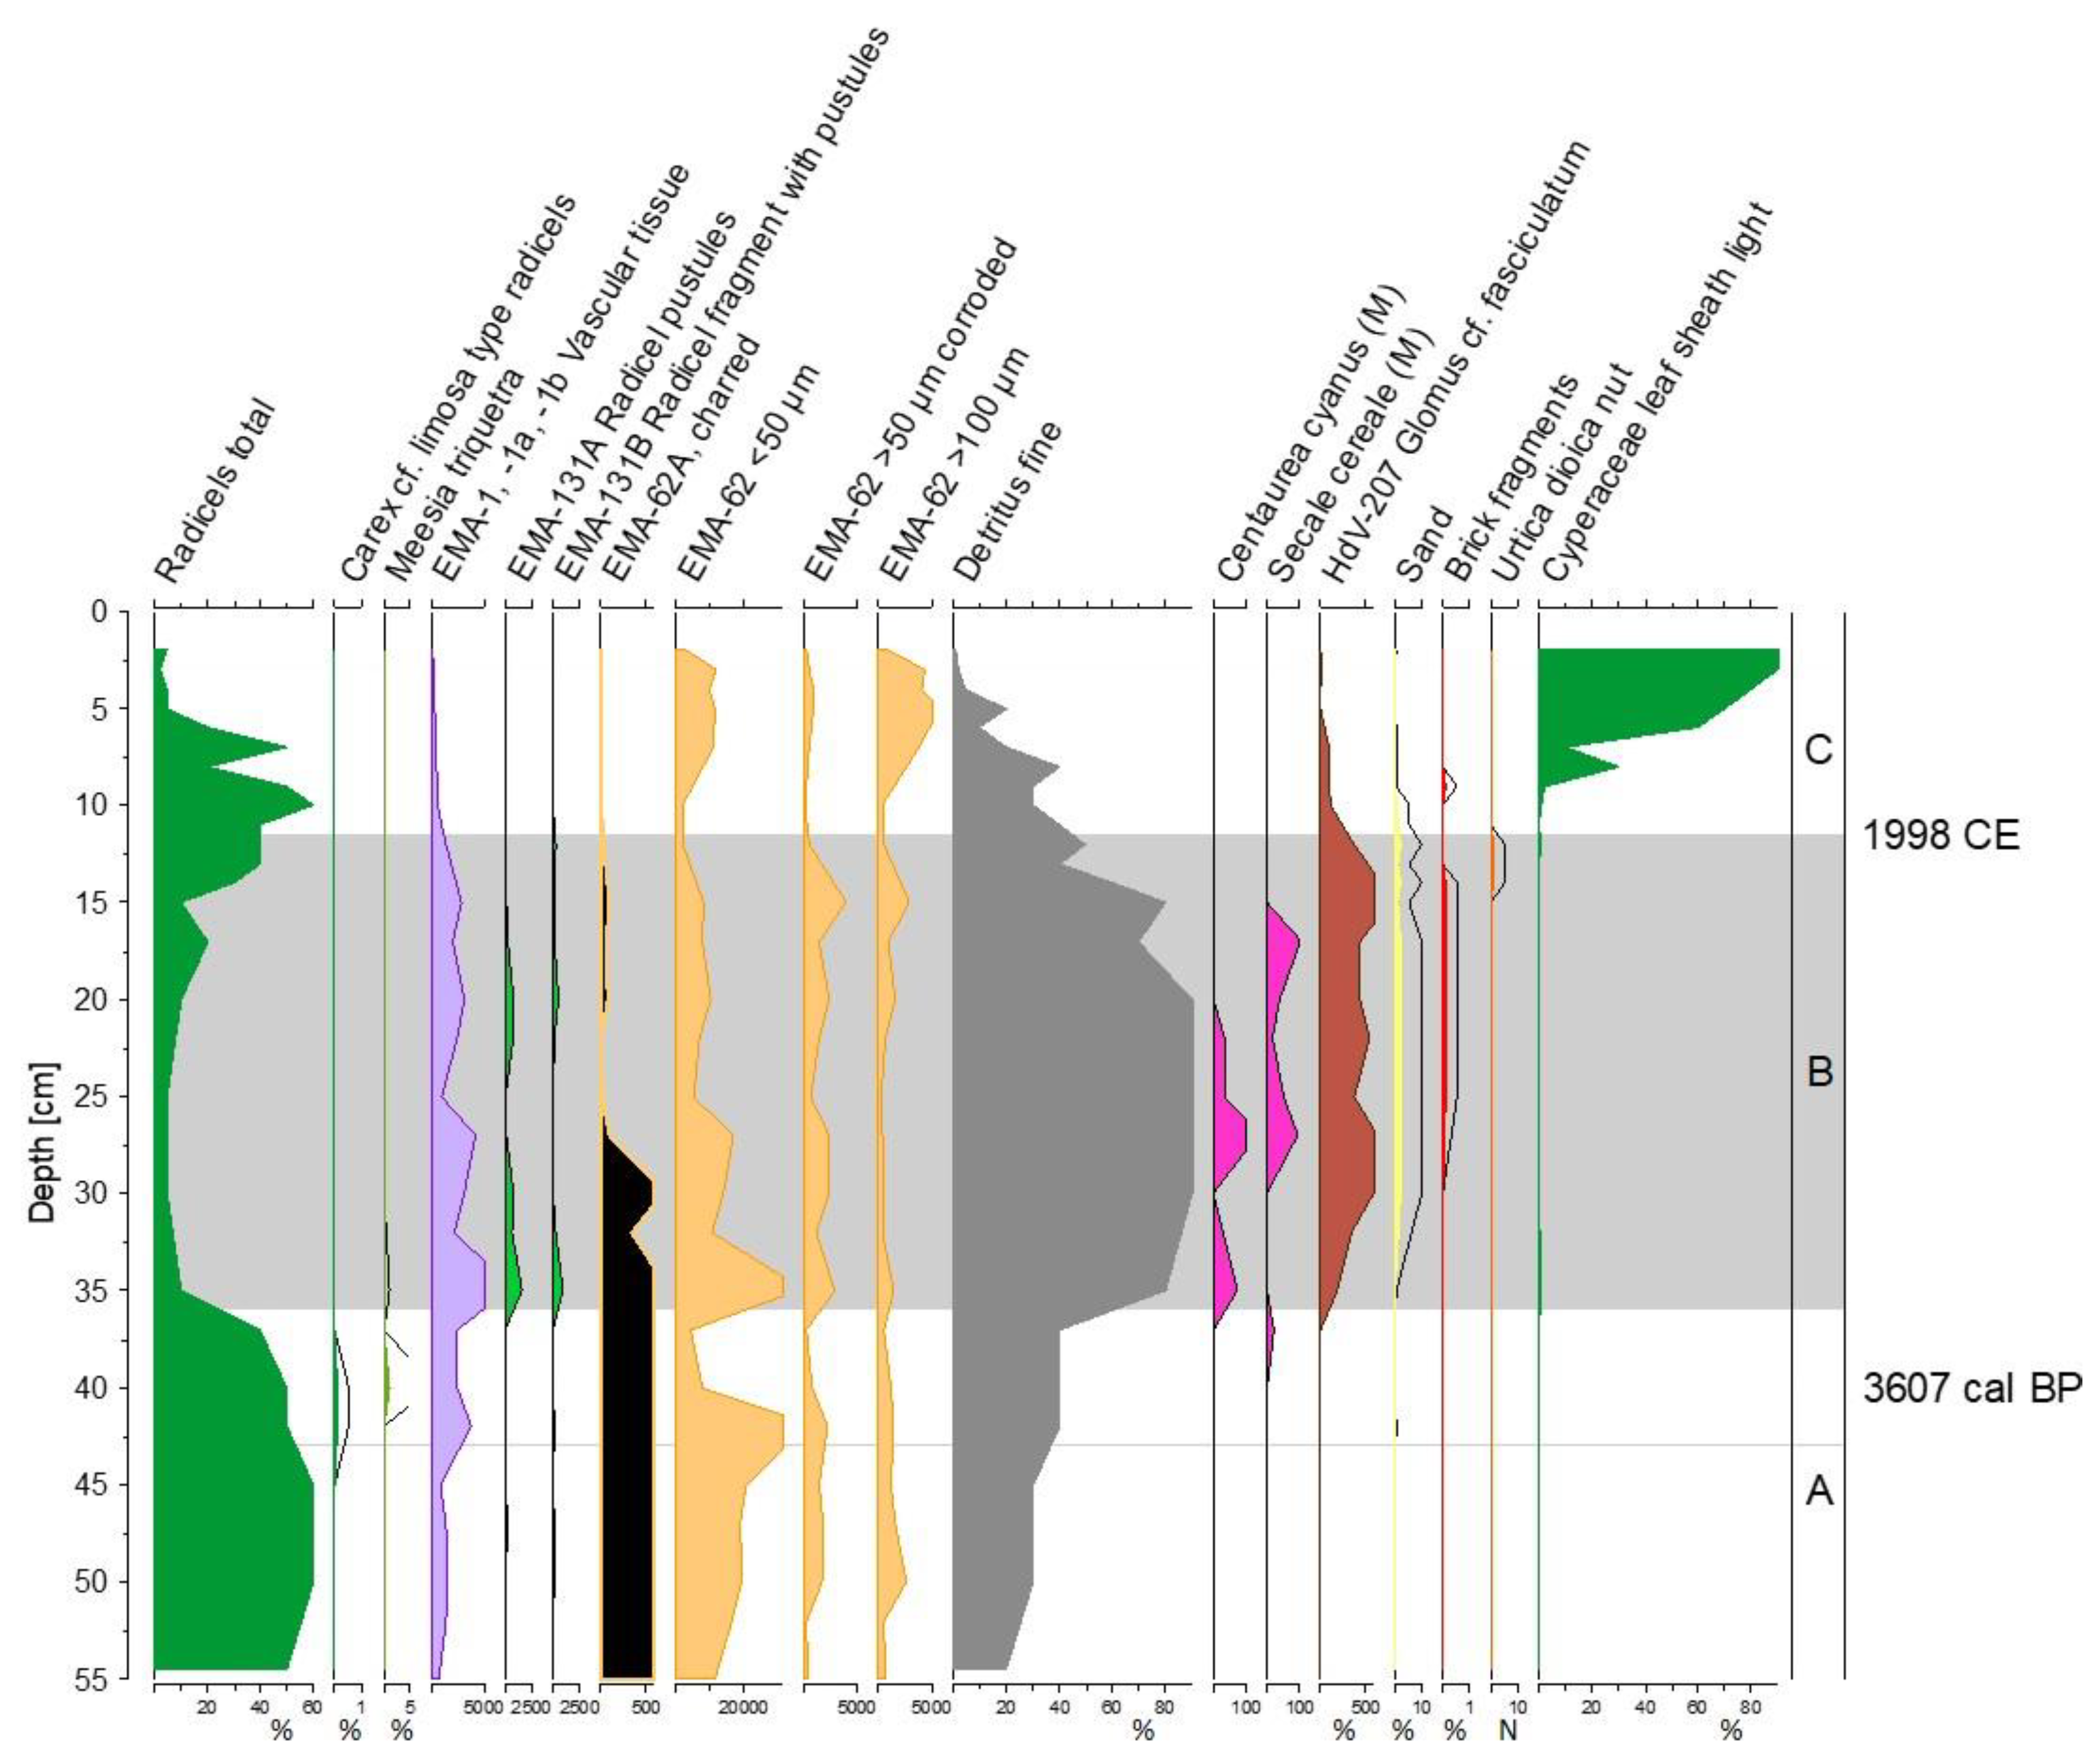
3.1. Peat Profiles and Layering

The PD monolith of 42 cm included 1.5 cm aboveground litter and a 16.5 cm thick layer (2.5–19.5 cm) of compacted and highly decomposed, amorphous peat material (layer B, Figure 1). Below this layer lay well-preserved original peat (A).
The PW monolith of 55 cm included 3 cm aboveground litter, and about 8 cm of newly deposited material consisting mainly of roots, radicels and litter (layer C, Figure 2). This layer was underlain by a 24.5 cm thick layer (11–36 cm) of compacted and highly decomposed amorphous peat material (layer B). Below this layer lay the well preserved original peat (layer A). Recent roots and radicels were found throughout the PW profile and down to a depth of 20 cm in the PD profile. The year of rewetting, 1997, was localized in the PW profile just below 11 cm by the presence of Urtica dioica fruits just below, and its absence above 11 cm (Figure 2). After abandonment just before rewetting, U. dioica dominated the site and its fruits fell onto the soil and litter, but also into the crevices that commonly characterize drained peat soils [31].
The different peat layers showed clear differences in micro- and macro-remains (Figure 1 and Figure 2, see further description in Michaelis et al. [26]). Both A layers were dominated by Carex lasiocarpa/rostrata type radicels. Peat formed at a long-term stable water level close to the surface as indicated by the occurrence of Carex limosa type radicels in PD and remains of Meesia triquetra and Carex limosa type radicels in PW. Both B layers mainly consisted of fine detritus. Microscopic remains of radicels, like pustules (EMA-131A, -B), vascular tissue (EMA-1, -1A, -1B, -68), and epidermal remains of Cyperaceae (EMA-62, -62A charred), showed that the material originated from a peat just like in the A layer below.
The pollen record of the B layers has been disturbed. For example, Secale cereale and Centaurea cyanus pollen were found in the lower part of the B layers. Yet, these pollen types would normally only be found in the uppermost part of pollen profiles in the study region, as they are frequent only since Slavonic times (7th/8th century CE) and show high values only since the 17th/18th century. The most likely explanation is that both sites were ploughed. The presence of brick fragments and other mineral material throughout the zones support this interpretation. Clamydospores of Glomus cf. fasciculatum (HdV-207), a fungus living in aerated soils, furthermore characterize the B layers as a (former) cultivated grassland soil. The B layers in both sites are very similar concerning the micro-remain assemblages, certainly a consequence of their strong degradation.
The lower part of the C layer in PW was dominated by sedge radicels that, when they could be further specified, mostly belonged to Carex rostrata type radicels as well as some to the Carex acutiformis type. The upper part contained high amounts of leaf sheaths of Cyperaceae. In general, it is difficult to distinguish fresh and old material in the analyses of macro-remains, but parts of the material could be identified with certainty as fresh: recent radicels were growing also in the deeper layers.

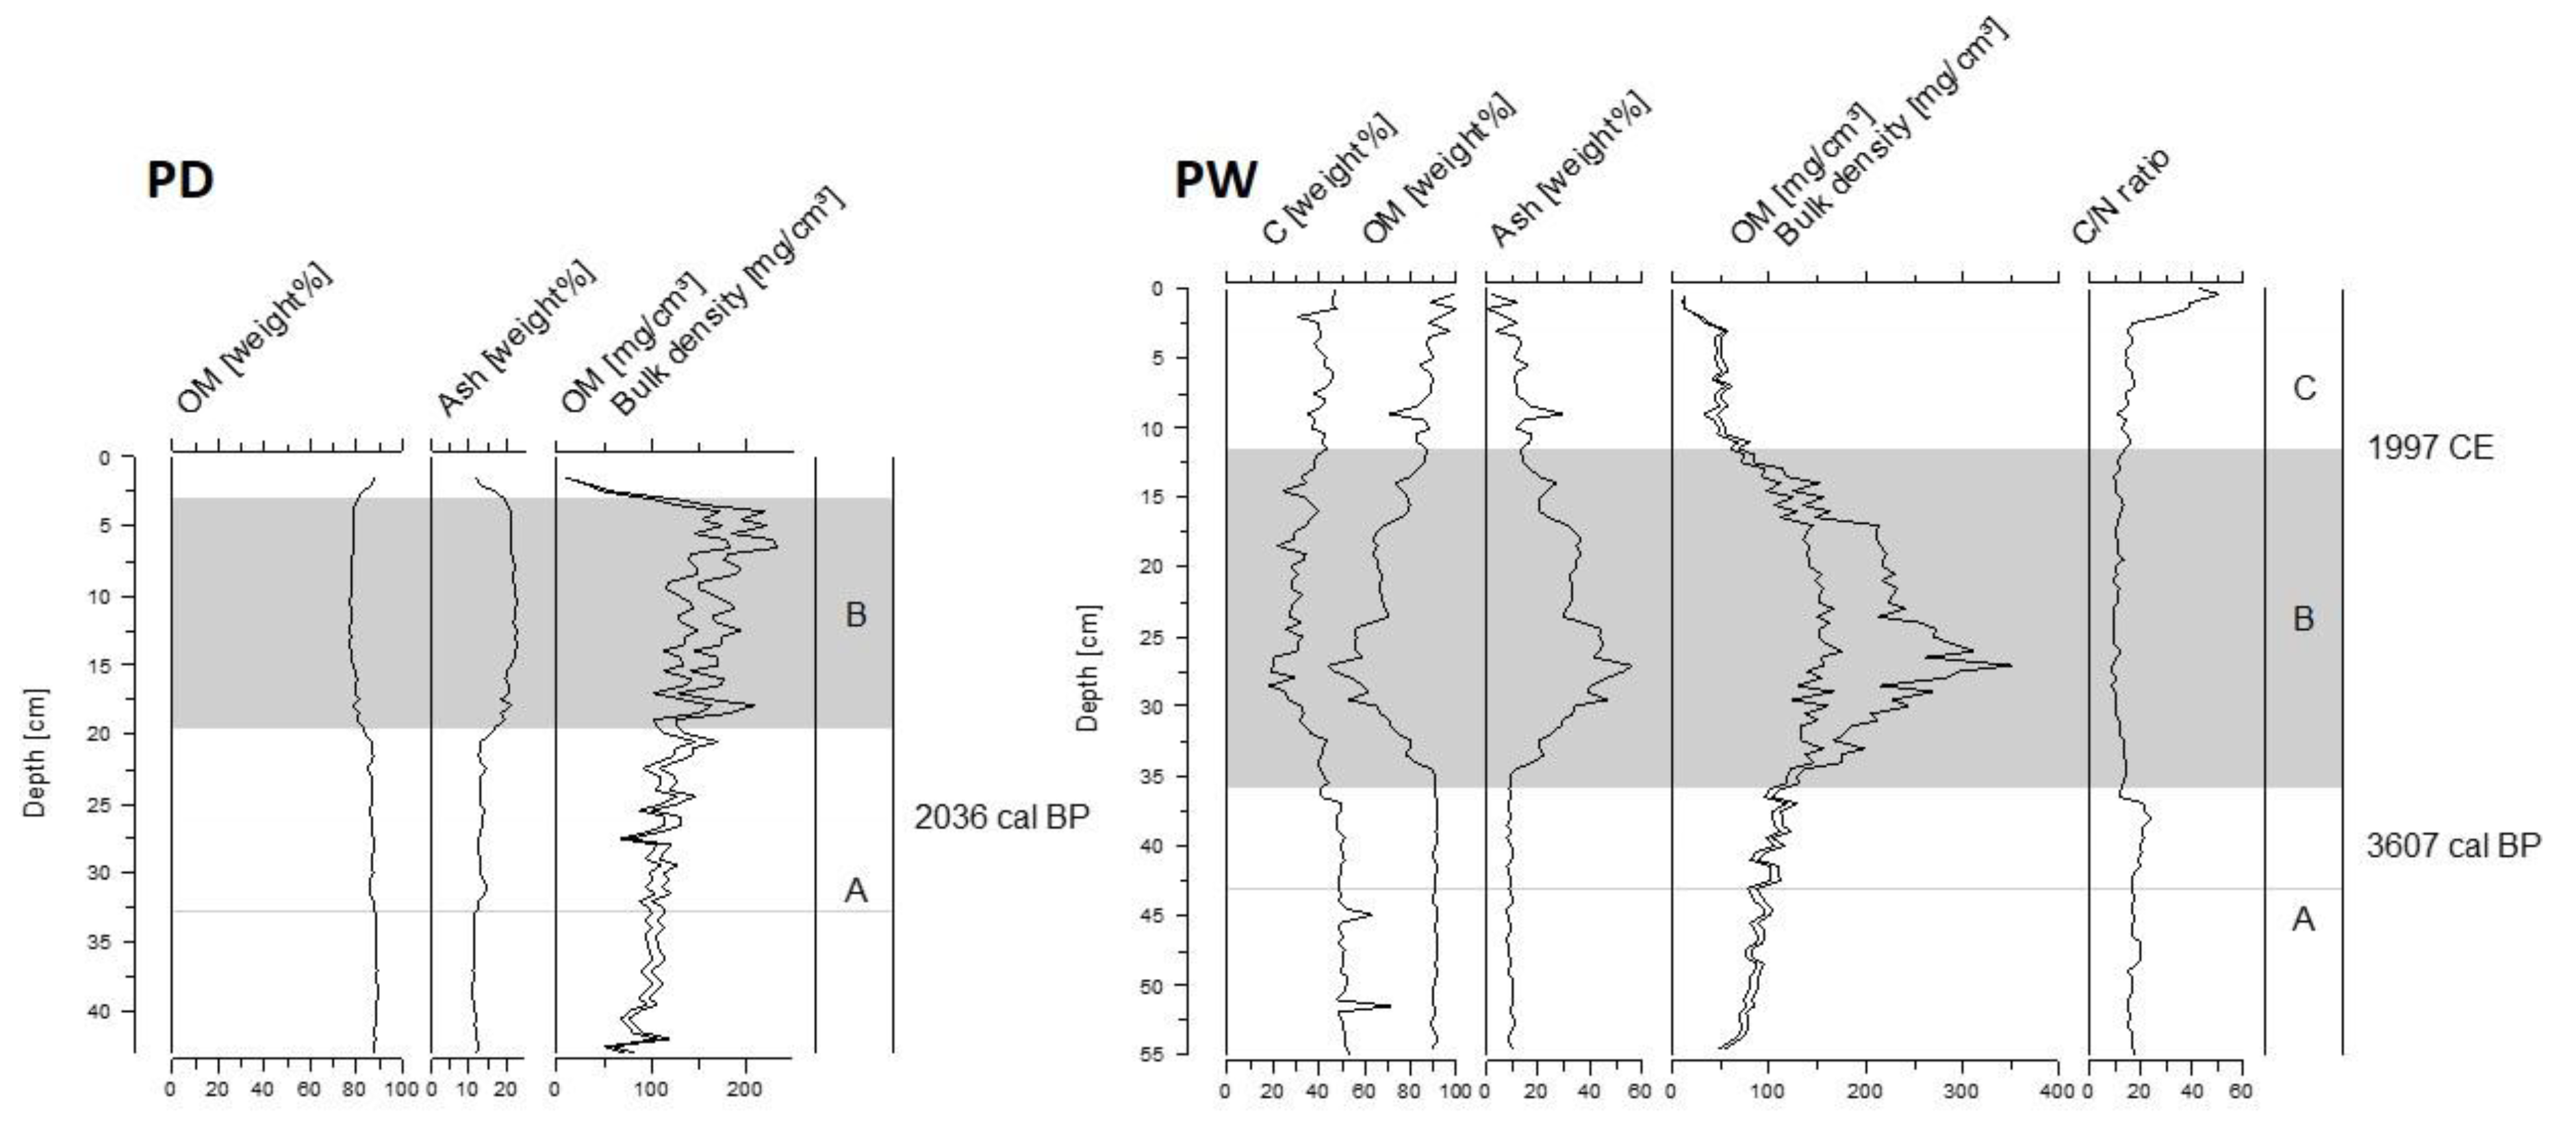
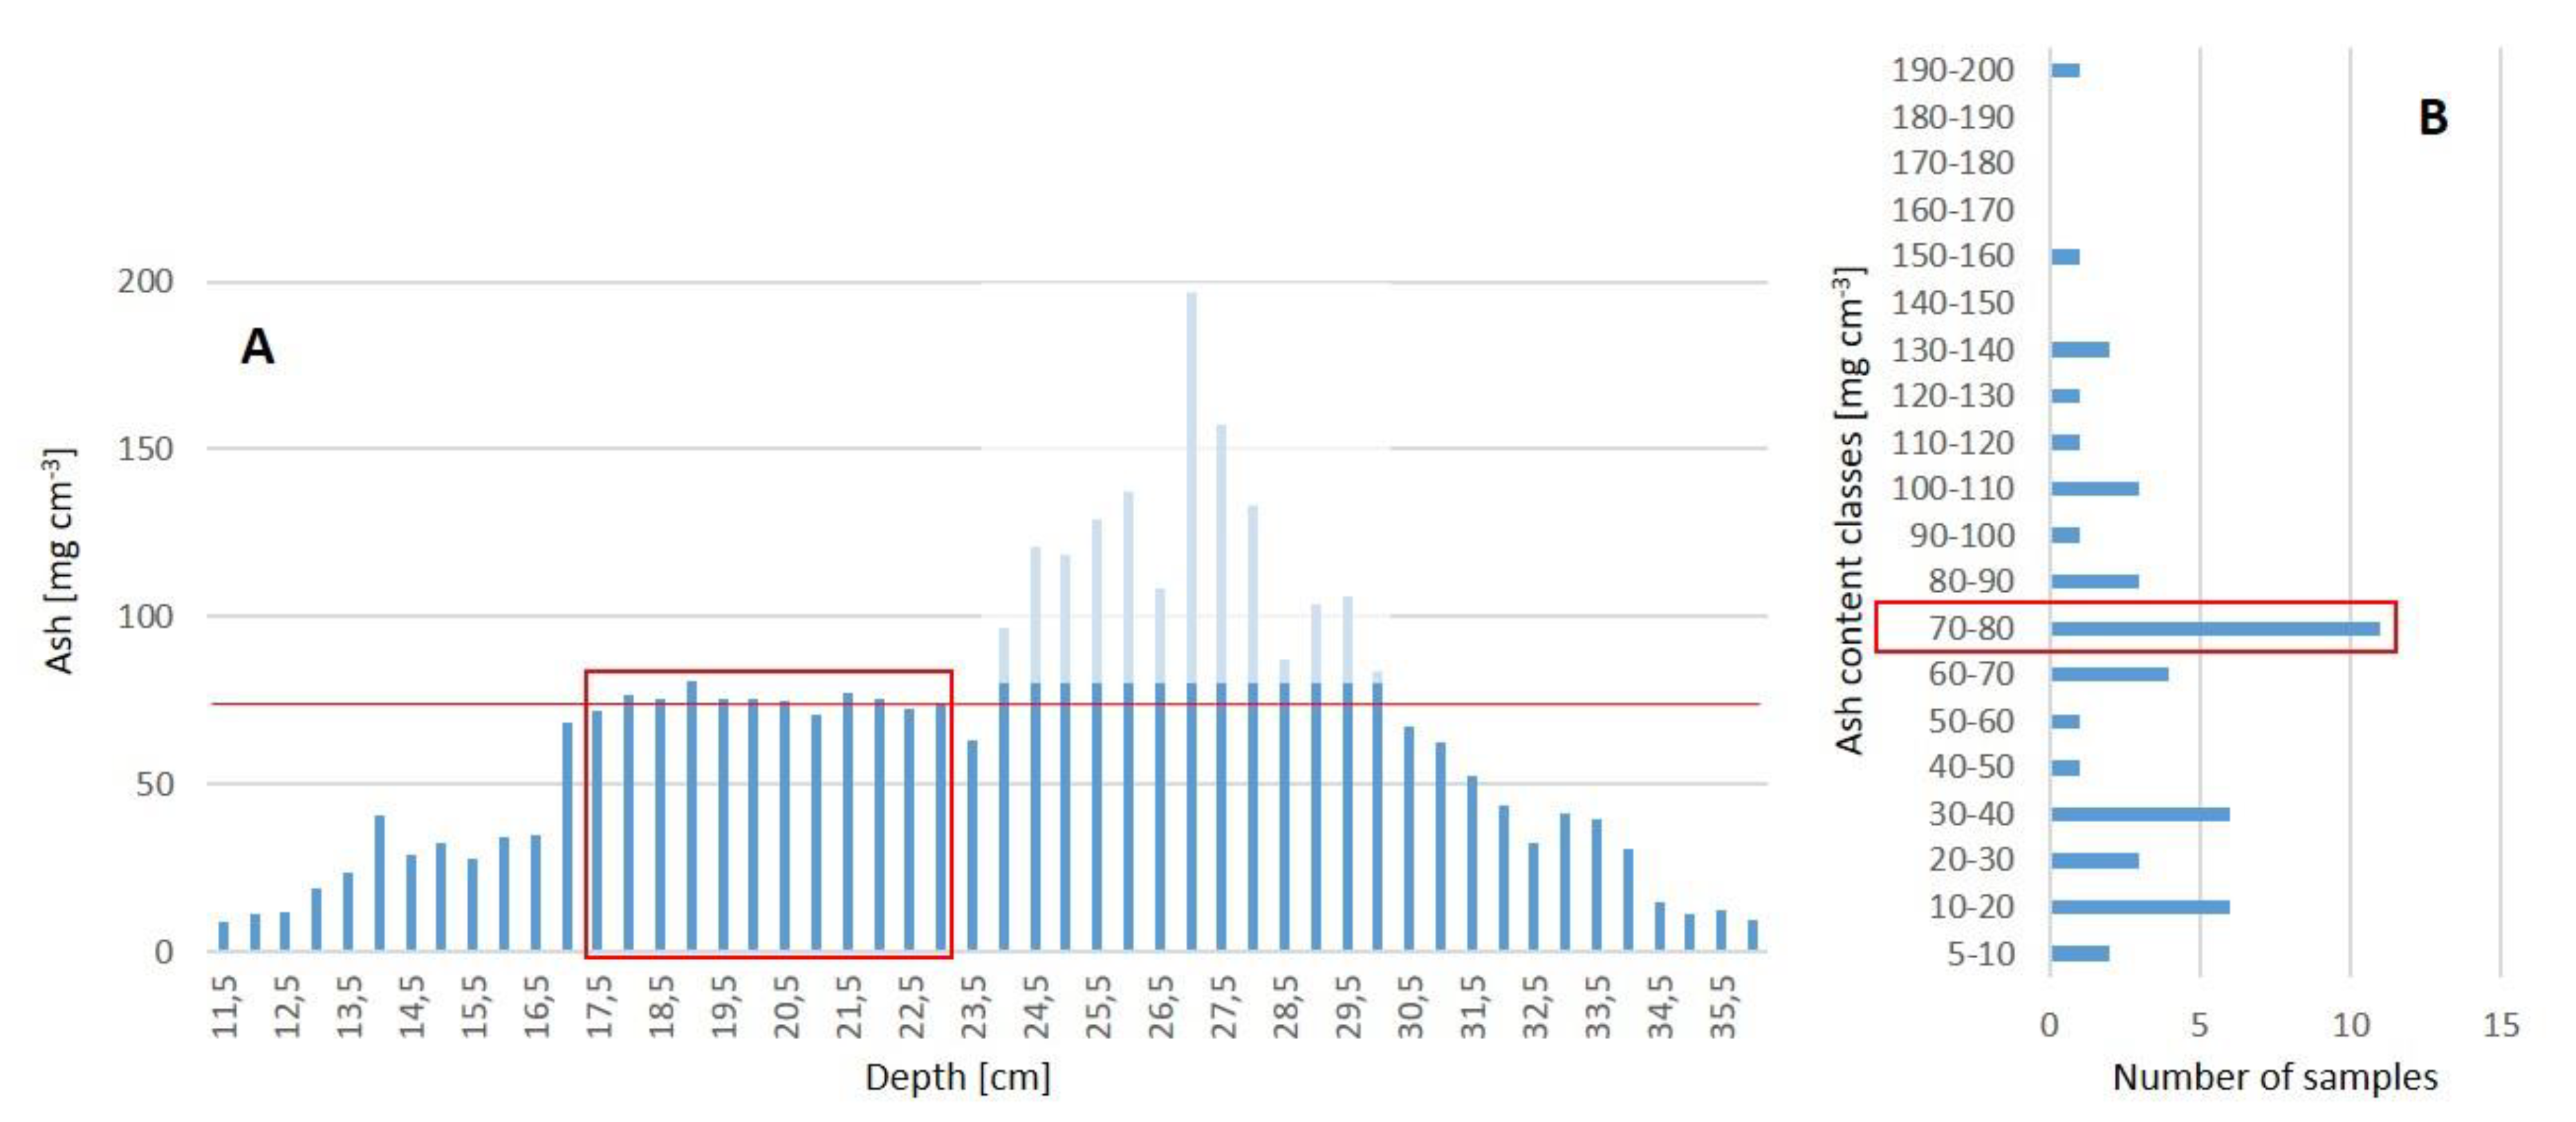
3.2. Bulk Density, Ash, Organic Matter and Carbon Content

The bulk density and the ash content (Figure 3) were small in the A layers and (much) larger in the B layers. In both cores bulk density rose from the bottom to the top of the A layer: in PD from ~100 to ~120 mg cm−3 and in PW from ~85 to ~110 mg cm−3. Ash content in the A layer was on average 9% (8−10 mg cm−3) in PW. It was somewhat larger in PD where samples below 32.5 cm contained ~11.5% (11.5 mg cm−3) and samples above ~13.5% (16 mg cm−3). In PD layer B showed bulk density of around 175 mg cm−3 with a maximum value of 233 mg cm−3. In layer B of PW bulk density values showed a maximum up to 353 mg cm−3 between 24 and 30 cm. Between 23.5 and 17 cm, values were around 210 mg cm−3, fell to around 150 mg cm at 16.5 cm, and then decreased to around 80 mg cm−3 at the transition to the C layer. The ash content in the B layer of PW was correspondingly high with a mean of 30% and a maximum of 56% between 24 and 30 cm, where small pebbles and brick fragments could already be seen with the naked eye during sampling. Ash content in the B layer of PD was much smaller (mean 21%). In contrast, the OM per volume behaved very similar at both sites. It increased from an average of 90 mg cm−3 in the A layers to an average of 135 mg/cm3 in the B layers. This increase in volumetric OM content occurred in both profiles despite a concurrent decline in OM percentage by weight values down to an average of 79% in PD and 70% in PW.
Both A layers can be subdivided into two parts (Figure 3): In PD, the bulk density and OM (per volume) slightly decreased towards the top of the layer, but the ash content increased distinctly around 32.5 cm. In PW, the ash content was stable, but bulk density and OM (per volume) increased to distinctly larger values above 42.5 cm.
The C layer of PW had a lower OM content (~86%, ~47 mg cm−3) and a larger ash portion (~14%), but a smaller bulk density (~54 mg cm−3) resulting in a smaller ash per weight value (~7 mg cm−3) than the A layers of both sites.
The measured C percentage values in PW largely showed a similar behaviour over depth as the OM percentages (Figure 3 PW). They represent on average 55% of OM in layer A and 47% of OM in the layers B and C.

3.3. Losses and Gains

For the calculations of losses in OM and thickness, we considered the lowermost section of peat of the sites as undisturbed and as a valid reference (Table 1). In PD, we took the small ash values below 32.5 cm and in PW the small bulk density values below 42.5 cm as representative of undisturbed peat (see Table 1, Figure 3). Thus, the mean reference values derived from 21 samples and 10.5 cm of peat in PD and from 24 samples and 12 cm of peat in PW, where the deepest sample (55 cm) was excluded as volumetric sampling was uncertain here (Figure 3).
The loss of organic matter differed markedly between the sites (Table 2). At PD, we calculated an overall loss of OM of 2577 mg cm−2 in the highly degraded B layer and additional losses in the upper part of the A layer, summing up to 2850 mg cm−2 down to the border of the undisturbed peat at 32.5 cm. At PW, we found an overall loss of OM of 13,246 mg cm−2, or of ~10,224 mg cm−2 if we correct ash values. The background and detailed procedure of ash correction are provided in discussion Section 4.1.
The total C loss of 1424 mg cm−2 for PD was very low compared with the 7834 mg cm−2 or 6122 mg cm−2 with corrected ash values for PW. Whereas total C loss in PD was assumed to amount to 50% of lost OM, it represented ~47% (B and C layer) and ~55% (A layer) of the calculated OM loss at PW.
For the calculation of annual emissions, we used two time periods. As slight human-induced changes in the hydrology of the mire system date back to at least 1744 CE, we assumed that accumulation ended at this time and probably a moderate loss of organic material set in. Heavy drainage with high losses of organic matter probably only started after 1967 CE. We calculated losses for both time spans (Table 3): the long one with respectively 273 (PD) and 253 (PW) years since 1744 until 2017 CE at PD and until rewetting in 1997 at PW; and the short one with 50 and 30 years since the complex melioration in 1967 until 2017 (PD) and until rewetting in 1997 (PW), respectively. The calculated annual CO2 emissions of 2 and 10 t ha−1 a−1 at PD are very small compared with those of 9 and 75 t ha−1 a−1 at PW. For PW, we additionally calculated losses assuming emissions of 30 t CO2 ha−1 a−1 for the period after 1967, resulting in annual emissions of 6 t CO2 ha−1 a−1 for the time span between 1744 and 1967 CE.
To calculate the loss of height (thickness), we used the bulk density of the undisturbed peat (Table 1) for Method 1. For PW we calculated two scenarios based on original ash values and on corrected ash values (for ash correction see discussion Section 4.1). For Method 2, one sample per site was 14C-AMS-radiocarbon dated (Table 1), revealing weighted average ages of 2036 cal BP at 26 cm in PD and 3607 cal BP at 40 cm in PW (note that cal BP uses 1950 CE as a reference year). Assuming that accumulation stopped around 1744 CE, we calculated 1830 years of accumulation at PD and 3401 years at PW.
The loss of thickness differed between the sites with values well below 100 cm at PD (Table 4) and well above 100 cm at PW (Table 5). For PD, Method 1 gave 43 cm, which was smaller than the 79 cm calculated with Method 2. Similarly, for PW, Method 1 (ash corrected) gave 150 cm, i.e., less than the 162 cm calculated with Method 2. The uncorrected Method 1 values for PW are listed in Table 5 for comparison, but are not discussed further because of their poor plausibility.
In the 20 years since rewetting, 11 cm of material (including the uppermost litter) accumulated in PW (Table 6). This material contains a total of 447 mg cm−2 of OM and 212 mg C cm−2, which equals an average annual uptake of 390 g CO2 m−2 a−1.

4. Discussion

4.1. Loss of Organic Matter and Carbon

The sites PD and PW differed markedly concerning OM and C losses, with much larger values at PW. Both sites belong to the same percolation fen system and we expected management, including ploughing and intensity of drainage since 1744 and 1969 to have been similar. Yet, our results highlight quite marked differences between the sites.
At the drained PD site, the degraded layer is only 23.5 cm thick and peat directly underneath this layer dates back to only ~2000 cal. BP, which make the site seem rather less affected by drainage than PW. PD is situated in a vast branch of the valley mire complex, 600 m off the valley edge with another 900 m down to the River Recknitz. The hilly plateau bordering the valley rises to heights of 25 m and more within a distance of 1500 m and supplies groundwater to springs at the edge of the valley, a typical situation in these river valleys [31,32]. The water supply must have been plentiful and stable, so that the original peat remained slightly decomposed with a low bulk density of ~100 mg/cm3 compared to the reported 140–180 mg/cm3 from other fen sites [31,33]. Likely, the large water supply could not be cut completely following drainage.
At the rewetted site PW, the degraded layer is 29 cm thick and peat directly underneath this layer dates back to ~3600 cal. BP, hinting to a much stronger effect of drainage at this site. The site is situated in a smaller branch of the valley mire complex, only 100 m from the valley edge and 750 m from the River Trebel. The plateau bordering the valley is less high and steep than at the PD site reaching a height of ~15 m within 1500 m distance. This situation and the closeness to the edge may after drainage have provided a less stable water supply than in PD and a higher nutrient import from the upland, supporting a higher plant productivity and resulting in a more decomposed peat. Furthermore, drainage must have been more effective here, already affecting the peat during times of low-intensity drainage and management starting in the 18th century and with a strong impact following the interventions of 1967 CE.
Overall OM loss in PD amounted to about 2.9 g cm−2, which is almost five times smaller than the >13 g cm−2 in PW. The difference is mainly a consequence of drainage and soil management that affected deeper and older layers at PW, as bulk density and ash content of the undisturbed peat are similar at the two sites. In addition to the likely less intense drainage and soil management in PD, PD lies much farther from the edge of the valley than PW, making random unintentional input of clastic material less likely.
The ash content in the degraded layer of PW was very high, although the 9% ash content in the original peat was low for sedge peat [31,34], and even somewhat lower than at PD where it was 11–13%. If the site was ploughed as the pollen record suggests, then additional soil treatments like harrowing and sowing will very likely have occurred as well. We found brick fragments and small stones up to 2 cm diameter. As systematic input of soil material is not evident (and unlikely), we assume that repeated visits with machinery will have brought the pebbles, brick fragments and additional mineral material of smaller fractions from the nearby upland, in this way enriching the ash content of the degraded layer.
The input of clastic material resulted in extraordinarily large ash values in layer B in PW that skew the ash/OM ratio and artificially increased the calculated original OM value. In an attempt to correct for the clastic input, we compared the ash content of the degraded layer B with C/N ratios (Figure 3). Both ash content and C/N ratios are commonly used as indicators for degree of decomposition. If the ash content is large, so should the C/N ratio be. In the case of clastic input, ash content would be large, but the C/N ratio not. Largest ash values were found between 24 and 30 cm, where C/N ratios remained stable, however (Figure 3). We therefore assumed that these samples contained additional material, also because ash content (Figure 4) changed very erratically at these depths. The samples between 17.5 and 23 cm showed rather stable ash contents (see Figure 4 and OM+BD curve in Figure 3), and we used the mean value of 75 mg cm−3 of this section to replace the high overshooting values between 24 and 30 cm (Figure 4). In this way, the total loss of OM for PW was recalculated to 10 g cm−2.
This correction is somewhat speculative, but it is based on sound observations and delivers more plausible results (see also corrected results and discussion for C, CO2, and especially thickness loss in Section 4.2).
Carbon losses and hence CO2 emissions also showed large differences between the sites. The mean 55% carbon content of OM in the undisturbed peat section and the 47% in the disturbed peat section of PW were low compared with the 58% for vascular plant peat and 53% for amorphous peat found by Klingenfuß et al. [35] in a review of peat samples from NE Germany. In light of the complicated history of the PW site and the apparently different hydrology of the PD site (with much stronger artesic influence) we decided not to use the PW values in the calculations for the PD site, but to use a value of 50% instead. If we had used higher values, calculated carbon losses would have been larger, even more so if we had assumed lower carbon content for the disturbed than for the undisturbed peat. Our approach thus results in a conservative, i.e., too low, estimate of actual carbon losses.
At PD, calculated CO2 emissions for the 273 years since first drainage were on average 2 t ha−1 a−1, which is very small and comparable with emissions from near-natural peatlands [11]. Such low values do not seem realistic as we find a heavily degraded peat layer at the top of the profile. When we assume that drainage at this difficult to drain site was only effective starting with the industrial drainage activities 50 years ago, we arrive at an emission of 10.5 t CO2 ha−1a−1, which is similar to a moist to very moist grassland [36,37]. As discussed above, the good water supply and the large distance from the valley edge probably prevented strong degradation, high OM loss and CO2 emissions at this site, which is still drained and used as grassland.
At PW, the mean CO2 emissions for 253 years since first drainage amounted to 9 t CO2 ha−1 a−1, a value similar to moist grassland, but this value is not plausible for the whole period. Particularly during the time of deep drainage and intensive land use between 1967 and 1997 CE, emissions must have been larger. Assuming that degradation and emissions were restricted to this period of intensive land use, we arrive at an estimate of 75 t CO2 ha−1 a−1, which is an unrealistically large value that is 1.5 to two times larger than commonly measured in deep-drained temperate peatlands [38]. A more reasonable, but still large estimate for CO2 emissions from a high-intensity grassland would be 30 t CO2 ha−1 a−1 [36,37,38]. If we assume emissions of 30 t CO2 ha−1 a−1 for the 30 years of high intensity use, this leaves another 6 t CO2 ha−1 a−1 for the remaining 223 years, which is a more conceivable scenario. Another possibility is that losses were indeed largely restricted to the 30-year period, but that organic matter was lost due to wind erosion when the soil was ploughed or otherwise opened. Losses can be very large during single erosion events [39,40,41,42].

4.2. Thickness Loss

Total height losses were estimated to be smaller at PD than at PW. For both sites, Method 2 (via accumulation rate) led to a much larger value than method 1 (via OM; Table 4 and Table 5). The deviation between the methods can hardly be explained by uncertainties in the 14C dates used in Method 2. Although 14C dates have an inherent uncertainty and calibration to calendar years introduces some more, the 2 σ spans amount to ± ~100 years, which translates to only ± ~5 cm difference in height, much less than the difference between the methods. Large values using Method 2 might also be the result of overestimating the accumulation rate. Yet, radiocarbon dates from three cores taken in the Recknitz valley 1500 m south of site PD ([32] and unpublished data) revealed accumulation rates of 0.59–0.66 mm a−1, and so the used value of 0.56 mm a−1 is actually rather conservative. Another explanation could be that accumulation had stopped or been reduced because of human impact already before 1744 CE. Yet, such activities are not evident from the archives.
As mentioned above, ploughed, desiccated peat can become subject to wind erosion and large associated losses of material. Both sites were ploughed and bare peat was exposed, allowing for wind to remove material. Losses from wind erosion can amount to several tonnes of soil per ha or several centimetres of height per year [41,43].
Although the difference between the results of the methods are small at PW, we may have underestimated the input of clastic material and therewith have overestimated the loss of organic material in PW. Such an error would bring the estimates of the two methods closer together.

4.3. Matter Accumulation

The 11 cm and 4.5 kg OM m−2 that have accumulated in in PW in the 20 years since rewetting contained 2.1 kg C m−2 or, if scaled up, 21 t C ha−1 (Table 6). On average, these values indicate an accumulation of 224 g OM or 106 g C m−2 a−1 (corresponding to 389 g CO2 m−2 a−1). Direct flux measurements carried out close to our sampling site in the years 2012 and 2013 showed C fluxes ranging from a net uptake of 70 to a net loss of 100 g C m−2 (CO2 and CH4 combined; [11]). Typical long-term rates of carbon accumulation are around 20 g C m−2 a−1 (e.g., [44]) and recent rates can amount up to ~100 g C m−2 a−1 in temperate sites [45]. The sink size derived from our core data lies in the upper range of the known values, which may be attributed to vegetation restructuring after rewetting including the build-up of a thick root mat that is predominantly made up of Carex acutiformis roots. As the gas fluxes of neither the years 2012 and 2013 nor 2018 and 2019 indicate a major net carbon uptake at these or neighboring sites ([11] and own unpublished data), the bulk of the material must have been deposited during the first few years after rewetting.
A successful rewetting that re-establishes a net carbon sink can thus not only help curb climate change by removing CO2 from the atmosphere over longer time periods, but particularly also by removing large quantities in the first few years after rewetting. The total sink of ~20 t C ha−1 achieved in the first few years is comparable to half the sink achieved by a beech forest typical of N Germany during 40 years [46]. Of course, the fast sink of the rewetted peatland is soon saturated and only slow accumulation will occur in later years. In contrast, the beech forest will continue to grow, achieving a total wood sink of ~160 t C ha−1 in a 130-year old stand [46,47]. However, the importance of peatland rewetting in terms of carbon mitigation particularly lies in avoiding CO2 emissions. During the 20 years since rewetting, emissions in the order of c. 160 t C ha−1 have been avoided.

5. Conclusions

Peatlands are known and appreciated not only for storing large amounts of C, but also for storing information about the past. Once peatlands are drained, they start losing both the C and the information. Yet, these losses leave their own recognizable signal in the peat column and for our study sites provide information on the effects of drainage in the past 250 years. Although the largest C losses must have occurred during the past 50 years of intensive, deep drainage, and industrial agriculture, emissions before 1967 go back to pre-industrial times and are not negligible.
The derived height losses provide a better understanding of the former landscape. The drained river valley peatlands were once higher and wider and contained much more water than at present. The loss of up to 150 cm of height means a huge water loss not only in the vast river valleys themselves. The valley catchments will have had higher groundwater levels as well, so that the overall landscape will have stored much more water, making it more resilient against extremely dry years that presently trouble the area. Applying our study approach to more sites spread over larger areas would allow for large-scale modelling of landscape change and its impact.
The restoration of the former landscape water balance is not possible. However, our study has shown that despite a long history of drainage and peat loss, rewetting can indeed restore an accumulating peatland ecosystem. Yet, in terms of climate change mitigation, this restored sink is of much smaller importance than avoided future emissions from ongoing drainage.

Author Contributions

A.M. and J.C. conceived the study. D.M. analysed macro-remains, A.M. analysed micro-remains. A.M. and J.C. performed the calculations. A.M. led writing of the manuscript to which all authors contributed. All authors have read and agreed to the published version of the manuscript.

Funding

This study was supported by the European Social Fund (ESF) and the Ministry of Education, Science and Culture of Mecklenburg-Western Pomerania within the scope of the project WETSCAPES (ESF/14-BM-A55-0035/16 and ESF/14-BM-A55-0030/16).

Acknowledgments

We thank Stella Gribbe and Sabine Kell for help in preparation of the core samples.

Conflicts of Interest

The authors declare no conflict of interest.

References

  1. Joosten, H.; Sirin, A.; Couwenberg, J.; Laine, J.; Smith, P. The role of peatlands in climate regulation. In Peatland Restoration and Ecosystem Services: Science, Policy and Practice; Bonn, A., Allot, T., Evans, M., Joosten, H., Stoneman, R., Eds.; Cambridge University Press: Cambridge, UK, 2016; pp. 63–76. [Google Scholar]
  2. Leifeld, J.; Menichetti, L. The underappreciated potential of peatlands in global climate change mitigation strategies. Nat. Commun. 2018, 9, 1071. [Google Scholar] [CrossRef] [Green Version]
  3. Hawken, P. Drawdown: The Most Comprehensive Plan Ever Proposed to Reverse Global Warming; Penguin Books: New York, NY, USA, 2017; 256p. [Google Scholar]
  4. Lamers, L.P.; Vile, M.A.; Grootjans, A.P.; Acreman, M.C.; van Diggelen, R.; Evans, M.G.; Richardson, C.J.; Rochefort, L.; Kooijman, A.M.; Roelofs, J.G.M.; et al. Ecological restoration of rich fens in Europe and North America: From trial and error to an evidence-based approach. Biol. Rev. 2015, 90, 182–203. [Google Scholar] [CrossRef] [PubMed] [Green Version]
  5. Kotowski, W.; Ackerman, M.; Grootjans, A.B.; Klimkowska, A.; Rößling, H.; Wheeler, B. Restoration of temperate fens: Matching strategies with site potential. In Peatland Restoration and Ecosystem Services: Science, Policy and Practice; Bonn, A., Allot, T., Evans, M., Joosten, H., Stoneman, R., Eds.; Cambridge University Press: Cambridge, UK, 2016; pp. 170–191. [Google Scholar]
  6. Joosten, H.; Tanneberger, F.; Moen, A. Mires and Peatlands of Europe, Status, Distribution and Conservation; E. Schweizerbart’sche Verlagsbuchhandlung: Stuttgart, Germany, 2017; 780p. [Google Scholar]
  7. Zauft, M.; Fell, H.; Glaßer, F.; Rosskopf, N.; Zeitz, J. Carbon storage in the peatlands of Mecklenburg-Western Pomerania, north-east Germany. Mires Peat 2010, 6, 1–12. [Google Scholar]
  8. MLUV M-V (Ministerium für Landwirtschaft, Umwelt und Verbraucherschutz Mecklenburg-Vorpommern). Konzept zum Schutz und zur Nutzung der Moore. Fortschreibung des Konzeptes zur Bestandssicherung und zur Entwicklung der Moore (Moorschutzkonzept); MLUV M-V (Ministerium für Landwirtschaft, Umwelt und Verbraucherschutz Mecklenburg-Vorpommern): Schwerin, Germany, 2009; 109p.
  9. Jurasinski, G.; Ahmad, S.; Anadon-Rosell, A.; Berendt, J.; Beyer, F.; Bill, R.; Blume-Werry, G.; Couwenberg, J.; Günther, A.; Joosten, H.; et al. From understanding to sustainable use of peatlands: The WETSCAPES approach. Soil Syst. 2020, 4, 14. [Google Scholar] [CrossRef] [Green Version]
  10. Succow, M. Die Vegetation Nordmecklenburgischer Flußtalmoore und Ihre Anthropogene Umwandlung. Ph.D. Thesis, E.-M.-Arndt Universität, Greifswald, Germany, 1970. [Google Scholar]
  11. Günther, A.; Huth, V.; Jurasinski, G.; Glatzel, S. The effect of biomass harvesting on greenhouse gas emissions from a rewetted temperate fen. GCB Bioenergy 2015, 7, 1092–1106. [Google Scholar] [CrossRef]
  12. Bönsel, A.; Sonneck, A. Development of ombrotrophic raised bogs in North-east Germany 17 years after the adoption of a protective program. Wetl. Ecol. Manag. 2012, 20, 503–520. [Google Scholar] [CrossRef]
  13. Joosten, H.; de Klerk, P. DAMOCLES: A DAshing MOnolith Cutter for fine sectioning of peats and sediments into LargE Slices. Boreas 2007, 36, 76–81. [Google Scholar] [CrossRef]
  14. Matjuschenko, W. Schlüssel zur Bestimmung der in den Mooren vorkommenden Carexarten (translation by S. Ruoff). Geol. Archiv, Z. Gesamtgeb. d. Geol. 1924, 3, 183–188 + 192–193. [Google Scholar]
  15. Mauquoy, D.; van Geel, B. Mire and peat macros. In Encyclopedia of Quaternary Science; Elias, S.A., Ed.; Elsevier: Amsterdam, The Netherlands, 2007; Volume 3, pp. 2315–2336. [Google Scholar]
  16. Bertsch, K. Lehrbuch der Pollenanalyse; Ferdinand Enke: Stuttgart, Germany, 1942; 195p. [Google Scholar]
  17. Grosse-Brauckmann, G. Über pflanzliche Makrofossilien mitteleuropäischer Torfe. I. Gewebereste krautiger Pflanzen und ihre Bestimmung. Telma 1972, 2, 19–56. [Google Scholar]
  18. Michaelis, D. Ein Schlüssel zur Bestimmung von Braunmoosen in Torfen anhand einzelner Blättchen. Telma 2001, 31, 79–104. [Google Scholar]
  19. Birks, H.H. Plant macrofossil introduction. In Encyclopedia of Quaternary Science; Elias, S.A., Ed.; Elsevier: Amsterdam, The Netherlands, 2007; Volume 3, pp. 2266–2288. [Google Scholar]
  20. Grosse-Brauckmann, G.; Streitz, B. Pflanzliche Makrofossilien mitteleuropäischer Torfe. III. Früchte, Samen und einige Gewebe. Telma 1992, 22, 53–102. [Google Scholar]
  21. Telford, R.J.; Heegaard, E.; Birks, H.J.B. The intercept is a poor estimate of a calibrated radiocarbon age. Holocene 2004, 14, 296–298. [Google Scholar] [CrossRef] [Green Version]
  22. Fægri, K.; Iversen, J. Textbook of Pollen Analysis, 4th ed.; Wiley: Chichester, UK, 1989; 328p. [Google Scholar]
  23. Moore, P.D.; Webb, J.A.; Collinson, M.E. Pollen Analysis, 2nd ed.; Blackwell Science: Oxford, UK, 1991; 216p. [Google Scholar]
  24. Prager, A.; Barthelmes, A.; Theuerkauf, M.; Joosten, H. Non-pollen palynomorphs from modern Alder carrs and their potential for interpreting microfossil data from peat. Rev. Palaeobot. Palynol. 2006, 141, 7–31. [Google Scholar] [CrossRef]
  25. Barthelmes, A.; de Klerk, P.; Prager, A.; Theuerkauf, M.; Unterseher, M.; Joosten, H. Expanding NPP analysis to eutrophic and forested sites: Significance of NPPs in a Holocene wood peat section (NE Germany). Rev. Palaeobot. Palynol. 2012, 186, 22–37. [Google Scholar] [CrossRef]
  26. Michaelis, D.; Mrotzek, A.; Couwenberg, J. Roots, tissues, cells and fragments—How to characterize peat from drained and rewetted fens. Soil Syst. 2020, 4, 12. [Google Scholar] [CrossRef] [Green Version]
  27. van Geel, B.; Coope, G.R.; van der Hammen, T. Palaeoecologyand stratigraphy of the Lateglacial type section at Usselo (The Netherlands). Rev. Palaeobot. Palynol. 1989, 60, 25–129. [Google Scholar] [CrossRef]
  28. Joosten, H.; de Klerk, P. What’s in a name? Some thoughts on pollen classification, identification, and nomenclature in quaternary palynology. Rev. Palaeobot. Palynol. 2002, 122, 29–45. [Google Scholar] [CrossRef]
  29. Couwenberg, J.; de Klerk, P.; Endtmann, E.; Joosten, H.; Michaelis, D. Hydrogenetische Moortypen in der Zeit–eine Zusammenschau. In Landschaftsökologische Moorkunde, 2nd ed.; Succow, M., Joosten, H., Eds.; E. Schweizerbart’sche Verlagsbuchhandlung: Stuttgart, Germany, 2001; pp. 399–403. [Google Scholar]
  30. Ewing, J.M.; Vepraskas, M.J. Estimating primary and secondary subsidence in an organic soil 15, 20, and 30 years after drainage. Wetlands 2006, 26, 119–130. [Google Scholar] [CrossRef]
  31. Succow, M.; Joosten, H. Landschaftsökologische Moorkunde, 2nd ed.; Schweizerbart’sche Verlagsbuchhandlung: Stuttgart, Germany, 2001; 622p. [Google Scholar]
  32. Michaelis, D.; Joosten, H. Mire development, relative sea level change, and tectonic movement along the Northeast-German Baltic Sea coast. Ber. Römisch-German. Komm. 2007, 88, 101–134. [Google Scholar]
  33. Roßkopf, N.; Fell, H.; Zeitz, J. Organic soils in Germany, their distribution and carbon stocks. Catena 2015, 133, 157–170. [Google Scholar] [CrossRef]
  34. Rydelek, P. Origin and composition of mineral constituents of fen peats from Eastern Poland. J. Plant Nutr. 2013, 36, 911–928. [Google Scholar] [CrossRef]
  35. Klingenfuß, C.; Roßkopf, N.; Walter, J.; Heller, C.; Zeitz, J. Soil organic matter to soil organic carbon ratios of peatland soil substrates. Geoderma 2014, 235, 410–417. [Google Scholar] [CrossRef]
  36. Couwenberg, J.; Thiele, A.; Tanneberger, F.; Augustin, J.; Bärisch, S.; Dubovik, D.; Liashchynskaya, N.; Michaelis, D.; Minke, M.; Skuratovich, A.; et al. Assessing greenhouse gas emissions from peatlands using vegetation as a proxy. Hydrobiologia 2011, 674, 67–89. [Google Scholar] [CrossRef]
  37. Reichelt, F.; Lechtape, C. Greifswalder Moorstudie—Abschlussbericht Emissionsbilanzierung und Handlungsempfehlungen für die Moorflächen im Greifswalder Stadtgebiet; Greifswald Moor Centrum: Greifswald, Germany, 2019; 36p. [Google Scholar]
  38. Tiemeyer, B.; Albiac Borraz, E.; Augustin, J.; Bechtold, M.; Beetz, S.; Beyer, C.; Drösler, M.; Ebli, M.; Eickenscheidt, T.; Fiedler, S.; et al. High emissions of greenhouse gases from grasslands on peat and other organic soils. Glob. Chang. Biol. 2016, 22, 4134–4149. [Google Scholar] [CrossRef]
  39. Weir, W.W. Subsidence of peat lands of the Sacramento-San Joaquin delta, California. Hilgardia 1950, 20, 37–56. [Google Scholar] [CrossRef]
  40. Succow, M.; Jeschke, L. Moore in der Landshaft; Urania-Verlag: Jena, Germany, 1986; 268p. [Google Scholar]
  41. Parent, L.E.; Millette, J.A.; Mehuys, G.R. Subsidence and Erosion of a Histosol. Soil Sci. Soc. Am. J. 1982, 46, 404–408. [Google Scholar] [CrossRef]
  42. Deverel, S.J.; Leighton, D.A. Historic, Recent, and Future Subsidence, Sacramento-San Joaquin Delta, California, USA. San Fr. Estuary Watershed Sci. 2010, 8, 1–23. [Google Scholar] [CrossRef] [Green Version]
  43. Schäfer, W.; Neemann, W.; Kuntze, H. Wind erosion on calcareous fenlands in North Germany. In Proceedings of the Fenland Symposium (British Society of Soil Science/IPS), Cambridge, UK, 8–12 April 1991. [Google Scholar]
  44. Loisel, J.; van Bellen, S.; Pelletier, L.; Talbot, J.; Hugelius, G.; Karran, D.; Yu, Z.; Nichols, J.; Holmquist, J. Insights and issues with estimating northern peatland carbon stocks and fluxes since the Last Glacial Maximum. Earth Sci. Rev. 2017, 165, 59–80. [Google Scholar] [CrossRef]
  45. Young, D.M.; Baird, A.J.; Charman, D.J.; Evans, C.D.; Gallego-Sala, A.V.; Gill, P.J.; Hughes, P.D.M.; Morris, P.J.; Swindles, G.T. Misinterpreting carbon accumulation rates in records from near-surface peat. Sci. Rep. 2019, 9, 1–8. [Google Scholar] [CrossRef]
  46. Wördehoff, R. Kohlenstoffspeicherung als Teilziel der strategischen Waldbauplanung. Ph.D. Thesis, Georg-August-University, Göttingen, Germany, 2016. [Google Scholar]
  47. Mund, M.; Schulze, E.-D. Impacts of forest management on the carbon budget of European beech (Fagus sylvatica) forests. Allg. Forst Jagdztg. 2006, 177, 47–63. [Google Scholar]
Figure 1. Selected curves of macro- and micro-remain analyses of site PD. Note the scales and units of the x-axes. Curves show percentages (%) of macro-remains as indicated or otherwise concentrations (101 N cm−3) of micro-remains.
Soilsystems 04 00016 g001
Figure 2. Selected curves of macro- and micro-remain analyses of site PW. Note the scales and units of the x-axes. Curves show percentages (%) or number (N) of macro-remains as indicated or otherwise concentrations (101 N cm−3) of micro-remains.
Soilsystems 04 00016 g002
Figure 3. Profiles of weight% values of organic matter (OM) and ash, OM per volume, and bulk density for sites PD and PW and weight% values of carbon (C) and C/N ratio for PW.
Soilsystems 04 00016 g003
Figure 4. (A) Ash content in relation to depth in layer B of PW illustrating correction of the highly erratic high ash contents in samples 24–30 cm. Red horizontal line: ash level above which external input is assumed; red box: the average ash content of these samples was used to replace the values between 24 and 30 cm in the ‘corrected’ calculations. (B) Number of values per ash content class: red box—class with most values, including all values used to calculate the replacement correction value.
Soilsystems 04 00016 g004
Table 1. Data for calculation of losses at PD and PW.
SiteReference LayerNumber of SamplesMean Bulk DensityMean ash/OMDepth of 14C Date14C Date 1
(2σ Range)
Time before 1744 CE 4
cmmg cm−3cmcal BPa
PD32.5–43211010.1285262036 (1934–2128) 21830 (1728–1922)
PW42.5–54.524860.0996403607 (3484–3694) 33401 (3278–3488)
1 weighted average following Telford et al. 2004; 2 lab-code: Poz−114673; 3 lab-code: Poz−107576, 4 earliest date when both sites likely were drained.
Table 2. Losses of organic matter (OM) at PD and PW and carbon (C) at PW.
Depth RangeThick-NessOM meas.OM orig.Loss of OMC meas.C orig.Loss of C
cmmg cm−2
PD
degraded2.5–19.5172 3414 9182 577
above 14C date2.5–2623.53 0815 8142 733
above undisturbed2.5–32.5303 7216 5712 850 1 424 1
PW
degraded11–36253 35716 60513 2461 5759 4097 834
above 14C date11–40293 77917 00113 2221 7989 6347 836
above undisturbed11–42.531.54 01517 24013 2251 9289 7697 841
PW (ash corrected)
degraded11–36253 35913 58310 2241 5757 6976 122
above 14C date11–40293 77913 97910 2001 7987 9216 123
above undisturbed11–42.531.54 01514 21810 2031 9288 0576 129
1 calculated as 50% of OM
Table 3. Losses of OM, C, and CO2 at PD and PW.
PDPW (Ash Corrected)PW
Total lossOMmg cm−22 85010 24413 246
Cmg cm−21 424 16 1227 834
Ct ha−1142.4612.2783.4
Emission time a2735025330223 + 3025330
Loss per yearCmg cm−2 a−15.2228.5024.20204.05 30.96261.14
CO2g m−2 a−11911 0458877 482 1 1359 575
CO2t ha−1 a−12109756 + 301196
1 calculated as 50% of OM
Table 4. Losses of thickness at PD.
PD SiteMethod 1Method 2
cmcm
Thickness measured3023.5
Thickness original73103 (97−108)
Thickness loss4379 (73-84)
Difference in loss estimates (Meth 2−Meth 1)+36 cm
Loss per year (275 years)0.160.29
Loss per year (50 years)0.871.58
Table 5. Losses of thickness at PW.
PW SiteMethod 1Method 1
(Ash Corrected)
Method 2
cmcmcm
Thickness measured292929
Thickness original217179191 (184−195)
Thickness loss188150162 (155−166)
Difference in loss estimates (Meth 2−Meth 1)−26 cm+12 cm
Loss per year (275 years)0.680.540.59
Loss per year (50 years)3.772.992.69
Table 6. Gains of OM and C and correspondingly bound CO2 in PW layer C.
PW Layer C
Layer cm0−11.0
Total gainOM totalmg cm−2447
C totalmg cm−2212
C totalt ha−121.2
Accumulation time a20
Gain per yearOMg m−2 a−1224
Cg m−2 a−1106
CO2g m−2 a−1389

