Article

Fire Dynamics in an Emerging Deforestation Frontier in Southwestern Amazonia, Brazil

by
Débora Joana Dutra
1,*,
Liana Oighenstein Anderson
1,
Philip Martin Fearnside
2,
Paulo Maurício Lima de Alencastro Graça
2,
Aurora Miho Yanai
2,
Ricardo Dalagnol
3,4,
Chantelle Burton
5,
Christopher Jones
5,
Richard Betts
5 and
Luiz Eduardo Oliveira e Cruz de Aragão
6,7
1
National Center for Monitoring and Early Warning of Natural Disasters, São José dos Campos 12247-016, Brazil
2
National Institute for Research in Amazonia, Manaus 69067-375, Brazil
3
Jet Propulsion Laboratory, California Institute of Technology, Pasadena, CA 91011, USA
4
Institute of Environment and Sustainability, University of California, Los Angeles, CA 90095, USA
5
Met Office Hadley Centre, Exeter EX1 3PB, UK
6
Earth Observation and Geoinformatics Division, National Institute for Space Research, São José dos Campos 12227-010, Brazil
7
Geography, University of Exeter, Exeter EX4 4PY, UK
*
Author to whom correspondence should be addressed.
Submission received: 21 October 2022 / Revised: 14 November 2022 / Accepted: 15 November 2022 / Published: 21 December 2022
(This article belongs to the Special Issue Vegetation Fires in South America)

Abstract

:
Land management and deforestation in tropical regions cause wildfires and forest degradation, leading to a loss of ecosystem services and global climate regulation. The objective of the study was to provide a comprehensive assessment of the spatial extent and patterns of burned areas in a new deforestation frontier in the Amazonas state. The methodology applied cross-referenced burned area data from 2003 to 2019 with climate, land cover, private properties and Protected Areas information and performed a series of statistical tests. The influence of the Multivariate ENSO Index (MEI) contributed to a decreasing rainfall anomalies trend and increasing temperature anomalies trend. This process intensified the dry season and increased the extent of annual natural vegetation affected by fires, reaching a peak of 681 km2 in 2019. The results showed that the increased deforestation trend occurred mostly in public lands, mainly after the new forest code, leading to an increase in fires from 66 to 84% in 2019. The methods developed here could identify fire extent, trends, and relationship with land cover change and climate, thus pointing to priority areas for preservation. The conclusion presented that policy decisions affecting the Amazon Forest must include estimates of fire risk and impact under current and projected future climates.

1. Introduction

Forests are important global climate regulators and provide essential environmental services, also known as “regulating” ecosystem services. The Amazon Forest is the largest tropical forest in the world and plays an important role in global climate regulation through both its stock of carbon and its provision of water vapor that is critical to rainfall in wide areas of South America [1]. Amazon forest fires can impact vegetation integrity and biodiversity [2,3,4,5], resulting in changes in the forest hydrological functions [6] and carbon storage [7,8,9,10,11,12,13]. Forest fire also causes economic losses and human respiratory diseases [14,15,16,17], and the cost of controlling fire with field brigades and aircraft is extremely high [18,19].
Natural fires in the Amazon Forest are rare events with return intervals of hundreds to thousands of years [20]. However, direct human impacts and climate change are greatly increasing the frequency and scale of forest fires in humid forests that were traditionally considered resistant to fire [8,21,22,23,24]. It is estimated that 58% of the Amazon is currently too wet to support fires and that climate change could reduce these areas to 37% by 2050 [25,26,27]. The increase in forest fires in the Amazon is directly related to extreme drought events [7,15,16,28], and these extremes can lead to a fire in regions where trees have thin bark and other characteristics making them more vulnerable to damage from fires [27,29,30,31]
Deforestation is a driver of forest fires in the Amazonian Forest because fire is used both to clear the land after felling the native forest and as a management tool in already-deforested land [32,33,34,35]. Fire usage for managing agriculture, and especially for controlling the encroachment of woody vegetation into cattle pasture, is the main source of ignition threatening adjacent forests. Although the forest is rarely intentionally burned, the flames next to the forest edges cause the burned area to expand into the forest [8,36]. Forest fragmentation creates a landscape that is susceptible to fire spread and, consequently, increases carbon emissions [9,11,37].
Recent studies on the spatial heterogeneity of fire [38] allow the definition of a fire season to indicate the periods with the highest occurrence of wildfires and their association with logging, deforestation, and rainfall [39]. The advances of new deforestation frontiers caused by infrastructure projects such as the reconstruction and paving of Highway BR-319 that connects Porto Velho to Manaus [21] can lead to fire spread and biodiversity loss in vast areas of the Amazon Forest. Among the measures needed for Amazon Forest preservation are the development and use of tools to understand fire dynamics so that strategies can be developed to mitigate fire and its socioenvironmental impacts. Data on a municipal scale allow for the identification of the most vulnerable areas and the recommendation of mitigating measures. This is especially important on frontiers in the ‘arc of deforestation’ such as in the southwest Amazon in the state of Amazonas, where much of the primary forest remains intact.
In this study, we provide a comprehensive assessment of the spatial extent and patterns of burned areas in a municipality in the southwestern Amazon, one of the emerging deforestation frontiers in Brazil’s state of Amazonas. Our objective is to answer four research questions: (1) What was the extent and what was trend of the burned area from 2003–2019? (2) How do rainfall and temperature anomalies contribute to the occurrence of fire? (3) What land-cover and land-tenure types are most susceptible to spreading fire? (4) How has deforestation influenced the spatial distribution of fire in the study region before and after the New Brazilian Forest Code?

2. Materials and Methods
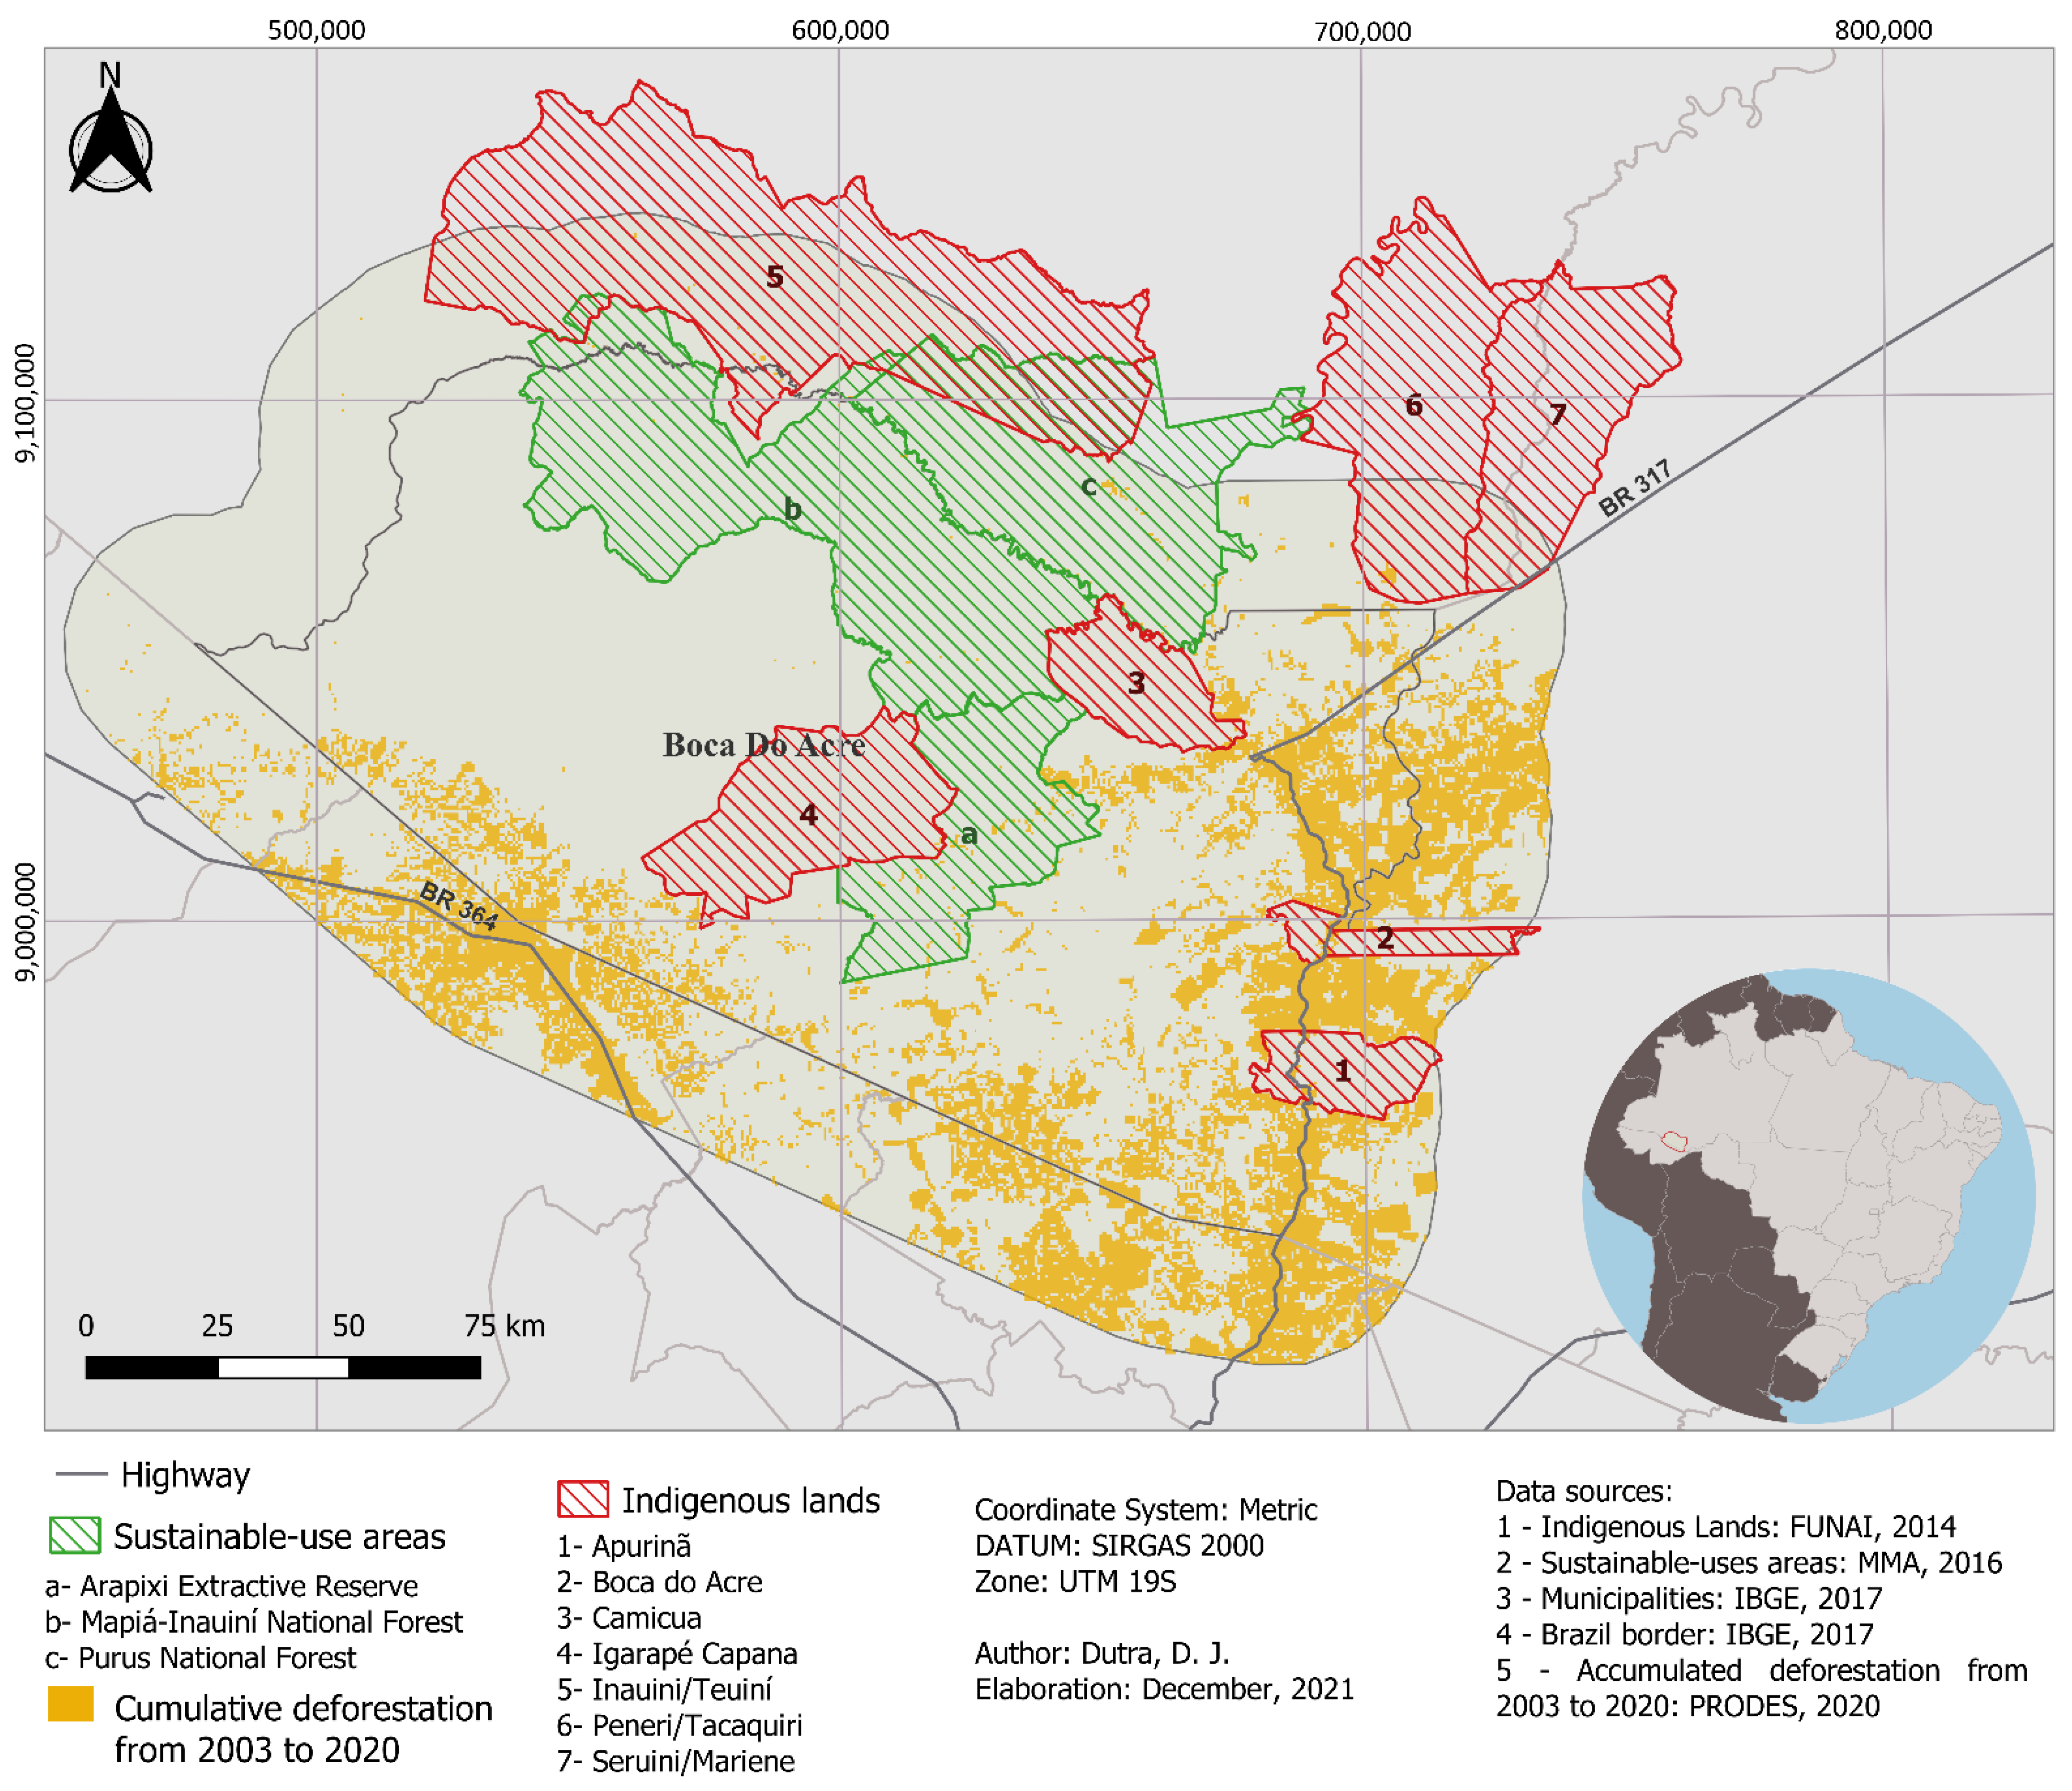
2.1. Study Area

The study region is located in southwestern Amazonia in the southwestern portion of Brazil’s state of Amazonas, covering the municipality of Boca do Acre plus a 25-km buffer surrounding the limits of the municipality (Figure 1). The total area of study includes parts of the municipalities of Paiuni (19.42%), Lábrea (5.42%), Acrelândia (1.91%), Senador Guiormard (16.16%), Porto Acre (79.01%), Bujari (28.18%), Sena Madureira (9.58%), and Manoel Urbano (13.68%) (Table S1—Supplementary Materials). The region includes the BR-317 and BR-364 highways and secondary roads [40].
The study region includes seven indigenous lands: Apurinã (1), Boca do Acre (2), Camicua (3), Igarapé Capana (4), Inauini/Teuiní (5), Peneri/Tacaquiri (6) and Seruini/Mariene (7). There are also three conservation units in the study region: the Arapixi Extractive Reserve (a), Mapiá-Inauiní (b), and thePurus National Forest (c). The vegetation cover is composed of dense rainforest, mosaics of oligotrophic woody vegetation (campinarana), and ecotone areas [41]. The region’s landscape is influenced by the expansion of urban areas, agriculture, and especially cattle ranching. The climate of the study region is Af (equatorial forest climate) in the Köppen classification system [42].

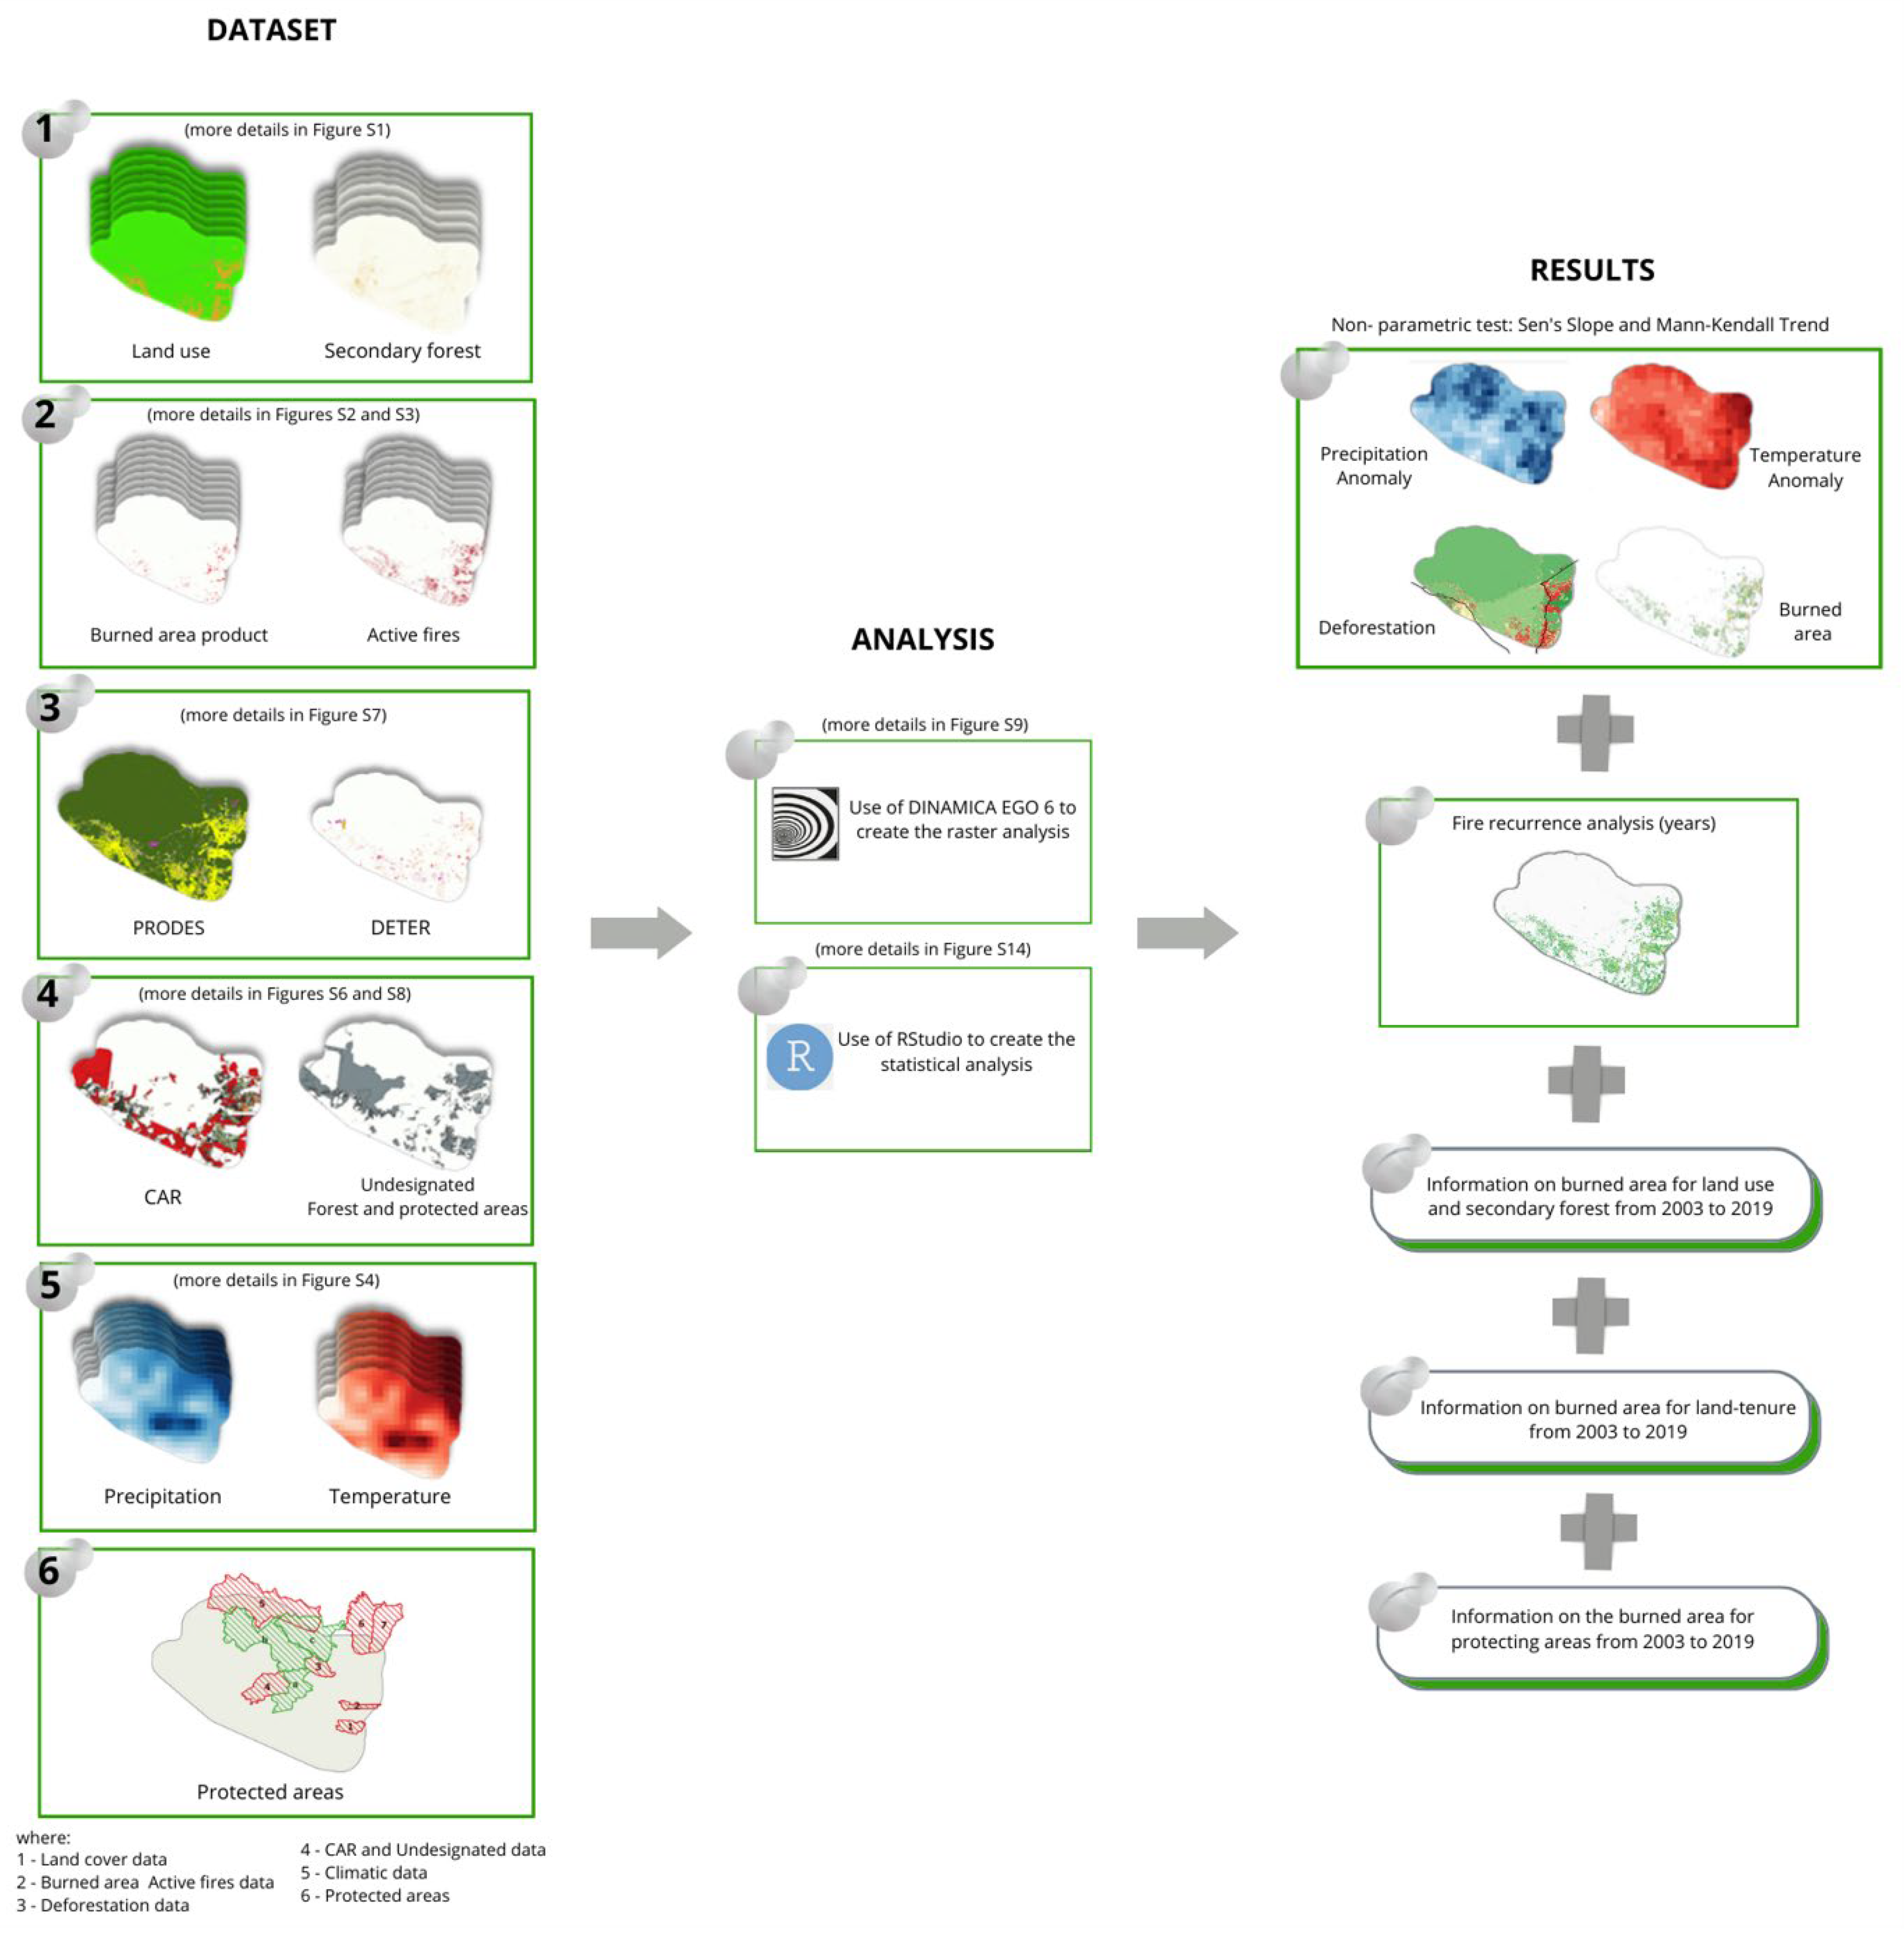
2.2. Methodology Process

We used maps of land cover (1), burned area and active fires (2), deforestation data (3), undesignated forest and the Rural Environment Registry (CAR, from Portuguese Cadastro Ambiental Rural) (4), climatic data (5), and protected areas (6) as inputs for the burned-area analysis. The spatial analyses were performed in Dinamica EGO 6 to identify the fire occurrence and extent in each dataset in the flowchart (Figure 2). We used RStudio for statistical analysis, which included the non-parametric Kendall trend test and Sen’s slope estimator for fire trends in the areas of fire occurrence.

2.3. Data

2.3.1. Land Cover Map

The land-cover and land-use data were derived from the MapBiomas Collection 5 product, covering the period from 2003 to 2019 [43,44] at 30 m spatial resolution. The time series were analyzed using the Google Earth Engine platform [45]. MapBiomas uses Landsat data processed by automatic image-classification techniques to identify the land-use transitions in each month of the year using statistical techniques and accuracy analysis [46]. The final result is an annual land cover and land-use map. We used secondary forest data [47] available on the Google Earth Engine platform, to analyze the increment, loss, and extent of secondary forests affected by fire in the study area. The combination of these data allowed us to analyze the following classes (Figure S1—Supplementary Materials):
  • Intact vegetation: old growth tropical forest;
  • Productive land: agricultural and pasture areas;
  • Deforestation: change from natural vegetation to productive areas
  • Regrowth: secondary forest [47].

2.3.2. Burned Area Map

We used a combination of annual burned-area products from the MCD64A1 [48], GABAM [49], and GWIS [50,51] projects from 2003 to 2019 (Figure S2—Supplementary Materials). First, we assessed the burned-area maps following the methods developed by Pessôa et al. [9]. These burned-area remote-sensing products have different spatial scales (Table S2—Supplementary Materials). Second, we applied the detection methodology developed by Pessôa et al. [9] and calculated the most significant products in order to build the burned-area product map (M1b in the Section S2.1 and Figure S2—Supplementary Materials). The detailed assessment is provided by Dutra et al. [52].

2.3.3. Active Fires

We used monthly data on active-fire pixels, from the BD Queimadas product (Figure S1—Supplementary Materials) for the period between January 2003 and December 2019 to support the assessment carried out from the burn-scar products and to characterize the temporal pattern of fire occurrence. The BD Queimadas product, which is currently at version 4.0, has been developed by the National Institute for Space Research (INPE) burned-area program, which detects thermal anomalies as a metric for active fires derived from the following satellites: Terra, Aqua, NOAA, GOES, TRMM, NPP and ATSR [53]. We used the Terra and Aqua active-fire pixel data from the BD Queimadas product in all temporal analyses (Figure S3—Supplementary Materials).

2.3.4. Climatic Data

We used monthly rainfall and air temperature data from the ERA products [54], with monthly temporal resolution for the period between January 2003 and December 2019 to support the climate analyses (Figure S4—Supplementary Materials). We evaluated the seasonality of rainfall and temperature (Figures S5 and S6—Supplementary Materials) to identify dry seasons for association with fire occurrence. We defined the dry season as the period of consecutive months with monthly rainfall below 100 mm. This threshold refers to average monthly forest evapotranspiration and thus indicates the months when the forest is under water stress [55,56], and are thus more susceptible to wildfires. We used descriptive statistics for the entire time series to analyze the behavior of the data during the dry and rainy periods.

2.3.5. Land-Tenure Data

The Rural Environmental Registry (CAR)

We used data from the Rural Environmental Registry (Cadastro Ambiental Rural, or “CAR”) [57] to analyze the anthropogenic influence on forest loss in the study region from 2012 to 2019 (Figure S7—Supplementary Materials). The data showed that the land holdings reported in the database frequently overlapped, making it necessary to identify these areas in the vector files. For this, we implemented the adjustments to rural land holdings, created by Freitas et al. [58], which use public land-use data and apply a geostatistical filter to remove the duplicated information and overlaps in the CAR vectorization process. These adjustments are important, because the uncertainties about land tenure in the Amazon make it difficult to conduct spatial analyzes and to create government policies for sustainable development in the region [59].
The CAR data yield polygons representing what are called “rural private properties” in Brazil, or simply “properties,” but we emphasize that this euphemism is a misnomer, as the term “properties” implies that these land areas have legal owners. This is often not the case in Amazonia, where the illegal invasion of public land by “land grabbers” (grileiros) is common. These actors claim large areas of government land and often eventually gain title through corrupt means. Whether or not they gain a title, they usually subdivide the claim and sell the land to cattle ranchers or other actors. Note that the meaning of the English-language term “land grabbers” as used in the literature on Amazonia is different from that in Africa and Asia, where “land grabbing” refers to the purchase of farmland by foreign interests for planting export crops, often leaving the local population with neither employment nor basic foodstuffs.
The classification of rural areas into small, medium and large landholdings was accomplished by the rules of the National Institute for Colonization and Agrarian Reform (INCRA) [60], which classifies “rural properties” according to the size of the landholding expressed as the number of “fiscal modules,” which in the municipality of Boca do Acre is 100 ha (Table S4—Supplementary Materials), where the following definitions apply:
  • Small properties: rural property with an area of less than 4 fiscal modules;
  • Medium properties: rural property with an area between 4 to 15 fiscal modules; and
  • Large property: rural property with an area greater than 15 fiscal modules.

Deforestation Data

We used PRODES and DETER data obtained through the TerraBrasilis platform [61] (Figure S8—Supplementary Materials) to observe fire occurrence in deforested areas within “rural properties” to identify two situations:
  • New deforestation: areas with the recent removal of vegetation cover delimited to DETER project [61]; and
  • Old deforestation: areas with agriculture, pasture, and secondary forest, i.e., consolidated areas not delimited by DETER project and classified as non-forest by PRODES [61].

Undesignated Forest and Protect Areas

We used data on “undesignated forest” [62] to observe the influence of rural properties on fire occurrence (Figure S9—Supplementary Materials). “Undesignated forest” (“florestas não destinadas”) and “undesignated public land” (“terras públicas não destinadas”), popularly known as “vacant land” (“terras devolutas”), are terms referring to government land that has not been assigned to a specific use, such as a conservation unit, an indigenous land or a settlement project. This land category is the most vulnerable to invasion by land grabbers, squatters, and other actors. We used data on protected areas (indigenous lands [63] and conservation units [64]) to observe fire occurrence in these land categories.

2.4. Raster Analysis

We used the Google Earth Engine platform [45] to access ERA 5 [54], secondary forest data [47], and burned area products [49] for the study region. The analysis of burned area was carried out using the Dinamica-EGO 6 platform [65] through the application of a “functor” (a tool in Dinamica-EGO software) that selects the intersection of the data layers according to the objective (Section S2 and Figure S10—Supplementary Materials).

2.5. Statistical Analysis

We used R software 4.2.1 [66] and QGis 3.16.5 [67] in order to perform the tabulation of active-fire pixels in each raster type, including trend analysis and regression (Figure S14—Supplementary Materials). The first step of the analysis was the calculation of descriptive statistics including the average, maximum and minimum values, standard deviation, and variance of the data. In these analyses, we adopted a 5% significance level (p ≤ 0.05). We also applied two robust non-parametric methods that are not particularly sensitive to discrepant data, the Mann–Kendall test [68,69] and the Sen’s Slope estimator [70]. We adjusted the script of Silva Junior et al. [71] using the ‘wql’ package [72] in raster analyses and we used the ‘Kendall’ package [73] in the table analyses in R to process the trend analyses

2.6. Anomaly Calculation
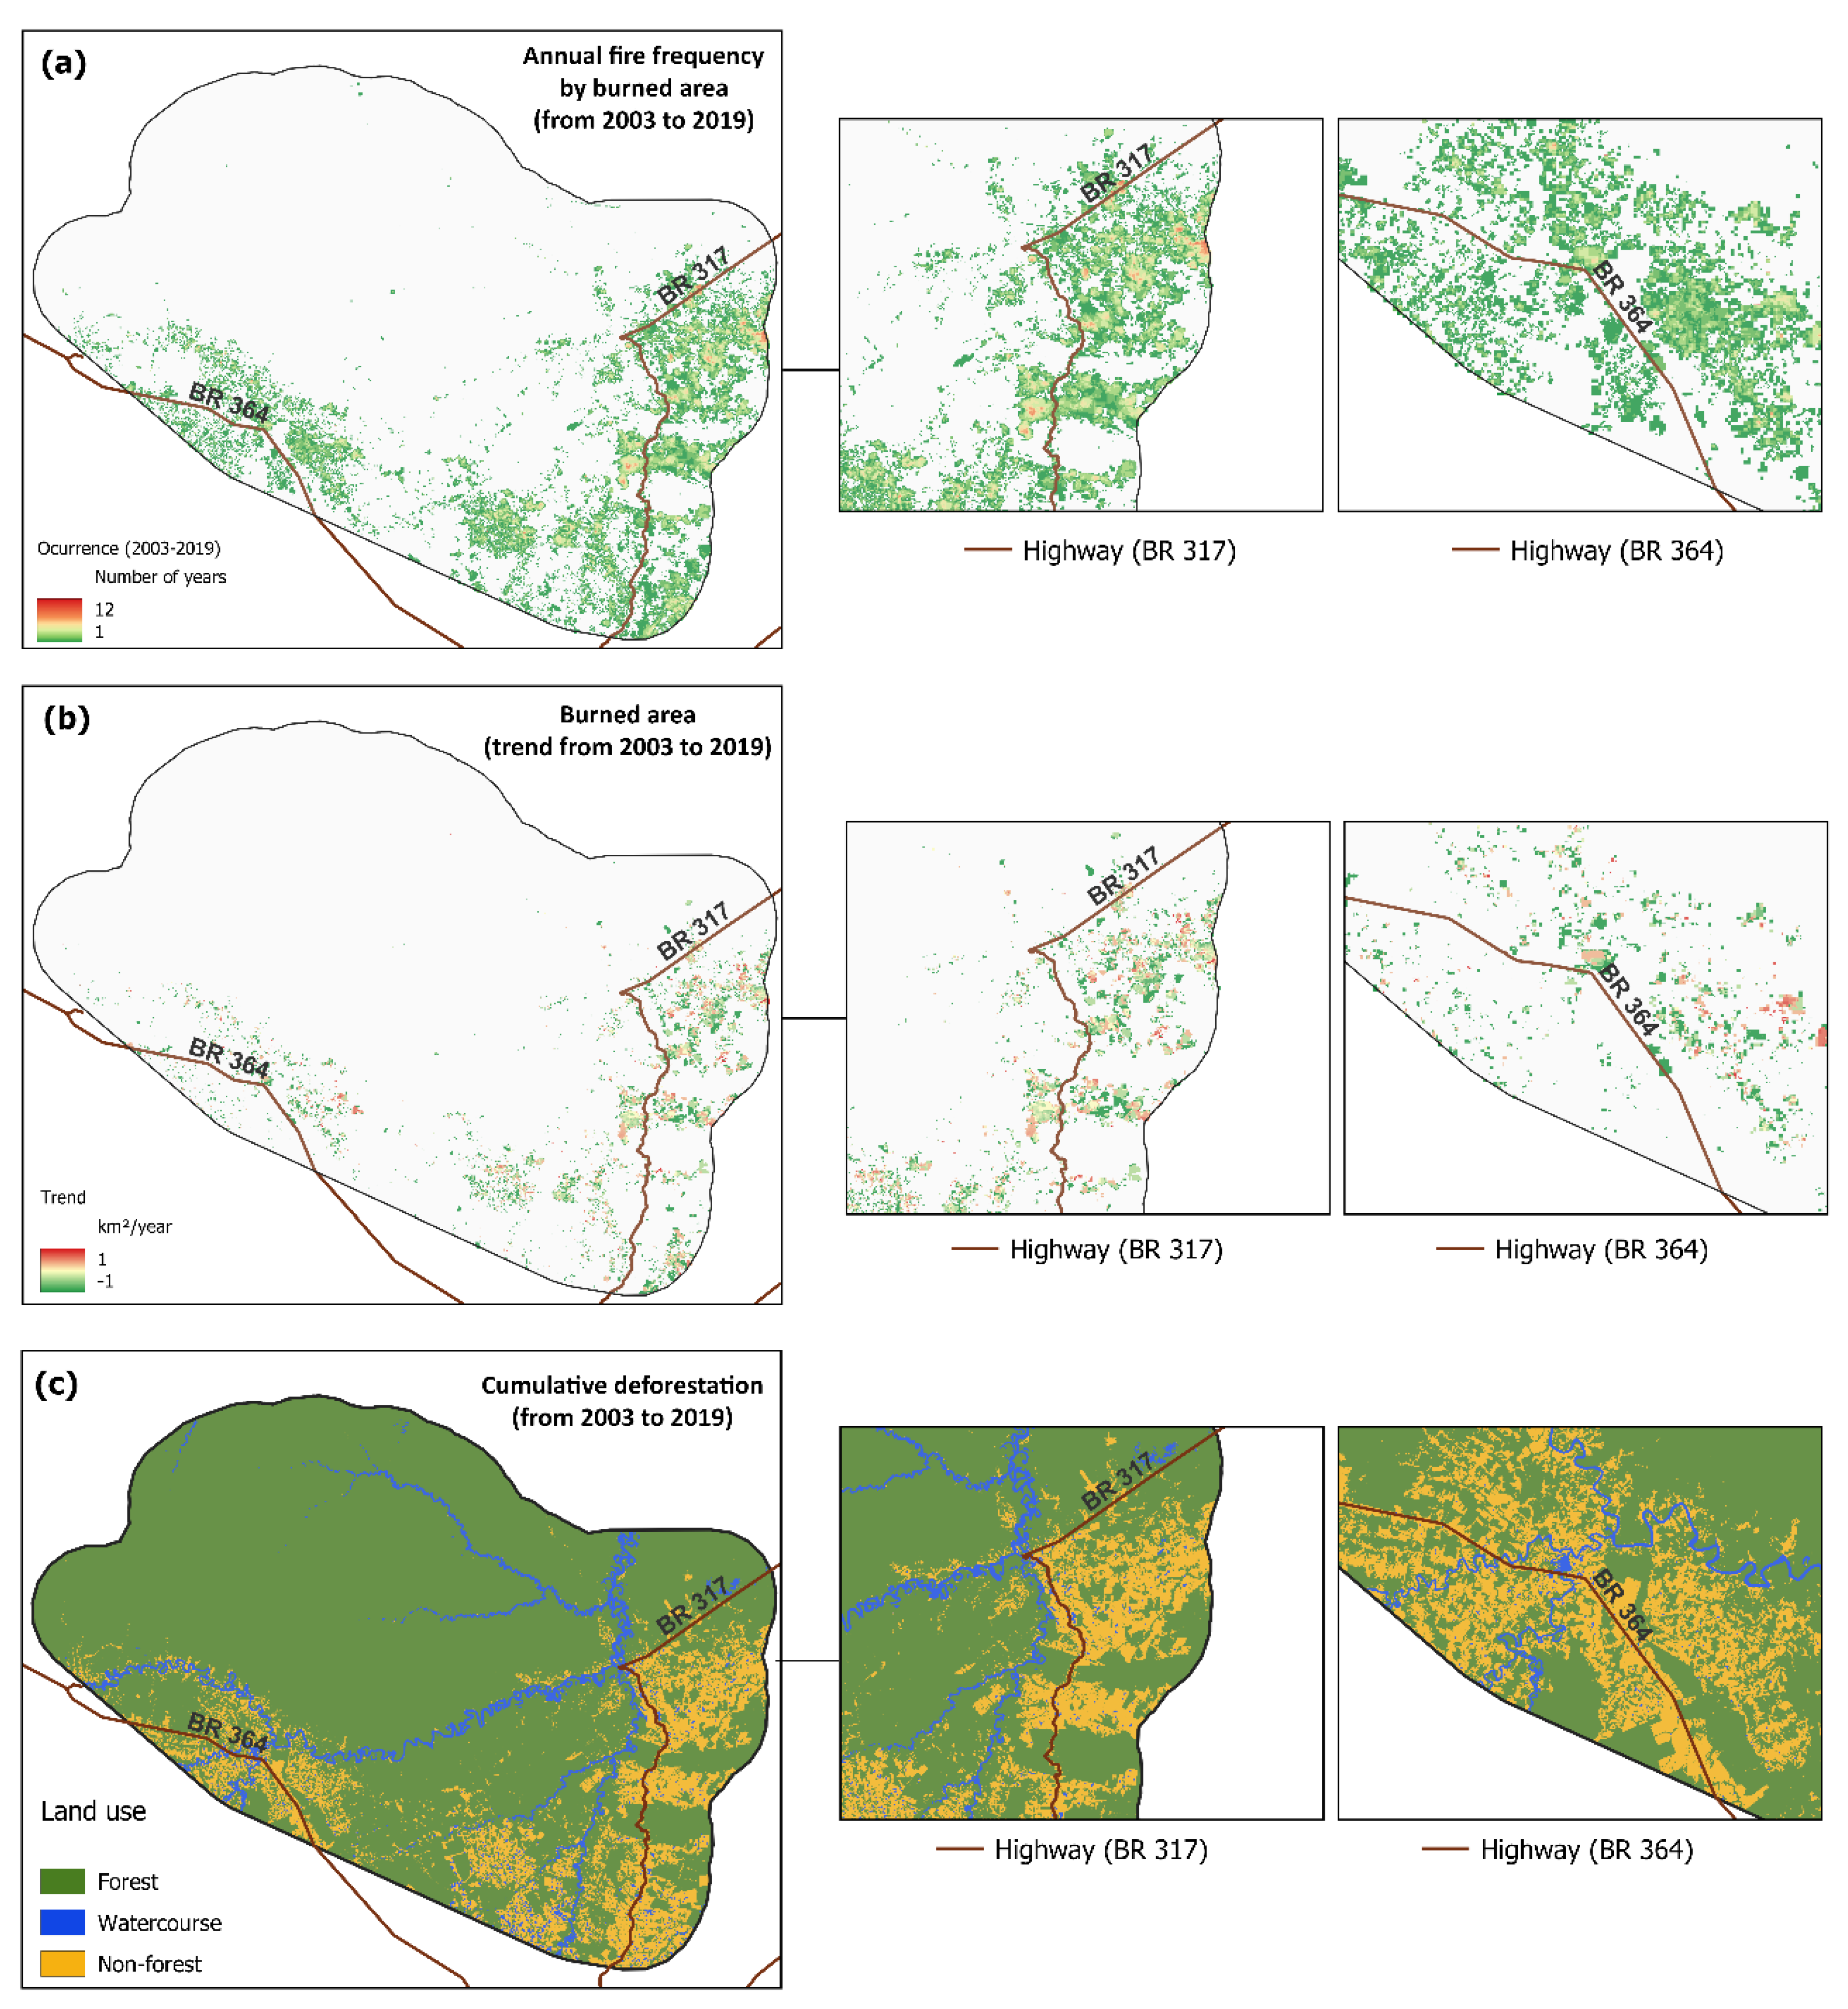
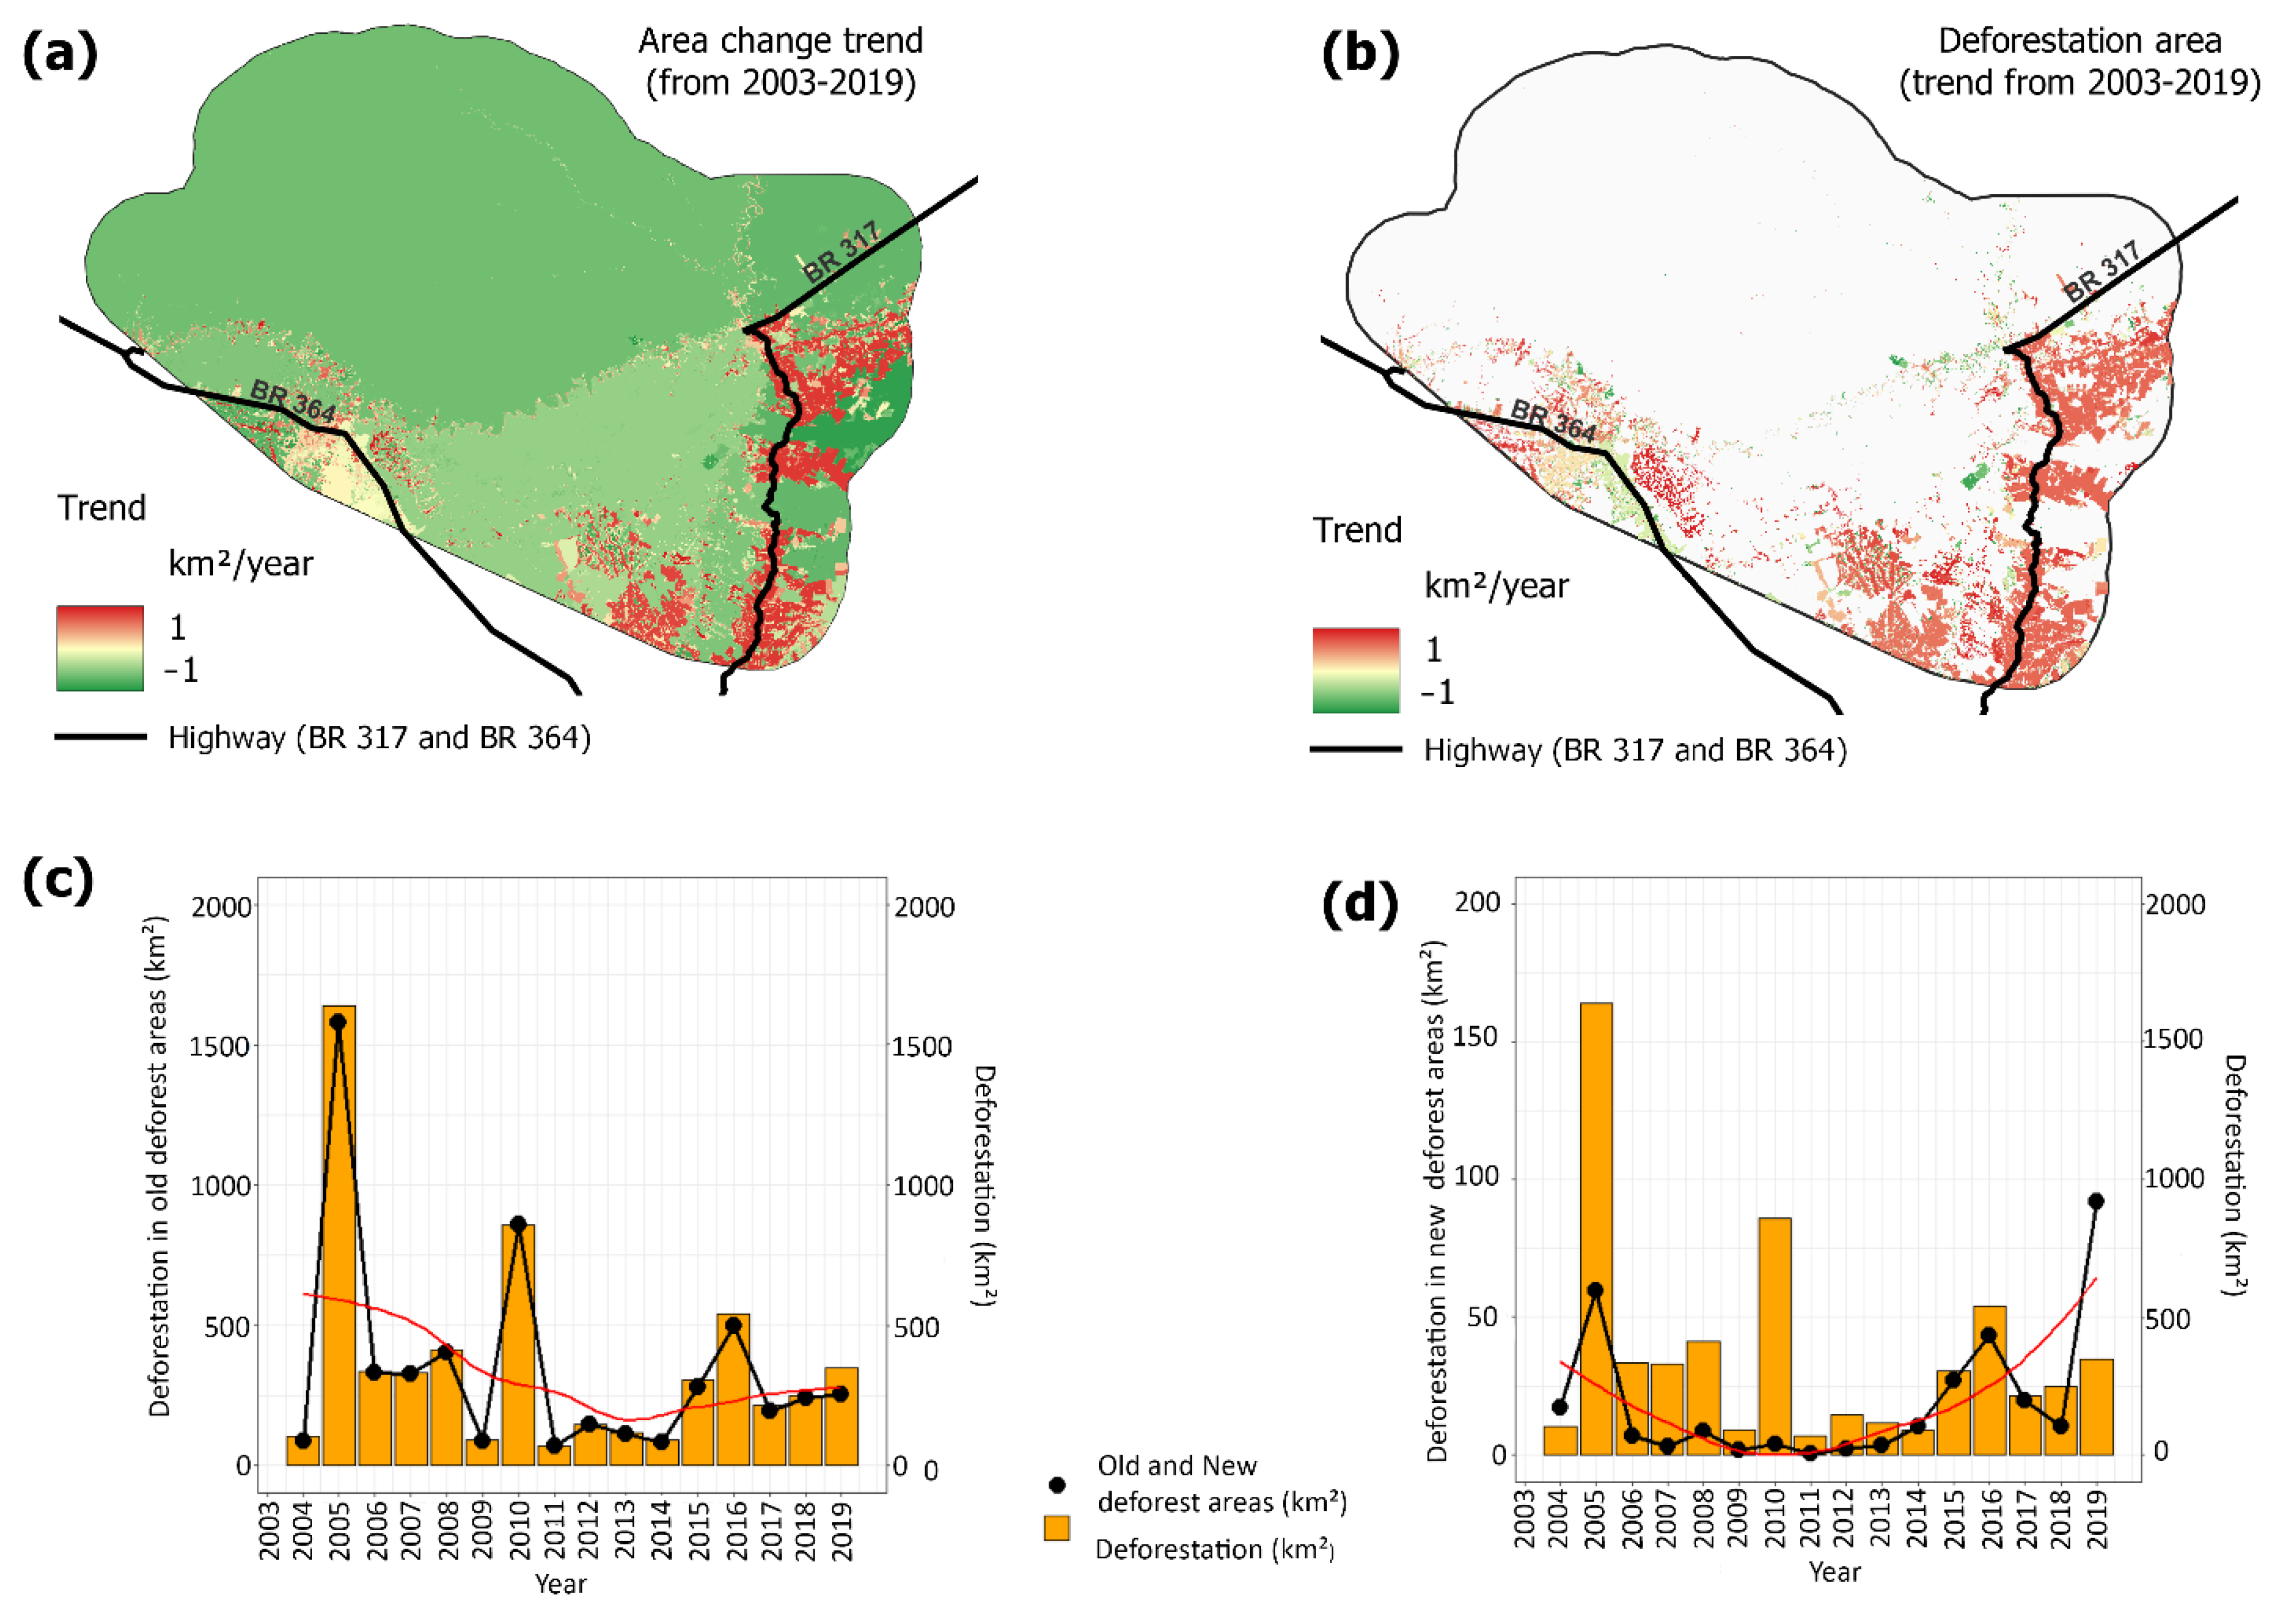
We analyzed the trend in the time series and found that the results were not significant for the temperature and rainfall variables in the years in question. Therefore, we generated rainfall and temperature anomalies to identify the relationships between fire and extremes in the meteorological data [74] (Equation (1)). The analyses were carried out spatially and graphically to show the annual averages of anomalies for the entire study period (2003–2019).
A y e a r = n = 1 Y e a r P a P ¯   S d
where P(a) indicates the annual data for a variable (precipitation or temperature), P ¯ indicates the average annual value of the variable in the study series, and Sd indicates the standard deviation of the annual average.
Significant anomalies were identified when their values was greater than 1.96 (positive) or less than −0.96 (negative) [75]. We performed the analysis of rainfall and temperature anomalies in the study region to allow us to identify characteristics of the Atlantic Multidecadal Oscillation or Atlantic Meridional Overturning (AMO) and the Multivariate ENSO Index (MEI) over the analyzed period (2003–2019).

3. Results

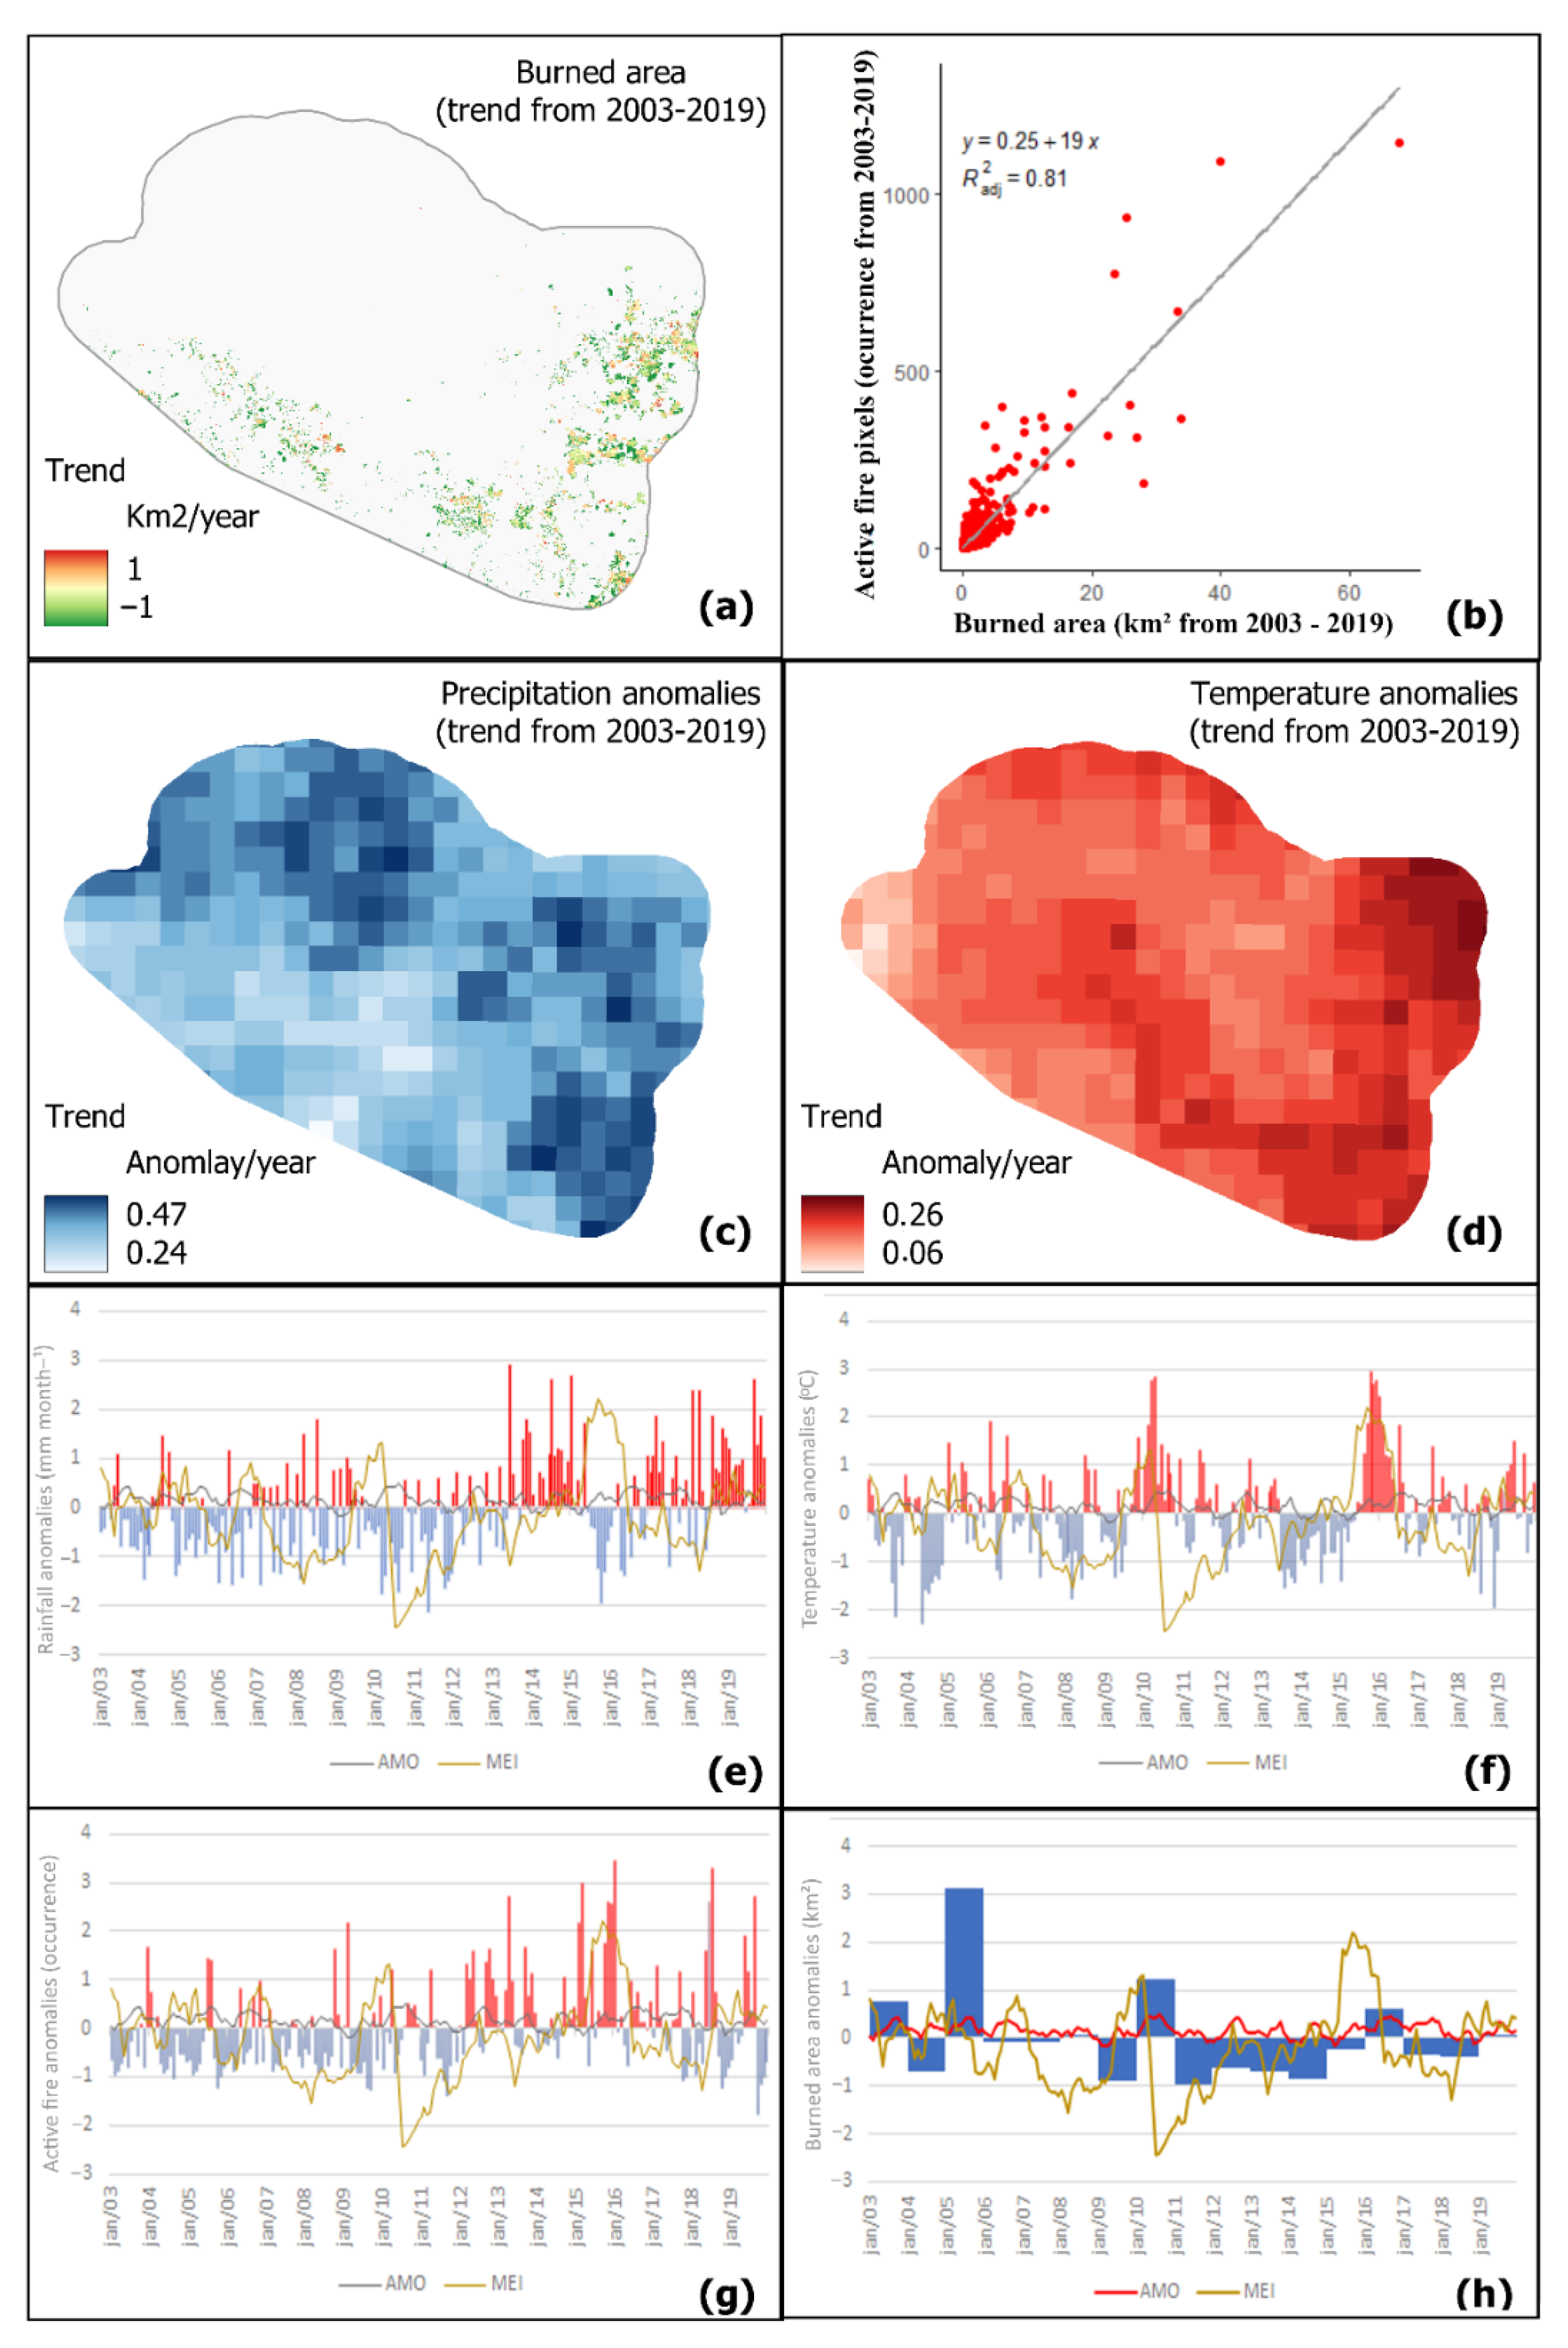
3.1. Relationships between Climatic Anomalies and the Extent of Burned Areas

We identified the trend of significant increase (p < 0.05) in burned area in the period from 2003 to 2019, concentrated in the eastern and southwestern portions of the study region (Figure 3a). In this period, 6,050,956 km2 burned at least once, and there was a directly proportional relationship (R2ajd = 0.81, p < 0.05) with the number of active fire pixels, where regions with a larger regional extent of burned area have a greater number of hotspots (Figure 3b).
The study region had an average monthly temperature of 25.53 °C ( ± 0.823) and rainfall of 176.24 mm ( ± 108.85) from 2003 to 2019. The months from June to August were identified as those with the highest occurrence of active-fire pixels as a result of lower rainfall (dry seasons), with a mean variation of 31.68 to 62.27 mm month−1 ( ± 22.03 to 33.247), and higher temperature, with mean values of 24.63 to 26.25 °C ( ± 0.59 to 0.89), (Figure S16—Supplementary Materials).
In the eastern portion of the study region, where there was a significant trend of increasing the burned area, we observed the same positive trend in rainfall and temperature anomalies and the same concentration of these values within each year from 2003 to 2019 (Figure 3c,d). When specifying the analysis for monthly periods in the study region (Figure 2e–h), we found that the AMO showed a smaller variation and the MEI a higher variation in the period from 2009 to 2010 (AMO values between −0.18 to 0.51, with Kendall’s tau = 0.485 to 0.152, and MEI values between −2.43 and 1.31with Kendall’s tau = 0.879 to −0.455) and in the period from 2015 to 2016 (AMO values between −0.146 and 0.439, with Kendall’s tau = 0.727 to 0.424, and MEI values between −0.51 and 1.94 with Kendall’s tau = 0.697 to −0.769).
From 2010 to 2011, the MEI showed a lower variation with negative values of the index (decreasing curve trend from Kendall’s tau = −0.455 to 0.394). In years when the MEI was stronger, we identified the presence of a positive trend in the temperature anomaly values (p < 0.05) in the summer months of 2015–2016, for example, October 2015 (anomaly value = 1.73) and January 2016 (anomaly value = 3.43), and in the autumn months of 2010, for example, April (anomaly value = 1.19) (Figure 3f). In months with positive anomalies in temperature values, we observed increases in positive anomalies in active-fire pixels, especially in 2015. Regarding rainfall, we observed positive anomalies in the occurrence of active-fire pixels before or after negative rainfall anomalies in the periods with stronger MEI.
The trend and the AMO/MEI values favored drought periods and contributed to the decreasing trend of rainfall anomalies in the study region (Kendall’s tau = −0.152 to 0.091 in 2009–2010 and Kendall’s tau = −0.727 to 0.152 in 2015–2016) and increasing trend of temperature anomalies (Kendall’s tau = 0.394 to −0.392 in 2009–2010 and Kendall’s tau = 0.879 to −0.545 in 2015–2016), (Figure 3e,f). We found that rainfall and temperature had a relation to fire, where years with a decrease in rainfall and an increase in temperature, favored increased positive burned area anomaly values (−0.889 to 1.203 in 2009–2010 and −0.212 to 0.601 in 2015–2016) and increased active fire pixels (Kendall’s tau = −0.030 to 0.394 in 2009–2010, and Kendall’s tau = 0.182 to −0.061 in 2015–2016).

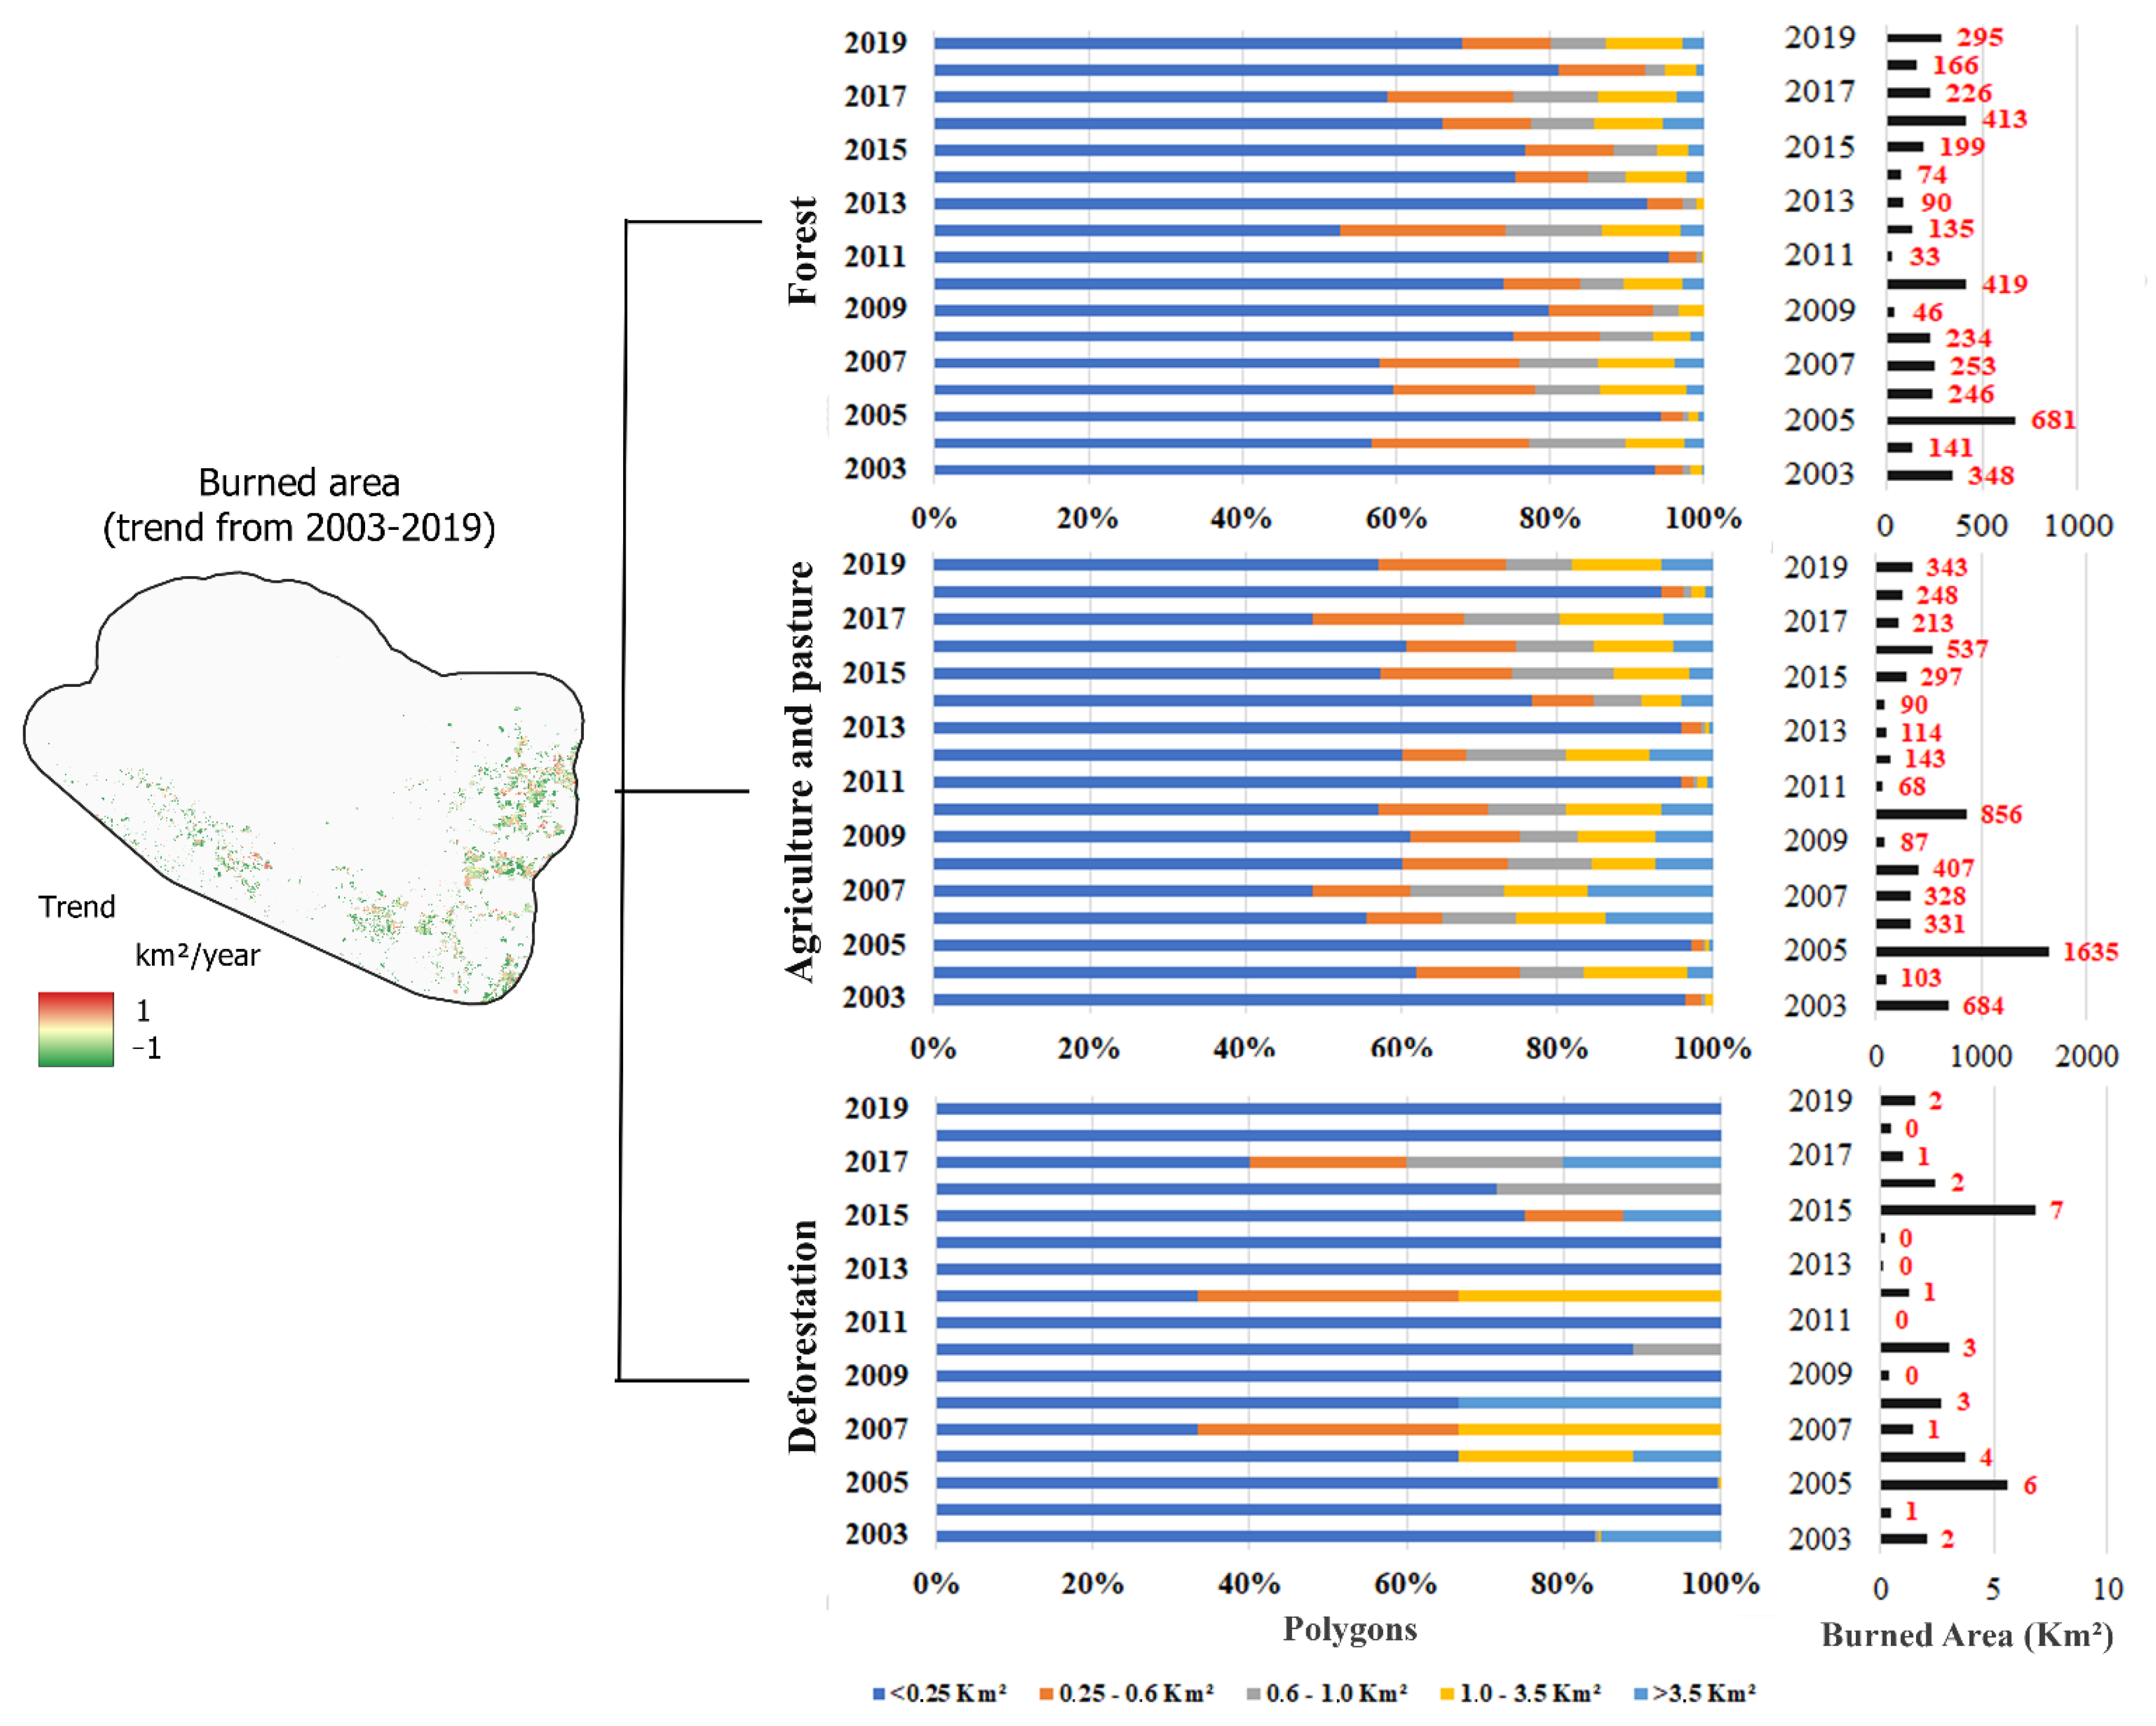
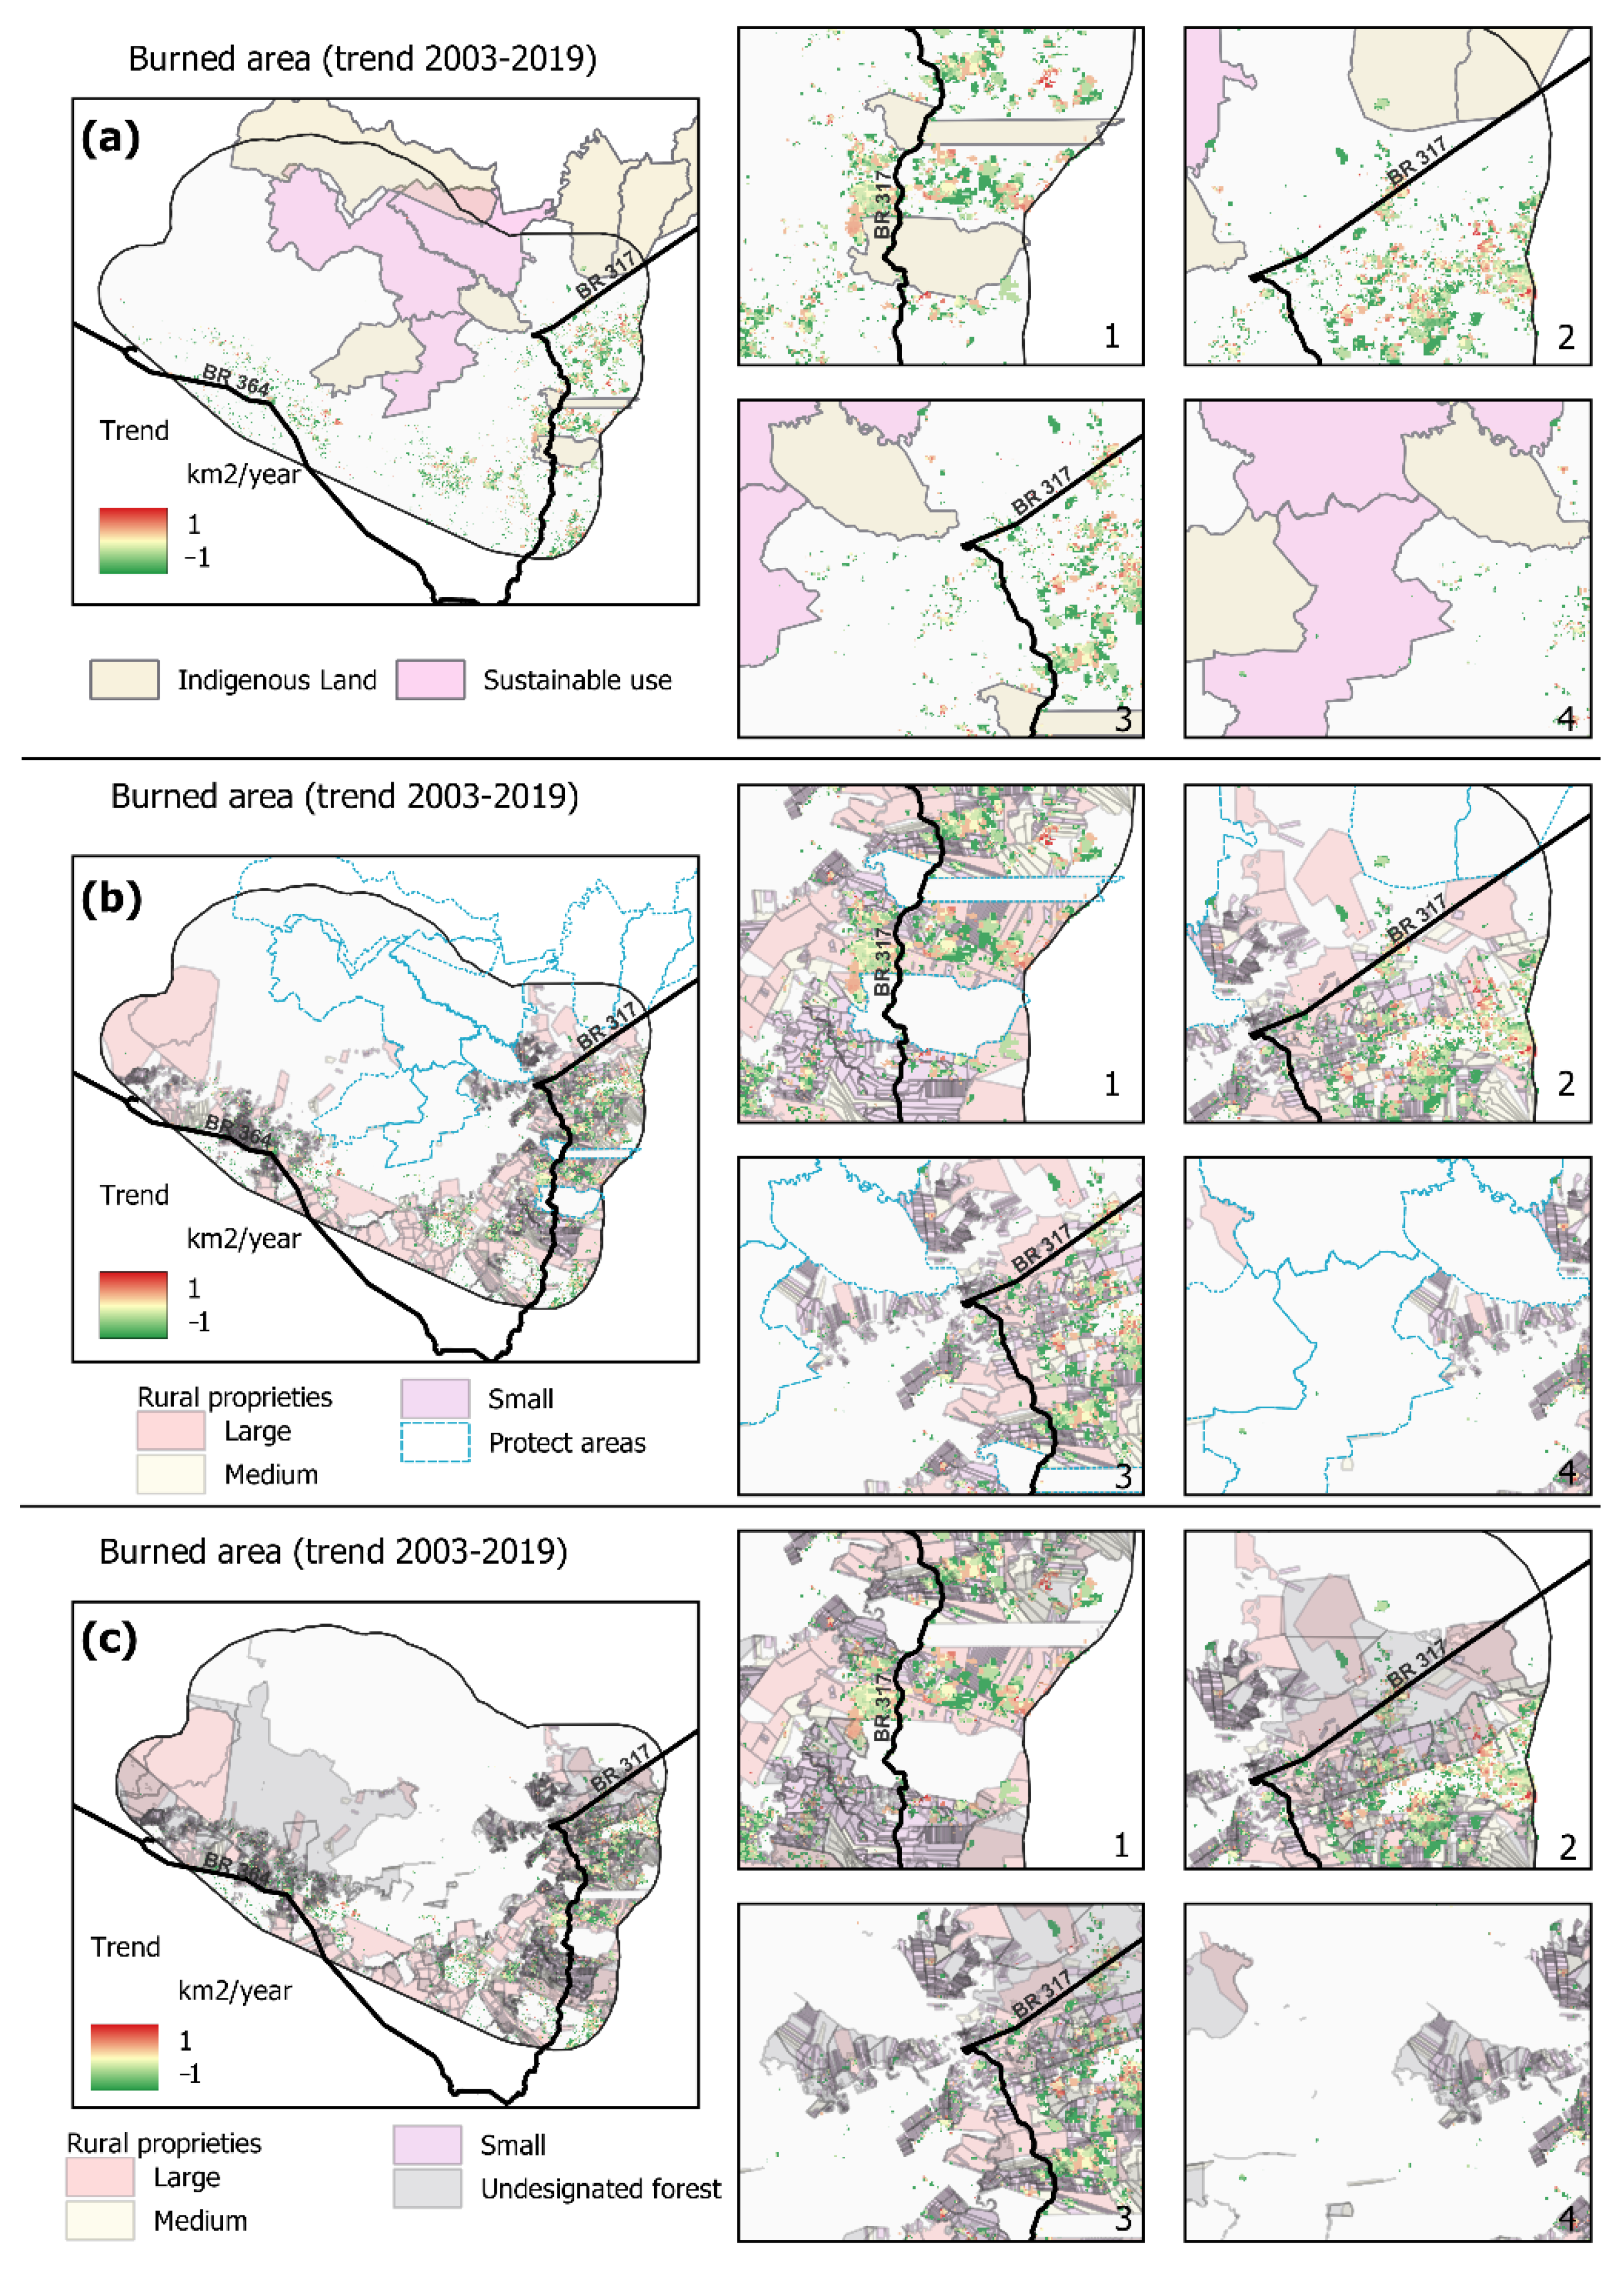
3.2. Fire by Land-Use Type

Each year, fires affected 0.092 to 1.86% of the total native vegetation in the study region in the period from 2003 to 2019 (with a decreasing trend for Kendall’s tau = −0.985 to lost vegetation). The fires affected a total of 3999 km2 of the old growth forest throughout this period (with annual totals ranging from 33 to 681 km2) and affected a total of 142.15 km2 of secondary forest (with annual totals ranging from 0.66 to 25.49 km2). In addition, a total of 6484 km2 of the area in pasture and agriculture burned over the 2003–2019 period (with annual totals ranging from 68 to 1635 km2, or 1.39 to 40.39% of the land in these uses) (Table S5—Supplementary Materials).
Human-altered land covers, such as urban areas, had 36.94 km2 of burning over the period (with annual totals ranging from 0.33 to 5.63 km2). A total of 32.57 km2 of secondary forest was lost over the period (with annual totals ranging from 0.09 to 9.35 km2) and there was 17.77 km2 of secondary forest increment (with annual totals ranging from 0.07 to 2.62 km2). We found very high occurrence rates of small (<0.25 km2) burned areas, especially in forests and in agriculture and pasture areas (Figure 4). These categories had the largest burned areas, with the areas doubling or tripling in extent as compared to the previous year in forest areas, as in the transitions from 2004 to 2005 (+540 km2), 2009 to 2010 (+373 km2), and 2015 to 2016 (+214 km2). In agriculture and pasture areas, we observed the same pattern of increase in burned areas for the periods 2004–2005 (+1532 km2), 2009–2010 (+769 km2), and 2015–2016 (+240 km2).
We observed that the increases in burned areas may be associated with rainfall and temperature anomalies, together with the behavior of the analyzed AMO and MEI data (Figure 3e–h). The analysis showed that the intensity of the MEI in the study region favors the increase of burned areas in the forest and agriculture and pasture regions (Figure 4). The changes in the AMO and MEI index values affect the incidence of rain (causing negative anomalies) and cause an increase in temperatures (positive anomalies), favoring the occurrence of active fires and burned areas.
The recurrence of fire in the same pixel ranged from 1 to 12 times over the 17 years studied and the positive trend in the burned area was concentrated adjacent to deforested areas (Figure 5). We observed a high recurrence of fire mainly in areas next to the highways (BR-317 and BR-364) and their associated side roads, these are in agricultural and pasture areas, located in the eastern part of the municipality. These areas had a greater tendency to burn, while in other parts of the study region the fire recurrence time was 1 to 5 years. Regarding land-use type, the fires affected, at least once, 68% (3936 km2) of the agriculture and pasture area, demonstrating an intense use of fire in land management. The study period was characterized by a small amount of fire occurrence, corresponding to 0.01% of the burned area and 11.05% (25 km2) of the deforested area (Figure S18—Supplementary Materials).

3.3. Deforestation Fire

The positive trends in deforestation (Kendall’s tau = 0.985) in the study regions concentrated in the same regions as the positive trends of burned area (east and southwest, Figure 1a) from 2003 to 2019 (Figure 6a). The deforestation occurs next to the highways and existing agriculture and pasture areas. The area near Highway BR-317 is especially affected, with the tendency for deforestation to be stronger than in the case of BR-364 (Figure 6b).
The results showed that the relation between fire occurrence and deforestation was weaker in the period from 2003 to 2011, due to relatively low deforestation rates in the study region during this period; however, fire is used for agricultural and pasture management in already-deforested areas irrespective of the deforestation rate. After 2009, the fire was strongly related to annual deforestation in the study region, indicating the expansion of the slash-and-burn process, with fire exacerbated by droughts. We observed an increase in the area deforested per year and in the number of active-fire pixels in the period from 2012 to 2019, mainly in 2019 (2.354 active-fire pixels/km2 deforested), 2018 (1.323 active-fire pixels km2 deforested), 2017 (0.977 active fire pixels/km2 deforested) and 2016 (1.632 active-fire pixels km2 deforested). Between 2003 and 2011, 39,291.33km2 was deforested and 20,394 active-fire pixels were recorded in the study region (Figure S17—Supplementary Materials). Thus, while there was a general increase in the rates of deforestation between 2003 and 2019, the deforestation rates between 2012 and 2019 were substantially larger and were correlated with an increase in the number of active fires.
We found that most of the burned polygons were located in areas that had been previously deforested (5532.52 km2), i.e., these fires generally represented managed burning for agriculture and especially for pasture. In these areas, the years 2005 (1581.26 km2, or 96.36%), 2010 (855.97 km2, or 99.53%), and 2016 (496.93 km2, or 91.98%) had the highest numbers of active-fire pixels in deforested areas. In addition, the years 2005 (59.74 km2, or 16.38%) and 2016 (43.29 km2, or 8.02%) also had the highest amounts of new deforestation, indicating the burning of felled native forests. In contrast with the other periods, 2019 was the year with the greatest occurrence of fires in new areas of deforestation (91.90 km2, or 26.62%) compared to previous years (Figure 5c,d). This demonstrates an expansion of burned areas in the forest.
We observed a stronger tendency for burn areas to occur in indigenous land than in conservation units from 2003 to 2019, mainly in areas in the eastern portion of the study region (Apurinã and Boca do Acre Indigenous Lands), (Figure 7a). The result showed that protected areas (indigenous land and conservation units) are a barrier to a positive trend of burned area occurrence in the study region, but Highway BR-317 caused a stronger tendency for fire occurrence in regions next to the protected areas (Figure 7(a1–4)). We also found that the same regions with a positive trend for fire occurrence next to the Apurinã and Boca do Acre Indigenous Lands are “rural proprieties” registered in the CAR (Figure 6b). This shows that presence of “rural proprieties” influences the deforestation trend (Figure 6a,b) and the increase of the trend and the frequency of burned area (Figure 5a,b). In addition, we detected the expansion of “rural proprieties” being registered in the undesignated forest (Figure 7c). These processes increased the burned area trend from 2003 to 2019 and demonstrate the threat to undesignated forests posed by deforestation and burning.
A total area of 189.13 km2, corresponding to 1.37% of the protected areas, was burned at least once from 2003 to 2019 (Figure S18—Supplementary Materials). Out of the total burned area, 145.11 km2 (73.73%) was in indigenous land, and 44.02 km2 (23.27%) was in sustainable-use conservation units (Figure S20—Supplementary Materials). Fire occurrence was concentrated in indigenous lands, especially in the Boca do Acre Indigenous Land (40.47 km2, positive trend with Kendall’s tau = 0.081) and the Apurinã Indigenous Land (52.81 km2, positive trend with Kendall’s tau = 0.075), totaling 93.28 km2 burned in indigenous lands during the time series. In the sustainable-use protected areas, 0.51% of the area was burned (44.03 km2), mainly in the Purus National Forest (17.19 km2; positive trend with Kendall’s tau = 0.360) and in the Arapixi Extractive Reserve (24.79 km2, positive trend, with Kendall’s tau = 0.0001), (Figure S21—Supplementary Materials). Fires burned over 2877.95 km2 in “rural properties” in the study region. Of the burned area in “rural properties”, 39.55% (1138.34 km2) occurred in large “properties,” 18.16% (522.71 km2) in medium, and 42.28% (1216.89 km2) in small “properties” (Figure S22 in the Supplementary Materials). Despite the high concentration of fires in large and small “properties,” fires occurred more in medium (15.12%) and small (23.33%) “properties” as compared to large “properties” (6.55%) (Figure S23—Supplementary Materials).
After the new Brazilian Forest Code, implemented in 2012, 1907.62 km2 burned in areas that were converted to agriculture or pasture in areas registered as rural properties. We found that most of this loss occurred in the large “properties” (634.73 km2; positive trend, with Kendall’s tau = 0.643) and small “properties” (980.50 km2; positive trend, with Kendall’s tau = 0.429) with the years 2016 (large = 67.57 km2; small = 104.18 km2) and 2019 (large = 65.42 km2; small = 80.33 km2) showing the greatest losses of the forest. In the period from 2012 to 2019 between 15.34% and 91.60% of the new deforestation occurred in “rural properties” (Figure S24—Supplementary Materials). This indicates that these areas have been responsible for the loss of 308.17 km2 of forest in the study region. The greatest losses occurred in 2019 (41.39 km2) and 2016 (25.54 km2). Fire occurrence in legal reserves (1219.93 km2; positive trend, with Kendall’s tau = 0.500) and permanent preservation areas (69.74 km2; positive trend, with Kendall’s tau = 0.357) (Figure 8a). In the legal reserves, the burned areas varied from 53.53 to 298.93 km2 during the study period (2012–2019). In the permanent preservation areas, the annual burned area ranged from 2.78 to 19.60 km2.
We identified an invasion by “rural properties” in the areas delimited as “undesignated forest” by the Brazilian government (positive trend with Kendall’s tau = 0.191), (Figure S21—Supplementary Materials). We observed a rapid and continuing growth of the annual burned area in the undesignated forest after the implementation of the Rural Environmental Registry (CAR) in 2012, with fires in forest areas increasing by 66% (2012) to 84% (2019) (Figure 8b). In this period, the years 2019 (209 km2), 2016 (140 km2), and 2017 (116 km2) had the highest amounts of undesignated forest burned in these illegal “rural properties.” This is due to an increase in fire occurrence in these areas.

4. Discussion

The results made it possible to identify the interrelationship between the topics analyzed in the study. We note the importance of preserving conservation units, indigenous lands, and undesignated forests as a way to stop the advance of emerging deforestation in the study area. Deforested regions showed higher occurrences of burned areas in the time series, especially when associated with agricultural and livestock activities. In addition, temporal factors such as the dry season or extreme events (AMO and MEI) influence the rainy season and make the region suitable for the spread of anthropogenic fire [12,76,77,78]. We found that forest fires occurred adjacent to previously deforested areas, which contributes to fire spread since the accumulation of organic matter from deforestation serves as fuel for the spread of fire associated with management [11,79].

4.1. Influence of Extreme Events on the Occurrence of Burned Area

Our results showed a significant increasing trend in the burned area in the eastern and southwestern portions of the study region. In addition, we observed that the dry season (June to August) increases the number of hotspots and burned areas in the study region. External factors, such as the increase in rainfall and temperature anomaly trends, together with the influence of MEI, also influenced fire extent in the study region.
We identified the effect of MEI events in the study region, mainly in 2015–2016 [80], which presented critical values of temperature and active-fire pixel anomalies and a decrease in rainfall (Figure 2e–h). Burning is associated with droughts [39] and occurs during the annual dry season, defined as months with rainfall below 100 mm [81].
Large-scale climatic events affect rainfall in South America, especially in the Amazon region, where alterations in the hydrological cycle affect other parts of Brazil. In years when these events occur, changes in atmospheric circulation alter rainfall patterns in much of the continent [80]. Our results highlighted the growing occurrence of fires during years with low rainfall values and high temperatures in the study region, especially in MEI years.
Sometimes MEI occurrences coincided with El Niño events, providing ideal climatic conditions for fire occurrence in Amazonia [7,8,23,82,83]. This was the case in 2015–2016 [84], contributing strongly to the environmental impacts of the drought in that year [8,23,85]. This is happening because the areas that have been logged or deforested become more vulnerable to fire [12,76,77,78], causing increases in forest fires initiated by new deforestation [8], especially in humid forest areas [86]. The increasing deforestation in humid forests and the impact of logging reduce the vegetation cover, modifying the microclimate and increasing the forest’s susceptibility to new fires [87]; thus, although these forests are not naturally susceptible to fire, anthropogenic activities together with climatic anomalies influence the occurrence and duration of drought episodes and increase the region’s flammability [86,87,88].

4.2. Influence of Deforestation on the Advance of Fire into the Forest

Our findings showed that the loss of vegetation due to deforestation tends to increase the occurrence of burned areas in the study region. We observed that the landscape transformation in the study region is associated with the change from forest to agricultural and pasture areas. The regions close to already-deforested areas, for example, BR-317 and BR-364, showed a greater tendency to burn and greater extension of the burned area when compared to the protected areas in the study region.
Fire recurrence analysis allows identification of the areas that are most prone to new fires and the initiation of a positive feedback process within a given burned area [89] Halting this process is necessary to prevent one of the main consequences of fires, which are the loss of forest species and biodiversity [90,91].
Policy changes, such as the implementation of the New Brazilian Forest Code [92] and decreased inspection of forest areas, have led to the increase in the concentration of active fires per unit area deforested in recent years, especially in 2019, 2018, 2017 and 2016. We also identified an increase in deforested areas, with 445.03 km2 of new deforestation.
Highway construction and paving projects, such as that for Highway BR-319 [93,94], represent a major axis for illegal activities such as deforestation, logging, and land grabbing due to the lack of governance in the Amazon region [16,47,90,95]. This situation is worsened by a joint ordinance issued on 2 December 2020 [96] that transfers responsibility for the process of “land regularization” from the federal government to the municipal level. Note that the euphemism “regularization” is used in Brazilian legislation and most public discussions, but it is a misnomer. “Regularization” implies that the land is legitimately occupied despite not having legal documentation, as in the case of traditional riverside dwellers communities (ribeirinhos)who have lived along Amazonian rivers for centuries. In the case of “regularization” by recent legislation and executive decrees, the land in question is either illegally occupied or merely claimed, and what is meant is instead the legalization of illegal land claims.
The change to municipal-level “regularization” of land tenure facilitates the legalization of illegally occupied land, primarily in Amazonia [90,94]. These illegal land claims have been rapidly increasing due to the weakening of Brazil’s environmental and indigenous agencies and increasing attacks on environmental enforcement agents [91,97,98]. These developments are stimulating the advance of fires, deforestation, and invasions of conservation units and indigenous lands [91,97,98]; thus, analyses of deforestation and burning at the municipal level are important for efforts to preserve the existing protected areas in the Amazon Forest and to create additional protected areas [90,94,99].
After the 2012 implementation of the new Forest Code, we observed an increase in the deforestation rate and active-fire pixels. These increases led to burned areas in the forest originating from the areas of new deforestation, which demonstrates the influence of ignition sources on the occurrence of forest fires [8]. The year 2019 marked the beginning of the presidential administration of Jair Bolsonaro, when there was a destabilization of the federal environmental agency (IBAMA) and consequent relaxation of environmental controls in Amazonia [90]. These political changes occurred after the 2015–2016 El Niño event [7,80]. Although the political events beginning in 2019 have been unprecedented, there were other political changes favoring deforestation in the years before 2019, causing an increase in deforestation, burned-forest areas, and fire ignition in the study region. This is exemplified by the increase in the trend curve of burned areas in the undesignated forest (1842 km2), where “rural properties” were responsible for increases of 66 to 84% in annual areas affected by fire after the implementation of the new Forest Code. Our analyses confirm the importance of undesignated public lands, which accounted for 87% of the deforestation in Brazilian Amazonia in the last 23 years, with a large part (52%) of this occurring in the last ten years [100]. This is because irregular occupation transforms the native forest into large pasture areas [30,100].
We observed the importance of creating policies against deforestation and the creation of monitoring plans. Failure to manage the landscape to preserve natural assets can lead to legal infractions [80] and financial costs for the government since fire occurrence can cause various health problems [101] and increase demand for care from the Unified Health System (SUS in Portuguese) [80]. The advanced deforestation of the study region should therefore be a source of concern for the Brazilian government.

4.3. Importance of Conservation Units and Indigenous Lands in Reducing Fire Occurrence

Our findings showed how the implantation of human-made structures within and close to protected areas increase burned areas in the region. In addition, we found that indigenous lands and conservation units, have served as barriers to the advance of deforestation and the extension of fire, impeding the advance to the northwestern portion of the study region.
We found that the implementation of management plans in sustainable-use conservation units [102,103,104] between 2009 and 2010 served as a tool to reduce burned areas in the study region. Among the conservation units analyzed, the Arapixi Extractive Reserve had the highest presence of burned area (0 to 4.35 km2) and the Purus National Forest had the largest annual burned area after the implementation of the management plan, mainly in 2016 (6.18 km2) and 2019 (4.22 km2). These issues may be associated with agricultural practices present in the area and wood extraction for boat building [102,103,104].
Although our results demonstrate that conservation units and indigenous lands are important barriers to fire occurrence in the study region, the influence of human activities near these areas caused increases in fire occurrence, especially in the Boca do Acre (40.47 km2) and Apurinã (52.81 km2) Indigenous Lands. We identified the importance of implementing management plans in conservation units for reducing deforestation and forest fires in the municipality of Boca do Acre. Regulations for these plans were established by Brazil’s National System of Conservation Units in 2000 [105], and the conservation units in the study region were created in 2009 and 2010 [102,103,104]. However, the management plans report constant environmental impact caused by illegal logging in these protected areas [102,103,104]. Anthropogenic activities in these areas caused an increase in fires after the establishment of the management plans. This is happening because fire is used to burn the newly felled forest and the fires invade the adjacent standing forest [8].
We highlight the importance of actions to reinforce the role of protected areas in avoiding forest loss and degradation [106], especially in restraining the illegal activities that are present in the study region [102,103,104]. Plans for “sustainable” forest management for timber invariably assume that the managed areas will never be burned [107]. A study in northern Amazonia of the added effect of fire on logging impact found that fires during the 2015–2016 drought increased the impact of logging by 146.5% as compared to the impact of the logging itself, mainly by increasing the area catching fire and secondarily by increasing tree mortality in areas that catch fire if logged [16]. The role of fire in greatly increasing the impact of logging implies that Amazonian Forest management projects are largely unsustainable [16]. Thus, risk and impacts need to be key considerations in Amazonian development policies and need to be included in all management plans for conservation units and commercial forest management. Global warming is projected to result in Amazonia having a hotter and dryer climate with an increased frequency of major droughts [108], thus implying greater frequency and impact of fire.

4.4. Limitations of This Study

There are still no Brazilian remote-sensing products that can capture the extent of fire in the Amazon, especially for the forest with the specific characteristics found in the southwest portion of the state of Amazonas [109]. Since, MapBiomas fire products need adjustments for use in the Amazon biome [110,111], to decrease the uncertainties of our results we constructed our burned area map using several burned area products with different spatial and temporal resolutions (Table S2 in Supplementary Materials). We applied the Pessôa et al. [9] method for selecting the products to build the burned-area map. In this process, we analyzed the limitations of the remote-sensing products regarding spatial and temporal resolution. The analyses used to construct the map showed that lower-resolution products (MODIS) [9,47,112] overestimated the burned area when compared with higher-resolution products (GABAM and GWIS) [9,49]. The combination of products resulted in a better characterization of fire in the study region and identified the fire spread in the time series (2003–2019). However, it is important to specify that the available satellite image data cannot detect understory fire [113], showing a limitation of fire detection in the study area and reinforcing the need for specific analyses in future studies, such as field data acquisition and user data with higher resolution (<5 m), such as data from Planet satellites.
Active fire data represent an important tool for analyzing the fire spread in a given region [114], especially when using temporal analyses [115]. In this aspect, the MODIS data from the BD Queimadas program showed some limitations associated with cloud cover that can obscure fire detection, overestimating the fire spread [116]. In the southwest portion of the state of Amazonas this increases the limitations of MODIS data, because noise also is associated with the strong southeast winds and cold fronts that create a smoke plume in regions with fire occurrences [109], and this effect intensifies the interference in the images. However, Morisette et al. [116] found that, despite the limitations of MODIS data, the algorithms for fire detection showed good accuracy and potential for use in fire analyses when compared to other products.
Thus, despite the limitations of remote-sensing products, the results showed the potential for application in preliminary analyses of fire spread. This is essential for creation of government plans and for transforming this technology into a tool for oversight by government agencies and for use in universities, since these data are available for public use.

4.5. Futures Applications

Fire and deforestation can increase carbon emissions to the atmosphere and worsen the future climate shown in scenarios produced by the current climate models (CMIP5 and CMIP6) [27,117]. The present study shows the current situation in a key part of the Amazon and how the deforestation frontiers in the study region are likely to expand. The study also indicates the need to preserve the area through actions to prevent deforestation [118] and fire.
Deforestation and forest degradation can cause intensification of the dry periods in El Niño years, a trend that is already occurring in the northern portion of the Amazon [119], and the intensified dry periods would increase the occurrence of fire in the area. We therefore suggest that future studies use trend analysis and future projections to quantify the consequence of climatic collapses. These analyzes could expand the investigation of processes identified in the present study and help in the creation of measures to prevent irreversible environmental impacts.

5. Conclusions

The present study shows the current situation in the southwestern portion Brazil’s state of Amazonas and its potential to become an even greater deforestation frontier. We found that precipitation and temperature anomalies are influenced by the Multivariate ENSO Index (MEI) and consequently cause anomalies in the occurrence of active fires in the study region.
Severe dry periods (usually August to October), together with deforestation, have increased the burned area, especially in undesignated public forests that border rural landholdings. The same process occurs in protected areas in the study region, with indigenous lands being more susceptible to fire and the advance of deforestation than conservation units.
We assessed the interrelations of fire with climate, mainly droughts and high temperatures, and human interactions through deforestation, in the municipality of Boca do Acre, which is one of the frontiers of Amazon deforestation. The analyses presented here are critical for identifying the causes of fire occurrence and for quantifying fire impact. This information is needed to prioritize areas that require preservation actions intensification. Free software and public data allow the reapplication of this analysis to identify the advance of fire damage across the Amazon Forest and to create barriers against the advance of deforestation and burned areas. Conservation area managers, public servants, and research institutions can apply the methodology as a way of identifying fire drivers and then generate more effective policies and practices for preserving the Amazon Forest.
The results showed the importance of protected areas as barriers to fire occurrence. The increase of forest areas converted to agriculture and pasture lead to increase in fire use, thus increasing the extent of burned areas in the region. We conclude that policy decisions affecting the Amazon Forest must include estimates of fire risk and impact under current and projected future climates. Fire studies must be included in the management plans for conservation units and in forest management plans.

Supplementary Materials

The following supporting information can be downloaded at: https://www.mdpi.com/article/10.3390/fire6010002/s1.

Author Contributions

Conceptualization, D.J.D., P.M.L.d.A.G., A.M.Y., P.M.F. and L.O.A.; data curation, D.J.D., A.M.Y., P.M.F. and L.O.A.; formal analysis, D.J.D. and L.O.A.; funding acquisition, L.O.A. and P.M.F.; methodology, D.J.D. and L.O.A.; supervision, P.M.L.d.A.G., A.M.Y., P.M.F. and L.O.A.; writing—original draft, D.J.D., P.M.L.d.A.G., A.M.Y., P.M.F., C.B., R.B., C.J., L.E.O.e.C.d.A., R.D. and L.O.A.; writing—review and editing, D.J.D., P.M.L.d.A.G., A.M.Y., P.M.F., C.B., R.B., C.J., L.E.O.e.C.d.A., R.D. and L.O.A. All authors have read and agreed to the published version of the manuscript.

Funding

This research was funded by the São Paulo Research Foundation (FAPESP) grant number 2020/08916-8, 2021/04019-4, 2020/15230-5 and Amazonia Research Foundation (FAPEAM) grant number 0102016301000289/2021-33. P.M.F., L.O.A and L.E.O.e.C.d.A. thank the National Council for Scientific and Technological Development (CNPq grant number 312450/2021-4, productivity scholarship number 314473/2020-3 and 314416/2020-0, respectively) and FINEP/Rede CLIMA (grant number 01.13.0353-00). Met Office authors (C.B, R.B. and C.J.) were supported by the Newton Fund through the Met Office Climate Science for Service Partnership Brazil (CSSP Brazil).

Institutional Review Board Statement

Not applicable.

Informed Consent Statement

Not applicable.

Data Availability Statement

Raw burned-area data: MODIS [50], GWIS [52,53], GABAM [51]; Raw TerraBrasilis data: DETER [63] and PRODES [63]; Raw land use data: MapBiomas [46]; Raw Forest data: Secondary forest [47], Undesignated forest [64]; Raw protected areas data: Indigenous territories [65], Conservation units [66]; Raw “rural properties” data: CAR [59]. A compilation of studies with analyses of burned areas has been uploaded as online Supplementary Materials.

Acknowledgments

We are grateful to National Center for Monitoring and Early Warning of Natural Disasters (CEMADEN), National Institute for Research in Amazonia (INPA), National Institute for Space Research (INPE), and the UK Met Office for their support in carrying out this research.

Conflicts of Interest

The authors declare no conflict of interest and the funders had no role in the design of the study, in the collection, analyses, or interpretation of data, in the writing of the manuscript, or in the decision to publish the results.

References

  1. Fearnside, P.M. Amazon Forest Maintenance as a Source of Environmental Services. Ann. Acad. Bras. Cienc. 2008, 80, 101–114. [Google Scholar] [CrossRef] [PubMed] [Green Version]
  2. Barlow, J.; Silveira, J.M.; Mestre, L.A.M.; Andrade, R.B.; Camacho D’Andrea, G.; Louzada, J.; Vaz-de-Mello, F.Z.; Numata, I.; Lacau, S.; Cochrane, M.A. Wildfires in Bamboo-Dominated Amazonian Forest: Impacts on above-Ground Biomass and Biodiversity. PLoS ONE 2012, 7, e33373. [Google Scholar] [CrossRef]
  3. Enright, N.J.; Fontaine, J.B.; Bowman, D.M.; Bradstock, R.A.; Williams, R.J. Interval Squeeze: Altered Fire Regimes and De-mographic Responses Interact to Threaten Woody Species Persistence as Climate Changes. Front. Ecol. Environ. 2015, 13, 265–272. [Google Scholar] [CrossRef] [PubMed] [Green Version]
  4. Lopes, A.P.; Silva, C.V.J.; Barlow, J.; Rincón, L.M.; Campanharo, W.A.; Nunes, C.A.; De Almeida, C.T.; Silva Júnior, C.H.L.; Cassol, H.L.G.; Dalagnol, R.; et al. Drought-Driven Wildfire Impacts on Structure and Dynamics in a Wet Central Amazonian Forest. Proc. R. Soc. B Biol. Sci. 2021, 288, 20210094. [Google Scholar] [CrossRef]
  5. McLauchlan, K.K.; Higuera, P.E.; Miesel, J.; Rogers, B.M.; Schweitzer, J.; Shuman, J.K.; Tepley, A.J.; Varner, J.M.; Veblen, T.T.; Adalsteinsson, S.A. Fire as a Fundamental Ecological Process: Research Advances and Frontiers. J. Ecol. 2020, 108, 2047–2069. [Google Scholar] [CrossRef]
  6. Leite Filho, A.T.; Soares Filho, B.S.; Davis, J.L.; Abrahão, G.M.; Börner, J. Deforestation Reduces Rainfall and Agricultural Revenues in the Brazilian Amazon. Nat. Commun. 2021, 12, 2591. [Google Scholar] [CrossRef]
  7. Aragão, L.E.O.C.; Anderson, L.O.; Fonseca, M.G.; Rosan, T.M.; Vedovato, L.B.; Wagner, F.H.; Silva, C.V.J.; Silva, C.H.L., Jr.; Arai, E.; Aguiar, A.P.; et al. 21st Century Drought-Related Fires Counteract the Decline of Amazon Deforestation Carbon Emissions. Nat. Commun. 2018, 9, 536. [Google Scholar] [CrossRef] [Green Version]
  8. Barni, P.E.; Rego, A.C.M.; Silva, F.d.C.F.; Lopes, R.A.S.; Xaud, H.A.M.; Xaud, M.R.; Barbosa, R.I.; Fearnside, P.M. Logging Amazon Forest Increased the Severity and Spread of Fires during the 2015–2016 El Niño. For. Ecol. Manag. 2021, 500, 119652. [Google Scholar] [CrossRef]
  9. Pessôa, A.C.M.; Anderson, L.O.; Carvalho, N.S.; Campanharo, W.A.; Junior, C.H.L.S.; Rosan, T.M.; Reis, J.B.C.; Pereira, F.R.S.; Assis, M.; Jacon, A.D.; et al. Intercomparison of Burned Area Products and Its Implication for Carbon Emission Estimations in the Amazon. Remote Sens. 2020, 12, 3864. [Google Scholar] [CrossRef]
  10. Rappaport, D.I.; Morton, D.C.; Longo, M.; Keller, M.; Dubayah, R.; Dos-Santos, M.N. Quantifying Long-Term Changes in Carbon Stocks and Forest Structure from Amazon Forest Degradation. Environ. Res. Lett. 2018, 13, 065013. [Google Scholar] [CrossRef]
  11. Silva, C.H.L., Jr.; Aragão, L.E.O.C.; Fonseca, M.G.; Almeida, C.T.; Vedovato, L.B.; Anderson, L.O. Deforestation-Induced Fragmentation Increases Forest Fire Occurrence in Central Brazilian Amazonia. Forests 2018, 9, 305. [Google Scholar] [CrossRef] [Green Version]
  12. Ziccardi, L.G.; Graça, P.M.L.A.; Figueiredo, E.O.; Fearnside, P.M. Decline of Large-Diameter Trees in a Bamboo-Dominated Forest Following Anthropogenic Disturbances in Southwestern Amazonia. Ann. For. Sci. 2019, 76, 110. [Google Scholar] [CrossRef]
  13. Anderson, L.O.; Aragão, L.E.O.C.; Gloor, M.; Arai, E.; Adami, M.; Saatchi, S.S.; Malhi, Y.; Shimabukuro, Y.E.; Barlow, J.; Berenguer, E.; et al. Disentangling the Contribution of Multiple Land Covers to Fire-Mediated Carbon Emissions in Amazonia during the 2010 Drought. Glob. Biogeochem. Cycles 2015, 29, 1739–1753. [Google Scholar] [CrossRef] [Green Version]
  14. De Mendonça, M.J.C.; Vera Diaz, M.d.C.; Nepstad, D.; Seroa da Motta, R.; Alencar, A.; Gomes, J.C.; Ortiz, R.A. The Economic Cost of the Use of Fire in the Amazon. Ecol. Econ. 2004, 49, 89–105. [Google Scholar] [CrossRef]
  15. Oliveira, A.S.; Rajão, R.G.; Soares Filho, B.S.; Oliveira, U.; Santos, L.R.S.; Assunção, A.C.; Hoff, R.; Rodrigues, H.O.; Ribeiro, S.M.C.; Merry, F.; et al. Economic Losses to Sustainable Timber Production by Fire in the Brazilian Amazon. Geogr. J. 2019, 185, 55–67. [Google Scholar] [CrossRef]
  16. Campanharo, W.A.; Morello, T.; Christofoletti, M.A.M.; Anderson, L.O. Hospitalization Due to Fire-Induced Pollution in the Brazilian Legal Amazon from 2005 to 2018. Remote Sens. 2022, 14, 69. [Google Scholar] [CrossRef]
  17. Campanharo, W.A.; Lopes, A.P.; Anderson, L.O.; da Silva, T.F.M.R.; Aragão, L.E.O.C. Translating Fire Impacts in Southwestern Amazonia into Economic Costs. Remote Sens. 2019, 11, 764. [Google Scholar] [CrossRef] [Green Version]
  18. Thomas, D.; Butry, D.; Gilbert, S.; Webb, D.; Fung, J. The Costs and Losses of Wildfires: A Literature Survey; National Institute of Standards and Technology: Gaithersburg, MD, USA, 2017.
  19. Morello, T.F.; Ramos, R.M.; Anderson, L.O.; Owen, N.; Rosan, T.M.; Steil, L. Predicting Fires for Policy Making: Improving Accuracy of Fire Brigade Allocation in the Brazilian Amazon. Ecol. Econ. 2020, 169, 106501. [Google Scholar] [CrossRef]
  20. Bush, M.; Silman, M.; McMichael, C.; Saatchi, S. Fire, Climate Change and Biodiversity in Amazonia: A Late-Holocene Perspective. Philos. Trans. R. Soc. B Biol. Sci 2008, 363, 1795–1802. [Google Scholar] [CrossRef] [PubMed] [Green Version]
  21. Barni, P.E.; Fearnside, P.M.; de Alencastro Graça, P.M.L. Simulating Deforestation and Carbon Loss in Amazonia: Impacts in Brazil’s Roraima State from Reconstructing Highway BR-319 (Manaus-Porto Velho). Environ. Manag. 2015, 55, 259–278. [Google Scholar] [CrossRef]
  22. Berenguer, E.; Lennox, G.D.; Ferreira, J.; Malhi, Y.; Aragão, L.E.O.C.; Barreto, J.R.; Del Bon Espírito-Santo, F.; Figueiredo, A.E.S.; França, F.; Gardner, T.A.; et al. Tracking the Impacts of El Niño Drought and Fire in Human-Modified Amazonian Forests. Proc. Natl. Acad. Sci. USA 2021, 118, e2019377118. [Google Scholar] [CrossRef] [PubMed]
  23. Fonseca, M.G.; Anderson, L.O.; Arai, E.; Shimabukuro, Y.E.; Xaud, H.A.M.; Xaud, M.R.; Madani, N.; Wagner, F.H.; Aragão, L.E.O.C. Climatic and Anthropogenic Drivers of Northern Amazon Fires during the 2015-2016 El Niño Event. Ecol. Appl. 2017, 27, 2514–2527. [Google Scholar] [CrossRef] [PubMed]
  24. Turubanova, S.; Potapov, P.V.; Tyukavina, A.; Hansen, M.C. Ongoing Primary Forest Loss in Brazil, Democratic Republic of the Congo, and Indonesia. Environ. Res. Lett. 2018, 13, 074028. [Google Scholar] [CrossRef] [Green Version]
  25. Ciais, P.; Sabine, C.; Bala, G.; Bopp, L.; Brovkin, V.; Canadell, J.; Chhabra, A.; DeFries, R.; Galloway, J.; Heimann, M.; et al. Carbon and Other Biogeochemical Cycles. In Climate Change 2013: The Physical Science Basis; Contribution of Working Group I to the Fifth Assessment Report of the Intergovernmental Panel on Climate Change; Stocker, T.F., Qin, D., Plattner, G.-K., Tignor, M., Allen, S.K., Boschung, J., Nauels, A., Xia, Y., Bex, V., Midgley, P.M., Eds.; Cambridge University Press: Cambridge, UK, 2013. [Google Scholar]
  26. LePage, Y.; van der Werf, G.R.; Morton, D.C.; Pereira, J.M. Modeling Fire-Driven Deforestation Potential in Amazonia under Current and Projected Climate Conditions. J. Geophys. Res. Biogeosci. 2010, 115, G03012. [Google Scholar]
  27. Burton, C.; Kelley, D.I.; Jones, C.D.; Betts, R.A.; Cardoso, M.; Anderson, L. South American Fires and Their Impacts on Ecosystems Increase with Continued Emissions. Clim. Resil. Sustain. 2022, 1, e8. [Google Scholar] [CrossRef]
  28. De Meira Junior, M.S.; Pinto, J.R.R.; Ramos, N.O.; Miguel, E.P.; Gaspar, R.d.O.; Phillips, O.L. The Impact of Long Dry Periods on the Aboveground Biomass in a Tropical Forest: 20 Years of Monitoring. Carbon Balance Manag. 2020, 15, 12. [Google Scholar] [CrossRef]
  29. Staver, A.C.; Brando, P.M.; Barlow, J.; Morton, D.C.; Paine, C.T.; Malhi, Y.; Murakami, A.A.; Pasquel, J.d.A. Thinner Bark Increases Sensitivity Of wetter Amazonian Tropical Forests to Fire. Ecol. Lett. 2020, 23, 99–106. [Google Scholar] [CrossRef] [Green Version]
  30. Oliveira, U.; Soares-filho, B.; Bustamante, M.; Gomes, L.; Ometto, J.P.; Rajão, R. Determinants of Fire Impact in the Brazilian Biomes. Front. For. Glob. Chang. 2022, 5, 735017. [Google Scholar] [CrossRef]
  31. Lopes, A.P.; Dalagnol, R.; Dutra, A.C.; Silva, C.V.S.; Graça, P.M.L.G.; de Oliveira e Cruz, L.E. Quantifying Post-Fire Changes in the Aboveground Biomass of an Amazonian Forest Based on Field and Remote Sensing Data. Remote Sens. 2022, 14, 1545. [Google Scholar] [CrossRef]
  32. Silva, C.H.L., Jr.; Anderson, L.O.; Silva, A.L.; Almeida, C.T.; Dalagnol, R.; Pletsch, M.A.J.S.; Penha, T.V.; Paloschi, R.A.; Aragão, L.E.O.C. Fire Responses to the 2010 and 2015/2016 Amazonian Droughts. Front. Earth Sci. 2019, 7, 97. [Google Scholar] [CrossRef] [Green Version]
  33. Cochrane, M.A. Fire Science for Rainforests. Nature 2003, 421, 913–919. [Google Scholar] [CrossRef] [PubMed]
  34. Pausas, J.G.; Keeley, J.E. Burning Story: The Role of Fire in the History of Life. Bioscience 2009, 59, 593–601. [Google Scholar] [CrossRef] [Green Version]
  35. Silveira, M.V.F.; Petri, C.A.; Broggio, I.S.; Chagas, G.O.; Macul, M.S.; Leite, C.C.S.S.; Ferrari, E.M.M.; Amim, C.G.V.; Freitas, A.L.R.; Motta, A.Z.V.; et al. Drivers of Fire Anomalies in the Brazilian Amazon: Lessons Learned from the 2019 Fire Crisis. Land 2020, 9, 516. [Google Scholar] [CrossRef]
  36. Silva, C.H.L., Jr.; Aragão, L.E.O.C.; Anderson, L.O.; Fonseca, M.G.; Shimabukuro, Y.E.; Vancutsem, C.; Achard, F.; Beuchle, R.; Numata, I.; Silva, C.A.; et al. Persistent Collapse of Biomass in Amazonian Forest Edges Following Deforestation Leads to Unaccounted Carbon Losses. Sci. Adv. 2020, 6, eaaz8360. [Google Scholar] [CrossRef] [PubMed]
  37. Vedovato, L.B.; Fonseca, M.G.; Arai, E.; Anderson, L.O.; Aragão, L.E.O.C. The Extent of 2014 Forest Fragmentation in the Brazilian Amazon. Reg. Environ. Chang. 2016, 16, 2485–2490. [Google Scholar] [CrossRef]
  38. Carvalho, N.S.; Anderson, L.O.; Nunes, C.A.; Pessôa, A.C.M.; Silva, C.H.L., Jr.; REIS, J.B.C.; Shimabukuro, Y.E.; Berenguer, E.; Barlow, J.; Aragao, L.E.O.C. Spatio-Temporal Variation in Dry Season Determines the Amazonian Fire Calendar. Environ. Res. Lett. 2021, 16, 125009. [Google Scholar] [CrossRef]
  39. Aragão, L.E.O.C.; Malhi, Y.; Barbier, N.; Lima, A.; Shimabukuro, Y.; Anderson, L.; Saatchi, S. Interactions between Rainfall, Deforestation and Fires during Recent Years in the Brazilian Amazonia. Philos. Trans. R. Soc. B Biol. Sci. 2008, 363, 1779–1785. [Google Scholar] [CrossRef]
  40. DNIT—Departamento Nacional de Infraestrutura de Transportes. Rodovias Georreferenciadas Que Compõem o Subsistema Rodoviário Federal Do Sistema Federal de Viação (SFV) Do Brasil. Available online: https://inde.gov.br/ (accessed on 12 June 2021).
  41. Barni, P.E.; Pereira, V.B.; Manzi, A.O.; Barbosa, R.I. Deforestation and Forest Fires in Roraima and Their Relationship with Phytoclimatic Regions in the Northern Brazilian Amazon. Environ. Manag. 2015, 55, 1124–1138. [Google Scholar] [CrossRef]
  42. Alvares, C.A.; Stape, J.L.; Sentelhas, P.C.; de Moraes Gonçalves, J.L.; Sparovek, G. Köppen’s Climate Classification Map for Brazil. Meteorol. Z. 2013, 22, 711–728. [Google Scholar] [CrossRef]
  43. Diniz, C.; Cortinhas, L.; Nerino, G.; Rodrigues, J.; Sadeck, L.; Adami, M.; Souza-Filho, P.W.M. Brazilian Mangrove Status: Three Decades of Satellite Data Analysis. Remote Sens. 2019, 11, 808. [Google Scholar] [CrossRef] [Green Version]
  44. Souza, C.M.; Shimbo, J.Z.; Rosa, M.R.; Parente, L.L.; Alencar, A.A.; Rudorff, B.F.T.; Hasenack, H.; Matsumoto, M.; Ferreira, L.G.; Souza-Filho, P.W.M.; et al. Reconstructing Three Decades of Land Use and Land Cover Changes in Brazilian Biomes with Landsat Archive and Earth Engine. Remote Sens. 2020, 12, 2735. [Google Scholar] [CrossRef]
  45. Gorelick, N.; Hancher, M.; Dixon, M.; Ilyushchenko, S.; Thau, D.; Moore, R. Google Earth Engine: Planetary-Scale Geospatial Analysis for Everyone. Remote Sens. Environ. 2017, 202, 18–27. [Google Scholar] [CrossRef]
  46. MAPBIOMAS. Projeto Mapbiomas. Available online: https://mapbiomas.org (accessed on 30 June 2021).
  47. Silva, C.H.L., Jr.; Heinrich, V.H.A.; Freire, A.T.G.; Broggio, I.S.; Rosan, T.M.; Doblas, J.; Anderson, L.O.; Rousseau, G.X.; Shimabukuro, Y.E.; Silva, C.A.; et al. Benchmark Maps of 33 Years of Secondary Forest Age for Brazil. Sci. Data 2020, 7, 269. [Google Scholar] [CrossRef] [PubMed]
  48. Giglio, L.; Boschetti, L.; Roy, D.P.; Humber, M.L.; Justice, C.O. The Collection 6 MODIS Burned Area Mapping Algorithm and Product. Remote Sens. Environ. 2018, 217, 72–85. [Google Scholar] [CrossRef]
  49. Long, T.; Zhang, Z.; He, G.; Jiao, W.; Tang, C.; Wu, B.; Zhang, X.; Wang, G.; Yin, R. 30 m Resolution Global Annual Burned Area Mapping Based on Landsat Images and Google Earth Engine. Remote Sens. 2019, 11, 489. [Google Scholar] [CrossRef] [Green Version]
  50. Artés, T.; Oom, D.; de Rigo, D.; Durrant, T.H.; Maianti, P.; Libertà, G.; San-Miguel-Ayanz, J. A Global Wildfire Dataset for the Analysis of Fire Regimes and Fire Behaviour. Sci. Data 2019, 6, 296. [Google Scholar] [CrossRef] [PubMed] [Green Version]
  51. Boschetti, L.; Sparks, A.; Roy, D.; Giglio, L.; San-Miguel-Ayanz, J. GWIS National and Sub-National Fire Activity Data from the NASA MODIS Collection 6 Burned Area Product in Support of Policy Making, Carbon Inventories and Natural Resource Management. Available online: https://gwis.jrc.ec.europa.eu/apps/country.profile/downloads (accessed on 6 June 2021).
  52. Dutra, D.J.; Oighenstein, L.A.; Fearnside, P.M.; Yanai, A.M.; Graça, P.M.L.A.; da Silva, R.D.; Pessôa, A.C.D.M.; de Aragão, L.E.O.E.C. Comparison of Regional Scale Burned Area Products for Southwestern Brazilian Amazonia. In Proceedings of the GEOINFO 2022, XXIII Brazilian Symposium on Geoinformatics, São José dos Campos, SP, Brazil, 28–30 November 2022; p. 12. [Google Scholar]
  53. INPE. Queimadas. Available online: https://queimadas.dgi.inpe.br/queimadas/portal/informacoes/apresentacao (accessed on 30 June 2021).
  54. Copernicus-Climate-Change-Service ERA5: Fifth Generation of ECMWF Atmospheric Reanalyses of the Global Climate. Available online: https://cds.climate.copernicus.eu/cdsapp#!/home (accessed on 1 January 2022).
  55. Von Randow, C.; Zeri, M.; Restrepo-Coupe, N.; Muza, M.N.; de Gonçalves, L.G.G.; Costa, M.H.; Araujo, A.C.; Manzi, A.O.; da Rocha, H.R.; Saleska, S.R.; et al. Inter-Annual Variability of Carbon and Water Fluxes in Amazonian Forest, Cerrado and Pasture Sites, as Simulated by Terrestrial Biosphere Models. Agric. For. Meteorol. 2013, 182–183, 145–155. [Google Scholar] [CrossRef]
  56. Da Rocha, H.R.; Goulden, M.L.; Miller, S.D.; Menton, M.C.; Pinto, L.D.V.O.; De Freitas, H.C.; E Silva Figueira, A.M. Seasonality of Water and Heat Fluxes over a Tropical Forest in Eastern Amazonia. Ecol. Appl. 2004, 14, 22–32. [Google Scholar] [CrossRef]
  57. Serviço Flroestal Brasileiro SEB. Módulo de Cadastro—Manual Do Usuário; Ministério do Meio Ambiente: Brasília, Brazil, 2016.
  58. De Freitas, F.L.M.; Guidotti, V.; Sparovek, G.; Hamamura, C. Nota Técnica: Malha Fundiária Do Brasil. In Atlas—A Geografia da Agropecuária Brasileira; IMAFLORA: Piracicaba, Brazil, 2018; Volume 1812, p. 5. [Google Scholar]
  59. Carvalho, N.S.; Anderson, L.O.; Pessôa, A.C.M.; Silva, C.H.L., Jr.; Reis, J.B.C.; Aragão, L.E.O.C.; Barlow, J. Assessing the Distribution and Overlap of Public and Private Lands in the Brazilian Amazon. Remote Sens. 2022. submitted. [Google Scholar]
  60. INCRA Classificação Dos Imóveis Rurais. Available online: www.antigo.incra.gov.br/obtencao-de-terras (accessed on 5 January 2022).
  61. Assis, L.F.F.G.; Ferreira, K.R.; Vinhas, L.; Maurano, L.; Almeida, C.; Carvalho, A.; Rodrigues, J.; Maciel, A.; Camargo, C. TerraBrasilis: A Spatial Data Analytics Infrastructure for Large-Scale Thematic Mapping. ISPRS Int. J. Geo-Inf. 2019, 8, 513. [Google Scholar] [CrossRef] [Green Version]
  62. Serviço-Florestal-Brasileiro Florestas Não Destinadas. Available online: http://www.florestal.gov.br/cadastro-nacional-de-florestas-publicas/127-informacoes-florestais/cadastro-nacional-de-florestas-publicas-cnfp/1413-cadastro-nacional-de-florestas-publicas-atualizacao-2020 (accessed on 3 February 2021).
  63. FUNAI. Terras Indigenas. Available online: http://geoserver.funai.gov.br/geoserver/web/ (accessed on 3 February 2021).
  64. MMA. Unidades de Conservação. Available online: http://mapas.mma.gov.br/i3geo/datadownload.htm (accessed on 3 February 2021).
  65. Soares Filho, B.; Alencar, A.; Nepstad, D.; Cerqueira, G.; Del Carmen Vera Diaz, M.; Rivero, S.; Solórzano, L.; Voll, E. Simulating the Response of Land-Cover Changes to Road Paving and Governance along a Major Amazon Highway: The Santarém-Cuiabá Corridor. Glob. Chang. Biol. 2004, 10, 745–764. [Google Scholar] [CrossRef]
  66. R Core Team R: A Language and Environment for Statistical Computing. 2020. Available online: https://www.r-project.org/ (accessed on 30 June 2021).
  67. Qgis. QGIS Geographic Information System. Available online: https://qgis.org/pt_BR/site/ (accessed on 6 June 2021).
  68. Kendall, M.G. Rank Correlation Methods; Charles Griffin: London, UK, 1975. [Google Scholar]
  69. Mann, H.B. Nonparametric Tests Against Trend. Econometrica 1945, 13, 245. [Google Scholar] [CrossRef]
  70. Sen, P.K. Estimates of the Regression Coefficient Based on Kendall’s Tau. J. Am. Stat. Assoc. 1968, 63, 1379. [Google Scholar] [CrossRef]
  71. Silva, C.H.L., Jr.; Buna, A.T.M.; Bezerra, D.S.; Costa, O.S.; Santos, A.L.; Basson, L.O.D.; Santos, A.L.S.; Alvarado, S.T.; Almeida, C.T.; Freire, A.T.G.; et al. Forest Fragmentation and Fires in the Eastern Brazilian Amazon–Maranhão State, Brazil. Fire 2022, 5, 77. [Google Scholar] [CrossRef]
  72. Package ‘Wql’. Available online: https://cran.r-project.org/web/packages/wql/wql.pdf (accessed on 8 May 2022).
  73. Package “Kandall”. Available online: https://cran.r-project.org/web/packages/Kendall/Kendall.pdf (accessed on 8 May 2022).
  74. Bombardi, R.J.; de Carvalho, L.M.V. Práticas Simples Em Análises Climatológicas: Uma Revisão. Rev. Bras. Meteorol. 2017, 32, 311–320. [Google Scholar] [CrossRef] [Green Version]
  75. Anderson, L.O.; Neto, G.R.; Cunha, A.P.; Fonseca, M.G.; De Moura, Y.M.; Dalagnol, R.; Wagner, F.H.; De Aragão, L.E.O.E.C. Vulnerability of Amazonian Forests to Repeated Droughts. Philos. Trans. R. Soc. B Biol. Sci. 2018, 373, 20170411. [Google Scholar] [CrossRef]
  76. De Andrade, D.F.C.; Ruschel, A.R.; Schwartz, G.; de Carvalho, J.O.P.; Humphries, S.; Gama, J.R.V. Forest Resilience to Fire in Eastern Amazon Depends on the Intensity of Pre-Fire Disturbance. For. Ecol. Manag. 2020, 472, 118258. [Google Scholar] [CrossRef]
  77. Cochrane, M.A.; Alencar, A.; Schulze, M.D.; Souza, C.M.; Nepstad, D.C.; Lefebvre, P.; Davidson, E.A. Positive Feedbacks in the Fire Dynamic of Closed Canopy Tropical Forests. Science 1999, 284, 1832–1835. [Google Scholar] [CrossRef]
  78. De Faria, B.L.; Brando, P.M.; Macedo, M.N.; Panday, P.K.; Soares-Filho, B.S.; Coe, M.T. Current and Future Patterns of Fire-Induced Forest Degradation in Amazonia. Environ. Res. Lett. 2017, 12, 095005. [Google Scholar] [CrossRef]
  79. Silveira, M.V.F.; Silva, C.H.L., Jr.; Anderson, L.O.; Aragão, L.E.O.C. Amazon Fires in the 21st Century: The Year of 2020 in Evidence. Glob. Ecol. Biogeogr. 2022, 31, 2026–2040. [Google Scholar] [CrossRef]
  80. Aragão, L.E.O.C.; Silva, C.H.L., Jr.; Anderson, L.O. O Desafio Do Brasil Para Conter o Desmatamento e as Queimadas Na Amazônia Durante a Pandemia Por COVID-19. In Implicações Ambientais, Sociais e Sua Governança; Technical Report; National Institute for Space Research: São José dos Campos, Brazil, 2020. [Google Scholar] [CrossRef]
  81. Aragão, L.E.O.C.; Malhi, Y.; Roman-Cuesta, R.M.; Saatchi, S.; Anderson, L.O.; Shimabukuro, Y.E. Spatial Patterns and Fire Response of Recent Amazonian Droughts. Geophys. Res. Lett. 2007, 34, L07701. [Google Scholar] [CrossRef]
  82. Burton, C.; Betts, R.A.; Jones, C.D.; Feldpausch, T.R.; Cardoso, M.; Anderson, L.O. El Niño Driven Changes in Global Fire 2015/16. Front. Earth Sci. 2020, 8, 199. [Google Scholar] [CrossRef]
  83. Ray, D.; Nepstad, D.; Moutinho, P. Micrometeorological and canopy controls of fire susceptibility in a forested Amazon landscape. Ecol. Appl. 2005, 15, 1664–1678. [Google Scholar] [CrossRef]
  84. Barnard, P.L.; Hoover, D.; Hubbard, D.M.; Snyder, A.; Ludka, B.C.; Allan, J.; Kaminsky, G.M.; Ruggiero, P.; Gallien, T.W.; Gabel, L.; et al. Extreme Oceanographic Forcing and Coastal Response Due to the 2015–2016 El Niño. Nat. Commun. 2017, 8, 6–13. [Google Scholar] [CrossRef] [PubMed] [Green Version]
  85. Barni, P.; Barbosa, R.I.; Manzi, A.O.; Fearnside, P.M. Simulated Deforestation versus Satellite Data in Roraima, Northern Amazonia, Brazil. Sustentabilidade Debate 2020, 11, 81–94. [Google Scholar] [CrossRef]
  86. Nogueira, J.M.P.; Rambal, S.; Barbosa, J.P.R.A.D.; Mouillot, F. Spatial Pattern of the Seasonal Drought/Burned Area Rela-tionship across Brazilian Biomes: Sensitivity to Drought Metrics and Global Remote-Sensing Fire Products. Climate 2017, 5, 42. [Google Scholar] [CrossRef] [Green Version]
  87. Stott, P. Combustion in Tropical Biomass Fires: A Critical Review. Prog. Phys. Geogr. 2000, 24, 355–377. [Google Scholar] [CrossRef]
  88. Nepstad, D.C.; Lefebvre, P.A.; Silva, U.L.; Junior, T.J.; Schlesinger, P.; Solorzano, L.; Moutinho, P.R.S.; Ray, D.G. Amazon Drought and Its Implications for Forest Flammability and Tree Growth: A Basin-Wide Analysis. Glob. Change Biol. 2004, 10, 704–717. [Google Scholar] [CrossRef]
  89. Hoffmann, T.B.; Dutra, A.C.; Shimabukuro, Y.E.; Arai, E.; Godinho Cassol, H.L.; Di Girolamo Neto, C.; Duarte, V. Fire Oc-currence in the Brazilian Savanna Conservation Units and Their Buffer Zones. In Proceedings of the IGARSS 2020—2020 IEEE International Geoscience and Remote Sensing Symposium, Waikoloa, HI, USA, 26 September–2 October 2020; pp. 4263–4266. [Google Scholar]
  90. Ferrante, L.; Fearnside, P.M. Brazil’s Political Upset Threatens Amazonia. Science 2021, 371, 898. [Google Scholar] [CrossRef]
  91. Ferrante, L.; Fearnside, P.M. Military Forces and COVID-19 as Smokescreens for Amazon Destruction and Violation of In-digenous Rights. Die Erde 2020, 151, 258–263. [Google Scholar] [CrossRef]
  92. Brasil Lei No 12.651, de 25 de Maio de 2012; Brasília, DOU de 28.5.2012. Available online: https://www.planalto.gov.br/ccivil_03/_ato2011-2014/2012/lei/l12651.htm (accessed on 14 February 2022).
  93. Ferrante, L.; Fearnside, P.M. The Amazon’s Road to Deforestation. Science 2020, 369, 634. [Google Scholar] [CrossRef] [PubMed]
  94. Ferrante, L.; Andrade, M.B.T.; Fearnside, P.M. Land Grabbing on Brazil’s Highway BR-319 as a Spearhead for Amazonian Deforestation. Land Use Policy 2021, 108, 3. [Google Scholar] [CrossRef]
  95. Ferrante, L.; Fearnside, P.M. Brazil Threatens Indigenous Lands. Science 2020, 368, 481–482. [Google Scholar] [CrossRef]
  96. MAPA; INCRA. Portaria Conjunta No 1, de 2 de Dezembro de 2020. Available online: https://bityl.co/4o8G (accessed on 14 February 2022).
  97. Ferrante, L.; Fearnside, P.M. Brazil’s New President and “ruralists” Threaten Amazonia’s Environment, Traditional Peoples and the Global Climate. Environ. Conserv. 2019, 46, 14–16. [Google Scholar] [CrossRef]
  98. HRW. Rainforest Mafias: How Violence and Impunity Fuel Deforestation in Brazil’s Amazon; Human Rights Watch (HRW): New York, NY, USA, 2019. [Google Scholar]
  99. Mataveli, G.A.V.; Chaves, M.E.D.; Brunsell, N.A.; Aragão, L.E.O.C. The Emergence of a New Deforestation Hotspot in Amazonia. Perspect. Ecol. Conserv. 2021, 19, 33–36. [Google Scholar] [CrossRef]
  100. Salomão, C.S.C.; Stabile, M.C.C.; Souza, L.; Alencar, A.; Castro, I.; Moutinho, P.; Guyota, C. Nota Técnica n. 8. Amazônia Em Chamas: Desmatamento, Fogo e Pecuária Em Terras Públicas; IPAM: Manaus, Brazil, 2021. [Google Scholar]
  101. SIOP Sistema de Integrado de Planejamento Ee Orçamento. Available online: http://www1.siop.planejamento.gov.br/acessopublico/?pp=acessopublico&rvn=1 (accessed on 14 February 2022).
  102. ICMBio. Plano de Manejo Floresta Nacional Do Purus; Ministerio do Meio Ambiente: Boca do Acre, Brazil, 2009; Volume 1, p. 107.
  103. ICMBio. Plano de Manejo Participativo Da Reserva Extrativista Arapixi; Ministerio do Meio Ambiente—MMA: Boca do Acre, Brazil, 2010.
  104. ICMBio. Plano de Manejo Floresta Nacional Mapiá-Inauini; Ministerio do Meio Ambiente: Boca do Acre, Brazil, 2009; Volume 1, p. 109.
  105. Brasil Lei Nº 9985, de 18 de Julho de 2000; Brazil. 2000; pp. 1–16. Available online: https://www.planalto.gov.br/ccivil_03/leis/l9985.htm (accessed on 14 February 2022).
  106. Alcasena, F.; Ager, A.; Le Page, Y.; Bessa, P.; Loureiro, C.; Oliveira, T. Assessing Wildfire Exposure to Communities and Pro-tected Areas in Portugal. Fire 2021, 4, 82. [Google Scholar] [CrossRef]
  107. Fearnside, P.M. Conservation Policy in Brazilian Amazonia: Understanding the Dilemmas. World Dev. 2003, 31, 757–779. [Google Scholar] [CrossRef]
  108. IPCC. Climate Change 2021: The Physical Science Basis; Contribution of Working Group I to the Sixth Assessment Report of the Intergovernmental Panel on Climate Change; Masson-Delmotte, V., Zhai, P., Pirani, A., Connors, S.L., Péan, C., Berger, S., Caud, N., Chen, Y., Goldfarb, L., Gomis, M.I., et al., Eds.; Cambridge University Press: Cambridge, UK, 2021. [Google Scholar]
  109. Brown, F.I.; Schroeder, W.; Setzer, A.; de Los Rios, M.M.; Pantoja, N.; Duarte, A.; Marengo, J. Monitoring Fires in Southwestern Amazonia Rain Forests. Eos 2006, 87, 253–259. [Google Scholar] [CrossRef] [Green Version]
  110. Alencar, A.A.C.; Arruda, V.L.S.; Vieira, W.; Conciani, D.E.; Costa, D.P.; Crusco, N.; Duverger, S.G.; Ferreira, N.C.; Fran-ca-rocha, W.; Hasenack, H.; et al. Long-Term Landsat-Based Monthly Burned Area Dataset for the Brazilian Biomes Using Deep Learning. Remote Sens. 2022, 14, 2510. [Google Scholar] [CrossRef]
  111. Arruda, V.L.S.; Piontekowski, V.J.; Alencar, A.; Pereira, R.S.; Matricardi, E.A.T. An Alternative Approach for Mapping Burn Scars Using Landsat Imagery, Google Earth Engine, and Deep Learning in the Brazilian Savanna. Remote Sens. Appl. Soc. Environ. 2021, 22, 100472. [Google Scholar] [CrossRef]
  112. Justice, C.; Giglio, L.; Korontzi, S.; Owens, J.; Morisette, J.; Roy, D.; Descloitres, J.; Alleaume, S.; Petitcolin, F.; Kaufman, Y. The MODIS Fire Products. Remote Sens. Environ. 2002, 83, 244–262. [Google Scholar] [CrossRef]
  113. Morton, D.C.; DeFries, R.S.; Nagol, J.; Souza, C.M.; Kasischke, E.S.; Hurtt, G.C.; Dubayah, R. Mapping Canopy Damage from Understory Fires in Amazon Forests Using Annual Time Series of Landsat and MODIS Data. Remote Sens. Environ. 2011, 115, 1706–1720. [Google Scholar] [CrossRef] [Green Version]
  114. Bolaño-Díaz, S.; Camargo-Caicedo, Y.; Soro, T.D.; N’Dri, A.B.; Bolaño-Ortiz, T.R. Spatio-Temporal Characterization of Fire Using MODIS Data (2000–2020) in Colombia. Fire 2022, 5, 134. [Google Scholar] [CrossRef]
  115. Wooster, M.J.; Roberts, G.J.; Giglio, L.; Roy, D.; Freeborn, P.; Boschetti, L.; Justice, C.; Ichoku, C.; Schroeder, W.; Davies, D.; et al. Satellite Remote Sensing of Active Fires: History and Current Status, Applications and Future Requirements. Remote Sens. Environ. 2021, 267, 112694. [Google Scholar] [CrossRef]
  116. Morisette, J.T.; Giglio, L.; Csiszar, I.; Setzer, A.; Schroeder, W.; Morton, D.; Justice, C.O. Validation of MODIS Active Fire Detection Products Derived from Two Algorithms. Earth Interact. 2005, 9, 1–25. [Google Scholar] [CrossRef] [Green Version]
  117. Burton, C.; Betts, R.; Cardoso, M.; Feldpausch, R.T.; Harper, A.; Jones, C.D.; Kelley, D.I.; Robertson, E.; Wiltshire, A. Repre-sentation of Fire, Land-Use Change and Vegetation Dynamics in the Joint UK Land Environment Simulator Vn4.9 (JULES). Geosci. Model Dev. 2019, 12, 179–193. [Google Scholar] [CrossRef] [Green Version]
  118. Mataveli, G.; de Oliveira, G.; Chaves, M.E.D.; Dalagnol, R.; Wagner, F.H.; Ipia, A.H.S.; Silva-Junior, C.H.L.; Aragão, L.E.O.C. Science-based Planning Can Support Law Enforcement Actions to Curb Deforestation in the Brazilian Amazon. Conserv. Lett. 2022, 00, e12908. [Google Scholar] [CrossRef]
  119. Kay, G.; Dunstone, N.J.; Smith, D.M.; Betts, R.A.; Cunningham, C.; Scaife, A.A. Assessing the Chance of Unprecedented Dry Conditions over North Brazil during El Niño Events. Environ. Res. Lett. 2022, 17, 064016. [Google Scholar] [CrossRef]
Figure 1. Location of the study area and identification of conservation units (sustainable-use areas) and indigenous lands.
Fire 06 00002 g001
Figure 2. Methodological flowchart of burned area analysis in the study region from 2003 to 2019, divided into three steps: dataset (more details in Figures S1–S8), analysis (ore details in Figures S9 and S14) and results.
Fire 06 00002 g002
Figure 3. Climate analysis of the study region, showing (a) Spatial trends for each burned area (30 m spatial resolution) between 2003 and 2019, negative values (in green) represent decreasing trends, while positive values (in red) represent increasing trends. (b) Linear Regression analysis between active fire pixels and burned area, where R2adj is the adjusted coefficient of determination. (c) Spatial trends for each rainfall anomaly (30 m spatial resolution) between 2003 and 2019. (d) Spatial trends for each temperature anomaly (30 m spatial resolution) between 2003 and 2019. (e) Temporal patterns of oceanic indices (AMO and MEI) and their influence on rainfall anomalies for the period from 2003 to 2019. (f) Temporal patterns of oceanic indices (AMO and MEI) and their influence on temperature anomalies for the period from 2003 to 2019. (g) Temporal patterns of oceanic indices (AMO and MEI) and their influence active fire anomalies for the period from 2003 to 2019. (h) Temporal patterns of oceanic indices (AMO and MEI) and their influence burned area for the period from 2003 to 2019. Red and blue bars indicate positive and negative anomalies, respectively, for all variables.
Fire 06 00002 g003
Figure 4. Spatial trends for each burned area (30 m spatial resolution) between 2003 and 2019, negative values (in green) represent a decreasing trend, while positive values (in red) represent an increasing trend. The variation in the burned area by land-use category from MapBiomas is shown. The graphs to the left show the relative burned area by burned-area size and the graphs to the right show the absolute burned area (km2).
Fire 06 00002 g004
Figure 5. (a) Fire recurrence analysis (years) in the study region for the period from 2003 to 2019, and (b) spatial trends for each burned area (30 m spatial resolution) between 2003 and 2019; negative values (in green) represent a decreasing trend, while positive values (in red) represent an increasing trend and (c) land-use from 2003 to 2019 with cumulative deforestation.
Fire 06 00002 g005
Figure 6. (a) Spatial trends for area (30 m spatial resolution) between 2003 and 2019, negative values (in green) represent at decreasing trend, while positive values (in red) represent an increasing trend. (b) Spatial trends for area (30 m spatial resolution) between 2003 and 2019, negative values (in green) represent at decreasing trend, while positive values (in red) represent an increasing trend. (c) Burned area in old deforest areas from 2003 to 2019 in the study region. (d) Burned area in new deforest areas from 2003 to 2019 in the study region3.4. Fire Extent and Land Tenure.
Fire 06 00002 g006
Figure 7. Spatial trends of the burned area between 2003 and 2019. Negative values (close to green) represent a decrease in the trend, while positive values (close to red) represent an increase in the trend. The spatial trends are shown overlapping (a) protected areas, (b) rural “properties” (c) rural “properties” and undesignated public forests.
Fire 06 00002 g007
Figure 8. (a) Burned area in legal reserves and permanent preservation areas in the study region from 2003 to 2019 and (b) burned area in the undesignated forest and fire occurrence attributed to “rural properties”.
Fire 06 00002 g008
Disclaimer/Publisher’s Note: The statements, opinions and data contained in all publications are solely those of the individual author(s) and contributor(s) and not of MDPI and/or the editor(s). MDPI and/or the editor(s) disclaim responsibility for any injury to people or property resulting from any ideas, methods, instructions or products referred to in the content.

