Article

Multi-Objective Scheduling of Fuel Treatments to Implement a Linear Fuel Break Network

1
Department of Forest Engineering, Resources and Management, Oregon State University, Corvallis, OR 97331, USA
2
USDA Forest Service, Rocky Mountain Research Station, Missoula Fire Sciences Laboratory, Missoula, MT 59808, USA
*
Author to whom correspondence should be addressed.
Submission received: 19 October 2022 / Revised: 12 December 2022 / Accepted: 14 December 2022 / Published: 20 December 2022
(This article belongs to the Section Fire Science Models, Remote Sensing, and Data)

Abstract

:
We developed and applied a spatial optimization algorithm to prioritize forest and fuel management treatments within a proposed linear fuel break network on a 0.5 million ha Western US national forest. The large fuel break network, combined with the logistics of conducting forest and fuel management, requires that treatments be partitioned into a sequence of discrete projects, individually implemented over the next 10–20 years. The original plan for the network did not consider how linear segments would be packaged into projects and how projects would be prioritized for treatments over time, as the network is constructed. Using our optimization algorithm, we analyzed 13 implementation scenarios where size-constrained projects were prioritized based on predicted wildfire hazard, treatment costs, and harvest revenues. We found that among the scenarios, the predicted net revenue ranged from USD 3495 to USD 6642 ha−1, and that prioritizing the wildfire encounter rate reduced the net revenue and harvested timber. We demonstrate how the tradeoffs could be minimized using a multi-objective optimization approach. We found that the most efficient implementation scale was a sequence of relatively small projects that treated 300 ha ± 10% versus larger projects with a larger treated area. Our study demonstrates a decision support model for multi-objective optimization to implement large fuel break networks such as those being proposed or implemented in many fire-prone regions around the globe.

1. Introduction

Linear fuel break networks are used by land managers to decrease the extent of large fires and ultimately, reduce wildfire-related losses [1,2,3,4,5]. Linear fuel breaks fragment landscapes with bands of reduced fuel that are used as control lines from which to carry out suppression operations [6,7]. The creation of effective linear fuel break segments requires the delineation of the connected network segments across landscapes. This is a rigorous process that combines local expertise and spatial analyses to identify efficient fuel break network designs [7,8,9,10]. Multiple aspects are considered when locating segments of the fuel break network, including access, terrain, and vegetation [4,11,12,13,14]. Once built, there are additional considerations for re-treatment rates to maintain low fuel loadings across time [15,16].
A wide range of decision support tools have been applied to the problem of designing and testing the effectiveness of fuel breaks, although studies that have examined the problem from a linear network perspective are rare [7]. For instance, many studies have analyzed the effectiveness of fuel breaks, either dispersed or arranged linearly, using fire spread models to analyze treatment effects, including models such as FARSITE, FlamMap, FSim [17,18], FConst MTT [6,19,20], BURN-P3 [21], and Cell2Fire [22]. These models are used in planning frameworks to evaluate multiple landscape fuel break scenarios and to analyze tradeoffs [7,23,24,25,26]. A few studies have focused specifically on the design of optimal linear fuel break networks using mathematical programming models [27,28,29]. Models to test linear fuel break designs have considered the rate or probability of the success of the fuel break segments [20,30]. In general, these and other studies suggest that fuel break networks are effective in terms of reducing fire spread, although empirical data point to the need for suppression resources to actually stop the fire [4]. Both dense vegetation and extreme weather conditions contribute to the failure of fuel breaks under real-world conditions [31,32].
Despite a large number of studies testing the effectiveness of fuel break networks, as well as government proposals to build new or expand existing networks [7,33], there are few, if any, decision support tools to prioritize project areas (i.e., sub-networks) and the treatments within them to create the proposed networks. For instance, in Portugal, 3538 km of proposed linear fuel breaks have been mapped, but prioritizing specific segments for treatment from a cost and fire management standpoint has received little attention [20]. Studies that demonstrate models to optimize the implementation sequence and identify economic and fire management tradeoffs for prioritizing sub-networks within the larger networks are lacking, despite a large amount of literature on spatial forest planning [34,35].
In this study, we demonstrate a new modeling framework to prioritize treatments and sequence project areas to implement a large linear fuel break network within a fire-prone Western US national forest. Local fire management staff mapped a 3300 km network within the national forest, considering terrain, roads, and suppression difficulty. The bulk of the network will require forest and fuel management for the fuel breaks to serve their intended purpose, and thus, the forest must now formulate priorities, estimate costs, and build a strategic implementation plan. To support this effort, we modeled a range of spatially explicit treatment scenarios optimized for single and multiple objectives, including predicted wildfire hazard, treatment cost, and harvest revenue. We used these outputs to identify optimal implementation sequences of projects and treatment segments. We discuss how the process can provide land management organizations with a broad understanding of tradeoffs among different prioritization schemes and provide a detailed schedule of projects and treatments over time, with the specificity to identify the capacity and funding required to implement the proposed networks.

2. Materials and Methods
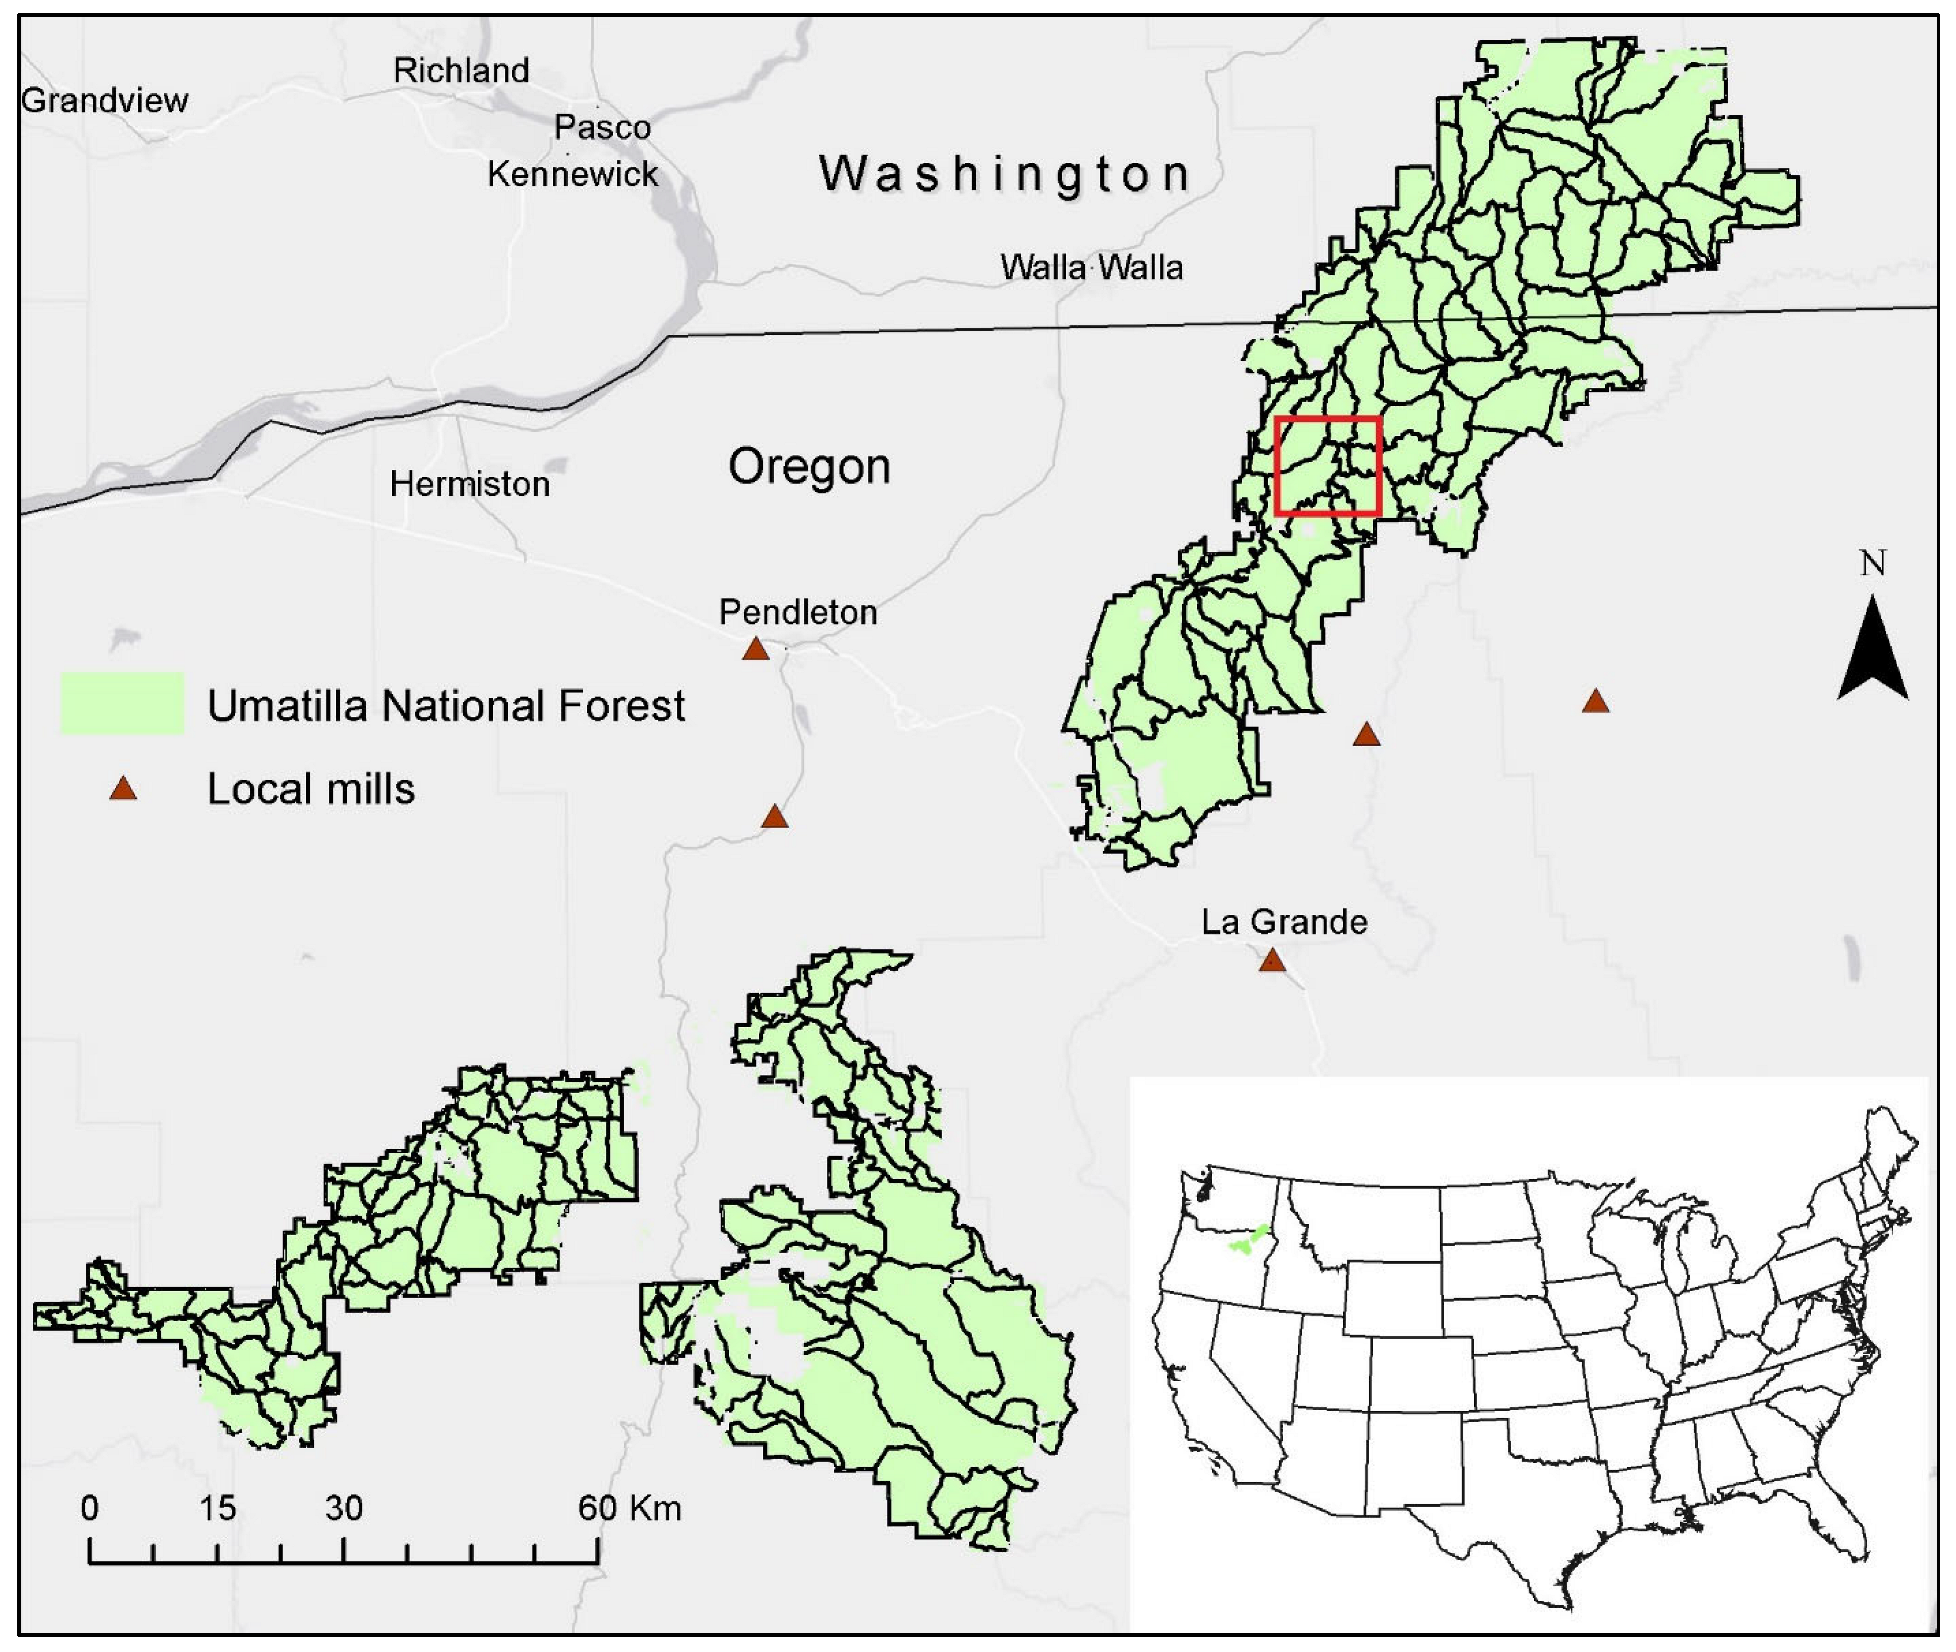
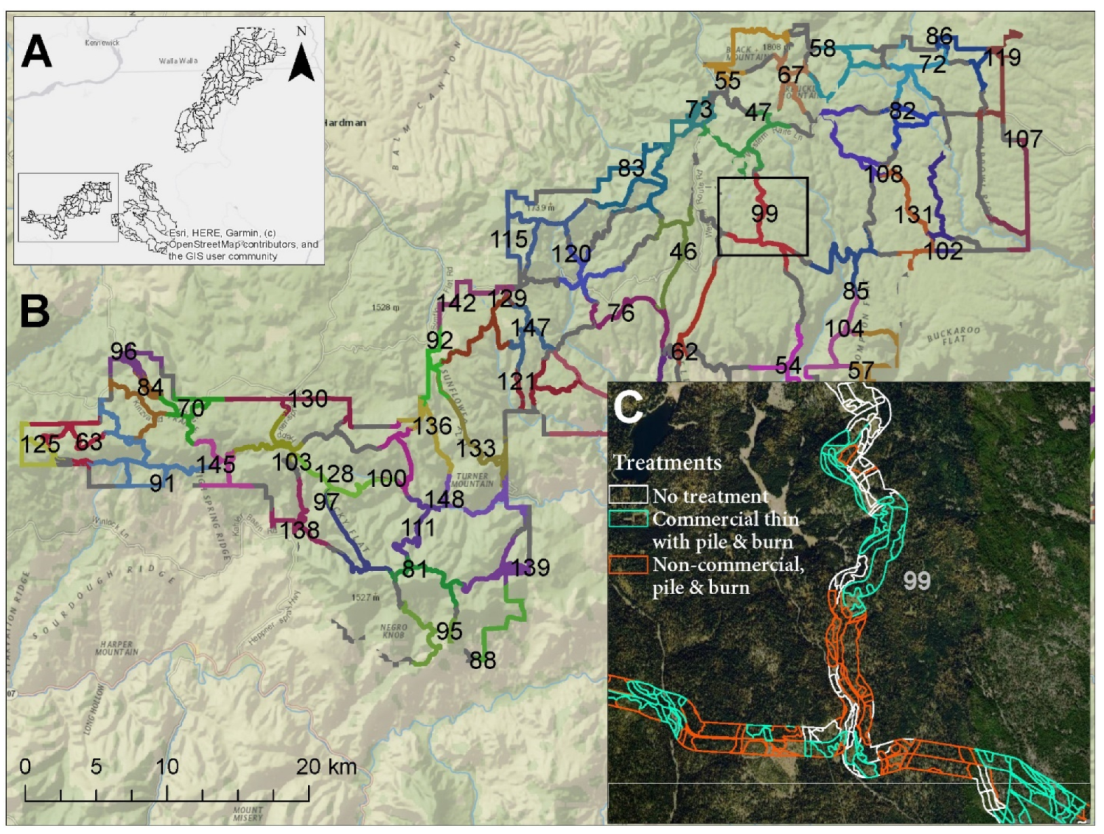
2.1. Study Area

The study area was the 520,000 ha Umatilla National Forest (Umatilla NF) located in the Blue Mountains ecoregion [36] within northeast Oregon and southeast Washington states (Figure 1). Elevations generally range from 900 m to 1500 m, with higher peaks close to 3000 m. Dry forests of ponderosa pine (Pinus ponderosa Lawson & C. Lawson) dominate the lower elevations, with dry mixed conifer—grand fir (Abies grandis (Douglas ex D. Don) Lindl) and Douglas-fir (Pseudotsuga menziesii (Mirb.) Franco)—at higher elevations. Cold dry forested areas are dominated by lodgepole pine (Pinus contorta Douglas ex Loudon) at higher elevations. About 4961 ha (1%) burn annually, predominantly due to lightning-caused wildfires (1992–2020) [37].

2.2. Fuel Break Network

The Umatilla NF designed a fuel break network (FBN) in the year 2020 using regional guidelines and expert opinion from local fire management staff. The FBN consisted of segments located primarily along ridgetops and roads, with an intended buffer for fuel treatments on both sides of the 3315 km length that included grasslands, non-burnable areas, and conifer forests. The intended width of the FBN was 300 m (150 m per side), aligning with legislation [38] that maximizes fire crew safety and success rates, and consistent with other programs elsewhere [38,39,40,41]. The FBN included fuel break sections within protected areas where mechanical treatments are prohibited. However, these will not be implemented due to administrative restrictions that prohibit mechanical fuel management [42]. About a 50,000 ha portion of the Umatilla NF has been prioritized for watershed-level restoration as part of the five-year forest action plan [43], and the fuel breaks for these areas were not considered for prioritization. Network density was about 0.5 km per km2 (5 m per hectare) over the 225,819 ha portion of the Umatilla NF where the network is being implemented.

2.3. Forest Vegetation

We intersected the FBN with the landscape stand polygon layer maintained by the Umatilla NF to identify the portions of treatment stands within the FBN (Figure 2). The stand boundaries were originally delineated from photo interpretation and followed natural breaks in vegetation type and changes in stand structure from past management activities and disturbances. The landscape stand layer contains a total of 63,241 non-forested and forested stands, which were clipped to the FBN, resulting in a network containing 22,166 interconnected potential fuel break treatment units covering 67,500 ha. Within this area, we excluded upland hardwoods and shrublands, leaving 54,198 forested ha (80% of the network) available as potential candidates for fuel break treatments. Areas that were not available for treatments corresponded to mostly grass and basalt scab flats common in much of the Umatilla NF. Inventory data for each stand was obtained from a corporate USDA Forest Service spatial database on the Umatilla NF. These data consisted of tree density, species, and size class in 2.54 cm increments [44].

2.4. Fuel Break Treatments

Forest and fuel treatments were assigned using stand thresholds developed in collaboration with Umatilla NF staff (Table 1). Treatment intensity, in terms of removals, was dependent on existing canopy cover (CC) percentage and fuel loadings. In short, stands were eligible for thinning if the stand canopy cover exceeded 15% (pers. comm. Don Justice, Umatilla NF). Thinning was from below (small trees first) until the post-thin CC was 15%, as per the practice in the Blue Mountains fuel break projects ensuring that stands have less than a 0.10 crown bulk density [45]. Thinning from below prioritized the removal of smaller trees of targeted fire-intolerant species (e.g., grand fir) and reduced ladder fuels to prevent torching and crowning fire behavior. The maximum tree size for harvest was set at 53.3 cm to meet late-old structure (LOS) objectives, as specified in local harvest guidelines [46,47]. The thinning was simulated in two steps until the CC was reduced to 15%. In the first step, all available species (< 53.3 cm) were removed until the CC was reduced to 15% of the stand. Then, if the CC was still greater than 15%, the second step removed grand fir trees between 53.3 cm and 76.2 cm until the CC was reduced to 15% of the stand. If the CC of the stand was still greater than 15% after the second step, all trees less than 53.3 cm and all grand firs under 76.2 cm would be removed. Surface fuel treatments were of the pile and burn type, consisting of a hand or machine piling of harvest residue and downed woody material [48], which is widely practiced on the Umatilla NF. Non-forested stands of grass-shrub lands were not assigned to receive treatment. All treatments were simulated with the Forest Vegetation Simulator (FVS), Blue Mountains variant [44]. The pile and burn treatments were simulated using the FuelMove keyword, which has the same effect as the pile burn process in terms of removing fuels from the site.

2.5. Financial Valuation

Outputs from FVS included the population of cut trees from each treated stand by DBH, species, and total merchantable volume. These data were post-processed with the FVS economics extension to cut the trees into logs and calculate the small end diameter required for financial valuation. In essence, logs are valued by the diameter of the small end, which is not reported in standard FVS outputs. We used the LANFIN keyword file developed by Vogler et al. [49] for this process.
Parameters for costs and revenue were obtained from local timber sale and fuels treatment transaction data on the Umatilla NF. We did not consider extraneous project implementation costs, such as road reconstruction or decommissioning, since most of the proposed FBN was co-located with established roads. We used the economic extension of FVS to convert modeled harvest volume outputs into logs of specific sizes and species [50]. Corresponding average pond values (USD m−3) ranging from USD 71 to USD 101 were collected from timber sale specialists on the Umatilla NF and used to calculate the total value of delivered logs from each stand. Log pond values were only calculated for stands that generated ≥ 35 m3 ha−1 of merchantable timber, assuming stands producing less were not commercially viable. Although harvesting operations along the roads might include these stands with lower volume, in practice, the assumptions provided consistency with prior studies that prioritized the Umatilla NF for restoration projects [51].
Harvest cost (USD m−3) ranging from USD 10 to USD 110 was calculated based on the slope and tree size class, consistent with methods used in previous studies [52,53]. A ground-based harvesting system and associated costs were assigned for stands having a slope ≤ 35%, and a cable harvesting system was assigned for all stands that exceeded the 35% threshold. The average slope per stand was calculated from digital elevation data, with a resolution of 30 m. If thinning was not commercially viable (i.e., volume removal < 35 m3 ha−1), it was assumed to be a non-commercial thinning, incurring costs of USD 1600 ha−1. The cost of the pile and burn method was assumed to be USD 1110 ha−1.
Timber hauling costs from individual stands to the nearest wood processing facility were estimated using the road network consisting of approximately 750,000 road sections, which were classified by driving speed. Round-trip travel time between each stand and the nearest processing facility was computed for the shortest path, using travel distance and speed [54]. One additional hour of delay time was added for loading, unloading, and wait times. Round trip costs per one cubic meter of timber were then estimated using travel time, the truck hourly cost of USD 100, and the truckload capacity of 12 m3. Net revenue was calculated as the difference between the value of the logs delivered to the mill minus all the other costs associated with thinning and surface fuel treatments.

2.6. Wildfire Hazard

We used wildfire simulation raster outputs generated with the FSim [18] model, as part of prior work on the Umatilla NF [55]. FSim captures spatial characteristics regarding topography, surface fuels, and historical weather conditions to quantitatively assess wildfire hazards [56]. FSim uses an ignition density grid to indicate the spatial likelihood of large-fire occurrence, regardless of ignition source. We measured wildfire hazard as the probability of a fire with a flame length greater than 1.25 m, a threshold at which direct attack is avoided in fire suppression operations due to crown fire occurrence. Testing revealed that the prioritization results were relatively insensitive to higher or lower thresholds. This particular hazard metric has been described and used in other studies [57,58]. Wildfire hazard (Haz) was calculated using the flame length probability outputs that report the conditional probability of a fire of a given flame length category in 20 0.5 m classes. Wildfire hazard was then calculated by summing the flame length weighted conditional probabilities from the flame length classes above 1.25 m and then multiplying by the annual burn probability for the pixel.
H a z = F L i = 1.25 F L i > 20 B P i x F L i
where FLi is the flame length midpoint of the ith category, and BPi is the annual burn probability.
We transferred the calculated raster pixel values for wildfire hazard to the fuel break treatment units and multiplied the area to create a metric that measured the area-weighted hazard, henceforth, fire hazard.

2.7. Treatment Unit Aggregation for Project Areas

We modified the ForSysR package ‘Patchmax’ [59] to aggregate treatment units (forest stands within the FBN) into project areas, maximizing one or multiple objectives. Patchmax is a multicriteria spatial planning model developed to explore landscape management scenarios for forest restoration. Patchmax was specifically modified to sequence multi-objective optimal project areas, found by minimizing the Euclidean distance from the maximum possible objective values, as described with linear equations in the work of Diaz-Balteiro et al. [60]. Patchmax employs the breadth-first search (BFS) algorithm [61] to explore combinations of adjacent treatment units and build potential optimal project areas. During the first iteration, the algorithm considers each of the treatment units as a seed polygon that links to the adjacent units, growing a project configuration of desirable size. Among all resulting feasible projects, the one with the highest objective contribution (i.e., lower deviations from the maximum objective values) is identified and removed from further consideration, and this process is repeated until a desired number of optimal project areas is met. Here, multi-objective optima (Equations (2)–(6)) are found by searching the objectives obtained in the feasible project configurations, as described above, and identifying the one that minimizes the Euclidean distance between the absolute optimum objective values achieved for a particular project. Equations (2) and (3) are used to calculate the total deviation from the optimum objective values of each feasible project p. Equation (4) calculates the contribution of treatment units t to the objective values of each project. Equations (5) and (6) are the treatment area constraints that allow a deviation of 10% from the treated area target per project. The user supplies a scenario in terms of objectives (e.g., maximize net revenue and fire hazard) and constraints (e.g., project area size, stand treatment thresholds), and the model outputs a sequenced prioritized set of project areas and identifies treatment units within them, as well as the associated objective contribution.
D = O b j = 1 j d p j
d p j = v p j v j m a x
v p j   =   t = 1 t p c t j x t p
t = 1 t p a t x t p 1.1   P r j a r e a
t = 1 t p a t x t p 0.9   P r j a r e a
where d p j is the deviation for the p t h feasible project from the maximal j t h objective value, v p j is the objective value for the p t h feasible project for the j t h objective, v j m a x is the maximum observed value among all feasible project configurations for the j t h objective, tp is the total number of available treatment units in the study area for project p, x is a binary vector indicating whether the tth treatment unit is included in the project p ( x t p = 1) or not ( x t p = 0), ctj is the contribution of the tth treatment unit to the j t h objective, at is the area of the tth treatment unit, and P r j a r e a   is the project treatment area target.

2.8. Scenarios

We simulated 13 scenarios, or project strategies, that collectively examined the effect of different project objectives and treatment areas on prioritization outcomes when treating 40,000 ha, or ca. 75% of the available forested fuel break network (Table 2). Treating more than 75% of the FBN resulted in scenarios where the 1000 ha per project treatment constraint could not be met, and for smaller projects, these lowest ranking projects were of low value and did not contribute substantially to any of the priority objectives. Each scenario maximized one of the following objectives, or a combination of objectives using our multi-objective approach, as previously described: net revenue (revenue), merchantable volume (volume), and fire hazard (hazard). Then, we varied the treatment area per project by constraining the total to 100, 300, 600, and 1000 ha ± 10% to understand how the scale of project implementation affected objective attainment. For instance, environmental planning on national forests allows for a wide range of project sizes, although administrative and legal efficiencies are associated with specific project sizes and associated treated areas. We focused on the scenarios with a 300 ha treatment area per project to examine the tradeoffs and the efficiency of multi-objective solutions. We saved all intermediate feasible project configurations generated by Patchmax to examine the tradeoffs between objectives. Feasible project configurations are generated when Patchmax tests each treatment unit as a seed polygon to grow a project in the adjacent treatment units. These latter solutions were then prioritized to examine production frontiers and analyze optimum multi-objective projects.

3. Results

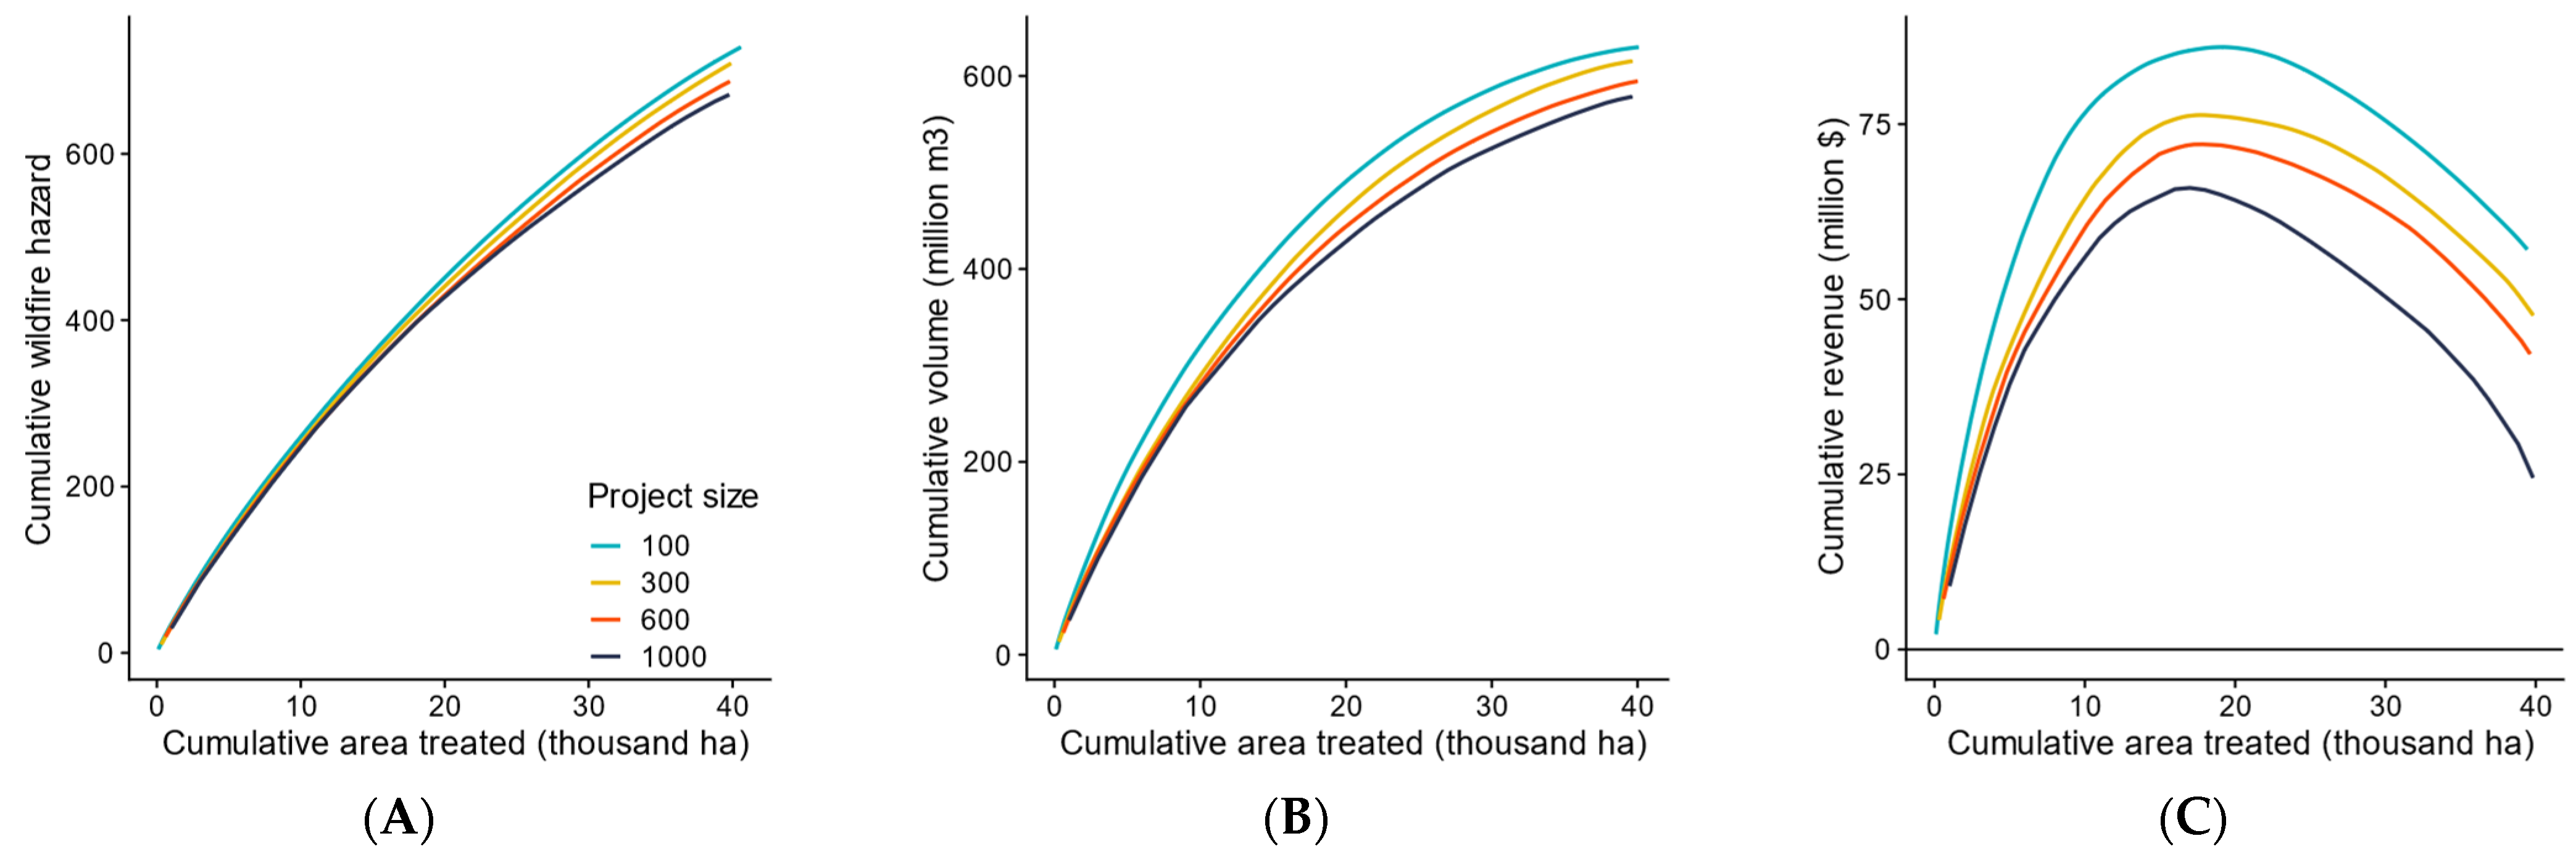
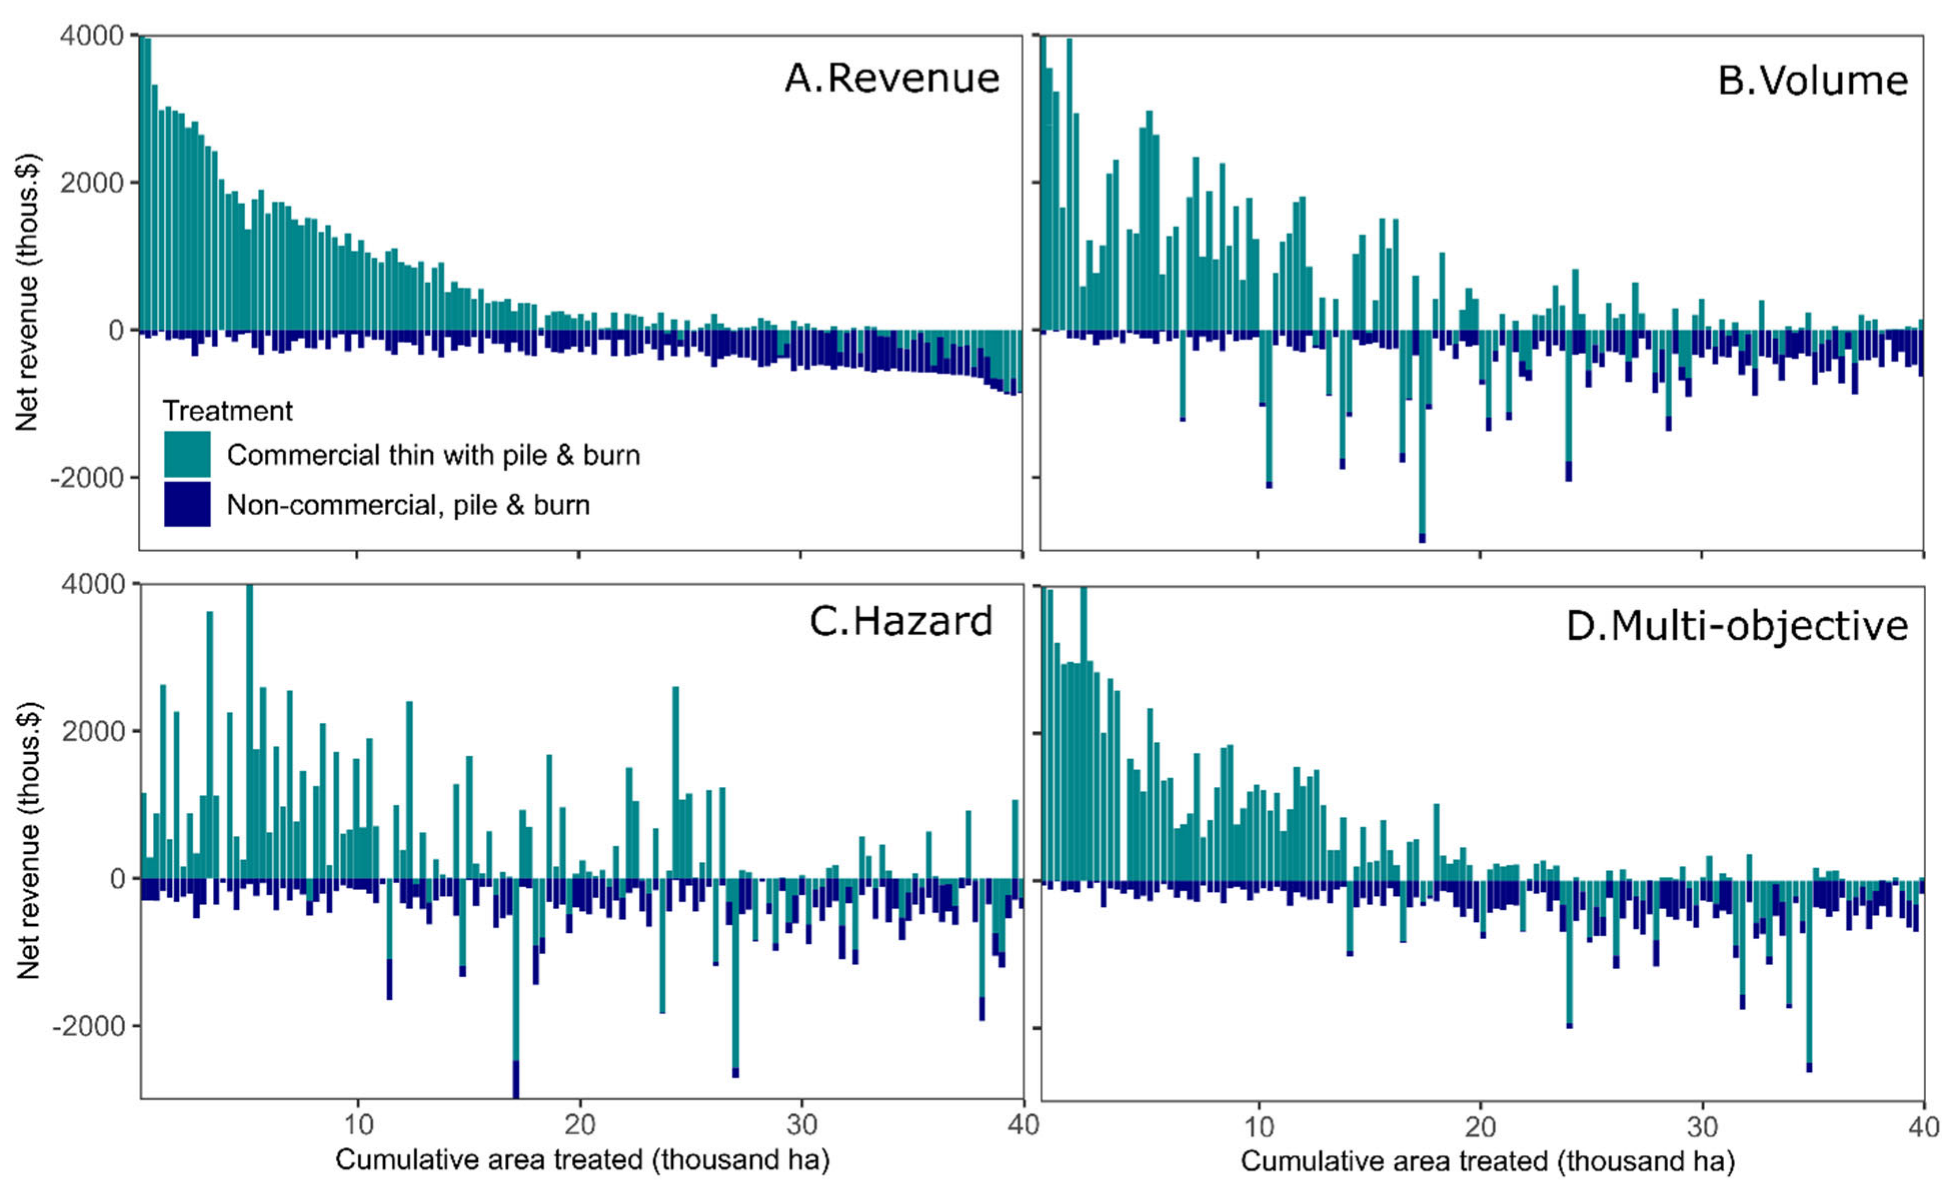
3.1. Effect of Treatment Area Per Project on Objective Values

To examine the effect of treatment area per project on the outcomes, we simulated scenarios to build the complete network, while varying the area treated per project (Table 2). The results showed that the area treated per project only had a minor impact on the objective values when considered on a per-hectare basis. Figure 3 shows the efficiency of treated area per project when cumulatively assessing objective attainment across treatment implementation. Increasing treatment area per project from 100 to 1000 ha proportionally reduced the number of projects required to complete the total treated area of 40,000 ha and decreased the per area objective value. Wildfire hazard resulted in smaller cumulative differences due to the abundance and distribution of high-hazard units in the study area, making it easier to build efficient spatial projects. Based on the high efficiency in terms of the objective achieved per ha treated and additional input from the Umatilla NF staff, we chose the 300 ha treatment area per project for subsequent sensitivity analysis.

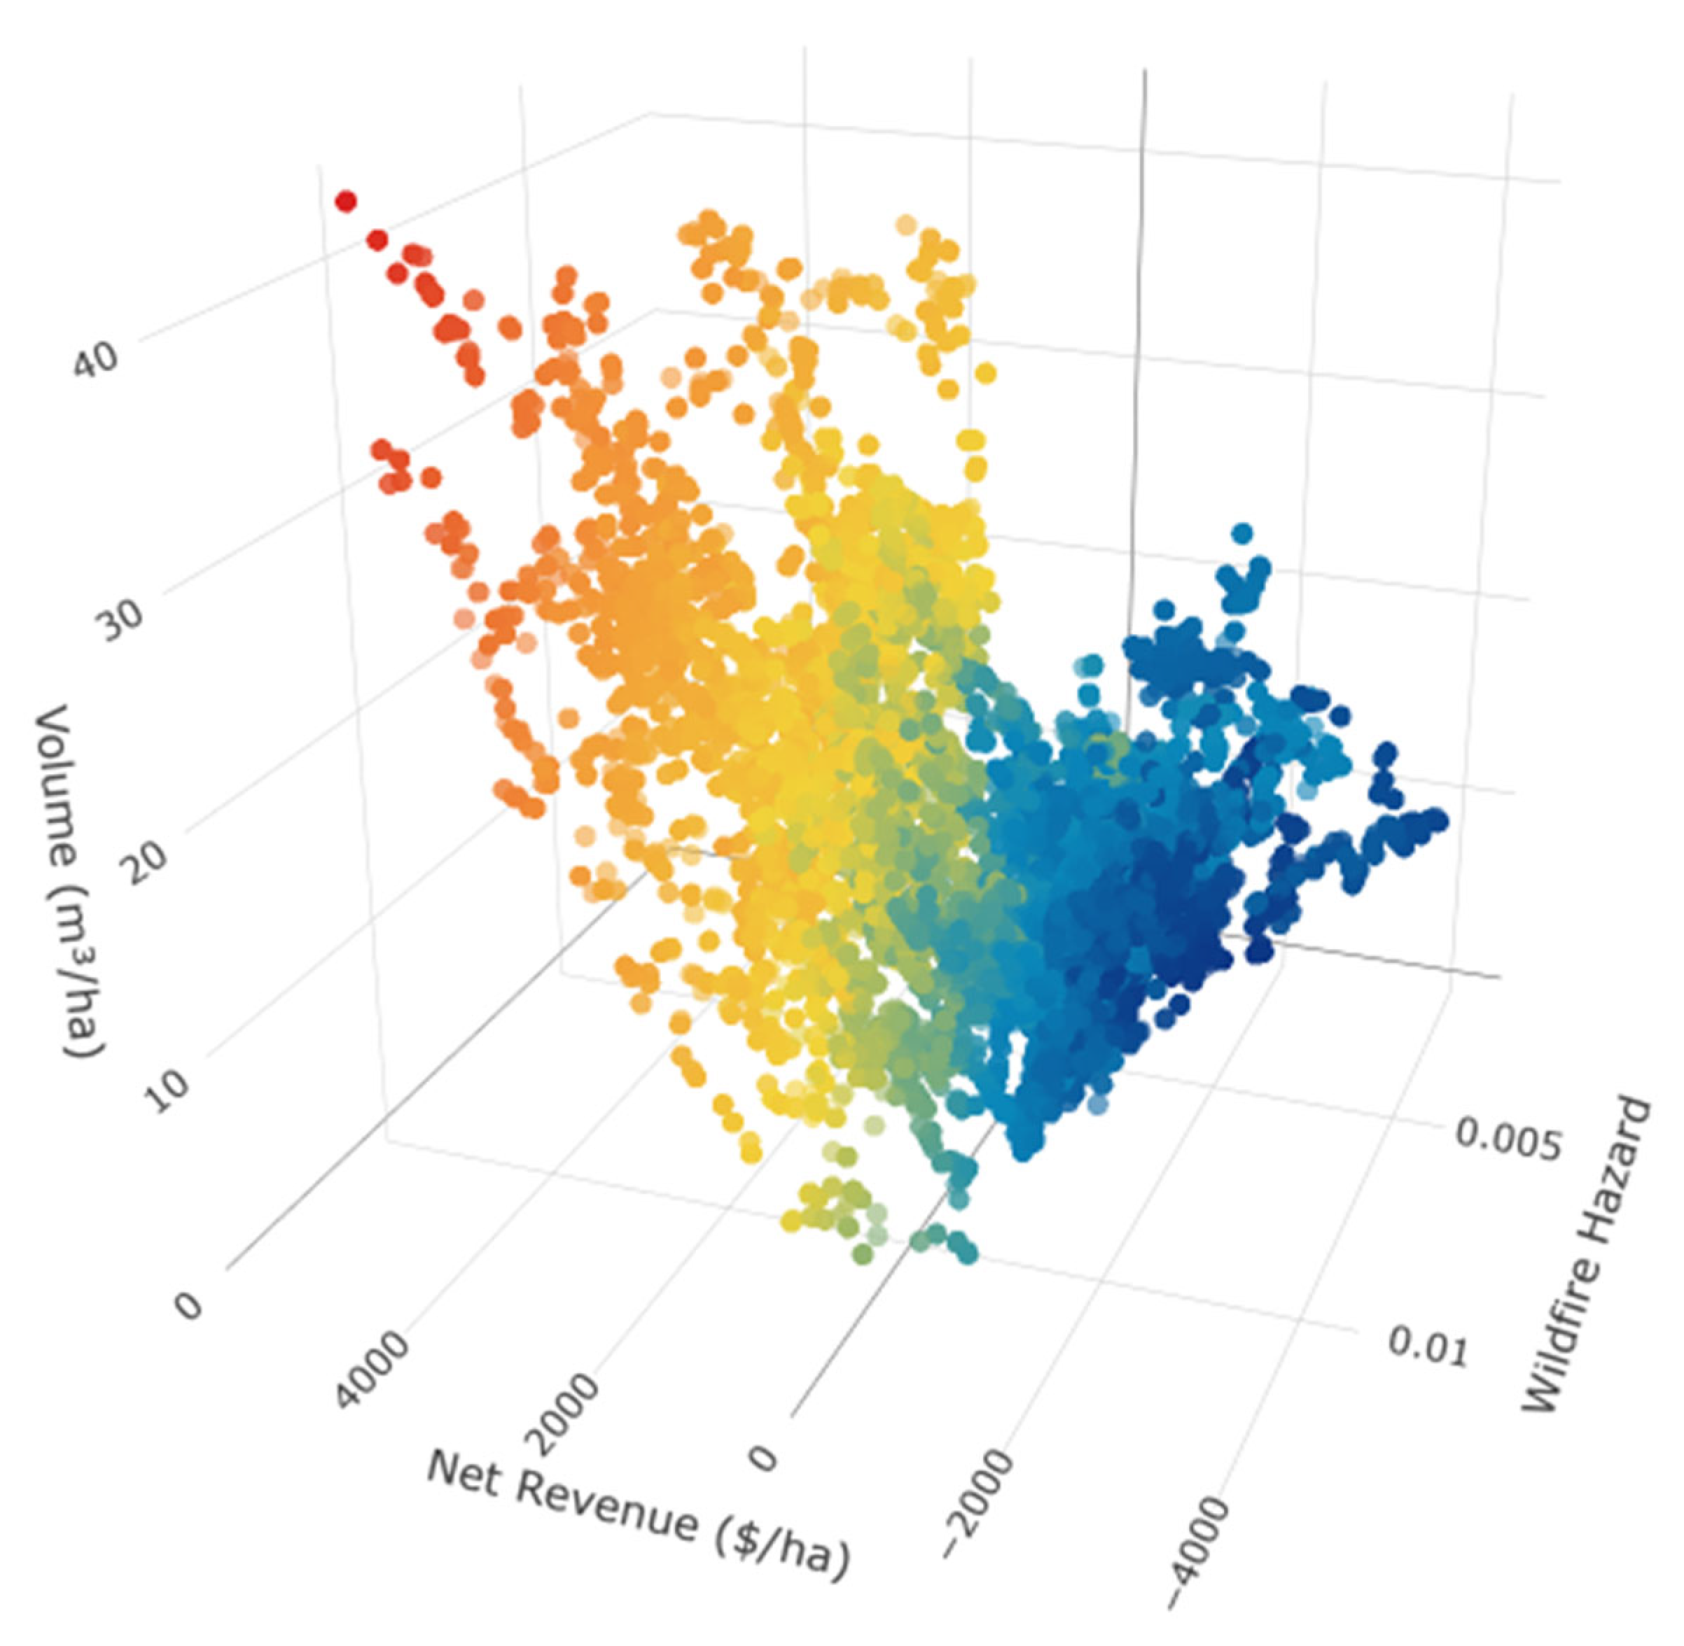
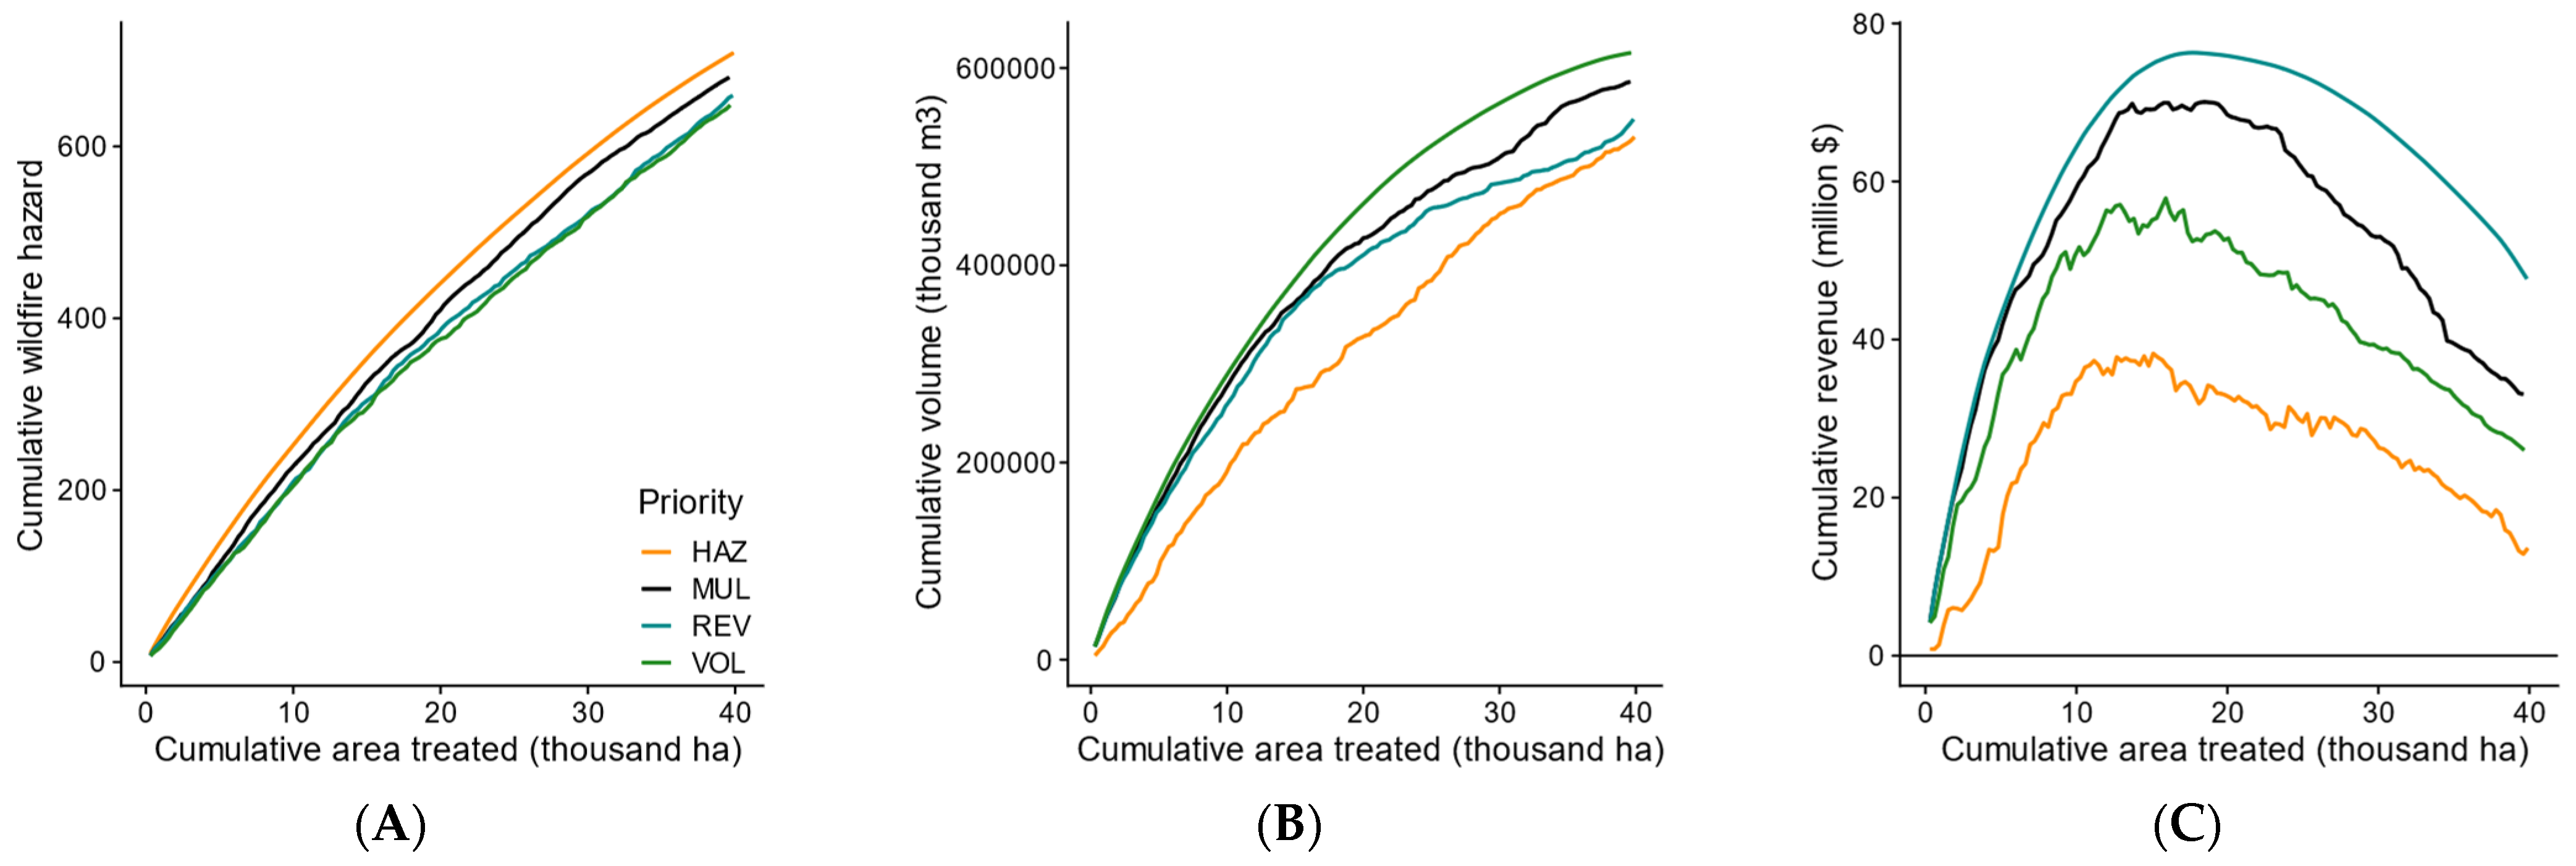
3.2. Tradeoffs between Fire Hazard and Revenue

Figure 4 and Figure S1 show the tradeoffs between 300 ha feasible project configurations that were tested as part of identifying optimal single and multi-objective solutions. Our scenarios are subsets of non-overlapping projects that were sequenced, depending on the priority objectives (i.e., single and multi-objective). From the total number of over 20,000 simulated projects with 300 ha treated areas, only 11,083 of the solutions (50%) generated positive net revenue, with a maximum of USD 6642 ha−1. The harvested merchantable volume ranged from <1 to 43 m3 ha−1, with 6072 (27%) of the projects producing more than 20 m3 ha−1. In contrast, simulated projects were more effective at treating high hazard stands, as measured by the number of projects that exceeded 50% of the optimal solution (11,340, 51%). The proportion of total projects that substantially contributed to multiple objectives was relatively small, with 4690 solutions (21%) contributing to all three objectives (i.e., generating positive net revenue, expressing more than 20 m3 ha−1 of merchantable volume, and exceeding 50% of the maximum fire hazard solution).

3.3. Optimizing Potential Revenue Treatments

Figure 5 shows the treatment prescriptions required to implement the optimal projects for the 300 ha scenario that generated the highest revenue out of the 20,000 simulated project solutions. The max revenue scenario resulted in 59 projects with a positive net revenue, compared to 42 for the multi-objective scenario (Figure 5D). The higher revenue for the former scenario resulted from the selection of a larger proportion of profitable commercial thinning treatments. The revenue surplus from commercial thinning decreased in the highest-priority projects in the scenario that optimized the treatment of high-hazard units (Figure 5C).

3.4. Multi-Objective Scenario

The multi-objective scenario generated the smallest reduction in attainment compared to the single objective for all three objectives examined (Figure 6). For example, the best-performing scenario for revenue was the scenario that maximized revenue, but the second-best was the multi-objective (Figure 6C). Similarly, the wildfire hazard scenario resulted in only a slight improvement compared to the multi-objective scenario, but also resulted in the largest reductions in volume and revenue. The multi-objective scenario was therefore, near optimal, regardless of the single objective. Thus, the multi-objective function was able to schedule the most efficient projects to contribute to all objectives simultaneously, unlike the other cases in which scheduled projects maximized one single objective.
These scenarios also illustrated a steep tradeoff between financial and fire hazard objectives (Figure 6C), showing that projects with high fire hazard objective contribution do not necessarily generate positive net revenue. As projects were implemented in the max revenue scenario, the decline in revenue was steeper compared to that of the multi-objective scenario. Non-profitable commercial thinning is the most expensive treatment, but contributed significantly to treatments targeting fire exposure and harvested wood. The multi-objective scenario scheduled projects with a larger proportion of non-profitable commercial thinning more regularly to balance the objectives. Figure 7 illustrates project number 99 from the multi-objective scenario treating 122 ha (40%) with commercial thinning using the pile and burn method and 178 ha (60%) using non-commercial thinning and the pile and burn method, resulting in a net revenue of USD 412 thousand and USD 142 thousand, respectively.

4. Discussion

We described the development and application of a new multi-objective decision support model to prioritize a large fuel break network on a fire-prone Western US national forest. The model fills a void in the operational fuels planning community where the current prioritization of linear fuel breaks is largely, if not entirely, based on subjective evaluation and expert opinion. Although we do not discount the value of expert opinion from wildfire planners on the location of fuel breaks, broad scale (e.g., 500,000 ha) understanding of priorities, tradeoffs, and economic factors requires landscape scale scenario planning models to efficiently schedule projects and treatments and to predict outcomes. Our new algorithm sequenced and optimized projects for the study area in less than 5 seconds per optimized scenario and was implemented in an globally available open source programing platform [62].
Prioritization is an important process in the implementation of forest and fuel management programs due to administrative, legal, and operational constraints that require subdividing and scaling activities to create project areas. In contrast to our prior work on simulating spatial landscape restoration projects with Patchmax (Belavenutti et al. 2022), we modified the evaluation function to sequence multi-objective optimal project areas and also saved the entire population of project solutions for a given scenario, rather than just identifying and analyzing the most optimal scenarios concerning one or more objectives. The purpose of this was to provide additional information to assess how capable the optimization was in leveraging the algorithm to pinpoint projects in a way that optimized multiple objectives. The importance of identifying the feasible solutions within pareto frontiers and the efficiency of multi-objective (i.e., goal programming) techniques for multicriteria decision making has been discussed in previous studies [63,64,65].
Our results showed significant tradeoffs between financial and fire management objectives and revealed that the multi-objective approach degrades the attainment of individual objectives, while offering a robust global solution. Tradeoffs such as these have been reported elsewhere [66,67]. Our scenarios maximizing either volume or revenue were also effective for treating wildfire hazard, since overstocked stands in the study area were typically also rated as high fire hazard due to excessive surface and canopy fuels. Prioritized projects aggregated fuel break subunits with different treatment compositions, including a variety of non- and commercial thinning. Our simulation method essentially exploited the spatial variation of treatment subunits on the landscape to design projects, rather than simply ranking treatments according to their objective contribution, as observed with predefined project areas (i.e., individual fuel break sections) in previous studies [19,20]. The results also show that implementing many smaller projects is more efficient than conducting fewer large projects in increasing the rate of attainment in the earlier phases of implementation. This latter result is not surprising, but the performance reduction with an increase in the area treated per project has previously not been analyzed, and it is an important consideration when designing future management scenarios to respond to growing wildfire risks and other threats. However, there are many other efficiencies of scale, both economic and administrative, that also need to be considered along with the attainment of primary project objectives when determining the most efficient project sizes.
One limitation of our study is that the priority of specific planned fuel break projects will be altered over time by the implementation of nearby fuel breaks, restoration projects, and wildfires. Forest managers can identify areas where extreme or impactful wildfires will likely occur, but specific fire perimeters are more difficult to predict due to the uncertainty regarding future ignitions and weather forecasts [68,69,70]. These unpredictable wildfires will intersect with projects before or after implementation, suggesting that any long-term plan (+10 years) will undergo significant revision during its implementation [71]. This requires forest managers to adjust the planned projects after identifying significant changes in landscape conditions. It is expected that implemented projects will alter fire exposure in the same vicinity of the fuel break network because fuel break projects are designed to facilitate suppression resources that will contain the fire, preventing it from spreading to other areas. Whether or not this is a real limitation in the modeling depends on how close the fuel break sections are from each other and the sequence of implementing projects that have interdependent fire exposures [20]. Our assessment of the space–time sequence of the optimized fuel break network is included in Figure S2. Further research is needed to extend our modeling framework to reevaluate fire hazard objective values with fire spread models each time a project is implemented in the simulation. Previous studies developed decision support tools with potential adjustments for this problem, such as the method of Chung et al. [23] that implemented the OptFuels system, a heuristic process that integrates FVS and FlamMap with a treatment optimization module for spatial projects that included the timing of fuel treatments, while considering changes in forest conditions, such as forest growth, wildfire behavior, and spread, over time. Forest landscape models such as LSim [72] considered the dynamics of wildfire and treatments over time, and the current work can be implemented into this system as the treatment scheduling module to optimize treatments under uncertain wildfire events and a changing climate. For instance, Mina et al. [73] used the forest landscape model LANDIS-II to simulate climate-smart management policy scenarios that promote warm-adapted species, but the system lacks a treatment optimization module.
There are many avenues for further research on fuel break networks and their application across a wide range of fire frequent ecosystems. Questions relating to network density, width, location, effectiveness, and financial cost all need to be addressed with empirical and simulation studies. Optimal network densities from a cost and fire management standpoint [74] may exist, as identified by diminishing returns for implementing proposed networks in their entirety. The co-prioritization of linear fuel breaks with landscape restoration and forest health treatments on US federal forests [75] will also be a challenging problem for planners, and case studies are needed that demonstrate the effective coupling of alternative treatment strategies [76]. Future work along these lines will facilitate the work of many government organizations tasked with designing long-range fuel treatment strategies to address wildfire risk in a wide range of fire frequent ecosystems.

Supplementary Materials

The following supporting information can be downloaded at: https://www.mdpi.com/article/10.3390/fire6010001/s1, Figure S1: Plot of the 22,166 different 300 ha feasible project configurations; Figure S2: Our assessment of the space-time sequence of the optimized fuel break.

Author Contributions

P.B.: conceptualization, methodology, validation, formal analysis, writing—original draft; A.A.A.: resources, conceptualization, writing—review and editing, supervision; M.A.D.: conceptualization, writing—review and editing, supervision; W.C.: conceptualization, writing—review and editing, supervision. All authors have read and agreed to the published version of the manuscript.

Funding

This work was funded by the USDA Forest Service, Rocky Mountain Research Station, National Fire Decision Support Center.

Acknowledgments

This work was funded by the USDA Forest Service, Rocky Mountain Research Station, and the National Fire Decision Support Center. We thank the national forest staff, including Andrew Stinchfield, Richard Gardner, and Don Justice from the Umatilla National Forest, for contributing to many aspects of this and prior related studies. We also would like to thank Ana Barros, Fermin Alcasena, and Rachel Houtman for assisting with technical insights.

Conflicts of Interest

The authors declare no conflict of interest.

References

  1. Ascoli, D.; Russo, L.; Giannino, F.; Siettos, C.; Moreira, F. Firebreak and Fuelbreak. In Encyclopedia of Wildfires and Wildland-Urban Interface (WUI) Fires; Manzello, S.L., Ed.; Springer International Publishing: Cham, Switzerland, 2018; pp. 1–9. [Google Scholar]
  2. Maestas, J.; Pellant, M.; Okeson, L.; Tilley, D.; Havlina, D.; Cracroft, T.; Brazee, B.; Williams, M.; Messmer, D. Fuel Breaks to Reduce Large Wildfire Impacts in Sagebrush Ecosystems; USA-NRCS: Boise, ID, USA, 2016. [Google Scholar]
  3. Shinneman, D.J.; Germino, M.J.; Pilliod, D.S.; Aldridge, C.L.; Vaillant, N.M.; Coates, P.S. The ecological uncertainty of wildfire fuel breaks: Examples from the sagebrush steppe. Front. Ecol. Environ. 2019, 17, 279–288. [Google Scholar] [CrossRef]
  4. Syphard, A.D.; Keeley, J.E.; Brennan, T.J. Factors affecting fuel break effectiveness in the control of large fires on the Los Padres National Forest, California. Int. J. Wildland Fire 2011, 20, 764–775. [Google Scholar] [CrossRef]
  5. Xanthopoulos, G.; Caballero, D.; Galante, M.; Alexandrian, D.; Rigolot, E.; Marzano, R. Forest fuels management in Europe. In Fuels Management. How to Measure Success; Andrews, P.L., Butler, B.W., Eds.; Portland, OR, USA, 2006. Available online: https://www.fs.usda.gov/rm/pubs/rmrs_p041.pdf (accessed on 10 October 2022).
  6. Oliveira, T.M.; Barros, A.M.G.; Ager, A.A.; Fernandes, P.M. Assessing the effect of a fuel break network to reduce burnt area and wildfire risk transmission. Int. J. Wildland Fire 2016, 25, 619–632. [Google Scholar] [CrossRef]
  7. Zong, X.; Tian, X.; Wang, X. An optimal firebreak design for the boreal forest of China. Sci. Total Environ. 2021, 781, 146822. [Google Scholar] [CrossRef]
  8. Green, L.R. Fuelbreaks and Other Fuel Modification for Wildland Fire Control; US Department of Agriculture, Forest Service: Washington, DC, USA, 1977. Available online: https://www.fs.usda.gov/research/treesearch/33461 (accessed on 10 October 2022).
  9. Eastaugh, C.S.; Molina, D.M. Forest road and fuelbreak siting with respect to reference fire intensities. For. Syst. 2012, 21, 153–161. [Google Scholar] [CrossRef] [Green Version]
  10. O’Connor, C.D.; Calkin, D.E.; Thompson, M.P. An empirical machine learning method for predicting potential fire control locations for pre-fire planning and operational fire management. Int. J. Wildland Fire 2017, 26, 587–597. [Google Scholar] [CrossRef]
  11. Caggiano, M.D. Collaboratively Engaging Stakeholders to Develop Operational Delineations; CFRI-1908; Colorado State University: Fort Collins, CO, USA, 2019; Available online: https://cfri.colostate.edu/wp-content/uploads/sites/22/2019/08/PODs-Collaborative-Engagement-Final-Report.pdf (accessed on 10 October 2022).
  12. Varela, E.; Giergiczny, M.; Riera, P.; Mahieu, P.A.; Solino, M. Social preferences for fuel break management programs in Spain: A choice modelling application to prevention of forest fires. Int. J. Wildland Fire 2014, 23, 281–289. [Google Scholar] [CrossRef]
  13. Price, O.F.; Edwards, A.C.; Russell-Smith, J. Efficacy of permanent firebreaks and aerial prescribed burning in western Arnhem Land, Northern Territory, Australia. Int. J. Wildland Fire 2007, 16, 295–305. [Google Scholar] [CrossRef]
  14. O’Connor, C.; Thompson, M.; Rodríguez y Silva, F. Getting ahead of the wildfire problem: Quantifying and mapping management challenges and opportunities. Geosciences 2016, 6, 35. [Google Scholar] [CrossRef] [Green Version]
  15. Aubard, V.; Pereira-Pires, J.E.; Campagnolo, M.L.; Pereira, J.; Mora, A.; Silva, J. Fully automated countrywide monitoring of fuel break maintenance operations. Remote Sens. 2020, 12, 2879. [Google Scholar] [CrossRef]
  16. Rodríguez-Puerta, F.; Ponce, R.A.; Pérez-Rodríguez, F.; Águeda, B.; Martín-García, S.; Martínez-Rodrigo, R.; Lizarralde, I. Comparison of Machine Learning Algorithms for Wildland-Urban Interface Fuelbreak Planning Integrating ALS and UAV-borne LiDAR Data and Multispectral Images. Drones 2020, 4, 21. [Google Scholar] [CrossRef]
  17. Finney, M.A. An overview of FlamMap fire modeling capabilities. In Fuels Management-How to Measure Success, Proceedings RMRS-P-41, Fort Collins, CO, USA, 28–30 March 2006; Andrews, P.L., Butler, B.W., Eds.; USDA Forest Service, Rocky Mountain Research Station: Fort Collins, CO, USA, 2006; pp. 213–220. Available online: https://www.fs.usda.gov/research/treesearch/25948. (accessed on 10 October 2022).
  18. Finney, M.A.; McHugh, C.W.; Grenfell, I.C.; Riley, K.L.; Short, K.C. A simulation of probabilistic wildfire risk components for the continental United States. Stoch. Environ. Res. Risk Assess. 2011, 25, 973–1000. [Google Scholar] [CrossRef] [Green Version]
  19. Ager, A.A.; Lasko, R.; Myroniuk, V.; Zibtsev, S.; Day, M.A.; Usenia, U.; Bogomolov, V.; Kovalets, I.; Evers, C.R. The wildfire problem in areas contaminated by the Chernobyl disaster. Sci. Total Environ. 2019, 696, 133954. [Google Scholar] [CrossRef]
  20. Aparício, B.A.; Alcasena, F.; Ager, A.A.; Chung, W.; Pereira, J.M.C. Evaluating priority locations and potential benefits for building a nation-wide fuel break network in Portugal. J. Environ. Manag. 2022, 320, 115920. [Google Scholar] [CrossRef] [PubMed]
  21. Parisien, M.A.; Parks, S.A.; Miller, C.; Krawchuk, M.A.; Heathcott, M.; Moritz, M.A. Contributions of ignitions, fuels, and weather to the spatial patterns of burn probability of a boreal landscape. Ecosystems 2011, 14, 1141–1155. [Google Scholar] [CrossRef]
  22. Pais, C.; Carrasco, J.; Martell, D.L.; Weintraub, A.; Woodruff, D.L. Cell2Fire: A Cell Based Forest Fire Growth Model. 2019, p. 47. Available online: https://www.frontiersin.org/articles/10.3389/ffgc.2021.692706/full (accessed on 10 October 2022).
  23. Chung, W.; Jones, G.; Krueger, K.; Bramel, J.; Contreras, M. Optimising fuel treatments over time and space. Int. J. Wildland Fire 2013, 22, 1118–1133. [Google Scholar] [CrossRef]
  24. Ager, A.A.; Vaillant, N.M.; Finney, M.A. Integrating fire behavior models and geospatial analysis for wildland fire risk assessment and fuel management planning. J. Combust. 2011, 2011, 572452. [Google Scholar] [CrossRef] [Green Version]
  25. Massada, A.B.; Radeloff, V.C.; Stewart, S.I. Allocating fuel breaks for optimal protection of structures in the wildland-urban interface. Int. J. Wildland Fire 2011, 20, 59–68. [Google Scholar] [CrossRef] [Green Version]
  26. Benali, A.; Sá, A.C.L.; Pinho, J.; Fernandes, P.M.; Pereira, J.M.C. Understanding the impact of different landscape-level fuel management strategies on wildfire hazard in Central Portugal. Forests 2021, 12, 522. [Google Scholar] [CrossRef]
  27. Pais, C.; Carrasco, J.; Elimbi Moudio, P.; Shen, Z.-J.M. Downstream protection value: Detecting critical zones for effective fuel-treatment under wildfire risk. Comput. Oper. Res. 2021, 131, 105252. [Google Scholar] [CrossRef]
  28. Russo, L.; Russo, P.; Siettos, C.I. A complex network theory approach for the spatial distribution of fire breaks in heterogeneous forest landscapes for the control of wildland fires. PLoS ONE 2016, 11, e0163226. [Google Scholar] [CrossRef] [PubMed]
  29. Wei, Y. Optimize landscape fuel treatment locations to create control opportunities for future fires. Can. J. For. Res. 2012, 42, 1002–1014. [Google Scholar] [CrossRef]
  30. Rashidi, E.; Medal, H.; Hoskins, A. An attacker-defender model for analyzing the vulnerability of initial attack in wildfire suppression. Nav. Res. Logist. 2018, 65, 120–134. [Google Scholar] [CrossRef]
  31. Penman, T.; Collins, L.; Price, O.; Bradstock, R.; Metcalf, S.; Chong, D. Examining the relative effects of fire weather, suppression and fuel treatment on fire behaviour–A simulation study. J. Environ. Manag. 2013, 131, 325–333. [Google Scholar] [CrossRef]
  32. Syphard, A.D.; Keeley, J.E.; Brennan, T.J. Comparing the role of fuel breaks across southern California national forests. For. Ecol. Manag. 2011, 261, 2038–2048. [Google Scholar] [CrossRef]
  33. AGIF. National Plan for Integrated Wildfire Management 2020–2030; Agency for Integrated Rural Fire Management: Lisbon, Portugal, 2020; p. 166. [Google Scholar]
  34. Baskent, E.Z.; Keles, S. Spatial forest planning: A review. Ecol. Model. 2005, 188, 145–173. [Google Scholar] [CrossRef]
  35. Crooks, K.R.; Sanjayan, M.A. Connectivity Conservation; Cambridge University Press: Cambridge, UK, 2006; p. 736. [Google Scholar]
  36. USDA Forest Service. Bailey’s Ecoregions of the Conterminous United States. United States Geological Survey. Available online: https://www.sciencebase.gov/catalog/item/54244abde4b037b608f9e23d (accessed on 10 October 2022).
  37. Short, K.C. Spatial Wildfire Occurrence Data for the United States, 1992-2020 [FPA_FOD_20221014], 6th ed.; Forest Service Research Data Archive: Fort Collins, CO, USA, 2022. [Google Scholar] [CrossRef]
  38. Infrastructure Investment and Jobs Act, Public Law 117-58. 2021. Available online: https://www.congress.gov/117/plaws/publ58/PLAW-117publ58.pdf (accessed on 10 October 2022).
  39. Dennis, F.C. Fuelbreak Guidelines for Forested Subdivisions & Communities; Colorado State Forest Service, 2005; p. 8. Available online: https://mountainscholar.org/handle/10217/45082 (accessed on 10 October 2022).
  40. Mooney, C. Fuelbreak Effectiveness in Canada’s Boreal Forests: A Synthesis of Current Knowledge. 2010, p. 53. Available online: https://library.fpinnovations.ca/media/FOP/9438.pdf (accessed on 10 October 2022).
  41. Ingalsbee, T. Fuelbreaks for wildland fire management: A moat or a drawbridge for ecosystem fire restoration. Fire Ecol. 2005, 1, 85–99. [Google Scholar] [CrossRef]
  42. USDA Forest Service, Pacific Northwest Region. Land and Resource Management Plan. Umatilla National Forest; USDA Forest Service, Pacific Northwest Region: Portland, OR, USA, 1990. [Google Scholar]
  43. Belavenutti, P.; Chung, W.; Ager, A.A. The economic reality of the forest and fuel management deficit on a fire prone western US national forest. J. Environ. Manag. 2021, 293, 112825. [Google Scholar] [CrossRef]
  44. Keyser, C.E.; Dixon, G.E. Blue Mountains (BM) Variant Overview—Forest Vegetation Simulator; USDA Forest Service, Forest Management Service Center: Fort Collins, CO, USA, 2015; p. 56. [Google Scholar]
  45. Keyes, C.R.; O’Hara, K.L. Quantifying stand targets for silvicultural prevention of crown fires. West. J. Appl. For. 2002, 17, 101–109. [Google Scholar] [CrossRef]
  46. USDA and USDI. Record of Decision for Amendments to Forest Service and Bureau of Land Management Planning Departments within the Range of the Northern Spotted Owl; USDA Forest Service and USDI Bureau of Land Management: Portland, OR, USA, 1994. [Google Scholar]
  47. USDA Forest Service, Pacific Northwest Region, Management Direction for Large Diameter Trees in Eastern OR & Southeastern WA; USDA Forest Service, Pacific Northwest Region, 2021. Available online: https://www.fs.usda.gov/detail/r6/landmanagement/planning/?cid=FSEPRD710229 (accessed on 10 October 2022).
  48. Jain, T.B.; Battaglia, M.A.; Han, H.S.; Graham, R.T.; Keyes, C.R.; Fried, J.S.; Sandquist, J.E. A Comprehensive Guide to Fuel Management Practices for Dry Mixed Conifer Forests in the Northwestern United States; U. S. Department of Agriculture, Forest Service: Fort Collins, CO, USA, 2012; p. 331. [Google Scholar]
  49. Vogler, K.C.; Ager, A.A.; Day, M.A.; Jennings, M.; Bailey, J.D. Prioritization of forest restoration projects: Tradeoffs between wildfire protection, ecological restoration and economic objectives. Forests 2015, 6, 4403–4420. [Google Scholar]
  50. Martin, F. User Guide to the Economic Extension (ECON) of the Forest Vegetation Simulator; U. S. Department of Agriculture, Forest Service, Forest Management Service Center: Fort Collins, CO, USA, 2013; p. 43. [Google Scholar]
  51. Ager, A.A.; Houtman, R.; Day, M.A.; Ringo, C.; Palaiologou, P. Tradeoffs between US national forest harvest targets and fuel management to reduce wildfire transmission to the wildland urban interface. For. Ecol. Manag. 2019, 434, 99–109. [Google Scholar] [CrossRef]
  52. Rummer, B. Assessing the cost of fuel reduction treatments: A critical review. For. Policy Econ. 2008, 10, 355–362. [Google Scholar] [CrossRef] [Green Version]
  53. Rainville, R.; White, R.; Barbour, J. Assessment of Timber Availability from Forest Restoration within the Blue Mountains of Oregon; Gen. Tech. Rep. PNW-GTR-752; USDA Forest Service, Pacific Northwest Research Station: Portland, OR, USA, 2008; p. 65. [Google Scholar]
  54. Dijkstra, E.W. A note on two problems in connexion with graphs. Numer. Math. 1959, 1, 269–271. [Google Scholar] [CrossRef] [Green Version]
  55. USDA Forest Service. Umatilla Landscape Wildfire Strategy; USDA Forest Service, Umatilla National Forest: Pendleton, OR, USA, 2015. [Google Scholar]
  56. Ma, F.; Lee, J.Y.; Camenzind, D. Probabilistic Wildfire Risk Assessment Methodology and Evaluation of a Supply Chain Network. Int. J. Disaster Risk Reduct. 2022, 82, 103340. [Google Scholar] [CrossRef]
  57. McEvoy, A.; Kerns, B.K.; Kim, J.B. Hazards of risk: Identifying plausible community wildfire disasters in low-frequency fire regimes. Forests 2021, 12, 934. [Google Scholar] [CrossRef]
  58. Alcasena, F.J.; Salis, M.; Nauslar, N.J.; Aguinaga, A.E.; Vega-García, C. Quantifying economic losses from wildfires in black pine afforestations of northern Spain. For. Policy Econ. 2016, 73, 153–167. [Google Scholar] [CrossRef]
  59. Belavenutti, P.; Ager, A.A.; Chung, W.; Day, M.A. Designing forest restoration projects to optimize the application of broadcast burning. Ecol. Econ. 2022, 201, 107558. [Google Scholar] [CrossRef]
  60. Diaz-Balteiro, L.; Belavenutti, P.; Ezquerro, M.; González-Pachón, J.; Nobre, S.R.; Romero, C. Measuring the sustainability of a natural system by using multi-criteria distance function methods: Some critical issues. J. Environ. Manag. 2018, 214, 197–203. [Google Scholar] [CrossRef]
  61. Cormen, H.T.; Rivest, R.L.; Stein, C. Introduction to Algorithms, 3rd ed.; MIT Press: Cambridge, MA, USA, 2009. [Google Scholar]
  62. R: A Language and Environment for Statistical Computing; R Foundation for Statistical Computing: Vienna, Austria, 2019; Available online: http://www.R-project.org/ (accessed on 10 October 2022).
  63. Borges, J.G.; Garcia-Gonzalo, J.; Bushenkov, V.; McDill, M.E.; Marques, S.; Oliveira, M.M. Addressing multicriteria forest management with Pareto frontier methods: An application in Portugal. For. Sci. 2014, 60, 63–72. [Google Scholar] [CrossRef] [Green Version]
  64. Diaz-Balteiro, L.; Romero, C. Making forestry decisions with multiple criteria: A review and an assessment. For. Ecol. Manag. 2008, 255, 3222–3241. [Google Scholar] [CrossRef]
  65. Marques, M.; Reynolds, K.M.; Marques, S.; Marto, M.; Paplanus, S.; Borges, J.G. A Participatory and Spatial Multicriteria Decision Approach to Prioritize the Allocation of Ecosystem Services to Management Units. Land 2021, 10, 747. [Google Scholar] [CrossRef]
  66. Belavenutti, P.; Romero, C.; Diaz-Balteiro, L. Integrating Strategic and Tactical Forest-Management Models within a Multicriteria Context. For. Sci. 2019, 65, 178–188. [Google Scholar] [CrossRef]
  67. Triviño, M.; Pohjanmies, T.; Mazziotta, A.; Juutinen, A.; Podkopaev, D.; Le Tortorec, E.; Mönkkönen, M. Optimizing management to enhance multifunctionality in a boreal forest landscape. J. Appl. Ecol. 2017, 54, 61–70. [Google Scholar] [CrossRef] [Green Version]
  68. Barros, A.M.G.; Day, M.A.; Preisler, H.K.; Abatzoglou, J.T.; Krawchuk, M.A.; Houtman, R.; Ager, A.A. Contrasting the role of human- and lightning-caused wildfires on future fire regimes on a Central Oregon landscape. Environ. Res. Lett. 2021, 16, 064081. [Google Scholar] [CrossRef]
  69. Dillon, G.K.; Menakis, J.; Fay, F. Wildland fire potential: A tool for assessing wildfire risk and fuel management needs. In Large Wildland Fire Conference, RMRS-P-73, Proceedings of the Large Wildland Fires Conference, Missoula, MT, USA, 19–23 May 2014; Keane, R.E., Jolly, M., Parsons, R., Riley, K., Eds.; USDA Forest Service, Rocky Mountain Research Station: Fort Collins, CO, USA, 2015; pp. 60–76. [Google Scholar]
  70. Barros, A.M.G.; Ager, A.A.; Day, M.A.; Palaiologou, P. Improving long-term fuel treatment effectiveness in the National Forest System through quantitative prioritization. For. Ecol. Manag. 2019, 433, 514–527. [Google Scholar] [CrossRef]
  71. Ager, A.A.; Evers, C.R.; Day, M.A.; Alcasena, F.J.; Houtman, R. Planning for future fire: Scenario analysis of an accelerated fuel reduction plan for the western United States. Landsc. Urban Plan. 2021, 215, 104212. [Google Scholar] [CrossRef]
  72. Ager, A.A.; Barros, A.M.; Houtman, R.; Seli, R.; Day, M.A. Modelling the effect of accelerated forest management on long-term wildfire activity. Ecol. Model. 2020, 421, 108962. [Google Scholar] [CrossRef]
  73. Mina, M.; Messier, C.; Duveneck, M.J.; Fortin, M.J.; Aquilué, N. Managing for the unexpected: Building resilient forest landscapes to cope with global change. Glob. Change Biol. 2022, 28, 4323–4341. [Google Scholar] [CrossRef]
  74. Finney, M.A.; Seli, R.C.; McHugh, C.W.; Ager, A.A.; Bahro, B.; Agee, J.K. Simulation of long-term landscape-level fuel treatment effects on large wildfires. Int. J. Wildland Fire 2007, 16, 712–727. [Google Scholar] [CrossRef] [Green Version]
  75. Butler, W.H.; Esch, B. Collaborative forest landscape restoration in action. In A New Era for Collaborative Forest Management: Policy and Practice Insights from the Collaborative Forest Landscape Restoration Program; Butler, W.H., Schultz, C.A., Eds.; Routledge: London, UK, 2019; p. 25. Available online: https://www.researchgate.net/publication/330725598_Collaborative_forest_landscape_restoration_in_action_Policy_and_Practice_Insights_from_the_Collaborative_Forest_Landscape_Restoration_Program. (accessed on 10 October 2022).
  76. Stephens, S.L.; Battaglia, M.A.; Churchill, D.J.; Collins, B.M.; Coppoletta, M.; Hoffman, C.M.; Lydersen, J.M.; North, M.P.; Parsons, R.A.; Ritter, S.M.; et al. Forest restoration and fuels reduction: Convergent or divergent? BioScience 2021, 71, 85–101. [Google Scholar] [CrossRef]
Figure 1. Map of the Umatilla National Forest illustrating the fuel break network (dark black lines) and local mills.
Fire 06 00001 g001
Figure 2. Distribution of priority objective values for the individual fuel break segments for a sample of the northeastern portion of the study area: (A) wildfire hazard, computed as the product of the conditional probability of flame length > 1.25 m and annual burn probability, derived from FSim outputs [18], (B) merchantable volume, and (C) net revenue. The geographical location of these segments is shown in the red box in Figure 1.
Fire 06 00001 g002
Figure 3. Change in objective attainment with increasing area treated for four different amounts of treated area per project and three scenarios where each of the objectives was optimized: (A) wildfire hazard, (B) merchantable volume, and (C) net revenue.
Fire 06 00001 g003
Figure 4. Plot of the 22,166 different 300 ha feasible project configurations. Fire hazard, harvest volume, and net revenue objective contributions are presented per hectare, due to the ±10% variation in project size.
Fire 06 00001 g004
Figure 5. Treatment prescriptions within projects with 300 ha of treated area scheduled for four scenarios: max net revenue, max volume, max hazard, and multi-objective.
Fire 06 00001 g005
Figure 6. Comparison of solutions obtained under single versus multi-objective priorities for three response metrics (A) cumulative wildfire hazard, (B) cumulative merchantable volume, and (C) cumulative revenue, with increasing area treated and projects implemented. All outputs are from treating 300 ha per project. Note that within each panel, we graph the results of four scenarios where each of the priority objectives (lines) are maximized individually. For example, panel A shows the effect on treating wildfire hazard from four different prioritization scenarios.
Fire 06 00001 g006
Figure 7. Illustration of the 133 sequenced projects from the 300 ha treated area scenario prioritizing multi-objectives. (A) Full extent of the fuel break network on the Umatilla National Forest. (B) Project area distribution in the southwestern part of the forest. (C) Fuel break treatment units within project area 99 overlaid on aerial photos across forest and non-forest grass-shrub vegetation. Stand treatments include commercial thinning with the pile and burn method; non-commercial thinning, with the pile and burn method; and no treatment (conducted in forested stands with < 15% CC or grassland/shrubs).
Fire 06 00001 g007
Table 1. Stand thresholds used to determine treatment types, as described by Belavenutti et al. (2021), modified for fuel breaks by thinning down to 15% canopy closure.
ThresholdTreatment Types
Stand canopy closure (CC) > 15%
Available for thinning
      ▪
Merchantable volume > 35 m3 ha−1
Commercial thinning
      ▪
Thinning volume > 0 m3 ha−1 and < 35 m3 ha−1
Non-commercial thinning (density reduction)
      ▪
Fuel loading > 3.6 ton ha−1 in the 0–7.6 cm diameter size class
Thin + Pile and burn (2 years post-thinning)
Stand canopy closure (CC) < 15% AND Fuel loading > 3.6 ton ha−1 in the 0–7.6 cm diameter size class
Pile and burn only
Thresholds for treatments do not apply (e.g., stand received treatment in last 15 years)
Recently-treated forest, no treatment
Stand is grass-shrub non-forest
Non-forest, no treatment
Table 2. Description of scenarios simulated to prioritize project areas. See the methods section for additional description of the scenario details.
ObjectiveTreatment Area Per Project
(ha)
Number of Project Areas
Wildfire hazard100400
Wildfire hazard300133
Wildfire hazard60066
Wildfire hazard100040
Merchantable timber volume100400
Merchantable timber volume300133
Merchantable timber volume60066
Merchantable timber volume100040
Net revenue100400
Net revenue300133
Net revenue60066
Net revenue100040
Multi-objective300133
Disclaimer/Publisher’s Note: The statements, opinions and data contained in all publications are solely those of the individual author(s) and contributor(s) and not of MDPI and/or the editor(s). MDPI and/or the editor(s) disclaim responsibility for any injury to people or property resulting from any ideas, methods, instructions or products referred to in the content.

