Abstract
To synergistically integrate piezoelectric and varistor functionalities in a single material, PNN-PZT piezoelectric powder (abbreviated as P) and ZnO-based varistor powder (abbreviated as Z) were utilized to fabricate PZT-ZnO composite ceramics (denoted as PZm) via conventional solid-state sintering. The P/Z molar ratio was regulated to 1/0.9, 1/1.05, 1/1.2, 1/1.35, and 1/1.5 to systematically study its influence on the phase composition, microstructure, and electrical properties of the composites. XRD, SEM, EDS characterization, and electrical performance tests were carried out. Results indicate that all PZm samples exhibit the biphasic coexistence of perovskite (piezoelectric phase) and wurtzite (varistor phase) without impurity phases, consisting of large perovskite grains with distinct edges and small wurtzite grains with smooth surfaces. The PZ3 sample (P/Z = 1/1.2) achieves optimal comprehensive properties: d33 = 161 pC/N, kp = 0.25, Ɛr = 2527, tan δ = 3.83%, E1mA = 1396 V/mm, IL = 8.2 mA, α = 22.06. This work confirms the synergistic optimization of piezoelectric and varistor properties in PZT-ZnO composites, providing a reliable experimental basis for the formulation design and performance regulation of multifunctional ceramics.
1. Introduction
Under the global wave of technological innovation and industrial upgrading, the development of functional materials exhibits the characteristics of multi-functionality, low loss, integration and intelligence simultaneously. Compositing, as the key path to enhance material performance, has become an important development direction in this field [1,2]. This research aims to prepare a type of functional composite ceramic material. This material not only possesses the piezoelectric effect, enabling the conversion of mechanical energy to electrical energy, but also exhibits nonlinear characteristics when subjected to abnormal voltages, thereby achieving its own voltage stabilization and overvoltage protection effects. This requires the similar phase transition temperatures of piezoelectric material and the varistor material, and that the piezoelectric material can be dispersed along the grain boundaries of the piezoresistive material, with the possibility of partially acting as a potential barrier or not obstructing the formation of the piezoresistive material’s double Schottky barrier [3,4].
PNN-PZT (Lead Niobate-Nickelate-Zirconate-Titanate) ternary piezoelectric ceramics, a typical category of polycrystalline electroactive materials, exhibit excellent bidirectional conversion performance between mechanical energy and electrical energy. Benefiting from their high piezoelectric constant, low dielectric loss, and superior temperature stability, these ceramics have become the preferred raw materials for high-performance piezoelectric devices in aerospace, smart sensing, and precision driving fields [5,6,7,8]. On the other hand, ZnO-Bi2O3-based varistor materials are representative semiconductor ceramics with prominent nonlinear current–voltage characteristics. Their wide adaptability to complex working environments and reliable surge protection performance makes them indispensable core materials for the preparation of overvoltage protection varistors in power systems and electronic circuits [9,10,11].
In this work, PNN-PZT (P) piezoelectric materials and ZnO-Bi2O3-based (Z) varistor materials as the raw materials to fabricate PZm composite ceramics with various P/Z molar ratios (1/0.9, 1/1.05, 1/1.2, 1/1.35, 1/1.5) via the traditional solid-state sintering method. The phase structure, microstructure, elemental distribution, electrical properties (piezoelectric, varistor, dielectric, and ferroelectric) and dual-function regulation of PZT-ZnO-based composite ceramics were systematically characterized. The objectives of this study as follows: (1) achieve the coexistence of piezoelectric and varistor functionalities in PZT-ZnO-based composites; (2) investigate the effect of P/Z molar ratio on the comprehensive properties of the composites; (3) reveal the structure–property relationship and dual-functional regulation mechanism. The findings are expected to provide experimental support for the formulation design and performance optimization of multifunctional electronic ceramics.
2. Experimental Procedures
The starting materials for monofunctional piezoelectric ceramics, monofunctional varistor ceramics, and bifunctional ceramics integrating piezoelectric and varistor properties were all of analytical grade. The ZnO-Bi2O3-based varistor formulation consisted of 94 mol% Zn, 1.5 mol% Bi2O3, 2 mol% Sb2O3, 2 mol% Co2O3, 0.3 mol% MnO2, 0.1 mol% Cr2O3 and 0.1 mol% Ni2O3. For the synthesis of Pb(Ni1/3Nb2/3)0.55-(Zr0.3Ti0.7)0.45O3 (PNN-PZT) powder, ZrO2 (99.5% purity), TiO2 (99.6% purity) and Pb3O4 (99.0% purity) were used, with a 1 wt% excess of Pb3O4 introduced to offset lead volatilization during high-temperature processing. The ZnO-Bi2O3 varistor powder and PNN-PZT piezoelectric powder were weighed according to the stoichiometric ratio respectively, then subjected to separate ball-milling with a rotation speed of 360 r/min in alcohol for 10 h, screened through an 80-mesh sieve and followed by calcination at 900 °C for 3 h. The calcined piezoelectric and varistor powders were ball-milled and mixed at various P/Z molar ratios of 1/0.9, 1/1.05, 1/1.2, 1/1.35, 1/1.5, and then dried. All powder systems were mixed with 6 wt% paraffin as a binder, then pressed into disk-shaped green bodies with dimensions of Φ12 mm × 1 mm. The green compacts were first subjected to binder burnout at 500 °C for 20 h, and then sintered at temperatures of 1160 °C for 2 h.
Phase composition and crystal structure were analyzed by X-ray diffraction (XRD) with Cu Kα radiation on an XPERT-PRO diffractometer (Almelo, The Netherlands). Microstructural observations were conducted using a JSM-5900 field emission scanning electron microscope (FE-SEM) (Tokyo, Japan), and elemental distribution mapping was performed via energy-dispersive X-ray spectroscopy (EDS) integrated with the FE-SEM. Prior to electrical tests, all ceramic samples were silver-electroded and cured at 800 °C for 30 min. Varistor properties were tested directly after electrode printing. Piezoelectric properties (piezoelectric constant d33) were evaluated using a ZJ-3A quasi-staticmeter (Beijing, China); samples were poled in silicone oil at 50 °C under 3~5 kV/mm DC electric field for 30 min and aged 24 h before testing. Varistor parameters such as leakage current (IL), nonlinear coefficient (α) and breakdown field (E1mA) defined as voltage per unit thickness at 1 mA DC current, were measured with an FC-2G analyzer. Dielectric properties and relaxation behaviors were characterized using a Wayne Kerr 6500B impedance analyzer (West Sussex, UK) at 10 kHz over 25~250 °C. Ferroelectric hysteresis loops were measured at 10 Hz via a TF Analyzer 2000E (Aachen, Germany) coupled with a TREK 610E (New York, NY, USA) 10 kV amplifier. The compositions, denominations and formulations of all samples are presented in Table 1 for subsequent analysis.

Table 1.
Sample compositions, names and formulations.
3. Results and Discussion
3.1. X-Ray Diffraction Analysis of the Ceramic’s Phase Structure
Figure 1 reveals the XRD spectra of all the ceramic samples. The peaks of the PZ1, PZ2, PZ3, PZ4 and PZ5 composite materials are almost entirely the peaks of the P piezoelectric and Z varistor phase. The PZm samples reveal characteristic peaks at 45° (as shown in Figure 1c) as well as at 31.8°, 34.5°, and 36.3° [3], as shown in Figure 1b, indicating that the PZm sample possesses both the perovskite phase and the wurtzite phase. In Figure 1c, the characteristic peaks near 45° [12] shift towards lower angles first and then towards higher angles as the molar ratio P/Z of the piezoelectric/varistor powder decreases. This indicates that the lattice constant of the composite ceramic first increases and then decreases. At the PZ3 sample, this characteristic peak has the smallest diffraction angle and the largest lattice constant, and currently, the P/Z = 1/1.2.
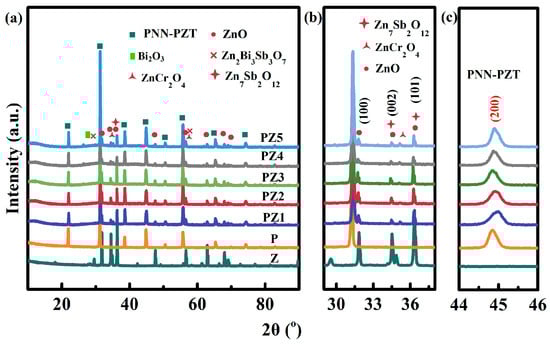
Figure 1.
XRD patterns of the P, Z and PZm samples: (a) XRD spectrum with diffraction angles ranging from 10° to 90°, (b) characteristic peaks of (100), (002) and (101) for the varistor phase, (c) characteristic peak of (200) for the piezoelectric phase.
3.2. SEM Microscopic Structure Analysis of Ceramics
Figure 2 reveals the cross-sectional scanning electron microscope (SEM) images of the ceramics under a magnification of 5000×. Figure 2a–e are SEM images of samples with various molar ratios of the PZm (P/Z = 1/0.9, 1/1.05, 1/1.2, 1/1.35, 1/1.5). There are two types of grains in the ceramic samples, large A-type grains with sharp edges and large surface area B-type grains. Combining the XRD spectra, it can be determined that the A-type grains are perovskite phase and the B-type grains are wurtzite phase. As the P/Z ratio decreases, the sizes of the A-type and B-type grains first increase and then decrease. The distribution of A- and B-type grains is more uniform in the P/Z of the 1/1.2 ceramic sample with the largest grain size, indicating that the PZ3 sample has the best comprehensive performance, which is consistent with the previous electrical performance and XRD analysis results.
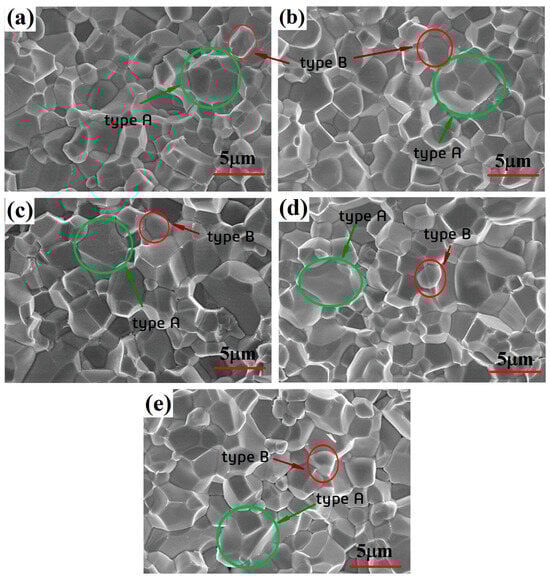
Figure 2.
SEM patterns of the PZm samples: (a) PZ1, (b) PZ2, (c) PZ3, (d) PZ4, (e) PZ5.
3.3. EDS Analysis of Ceramics
Figure 3, Figure 4, Figure 5, Figure 6 and Figure 7 display the mappings of all PZm samples with various ratios of P/Z. The distribution of Bi and Pb elements is similar, while the distribution of Zn and Pb elements is opposite. Combining the previous SEM and XRD images, it can be known that the Pb element is mainly distributed in the A-type grains, which are perovskite phases; the Zn element is mainly distributed in the B-type grains, which are wurtzite phases. Bi is distributed around the perovskite, and other elements are distributed in both the perovskite and wurtzite phases.
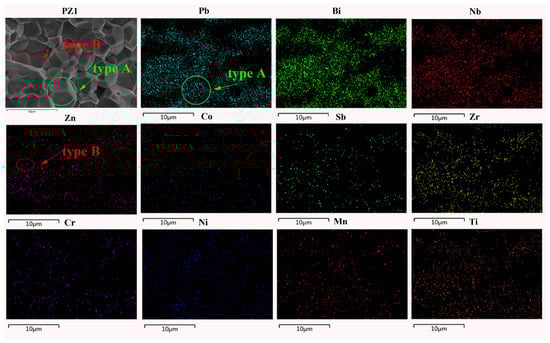
Figure 3.
Mapping of the PZ1 sample.
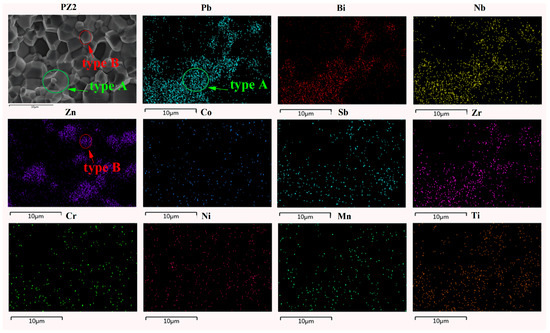
Figure 4.
Mapping of the PZ2 sample.
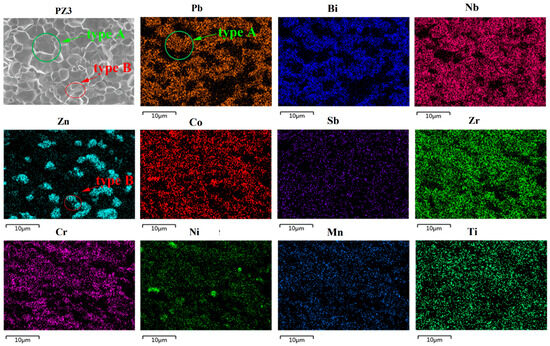
Figure 5.
Mapping of the PZ3 sample.
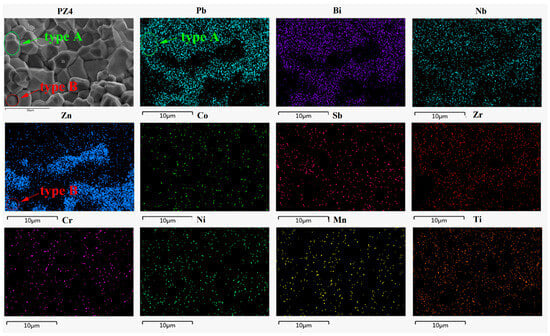
Figure 6.
Mapping of the PZ4 sample.
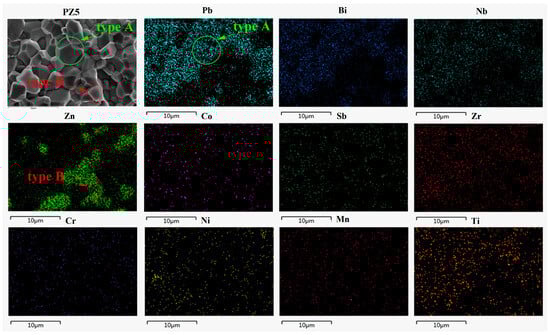
Figure 7.
Mapping of the PZ5 sample.
3.4. Analysis of Electrical Properties of Ceramics
Figure 8 shows the electrical properties of the PZm samples with different molar ratios at room temperature. The numbers on the x-axis represent the value of m. The larger the m value, the smaller the molar ratio of piezoelectric powder P to varistor powder Z (P/Z), and the lower the content of piezoelectric powder. As can be seen from Figure 8a, the piezoelectric constant (d33) and the electromechanical coupling coefficient (kp) gradually decrease as the content of piezoelectric powder decreases, indicating that the piezoelectric performance of the PZT-ZnO-based piezoelectric–varistor composite material is mainly contributed by the piezoelectric phase. In Figure 8b, the dielectric loss factor (tan δ) and the dielectric constant (εr) have the same trend of change. When m = 4 (P/Z = 1/1.35), the value of tan δ is the smallest. As the content of piezoelectric powder decreases, that is, the content of varistor powder increases, the electric field gradient (E1mA) first decreases, then increases, and finally decreases again. When 1 mol of piezoelectric powder is combined with 1.2 mol of varistor powder, E1mA is the largest, as shown in Figure 8c. Piezoelectric materials have higher piezoelectric constants and Curie temperatures, while varistor materials have higher piezoresistive potential gradients and nonlinear coefficients, which proved that these multifunctional composite ceramics exhibit optimal electrical performance. At the same time, when P/Z = 1/1.2, the leakage current (IL) is the lowest and the nonlinearity coefficient (a) is the largest, indicating that the varistor performance of the PZT-ZnO-based piezoelectric–varistor composite material is contributed by the combination of the piezoelectric phase and the varistor phase. It is indicated that the piezoelectric and varistor properties of the PZm sample coexist. Considering the composite performance of the PZT-ZnO material comprehensively, when P/Z = 1/1.2, that is, the electrical performance of the PZ3 sample is the best. d33 = 161 pC/N, kp = 0.25, Ɛr = 2527, tan δ = 3.83%, E1mA = 1396 V/mm, IL = 8.2 μA, α = 22.06.
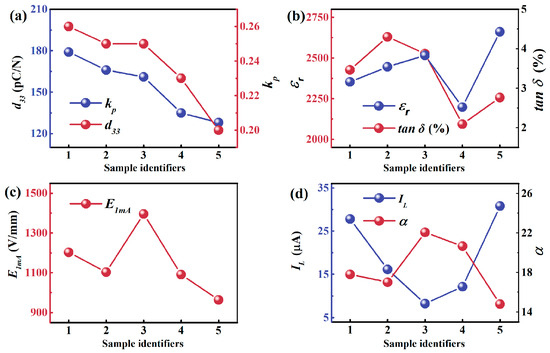
Figure 8.
Electrical properties of the PZm samples with different mole ratio P/Z: (a) piezoelectric constant d33 and electromechanical coupling coefficient kp, (b) the dielectric constant εr and dielectric loss factor tan δ, (c) electric field gradient E1mA, (d) leakage current IL, which is the lowest, and the nonlinearity coefficient a.
Figure 9 manifest the relationship curves between the relative dielectric constant Ɛr and temperature T of the ceramic sample of the PZm at 10 kHz within the range of 25~250 °C. As shown in Figure 9a. the relationship curve between dielectric loss factor tan δ and temperature T. All the PZm samples with piezoelectric and varistor behavior have a transformation from ferroelectric to paraelectric phase near the Curie temperature as shown in Figure 9b [13]. When P/Z = 1/0.9, the peak value of the dielectric constant Ɛrm is the largest. Except for the PZ3 sample, whose Ɛrm is higher than that of the PZ2 sample, as the P/Z of the piezoelectric powder and the piezoelectric/varistor powder decreases, the peak value of the dielectric constant of the PnZ sample gradually decreases. The dielectric loss tan δ of the PZm sample decreases first and then increases with an increase in temperature, and tan δ is less than 4% below the Curie temperature.
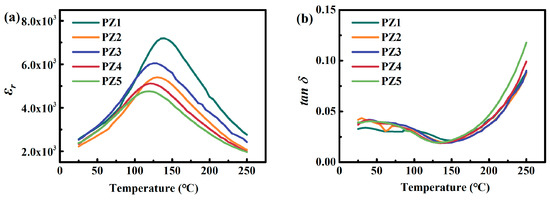
Figure 9.
(a) Temperature dependence of the dielectric constant Ɛr for the PZm samples at 10 kHz. (b) Temperature dependence of the dielectric loss factor tan δ for the PZm samples at 10 kHz.
3.5. Analysis of Dielectric Relaxation Behavior of Ceramics
For normal ferroelectrics with temperatures above the Curie temperature, the dielectric constant follows the Curie–Weiss law in Formula (1) [14]:
where Tcw as the Curie temperature—Vance, C for Curie—Vance constant. For the Curie temperature, the deviation of 1/Ɛr − T from the Curie-Vance can be defined by Equation (2) [15]:
where Tm represents the temperature corresponding to Ɛm, and TB is the temperature at which the Curie–Weiss law is initially followed during the heating process.
To further understand the dielectric relaxation behavior of the PZm samples above the Curie temperature, the relationship of 1/Ɛr − T and the dispersion coefficient (γ) can be expressed by the modified Curie–Weiss equation, that is, Equation (3) [16].
For typical relaxation or ferroelectrics, the dispersion coefficient γ is between 1 and 2. The larger the γ value, the better the dielectric relaxation behavior of the sample. Figure 10a–e show the relationship curves between the relative dielectric constant and temperature of the PZm ceramic samples at a frequency of 10 kHz. Figure 10f–j display the relationship curves between the relative dielectric constant above the Curie temperature and temperature of the PZm ceramic samples at 10 kHz. The dispersion coefficients γ of all PZm samples are 1 < γ < 2, indicating that the PZm samples with different molar ratios P/Z all exhibit dielectric relaxation behavior [17], that is, the PZm composite materials with piezoelectric and varistor behavior are all relaxation ferroelectrics.
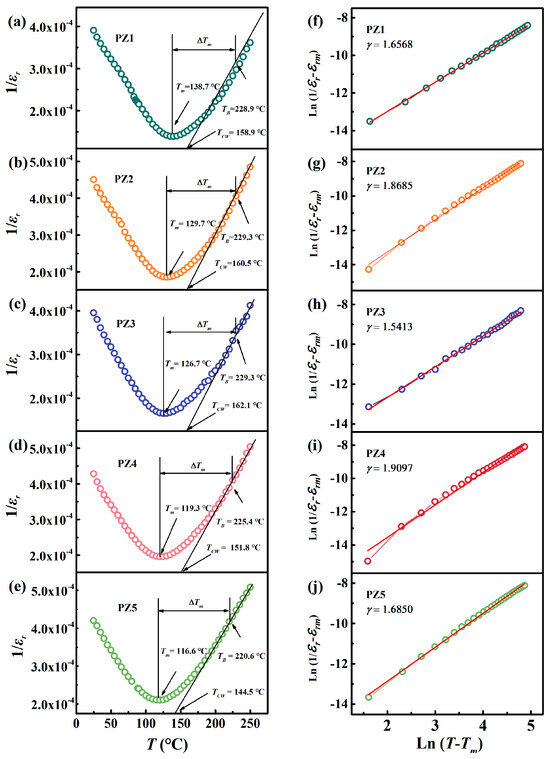
Figure 10.
A comparison of the curves of Ɛr − T for the PZm samples prepared at 10 kHz. (a–e) 1/Ɛr − T, (f–j) ln (1/Ɛr − 1/Ɛrm) − ln (T − Tm).
Figure 11a,b, respectively, show the Tm and γ relationship curves of PnZ and Pn samples. As the P/Z ratio decreases, the Curie temperature shows a downward trend. Since the Z varistor material does not have ferroelectric phase transition, the Curie temperature of the composite material PZm is mainly contributed by the P piezoelectric material, that is, the Curie temperature decreases as the Z content increases. The dispersion coefficient γ is relatively high at PZ2 and PZ4, which might be due to the error caused by the fact that the γ value was abandoned at the initial point fitting.
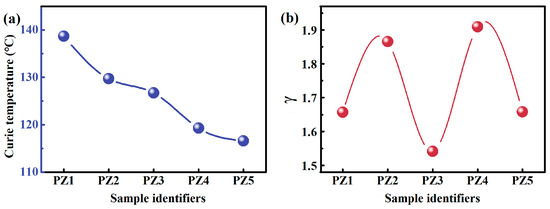
Figure 11.
The Tm (a) and ΔTm (b) curves of the PZm samples tested at 10 kHz.
3.6. Analysis of Ferroelectric Properties of Ceramics
Figure 12a shows the hysteresis loop of the P sample sintered at 1160 °C, which features a typical hysteresis loop of piezoelectric ceramics. Figure 12b–f show the hysteresis loop of the PZm sample at 1160 °C. Both the corrected field Ec and the saturation polarization intensity Pr are higher than those of the P sample. As P/Z decreases, the hysteresis loop becomes increasingly smooth. When the electric field E is higher than the corrected field Ec, the curves of polarization intensity P-E get closer to the arc. All PZm samples were measured by gradually increasing the voltage in increments of 100 V. Due to the excessive internal loss of the samples, all the hysteresis loop data were those obtained before the samples were broken down, and it is very likely that the samples have not been fully corrected [18].
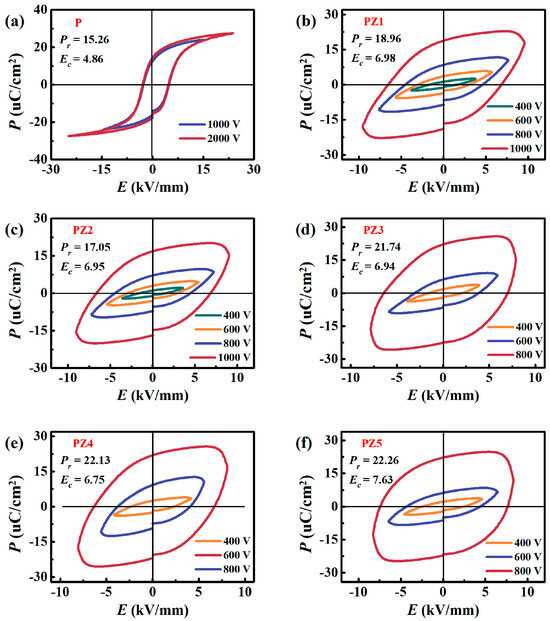
Figure 12.
Hysteresis loops of the PZm and P samples: (a) P, (b) PZ1, (c) PZ2, (d) PZ3, (e) PZ4, (f) PZ5.
To facilitate the examination of the experimental data, Table 2 lists all the piezoelectric, piezoresistive, dielectric, ferroelectric and other experimental results of the ceramics.
Table 2.
The piezoelectric, piezoresistive, dielectric, ferroelectric and other experimental results of the ceramics.
4. Conclusions
In this study, PZm samples of composite materials with various molar ratios of piezoelectric powder and varistor powder P/Z were prepared by the traditional solid-phase sintering method. After sintering at 1160 °C, all the PZm samples simultaneously possessed both piezoelectric and varistor functional characteristics.
The XRD, SEM and EDS characterizations demonstrated that all PZm samples presented a coexistence of perovskite phase (mainly containing Pb) and wurtzite phase (mainly containing Zn). Bi elements were primarily distributed around the perovskite phase, while the remaining elements were detected in both phases. The piezoelectric performance was mainly derived from the piezoelectric phase, while the varistor performance was dominated by the grain boundary effect and synergistically regulated by both phases.
As the ratio of P/Z decreases, the piezoelectric constant d33 and the electromechanical coupling coefficient kp gradually decrease. The varistor potential gradient E1mA and the nonlinear coefficient α first increase, then decrease, and then increase again. Among all samples, PZ3 with a P/Z ratio of 1/1.2 achieved the optimal comprehensive electrical performance: d33 = 161 pC/N, kp = 0.25, Ɛr = 2527, tan δ = 3.83%, E1mA = 1396 V/mm, IL = 8.2 μA, α = 22.06.
All PZm samples exhibited dielectric relaxation behavior and ferroelectric phase transition characteristics. The Curie temperature was mainly dominated by the piezoelectric phase and decreased with the reduction in piezoelectric powder content. In addition, the samples showed distinctive P-E hysteresis loops, and the curves of the loops became increasingly rounded as the piezoelectric powder content decreased.
Author Contributions
Conceptualization, Y.W.; methodology, Y.W.; software, Y.W.; validation, Y.W. and Y.T.; formal analysis, Y.W.; investigation, Y.W., T.Z. and X.T.; resources, Y.W.; data curation, Y.W.; writing—original draft preparation, Y.W. and C.L.; writing—review and editing, Y.W.; visualization, Y.W.; supervision, Y.W. and S.Z.; project administration, Y.W.; funding acquisition, Y.W. and D.Z. All authors have read and agreed to the published version of the manuscript.
Funding
This research was funded by the Guizhou Provncial Science and Technology Department [QKHJC (2026) ZD 038] and Education Department of Guizhou Province's Project for Humanities and Social Sciences Research in Higher Education Institutions [25GZGXRWJD0231].
Data Availability Statement
The original contributions presented in this study are included in the article. Further inquiries can be directed to the corresponding author.
Conflicts of Interest
The authors declare that they have no known competing financial interests or personal relationships that could have appeared to influence the work reported in this paper.
References
- Nan, C.W.; Wang, X.H.; Chen, X.M.; Li, J.F. New information on functional ceramics research progress and challenges. Mater. Progr. China 2010, 29, 30–36. [Google Scholar]
- Tressler, J.F.; Alkoy, S.; Dogan, A.; Newnham, R.E. Functional composites for sensors, actuators and transducers. Compos. Part. A-Appl. S. 1999, 30, 477–482. [Google Scholar] [CrossRef]
- Wang, Y.Y.; Chen, Y.; Zheng, D.Y. Development of multifunctional electronic-ceramics with piezoelectric effect and varistor behavior. Ceram. Int. 2022, 48, 26818–26827. [Google Scholar] [CrossRef]
- Wang, Y.Y.; Pan, J.X.; Zhang, S.W.; Tian, F.; Zheng, D.Y.; Wang, Y.M. Multiple functional electronic ceramics with piezoelectricity and varistor behavior. J. Mater. Sci. Mater. Electron. 2025, 36, 1949. [Google Scholar] [CrossRef]
- Torsten, B.; Wanda, W.; Erling, R.; Annette, P.; Marija, K.; Barbara, M. New piezoceramic PZT-PNN material for medical diagnostics applications. J. Eur. Ceram. Soc. 2001, 21, 1469–1472. [Google Scholar]
- Gao, X.; Wu, J.; Yang, Y.; Chu, Z.; Shi, H.; Dong, S. Giant piezoelectric coefficients in relaxor piezoelectric ceramics PNN-PZT for vibration energy harvesting. Adv. Funct. Mater. 2018, 28, 1706895. [Google Scholar] [CrossRef]
- Wang, Q.; Bian, L.; He, S.; Wang, N.; Yang, B.; Cao, W.W. Morphotropic phase boundary composition PNN-PZT ceramics and their outstanding electromechanical properties. J. Alloys Compd. 2024, 1002, 175249. [Google Scholar] [CrossRef]
- Levassort, F.; Tran-Huu-Hue, P.; Ringaard, E.; Lethiecq, M. High-frequency and hightemperature electromechanical performances of new PZT-PNN piezoceramics. J. Eur. Ceram. Soc. 2001, 21, 1361–1365. [Google Scholar] [CrossRef]
- Lee, J.-R. Effect of Pressure and Thermal History on Grain Boundary Solute Coverage in ZnO-Bi2O3 and Relation to Varistor Properties. Ph.D. Thesis, Massachusetts Institute of Technology, Cambridge, MA, USA, 1995. [Google Scholar]
- Tsonos, C.; Kanapitsas, A.; Triantis, D.; Anastasiadis, C.; Stavrakas, I.; Pissis, P.; Neagu, E. Interface states and MWS polarization contributions to the dielectric response of low voltage ZnO varistor. Ceram. Int. 2011, 37, 207–214. [Google Scholar] [CrossRef]
- Hishita, S.; Yao, Y.; Shirasaki, S. Zinc Oxide Varistors Made from Powders Prepared by Amine Processing. ChemInform 1989, 20, 338–340. [Google Scholar] [CrossRef]
- Wang, S.; Liu, Q.; Cai, E.; Mou, F.; Xue, A. Relaxor behavior and superior ferroelectricity of Y2O3-doped (Ba0.98Ca0.02) (Ti0.94Sn0.04Zr0.02)O3 lead-free ceramics. J. Rare Earth. 2022, 40, 942–951. [Google Scholar] [CrossRef]
- Zheng, D.Y.; Swingler, J.; Weaver, P. Current leakage and transients in ferroelectric ceramics under high humidity conditions. Sens. Actuators A Phys. 2010, 158, 106–111. [Google Scholar] [CrossRef]
- Peng, G.G.; Zheng, D.Y.; Cheng, C.; Zhang, J.; Zhang, H. Effect of rare-earth addition on morphotropic phase boundary and relaxation behavior of the PNN-PZT ceramics. J. Alloy. Compd. 2017, 693, 1250–1256. [Google Scholar] [CrossRef]
- Stringer, C.J.; Shrout, T.R.; Randall, C.A. High-temperature perovskite relaxor ferroelectrics: A comparative study. J. Appl. Phys. 2007, 101, 054107. [Google Scholar] [CrossRef]
- Uchino, K.; Nomura, S. Critical exponents of the dielectric constants in diffused-phase-transition crystals. Ferroelectr. Lett. Sect. 1982, 44, 55. [Google Scholar]
- Cai, E.P.; Liu, Q.B.; Zeng, F.F.; Wang, Y.Y.; Xue, A. A comparative study of lead-free (Ba0.85Ca0.15)(Ti0.9Zr0.08Sn0.02)O3 ceramics prepared by conventional sintering and microwave sintering techniques. Ceram. Int. 2018, 44, 788–798. [Google Scholar] [CrossRef]
- Scott, J.F. Ferroelectrics go bananas. J. Phys. Condens. Matter 2008, 20, 021001. [Google Scholar] [CrossRef]


Disclaimer/Publisher’s Note: The statements, opinions and data contained in all publications are solely those of the individual author(s) and contributor(s) and not of MDPI and/or the editor(s). MDPI and/or the editor(s) disclaim responsibility for any injury to people or property resulting from any ideas, methods, instructions or products referred to in the content. |
© 2026 by the authors. Licensee MDPI, Basel, Switzerland. This article is an open access article distributed under the terms and conditions of the Creative Commons Attribution (CC BY) license.