Article

Optimizing Conductive Polymer Composites: The Role of Graphite Particle Size and Concentration in PVDF, PP, and PET Matrices

1
Research Center for High Performance Polymer and Composite Systems, CREPEC, Montreal, QC H3A OC3, Canada
2
Department of Chemical Engineering, Laval University, Québec, QC G1V 0A6, Canada
3
Department of Mechanical Engineering, Sherbrooke University, Sherbrooke, QC J1K 2R1, Canada
4
Nouveau Monde Graphite, Saint-Michel-des-Saints, QC J0K 3B0, Canada
5
Plastiques Gagnon, Saint-Jean-Port-Joli, QC G0R 3G0, Canada
*
Author to whom correspondence should be addressed.
J. Compos. Sci. 2025, 9(4), 178; https://doi.org/10.3390/jcs9040178
Submission received: 21 February 2025 / Revised: 28 March 2025 / Accepted: 3 April 2025 / Published: 7 April 2025
(This article belongs to the Special Issue Composite Materials Containing Conjugated and Conductive Polymers)

Abstract

:
This study investigates the impact of graphite (GR) concentration and particle size on the performance of conductive polymer composites (CPCs) using polyvinylidene fluoride (PVDF), polypropylene (PP), and polyethylene terephthalate (PET) as matrix materials. Composites were prepared with GR concentrations ranging from 20 to 60 wt. % and particle sizes categorized as G1 (5.9 µm), G2 (17.8 µm), and G3 (561 µm), and evaluated for their electrical, thermal, and mechanical properties. The investigation of the effect of graphite particle size on composite properties represents the main originality of this work. Among all composites, PVDF containing 60 wt. % of medium-sized G2 particles exhibited the lowest electrical resistivity (0.77 ohm·cm through-plane and 0.69 ohm·cm in-plane), along with the highest residual ash content (72%). In PP and PET matrices, incorporating 60 wt. % G2 particles resulted in through-plane resistivities of 11.3 ohm·cm and 1.6 ohm·cm, and in-plane resistivities of 5 ohm·cm and 1.2 ohm·cm, respectively, with thermal decomposition temperatures of 374 °C and 401 °C. Regarding mechanical performance and thermal stability, composites with small-sized G1 particles demonstrated superior performance due to their larger surface area and stronger matrix interactions. The PVDF/G1 (40/60 wt. %) composite achieved the highest flexural modulus (6.8 GPa), flexural strength (38.6 MPa), compressive modulus (0.28 GPa), and decomposition temperature (445 °C), highlighting its exceptional properties. These CPCs show significant promise for energy and electronic applications, particularly in the fabrication of bipolar plates for proton exchange membrane fuel cells, as well as in shielding materials and thermoelectric devices.

1. Introduction

Polymer composites are materials formed by combining a polymeric matrix with various additives, resulting in a final material with properties superior to those of the neat polymer [1,2]. These additives, typically classified as reinforcements or fillers, are dispersed within the polymer matrix, where their interaction with the matrix enhances the composite’s physical, mechanical and thermal properties [3,4,5]. Over the past two decades, there has been growing research interest in incorporating fillers into polymer matrices due to their significant impact on improving polymer performance [6,7,8]. This area of study has been pivotal in advancing conductive polymer composites (CPCs), which are highly valued for their low cost, excellent corrosion resistance, and lightweight nature [9,10,11]. CPCs play a crucial role in various specialized applications, including electromagnetic interference (EMI) shielding [12], charge storage devices [13], and proton exchange membrane fuel cells [14]. Additionally, polymer composites reinforced with graphite exhibit markedly improved tribological performance, enhancing wear resistance and reducing friction, alongside superior thermal conductivity, making them well-suited for high-performance applications in heat management and mechanical systems [15].
Research on CPCs has shown that incorporating carbon-based fillers such as carbon black (CB) [16], carbon fibers (CF) [17], expanded graphite (EG) [18], carbon nanotubes (CNTs) [19], and graphite (GR) [20] can significantly enhance the electrical performance of these materials [21]. Among these fillers, GR is one of the most widely used in CPCs due to its high electrical and thermal conductivity, corrosion resistance, low specific gravity, and inert nature. Dweiri et al. examined the effect of GR content on the electrical conductivity of polypropylene (PP)/GR composites [22]. Their findings reveal that adding 40 wt. % GR to pure PP increased its conductivity from 10−16 to 10−3 S·cm−1, while further increasing the GR content to 80 wt. % resulted in a conductivity of 7 S·cm. In addition to filler concentration, the shape and size of fillers significantly influence electrical performance. Derieth et al. investigated the effects of varying GR particle sizes (5, 10, and 20 µm) at a constant GR content (78 wt. %) on the electrical conductivity of PP/GR composites [23]. They found that electrical conductivity increased as GR particle size decreased, with the highest conductivity of 20.6 S·cm−1 achieved in a composite containing flake-like GR with a particle size of 5 µm. However, polymer composites face the challenge of balancing electrical conductivity with mechanical properties. Specifically, the excessive addition of conductive fillers in CPCs can enhance electrical conductivity but often reduces mechanical strength [24,25]. For example, the mechanical properties of PP/EG composites with varying EG concentrations from 10 wt. % to higher levels were studied [26]. A composite with 10 wt. % EG exhibited a conductivity of 0.6 S·cm−1, but its flexural strength decreased by approximately 10%. Further increases in EG content did not significantly affect the flexural strength, which remained below that of neat PP.
Another important factor influencing the overall performance of CPCs is the type of polymeric matrix [27]. Various thermoplastic materials have been used in the production of CPCs, including polyethylene (PE), polypropylene (PP), polyethylene terephthalate (PET), polyvinylidene fluoride (PVDF), and polyimide (PI) [28,29,30]. Each polymer offers distinct advantages—PET is valued for its superior mechanical properties [31], PP is preferred for its low cost and ease of processing [32], and PVDF is recognized for its excellent chemical and thermal stability [33]. Selecting the appropriate polymer matrix is crucial for optimizing CPCs for their intended applications, as it enables a balance between electrical conductivity and the mechanical properties of the final product.
In this study, a series of CPCs based on PVDF, PP, and PET matrices were developed by incorporating various types of graphite (GR). The originality of this work lies in the investigation of the effect of graphite particle size on the performance of the composites. Specifically, the research aims to examine how variations in GR concentration and particle size influence the electrical conductivity, thermal stability, and mechanical properties of the resulting CPCs.

2. Materials and Methods

2.1. Materials

Polyvinylidene fluoride (PVDF, commercial grade Kynar® 720, with a density of 1.78 g/cm3 and an MFI of 7.0 g/10 min) was supplied by Arkema, King of Prussia, PA, USA. Polyethylene terephthalate (PET, commercial grade NEOPET 8, with a melting temperature of 248 °C) was sourced from NEOGROUP, Klaipeda district, Lithuania. Polypropylene (PP SC973, with a density of 0.9 g/cm3 and an MFI of 100 g/10 min) was provided by Basell, Pasadena, TX, USA. Three types of high-purity GR with varying particle sizes were generously supplied by Nouveau Monde Graphite (NMG) in Saint-Michel-des-Saints, QC, Canada. Details about the GR particle sizes are presented in Table 1. In ascending order of particle size, the three types of GR were designated as G1, G2, and G3.

2.2. Composite Preparation

The conductive PVDF/GR, PP/GR, and PET/GR composites were prepared using an internal mixer (Intelli-Torque, 150 RPM Plasti-Corder, South Hackensack, NJ, USA). During the compounding process, the matrix was first incorporated into the mixing chamber and mixed for 3 min. GR was then introduced at up to 60 wt. % (as 70 wt. % of GR resulted in insufficient wettability) and mixed for an additional 7 min. The rotational speed was kept constant at 60 rpm, and the compounding temperatures were maintained at 230 °C, 200 °C, and 270 °C for PVDF, PP, and PET, respectively. The sample formulations are provided in Table 2.
For characterization, a series of samples were compression-molded using a hot press (Autoseries 3893, 15 tons, Carver, Wabash, IN, USA) at the respective compounding temperatures under a pressure of 50 kPa for 15 min. Subsequently, the mold was cooled to room temperature using a water-cooling system. The dimensions and geometry of the prepared samples are detailed in the subsequent characterization sections.

2.3. Characterization

2.3.1. Morphology Characterization

To characterize the morphology of the composites and assess the integration and dispersion of GR within the structure, a JEOL scanning electron microscope (SEM, model JSM-840A, JEOL Ltd., Tokyo, Japan) operating at 15 kV was used. To ensure surface conductivity, the composites were cryo-fractured in liquid nitrogen, and the cross-sections were sputter-coated with a gold/palladium (Au/Pd) thin layer.

2.3.2. Fourier Transform Infrared Characterization

Fourier Transform Infrared (FTIR) spectroscopy was conducted using a Nicolet Magna 850 spectrometer (Nicolet, Madison, WI, USA) to identify the crystalline phases of PVDF and PVDF/GR samples. Spectra were recorded across a wavelength range of 600 to 1600 cm−1.

2.3.3. Thermal Stability and Electrical Resistivity Characterization

The thermal stability of the composites containing varying percentages of GR was evaluated under a nitrogen atmosphere using a thermogravimetric analyzer (TGA, SDTA851e, Zurich, Switzerland). The analysis was conducted at a heating rate of 10 °C/min over a temperature range of 50 to 700 °C.
For electrical resistance measurements, a circular-shaped sample with a thickness of 2 mm and a diameter of 25 mm was placed between two gold-plated electrodes. To minimize contact resistance, a highly conductive and flexible carbon cloth was positioned between each electrode and the sample. The electrical resistance of the sample was determined by first measuring the electrical resistivity of the carbon cloth alone and subtracting it from the resistivity value obtained with the sample. The procedure for measuring electrical resistivity involved applying a constant current of I = 5 A and a force of 450 N to the sample. The volume resistivity, ρ (ohm·cm), was calculated using the resistance (R), the electrode surface area, and the sample thickness, as described by Equation (1) [32].
ρ = RπD2/4h
where D (cm) is the electrode diameter, h (cm) is the sample thickness and R (ohm) is the sample’s electrical resistance.

2.3.4. Mechanical Characterization

Flexural tests were performed in accordance with ASTM D790 using an Instron testing machine (model 5565, Instron, Norwood, MA, USA) equipped with a 5 kN load cell, operating at a crosshead speed of 2 mm/min. A three-point bending support span of 12 mm × 12 mm was used. All tests were performed at room temperature, and the reported results represent the average of three measurements taken from three different samples. The flexural strength, σ (MPa), which measures the material’s ability to withstand the maximum applied load Fmax (N) before failure, and the flexural modulus, E (GPa), which reflects the material’s resistance to deformation under load, were calculated using Equations (2) and (3), respectively.
σ = 3FmaxL/2bh2
E = L3m/4bh3
where L (mm) is the length of the support span (L = 57 mm), m is the slope of the tangent at the origin of the load displacement curve, and b (mm) and h (mm) are the width and the thickness of the sample, respectively.
Compressive strength and modulus tests were conducted at room temperature using an Instron universal testing machine (model 5565, Instron, Norwood, MA, USA). The samples were cylindrical, with a diameter of 12.7 mm and a length of 25.4 mm, prepared in accordance with ASTM D695 standards. The crosshead speed was set to 1.3 mm/min, and a 5 kN load cell was used. Each test was performed on three samples, and the average values for compressive elastic modulus and compressive strength were calculated.

3. Results and Discussion

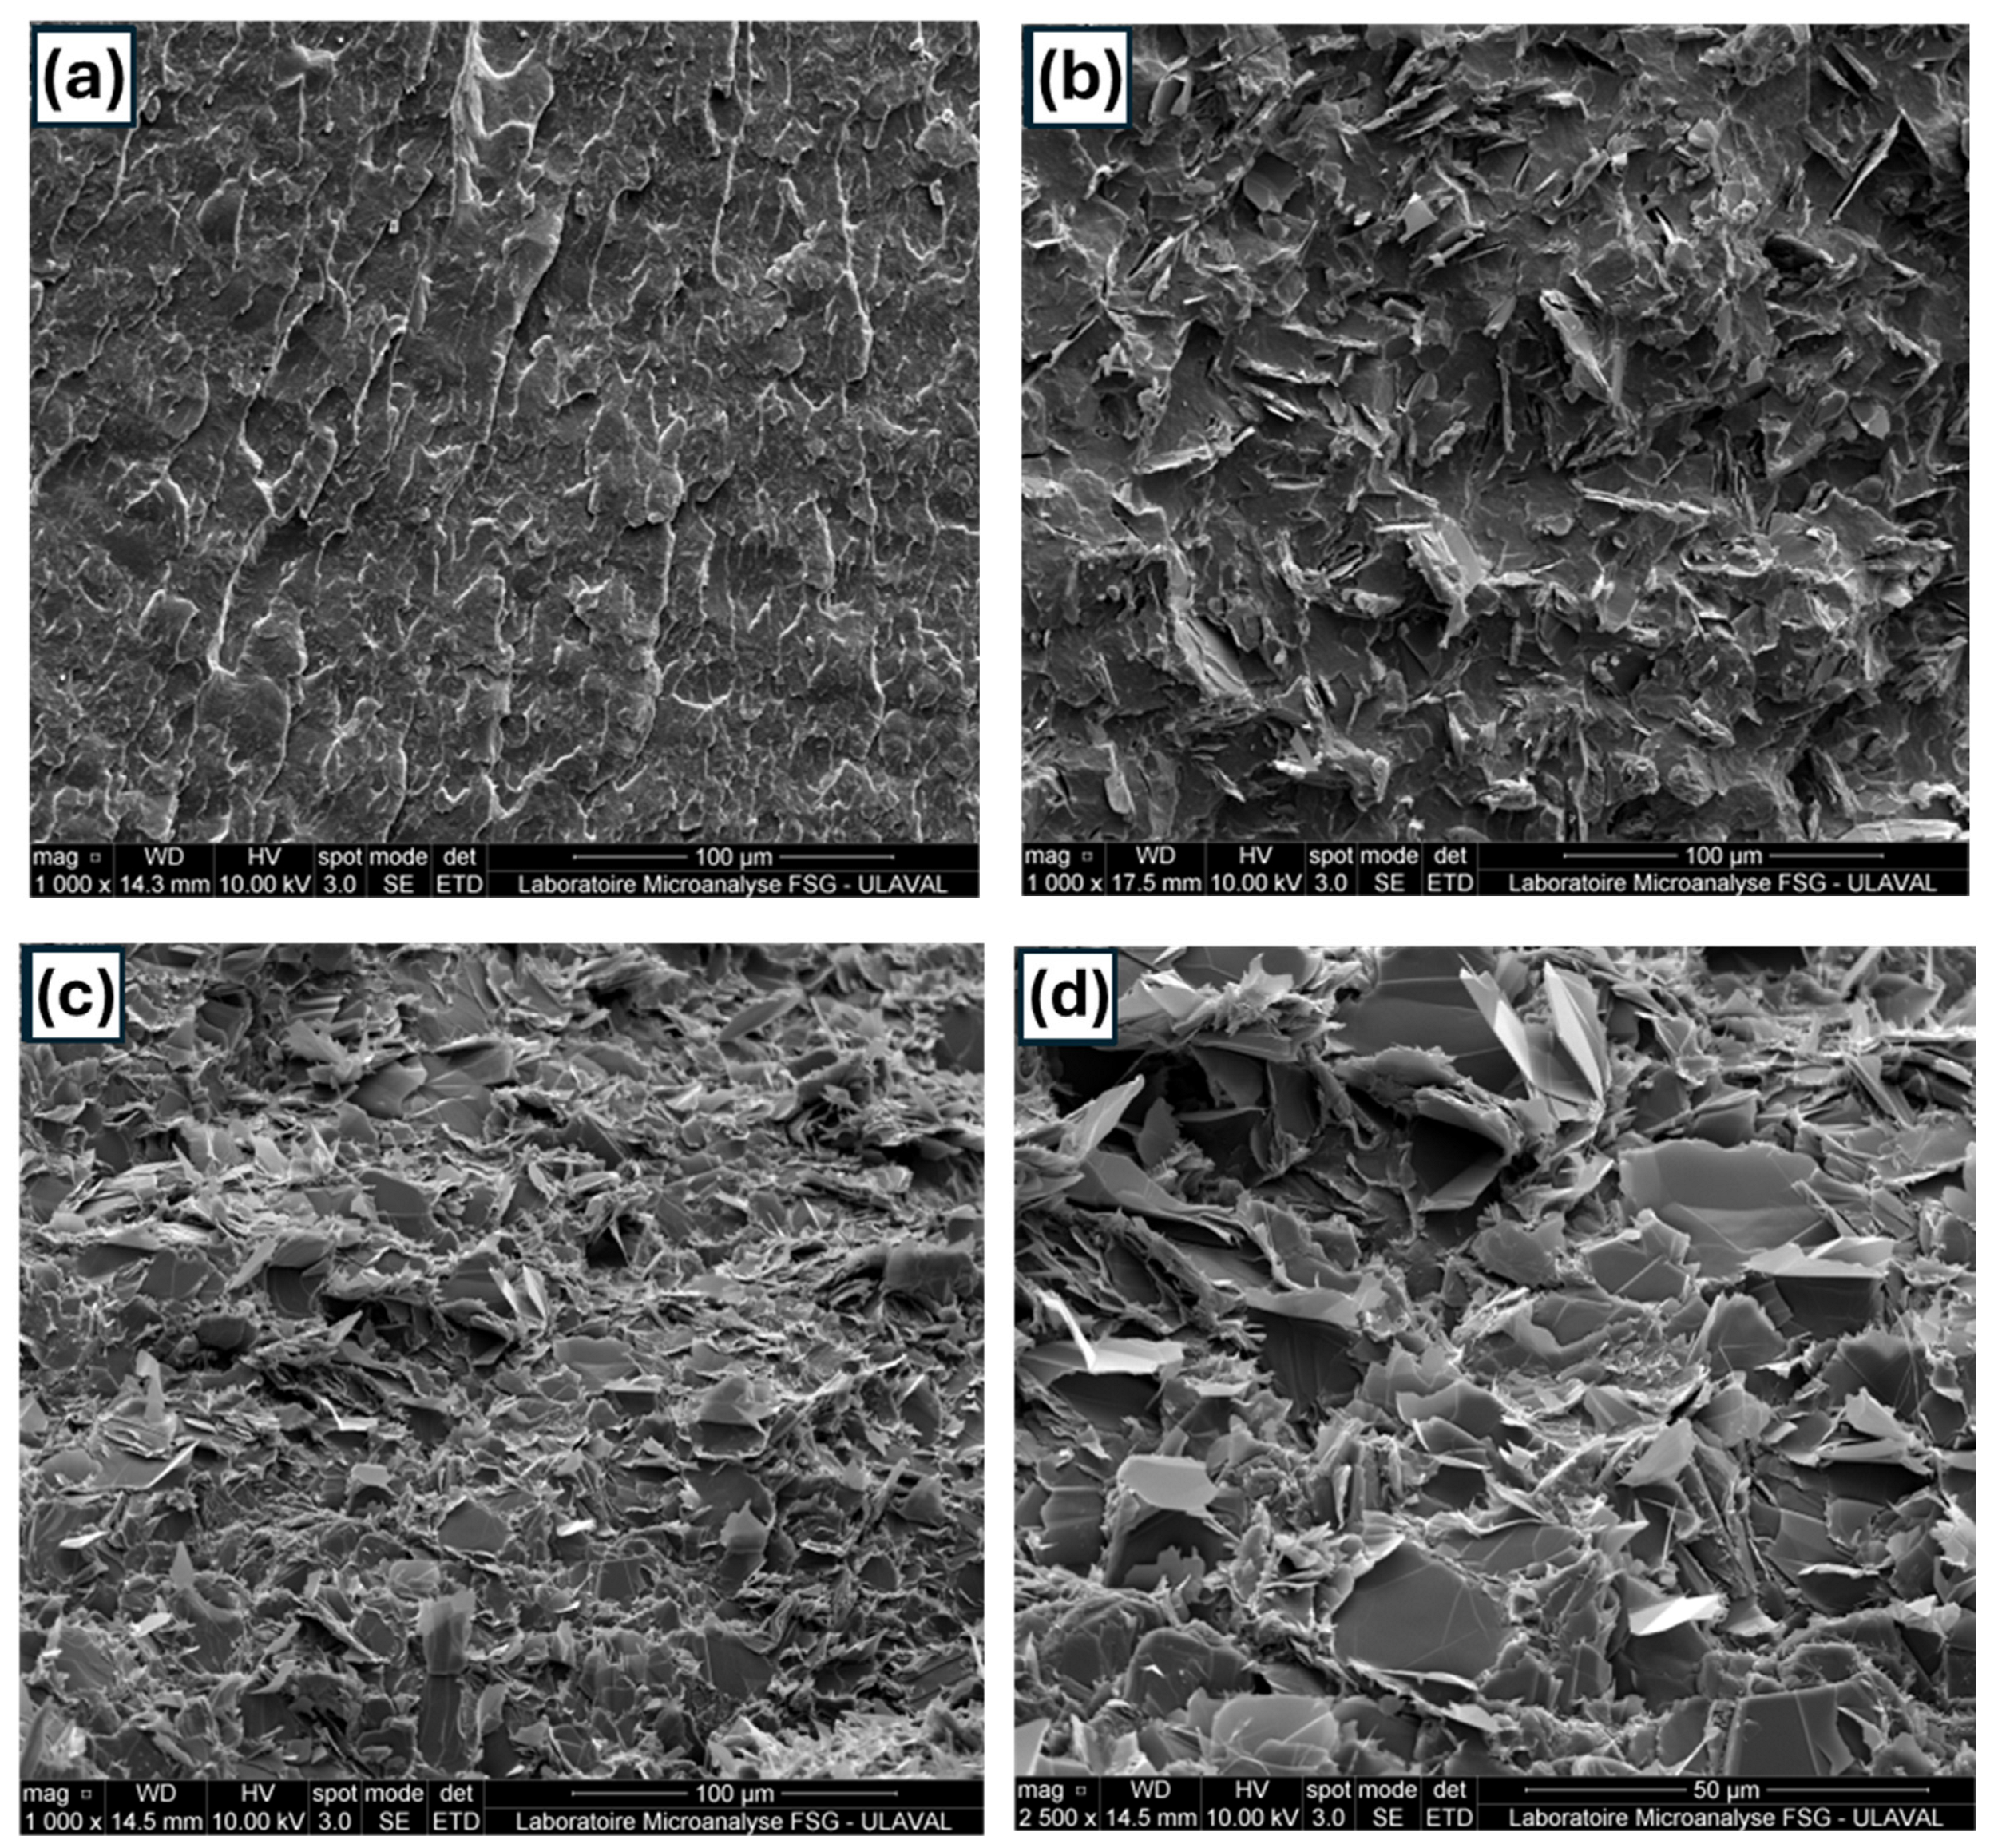
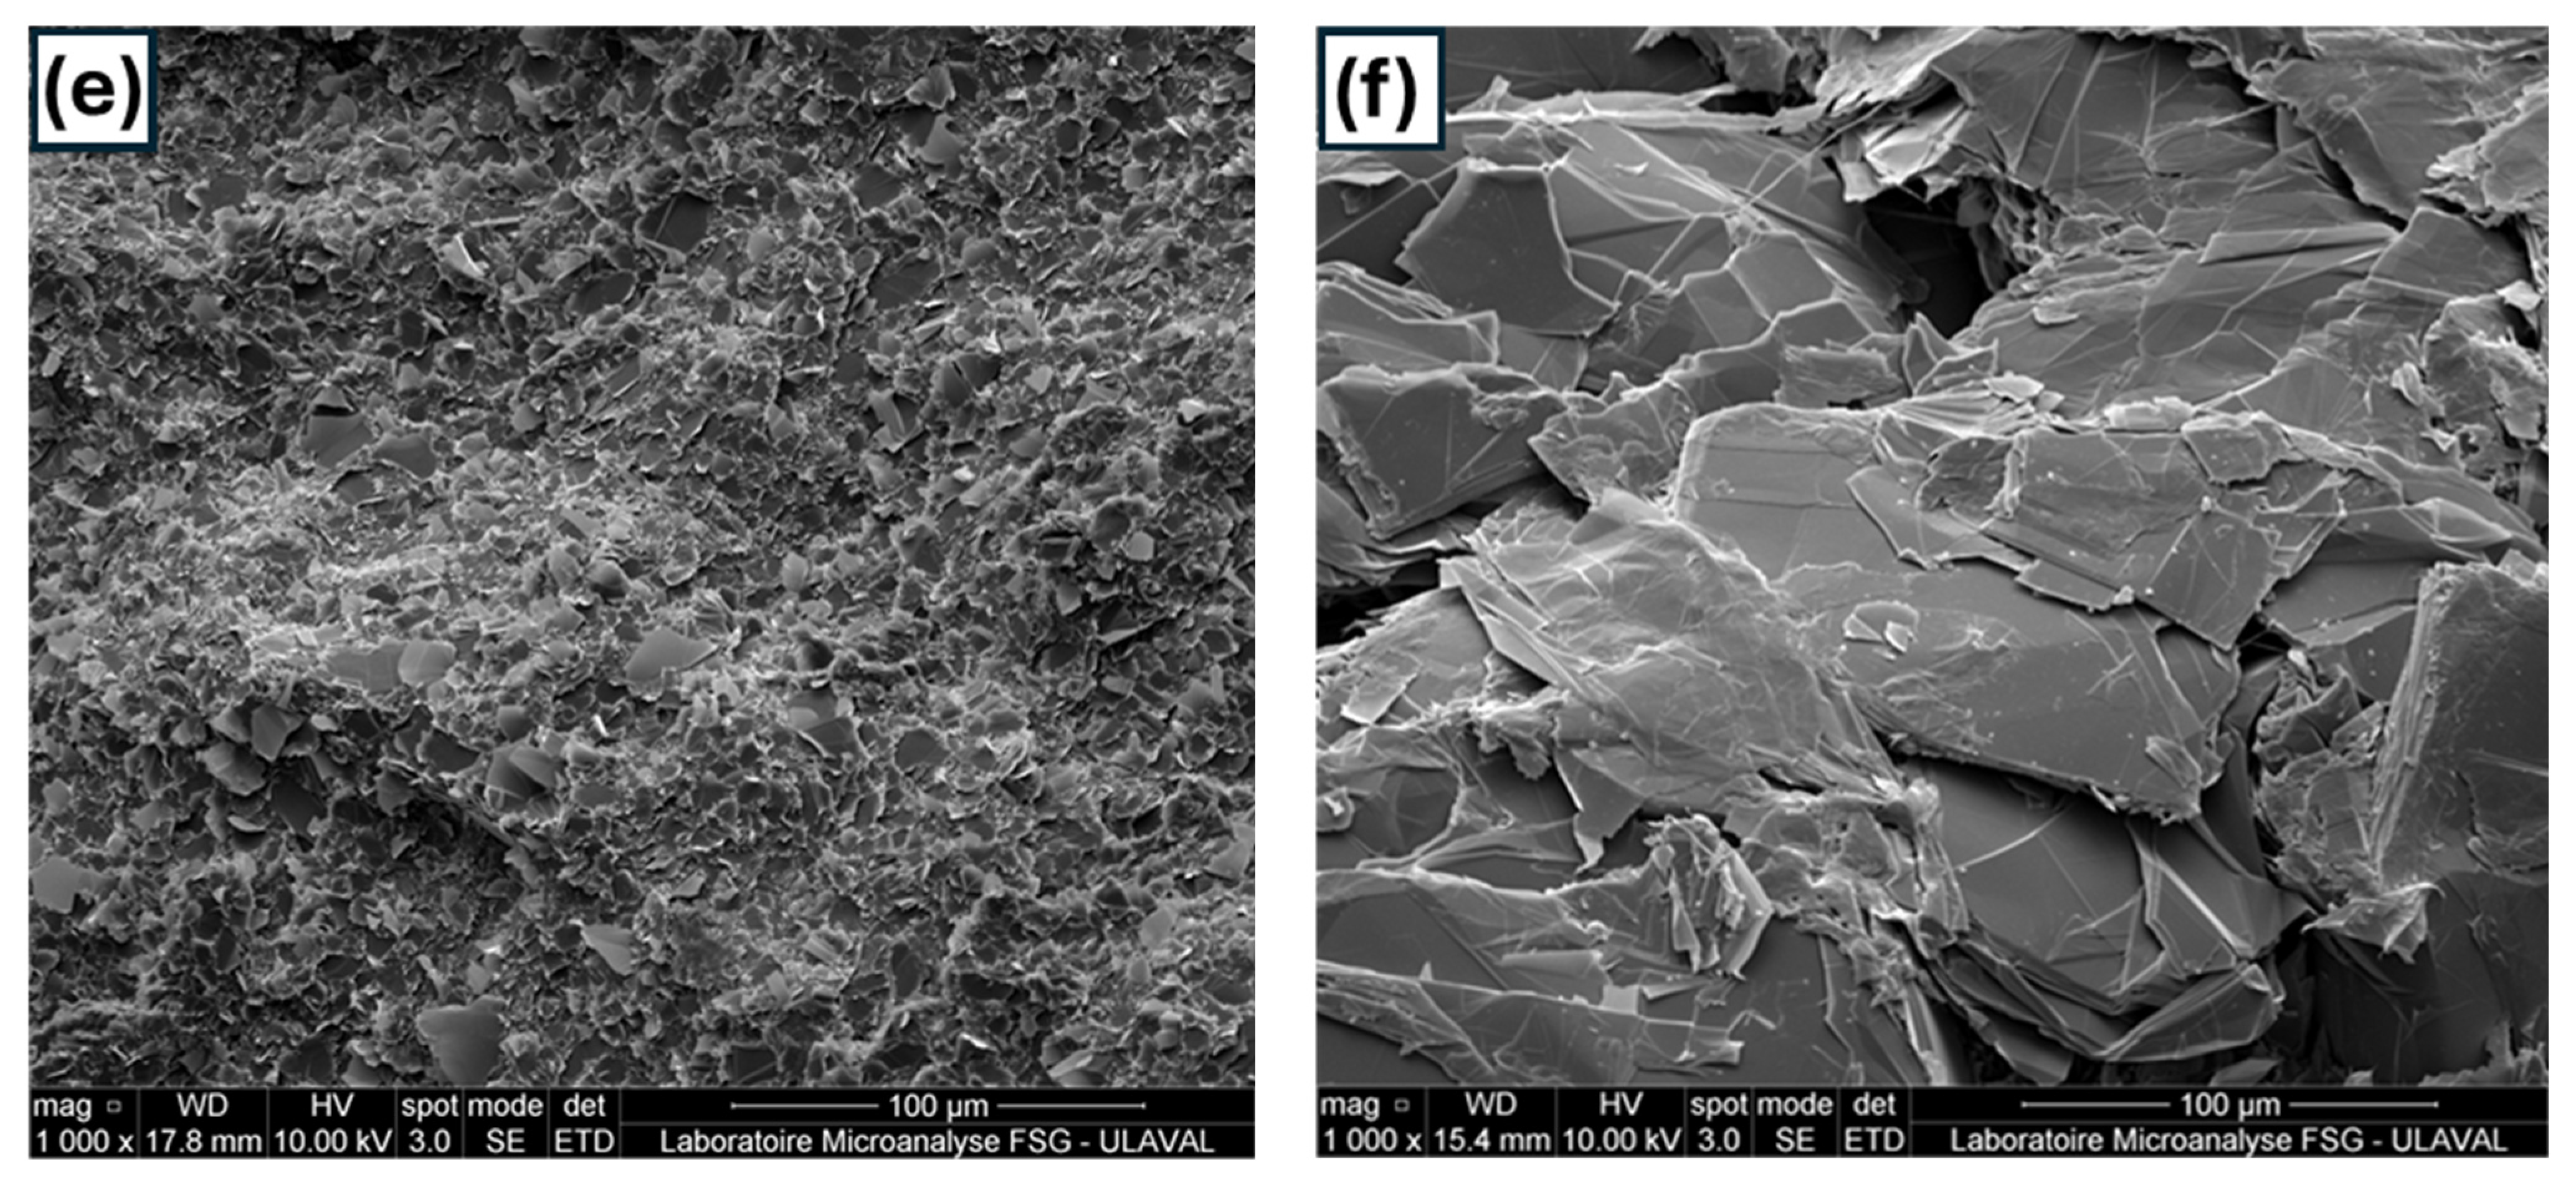
3.1. Composites Morphology

Figure 1 shows SEM micrographs of the cryo-fractured cross-sectional surface of neat PVDF (Figure 1a) and that of some developed PVDF/GR composites. To examine morphological differences between composites with low and high GR contents, PVDF/G2 composites containing 20 wt. % and 60 wt. % G2 were analyzed under the same magnification (Figure 1b,c). The figures show that, at 60 wt. % G2, the composite sample exhibits a denser graphite dispersion compared to the 20 wt. % G2 sample. A higher magnification image of the 60 wt. % composite (Figure 1d) reveals a well-defined layered structure, attributed to the uniform distribution of flaky G2 graphite particles within the PVDF matrix.
To compare the morphology of composites containing different types of GR at the same concentration, PVDF/G1 (40/60), PVDF/G2 (40/60), and PVDF/G3 (40/60) were analyzed, with their corresponding micrographs shown in Figure 1e,c,f, respectively. Notably, no visible signs of GR agglomeration, such as large clusters or aggregated particles, are observed for the three particle sizes, suggesting effective dispersion due to strong interfacial interactions between the PVDF matrix and GR particles. This can be attributed to hydrogen bonding between PVDF and the graphite surface, along with the graphite’s surface chemistry, which enhances adhesion and promotes a uniform distribution of GR particles [34].

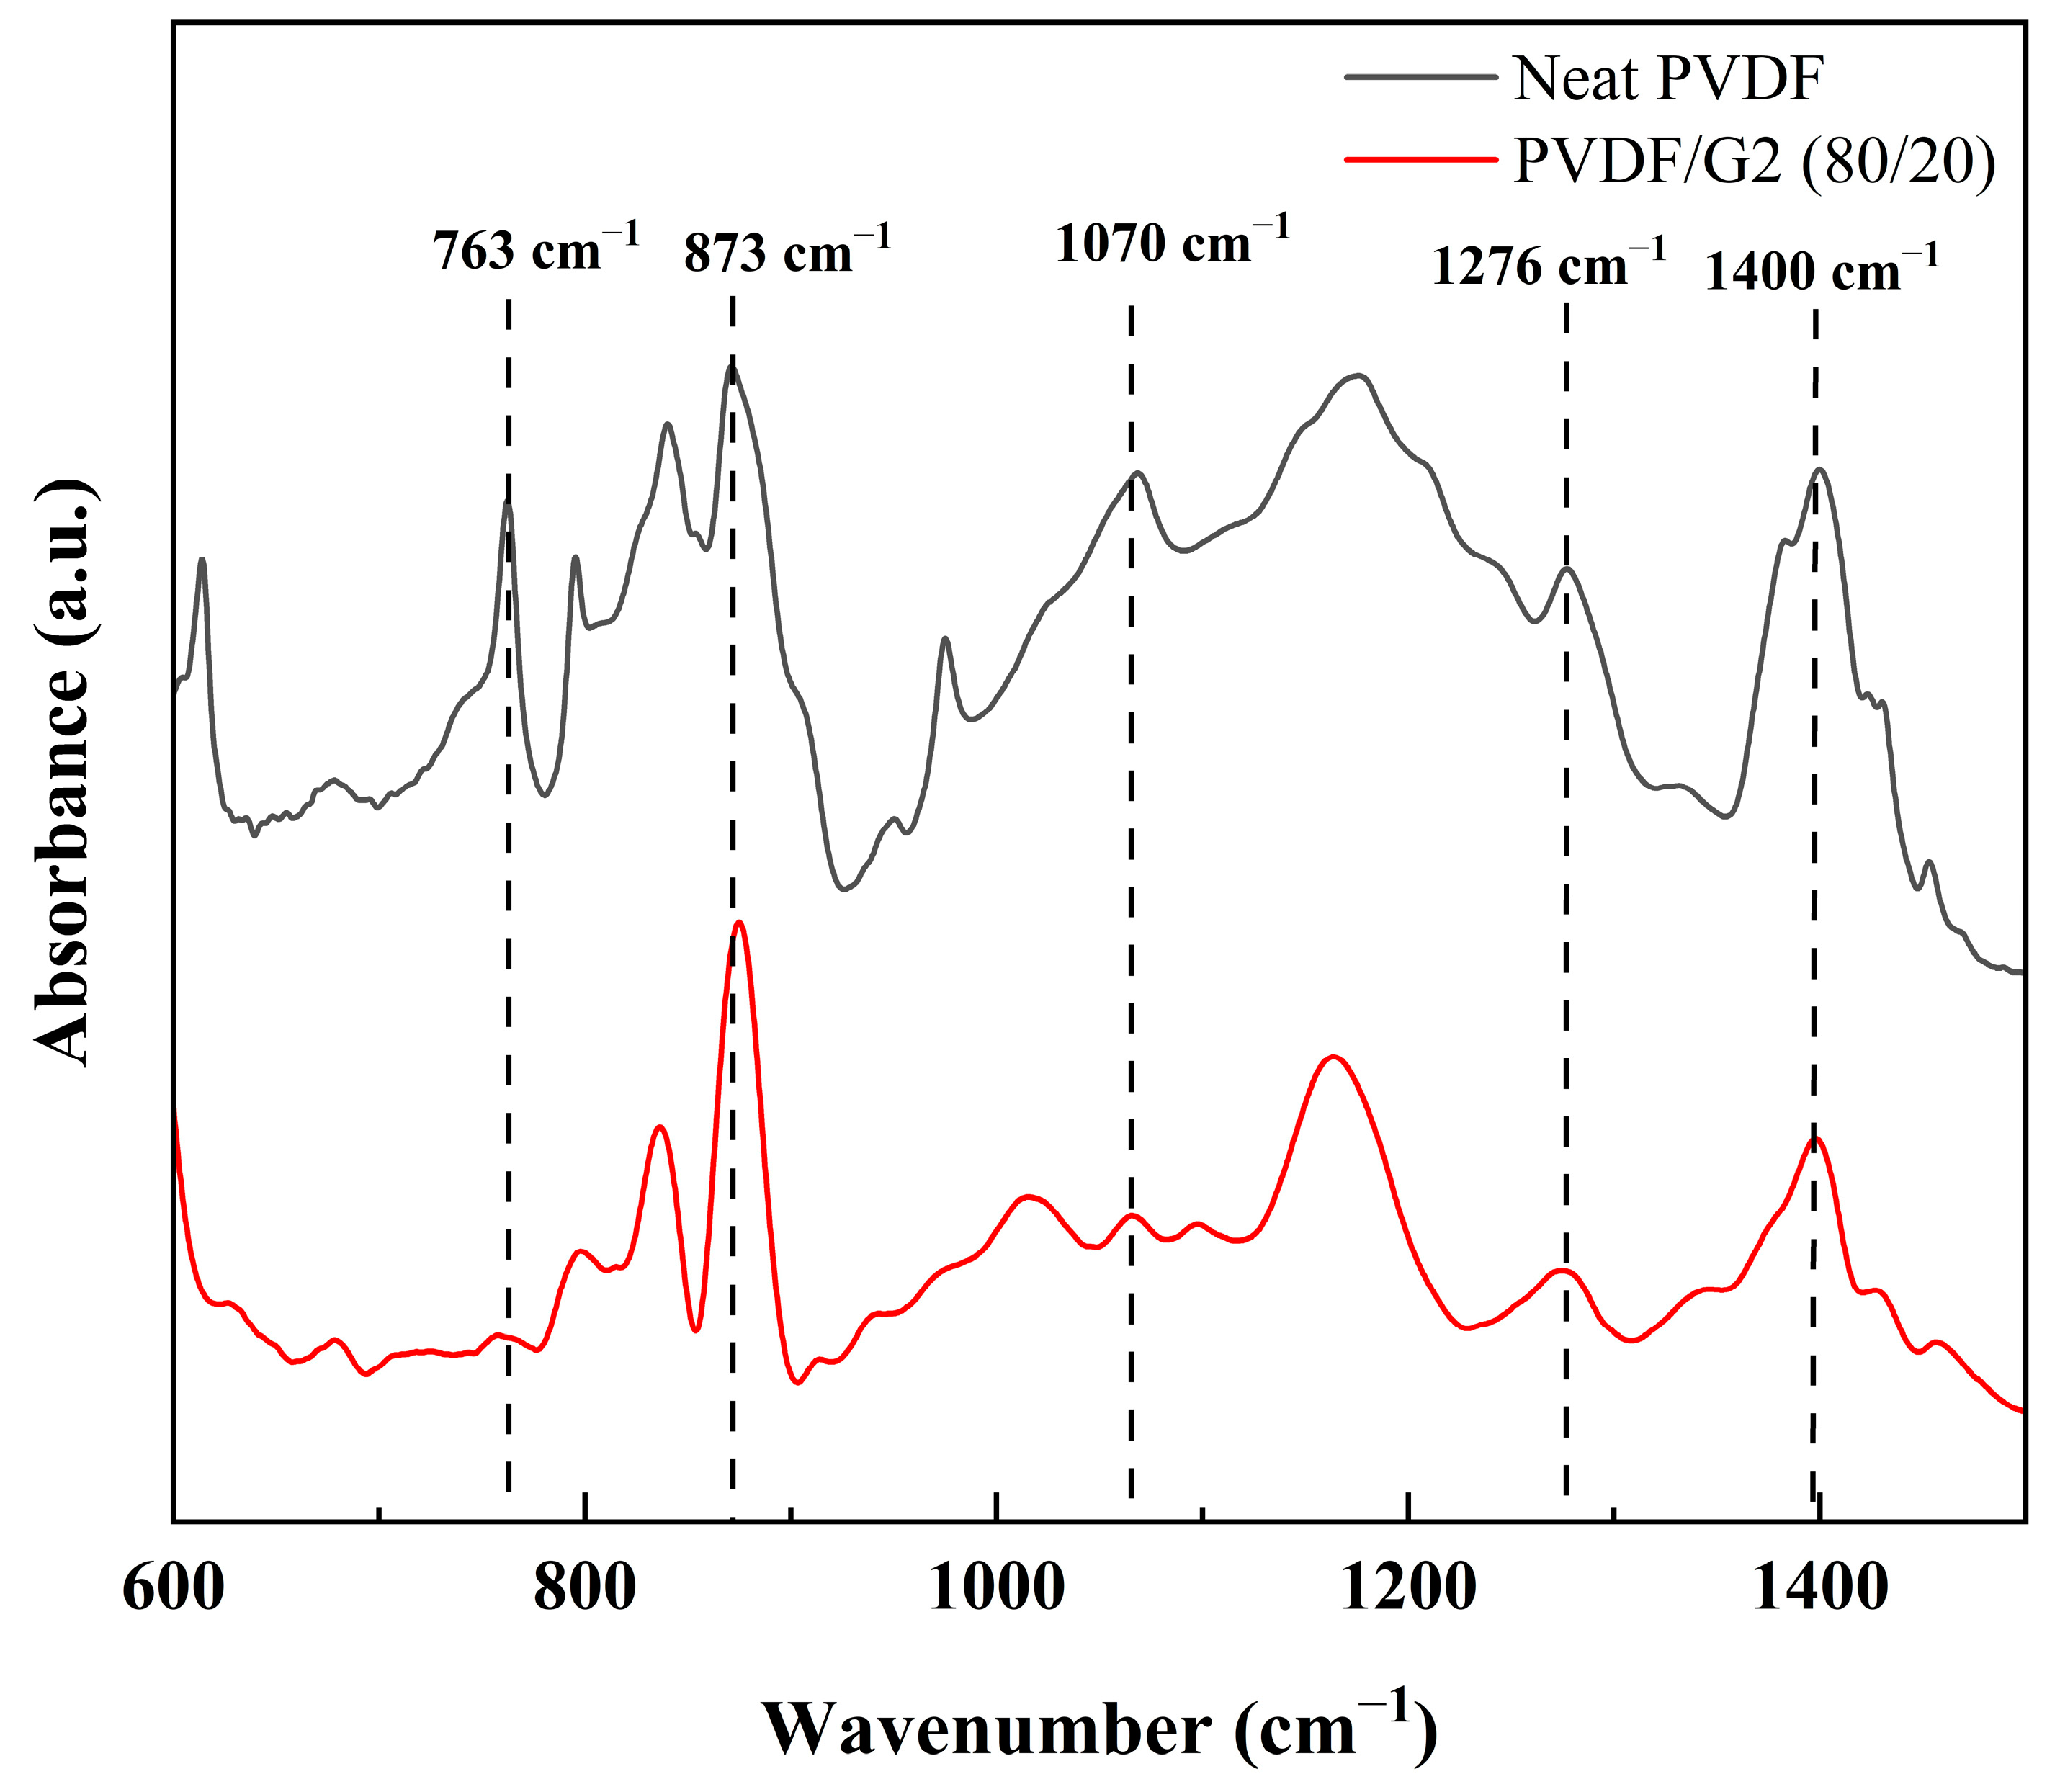
3.2. Fourier Transform Infrared Analysis

Figure 2 presents the FTIR vibrational spectra of neat PVDF and a PVDF/G2 (80/20) blend within the range of 600 to 1500 cm−1. Characteristic vibrational bands of the α-phase are observed at 614 cm−1, 763 cm−1 (CF2 bending and skeletal bending), 796 cm−1 (CH2 rocking) [35], 976 cm−1 (CH2 twisting) [36] and 1070 cm−1 [37]. For the β-phase of PVDF, key bands appear at 840 cm−1 (CH2 rocking), 1276 cm−1 [36] and 1400 cm−1 (CH2 wagging deformation) [37]. The γ-phase is indicated by the vibrational band at 873 cm−1 [36]. Upon the addition of 20 wt. % GR, the α, β and γ peaks are notably diminished. This reduction is attributed to the shielding effect, where GR absorbs and scatters infrared radiation, thereby lowering the intensity of the absorbed IR signal. Moreover, GR may disrupt the crystalline structure of PVDF and interfere with its molecular vibrations, further weakening the characteristic peaks of α, β, and γ phases.
Figure 2 presents the FTIR vibrational spectra of neat PVDF and the PVDF/G2 (80/20) blend within the range of 600 to 1500 cm−1. Characteristic vibrational bands of the α-phase are observed at 614 and 763 cm−1 (CF2 bending and skeletal bending), 796 cm−1 (CH2 rocking) [35], 976 cm−1 (CH2 twisting) [36], and 1070 cm−1 [37]. For the β-phase, key bands appear at 840 cm−1 (CH2 rocking), 1276 cm−1 [36], and 1400 cm−1 (CH2 wagging deformation) [37]. The γ-phase is indicated by the band at 873 cm−1 [36]. Upon the addition of 20 wt. % graphite (GR), the α, β, and γ peaks are notably diminished. This reduction is attributed to the shielding effect, where GR absorbs and scatters infrared radiation, thereby lowering the intensity of the IR signal. Moreover, GR may disrupt the crystalline structure of PVDF and interfere with its molecular vibrations, further weakening the characteristic peaks of each phase.

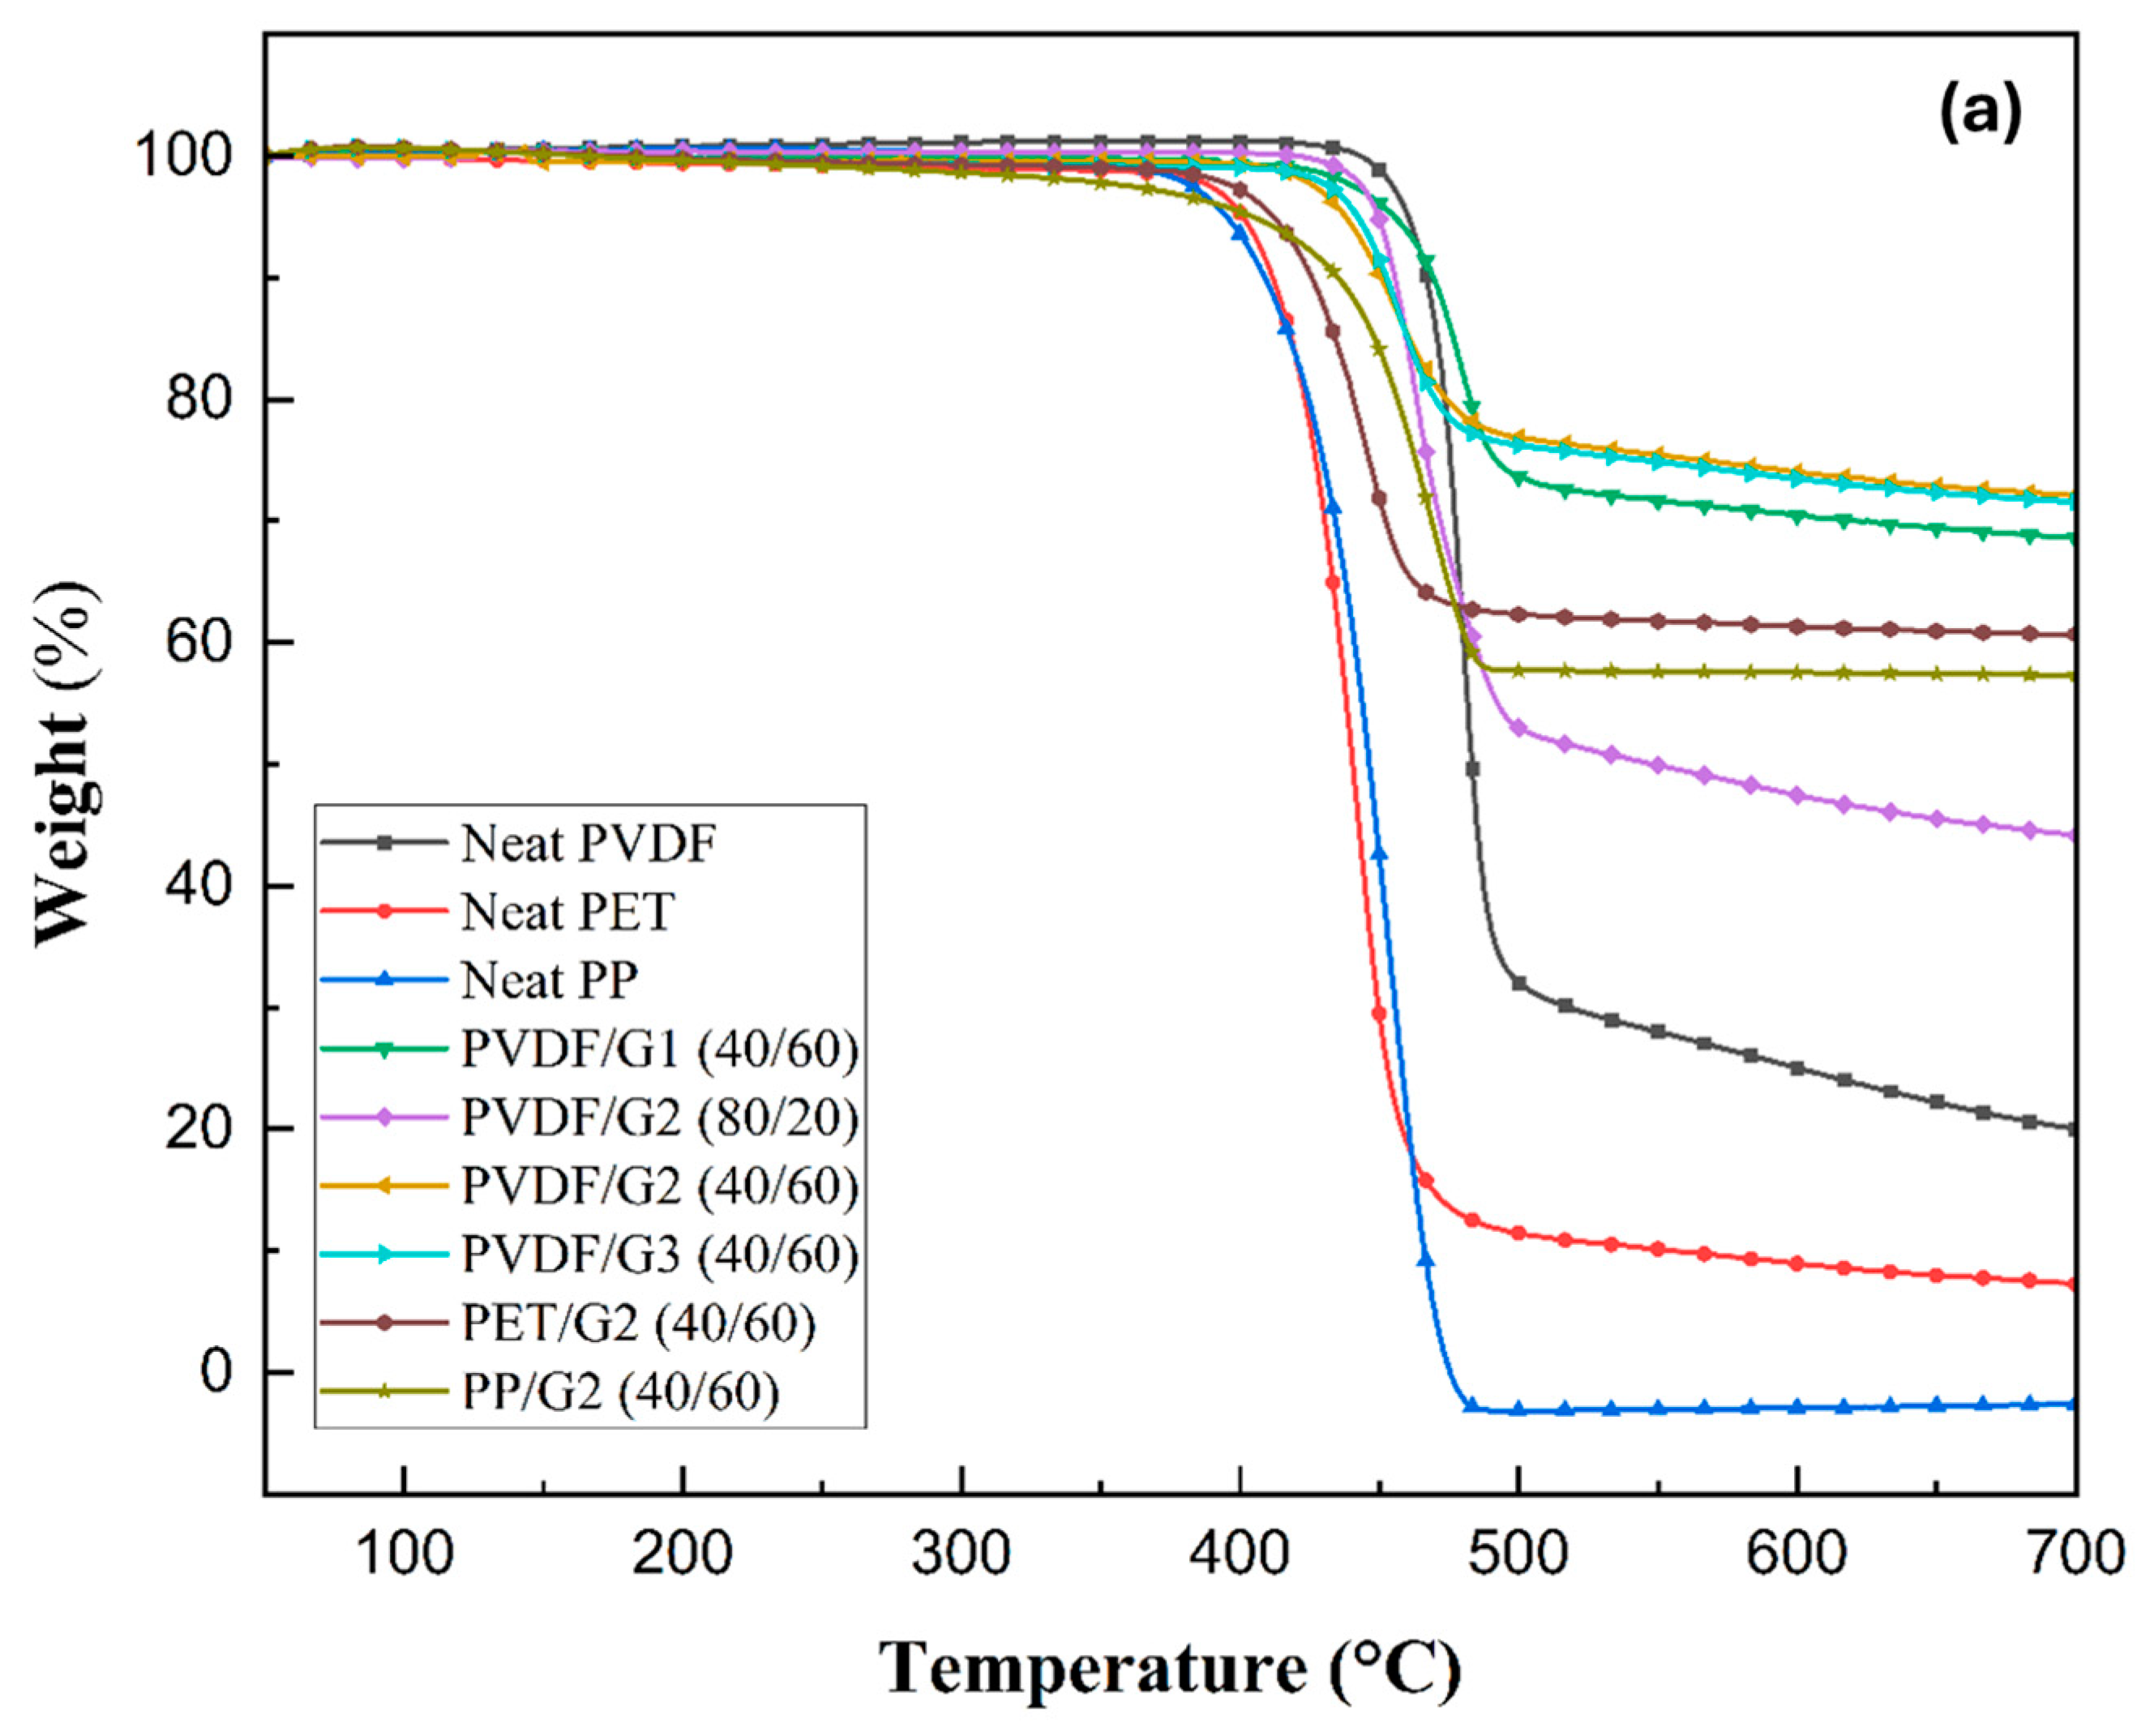
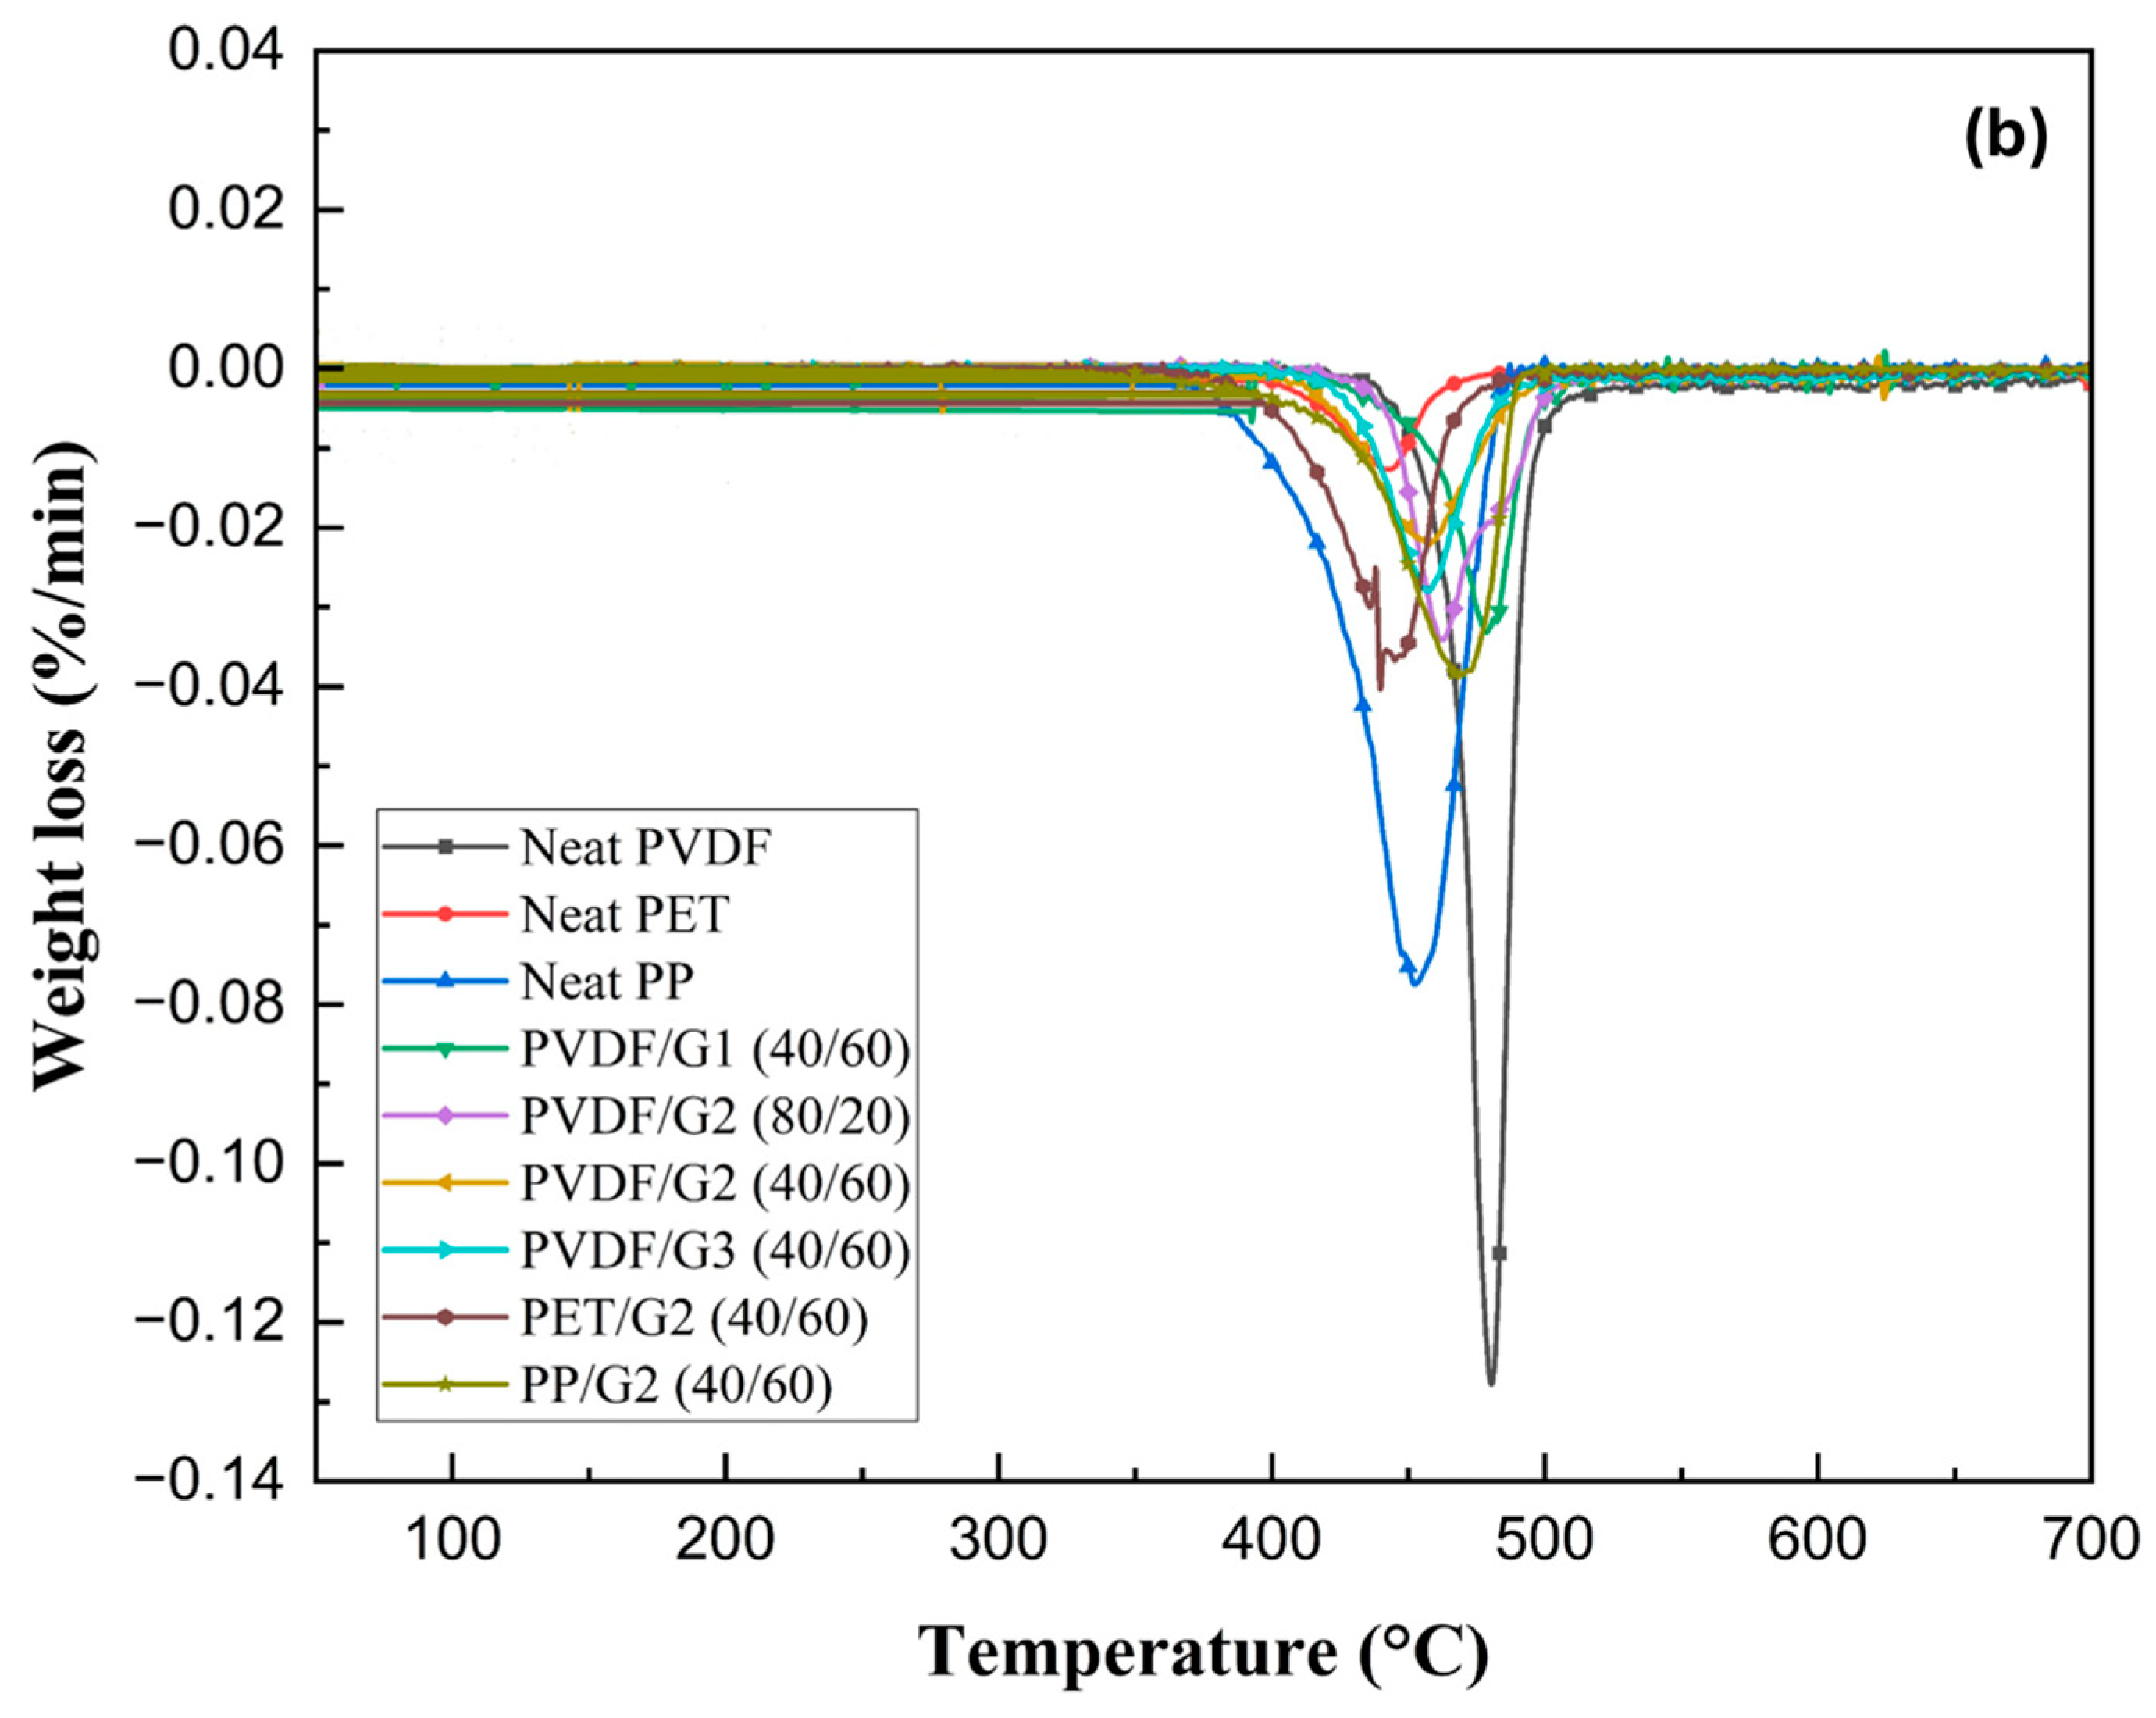
3.3. Composites Thermal Stability

Figure 3a,b present the thermogravimetric analysis (TGA) and derivative thermogravimetric (DTG) curves, respectively, of various samples, including neat PVDF, PP, PET, and their corresponding GR-filled composites (PVDF/G1, PVDF/G2, PVDF/G3, PP/G2, and PET/G2). The onset temperature, defined as the point at which a sample loses 3% of its initial mass, varies among the samples, indicating differences in thermal resistance. According to Figure 3a, neat PVDF exhibits a gradual weight loss starting at approximately 456 °C, while neat PP and PET begin decomposing at around 386 °C and 393 °C, respectively. The addition of 20 wt. % G2 slightly decreases the thermal stability of PVDF, lowering the decomposition temperature to 445 °C but increasing the residual ash content from 20% to 45% at 700 °C. This decrease can be attributed to the high thermal conductivity of GR [38], which efficiently transfers heat throughout the composite. This rapid heat transfer can lead to faster thermal degradation of the composites, as the polymer matrix absorbs heat more efficiently and reaches its decomposition temperature sooner [39]. The high thermal conductivity of GR becomes particularly significant at higher GR concentrations. Increasing the G2 content to 60 wt. % decreased the decomposition temperature to around 430 °C, with a residual ash content of 72%. For the PVDF/G1 (40/60) composite, the onset of decomposition was 445 °C, and the residual ash content was 68%. With the same GR content (60 wt. %) in PVDF/G3, decomposition commenced around 435 °C and the residual weight was 71%. G1 exhibited a higher decomposition temperature due to its small particle size, increased surface area, and improved dispersion, which enhanced interfacial bonding and thermal resistance. In the presence of 60 wt. % G2 within the PP matrix, the decomposition temperature of PP decreased from 386 °C to 374 °C, with a residual ash content of approximately 57%. Conversely, PET containing 60 wt. % G2 exhibited a decomposition onset at 401 °C, with a residual weight of 61%. This improvement can be attributed to the dispersion of filler particles, which restricts polymer chain mobility, while GR particles form effective barriers that create a more tortuous degradation pathway [40].
In summary, among composites with different matrices (PVDF, PP, and PET) but the same GR type and concentration (60 wt. %), PVDF/G2 demonstrated the highest thermal stability, characterized by the highest decomposition temperature (430 °C). PET also showed strong thermal stability, likely due to good interfacial adhesion with G2. In contrast, PP displayed the least improvement, indicating that G2 achieves better dispersion and interfacial interactions with PVDF and PET.

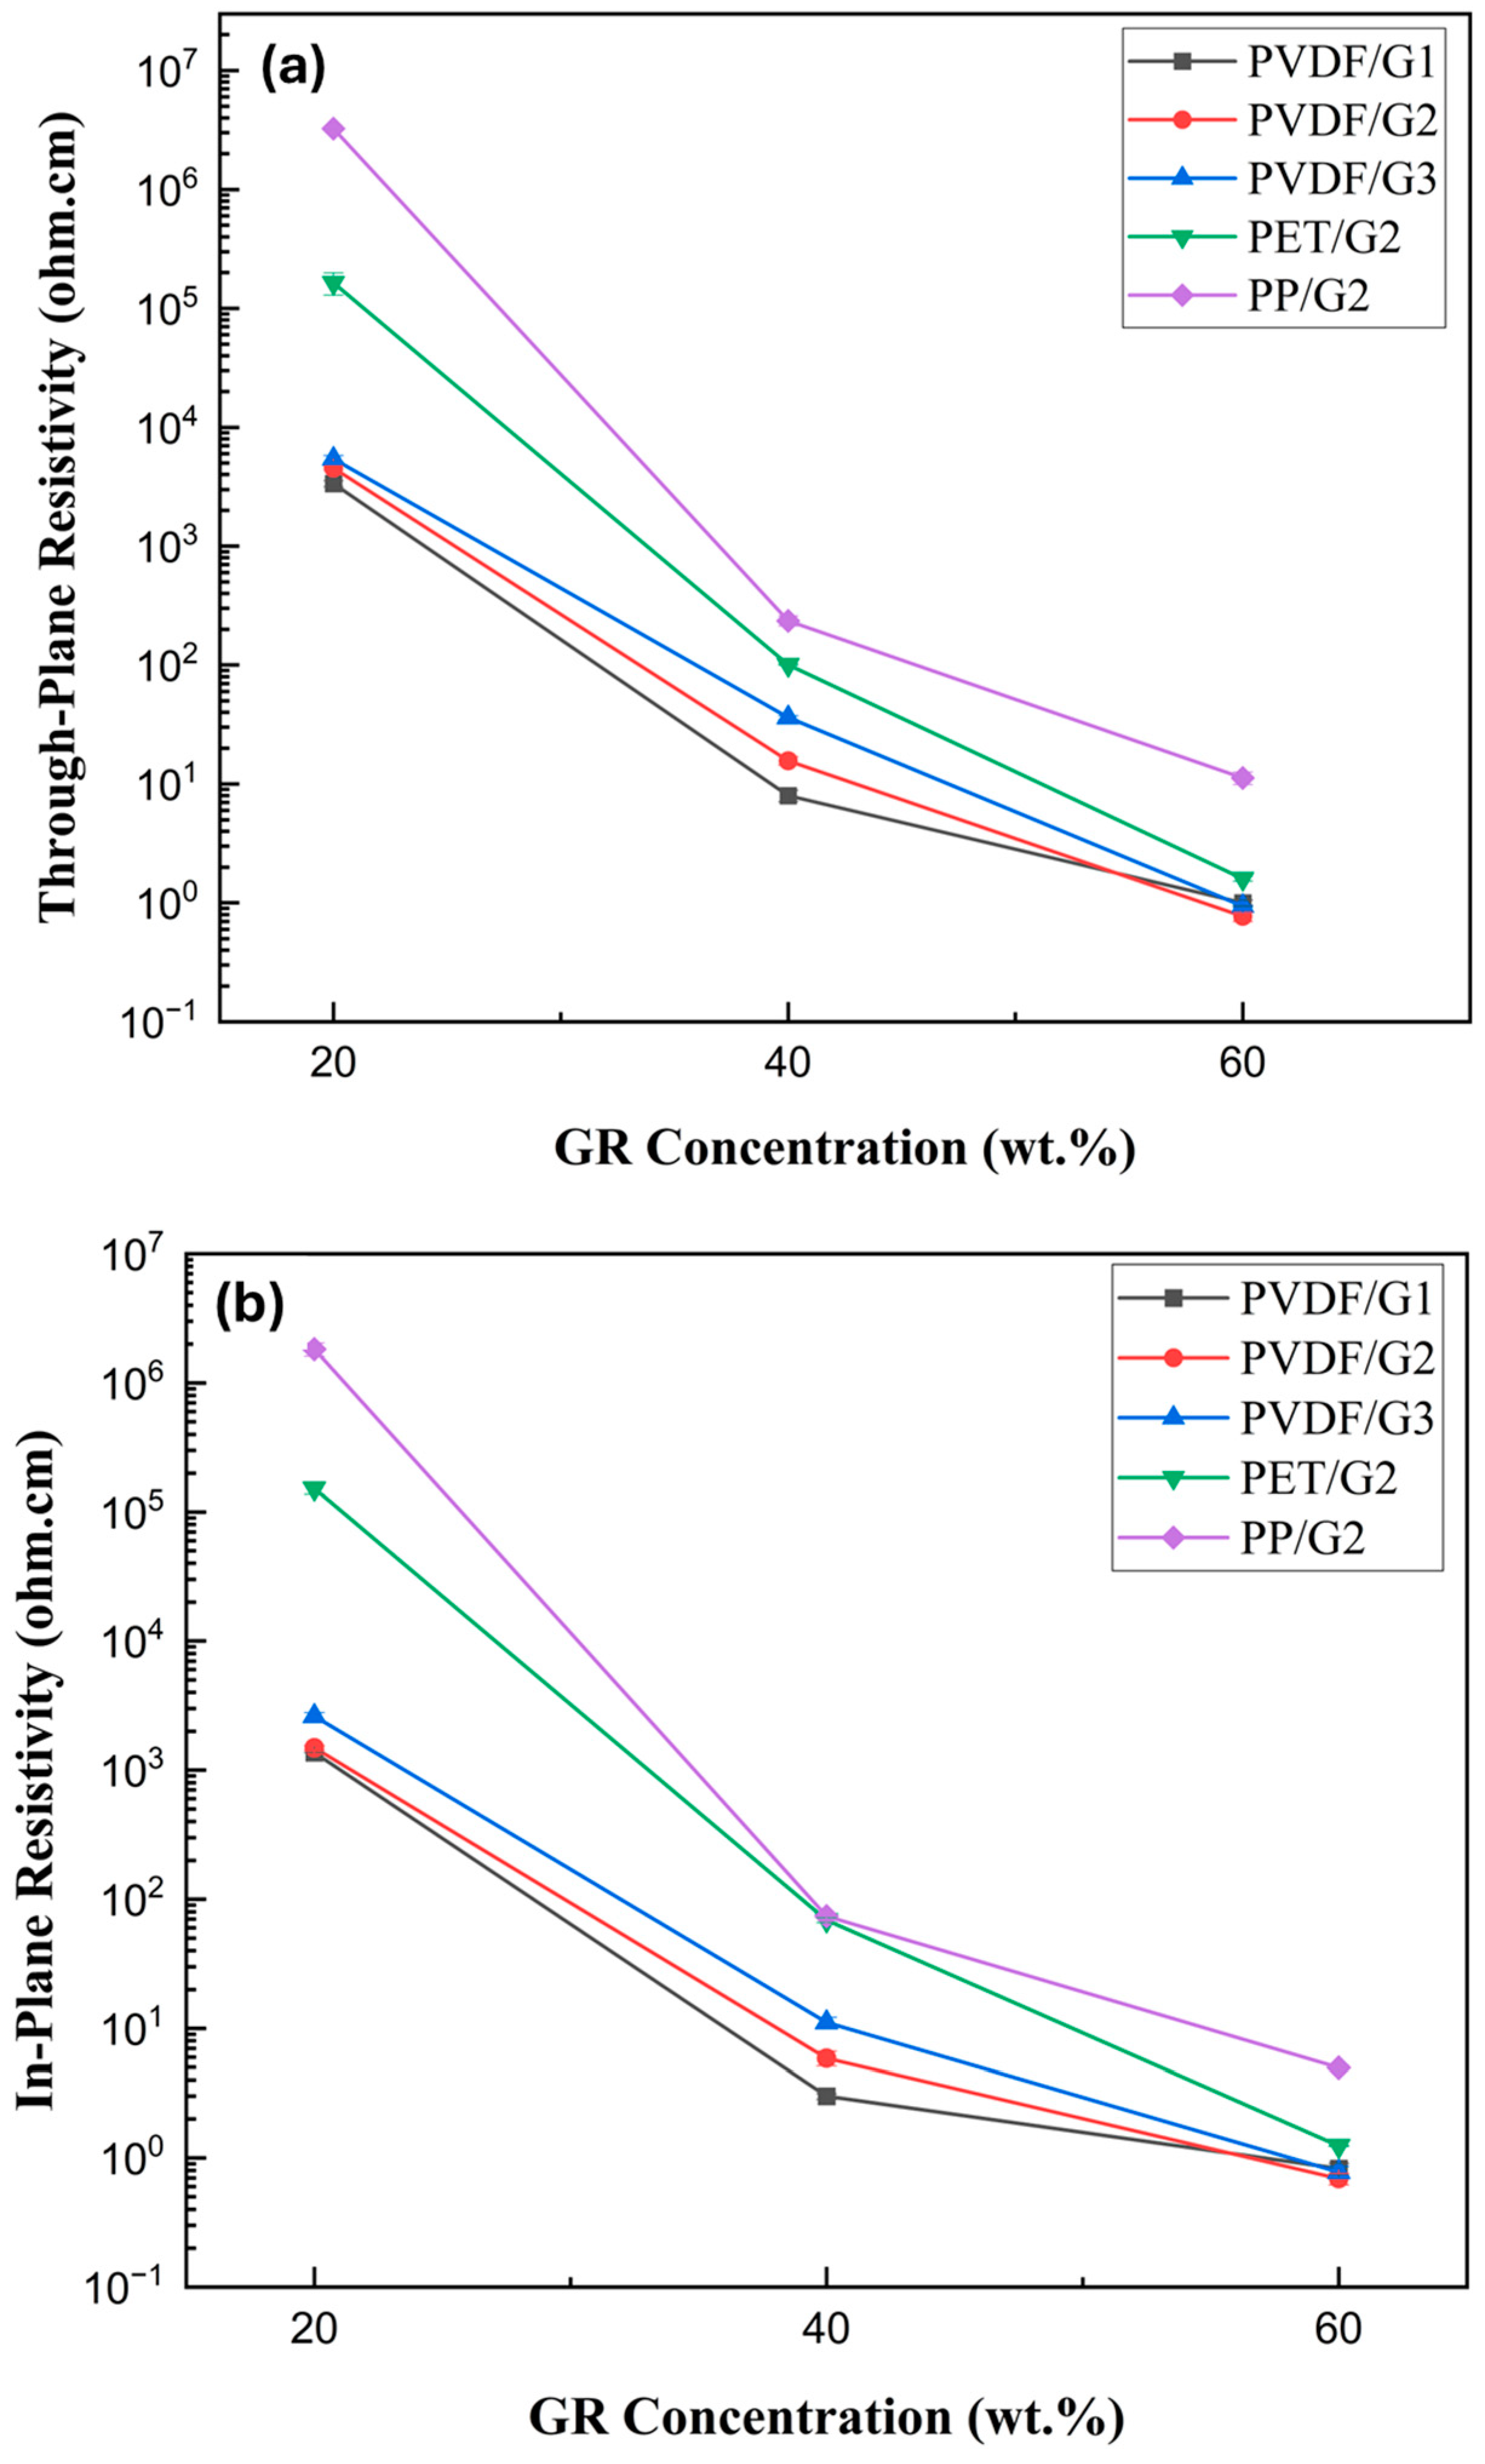
3.4. Electrical Resistivity

3.4.1. Through-Plane Resistivity

The through-plane resistivity results for GR-filled PVDF, PP, and PET composites as a function of GR concentration and particle size are presented in Figure 4a. In PVDF/GR composites, resistivity exhibits a pronounced decline with increasing GR content, highlighting the percolation behavior characteristic of conductive polymer composites. As shown in Figure 4a, increasing the G2 concentration from 20 wt. % to 40 wt. % reduces the through-plane resistivity of the composites from 4.6 × 10³ ohm·cm to 16 ohm·cm. A further increase to 60 wt. % G2 results in a drastic drop to 0.77 ohm·cm, signifying the formation of a well-connected conductive pathway. Similarly, for PVDF/G1 and PVDF/G3 composites, increasing G1 and G3 contents from 20 wt. % to 40 wt. % reduces resistivity from 3.4 × 10³ ohm.cm to 8.0 ohm·cm and from 5.4 × 10³ ohm.cm to 36.0 ohm·cm, respectively. A further increase by 60 wt. % in G1 and 60 wt. % in G3 decreases the resistivities to 1.0 and 0.94 ohm.cm, respectively. At a fixed graphite concentration of 60 wt. %, the resistivity values of PVDF composites containing G1, G2, and G3 are 1.0, 0.77, and 0.94 ohm·cm, respectively. This suggests that G2 achieves an optimal balance between particle dispersion and contact resistance, two key parameters governing electrical conductivity in polymer composites. From a microstructural perspective, the dispersion of conductive fillers influences the continuity and density of percolation pathways, while contact resistance at particle interfaces dictates charge carrier transport efficiency. The intermediate particle size of G2 contributes to superior electrical performance by facilitating uniform dispersion (enhancing conductive network connectivity) while mitigating excessive interparticle resistance. In contrast, G1, having smaller particles, likely experiences higher interfacial resistance due to increased tunneling barriers between neighboring particles, whereas G3, with larger particles, may suffer from reduced dispersion homogeneity, leading to incomplete percolation networks. Elevated contact resistance disrupts charge transport by imposing potential barriers at particle junctions, thereby impeding electron mobility [41,42].
Given the superior electrical performance of PVDF/G2, graphite G2 was further evaluated in PP and PET matrices. As depicted in Figure 4a, the increase in G2 content from 20 to 40 wt. % reduces resistivity from 3.3 × 10⁶ to 236 ohm.cm and from 1.6 × 10⁵ to 102 ohm.cm, respectively. The incorporation of 60 wt. % G2 into PP and PET yields resistivity values of 11.3 ohm.cm and 1.6 ohm.cm, respectively. Despite having the same GR type and concentration (60 wt. % G2), PVDF exhibits the lowest resistivity (0.77 ohm·cm) among the three matrices. This discrepancy arises from the intrinsic polarity of PVDF, which enhances interfacial interactions with G2, promoting robust filler-matrix adhesion and facilitating the formation of an efficient conductive network. Although PET also possesses relatively high polarity, its greater viscosity and crystallinity limit the mobility and dispersion of GR particles, thereby hindering the formation of a well-percolated conductive structure. The higher resistivity observed in PP/G2 composites can be attributed to the inherently nonpolar nature of PP, which weakens interfacial interactions, reducing filler integration and limiting charge transport efficiency.

3.4.2. In-Plane Resistivity

The in-plane resistivity results for GR-filled PVDF, PP, and PET composites, as a function of GR concentration and particle size, are presented in Figure 4b. In PVDF/GR composites, resistivity decreases as the GR content increases. Specifically, increasing the G2 concentration from 20 wt. % to 40 wt. % reduces in-plane resistivity from 1.5 × 10³ ohm·cm to 5.9 ohm.cm. A further increase to 60 wt. % results in the lowest resistivity of 0.69 ohm·cm. Similarly, increasing the G1 and G3 concentrations from 20 wt. % to 40 wt. % lowers resistivity from 1.4 × 10³ ohm.cm to 3.0 ohm.cm and from 2.6 × 10³ ohm.cm to 11.0 ohm.cm, respectively. Further increasing the G1 and G3 content to 60 wt. % decreases resistivity to 0.83 ohm.cm and 0.78 ohm.cm, respectively. The effect of GR particle size is also evident in samples containing 60 wt. % GR. Increasing the particle size from 5.9 µm (G1) to 561 µm (G3) lowers resistivity from 0.83 ohm.cm to 0.78 ohm.cm. However, the medium particle size (G2) exhibits the lowest resistivity of 0.69 ohm.cm, suggesting an optimal balance between dispersion and contact resistance. This indicates that beyond a certain threshold, larger particles may not significantly enhance conductivity due to potential limitations in particle–particle contact efficiency. Comparative analysis across different polymer matrices further highlights the influence of matrix selection. In PP and PET, increasing G2 content from 20 to 40 wt. % reduces resistivity from 1.8 × 10⁶ ohm.cm to 74 ohm.cm and from 1.5 × 10⁵ ohm.cm to 69 ohm.cm, respectively. In both PP and PET, increasing the G2 content from 20 to 40 wt. % significantly reduces resistivity from 1.8 × 10⁶ to 74 ohm.cm in PP, and from 1.5 × 10⁵ to 69 ohm.cm in PET. At 60 wt. % G2, the resistivity values for PP and PET composites are 5.0 ohm.cm and 1.2 ohm.cm, respectively. Among the three matrices (PVDF, PP, and PET) with the same GR type and concentration (60 wt. % G2), PVDF exhibits the lowest resistivity (0.69 ohm.cm), underscoring its superior compatibility with GR for electrical conductivity enhancement.
Overall, both in-plane and through-plane resistivity decrease with increasing GR content and follow similar trends with respect to particle size. However, in-plane resistivity is consistently lower than through-plane resistivity due to the preferential alignment of GR particles parallel to the sample’s surface, which facilitates electron transport along this direction. The superior performance of PVDF/G2 in both in-plane and through-plane conductivity highlights the critical role of selecting an optimal GR particle size and polymer matrix to maximize electrical performance in composite materials.

3.5. Composites Mechanical Properties

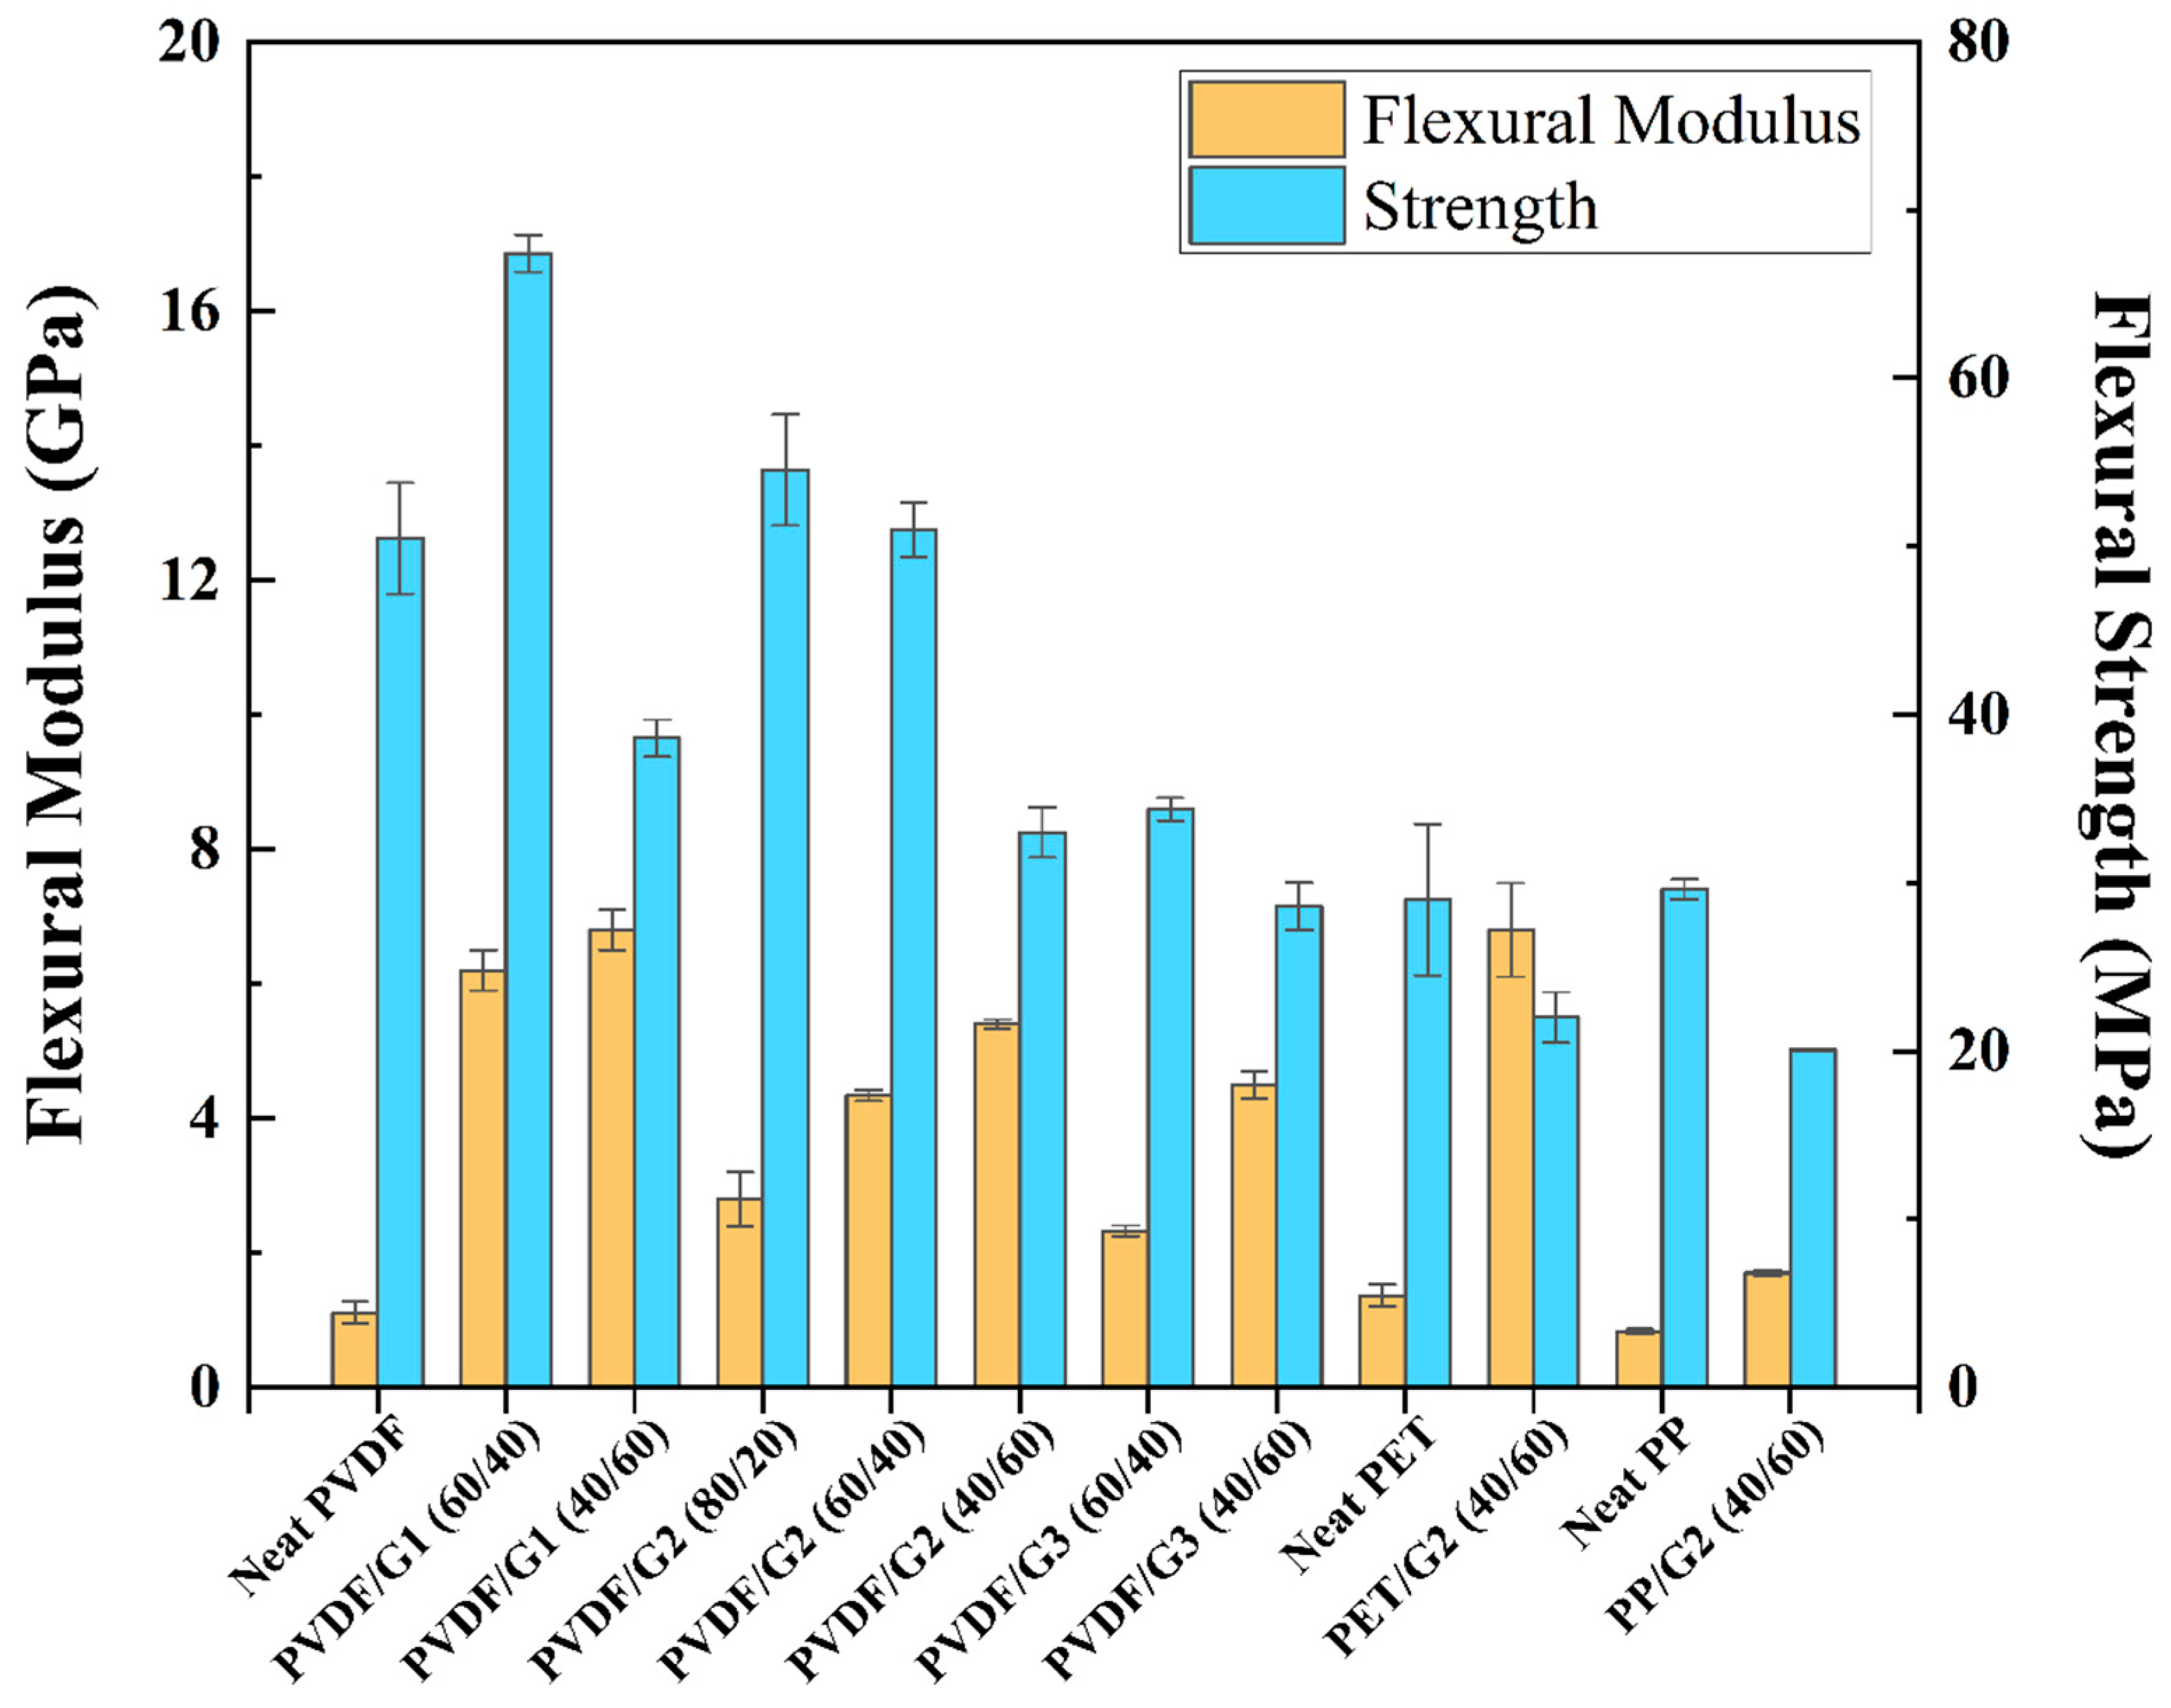
3.5.1. Composites Flexural Behavior

Figure 5 presents the flexural modulus and strength results for neat and GR-filled PVDF, PP, and PET composites as a function of GR concentration and particle size. The incorporation of GR into the polymer matrices significantly alters their mechanical properties, with notable improvements in stiffness accompanied by a trade-off in strength at higher filler loadings. In the PVDF matrix, the addition of 20 wt. % G2 increases the flexural modulus from 1.1 GPa (neat PVDF) to 2.8 GPa, while the strength experiences a modest rise from 50.5 MPa to 54.6 MPa. This enhancement is primarily attributed to the intrinsic rigidity of GR, which effectively reinforces the polymer structure by restricting chain mobility and reducing deformation under bending loads. The stiff GR particles act as stress-transfer agents, improving the composite’s resistance to bending forces [43].
However, as the G2 concentration increases to 40 wt. % and 60 wt. %, the flexural modulus further improves to 4.3 GPa and 5.4 GPa, respectively, demonstrating the continued reinforcement effect of graphite G2. In contrast, flexural strength decreases to 51 MPa at 40 wt. % and drops significantly to 33 MPa at 60 wt. %. This decline in strength is likely due to stress concentrations around the dispersed filler particles, which intensify at higher filler contents. These localized stresses can create microstructural defects, leading to premature failure and compromising the composite’s structural integrity [44].
A similar trend is observed in composites filled with G1 and G3. Increasing the G1 content from 40 wt. % to 60 wt. % results in a modulus increase from 6.2 GPa to 6.8 GPa, while strength decreases from 67.4 MPa to 38.6 MPa. For G3, the modulus rises from 2.3 GPa to 4.5 GPa, whereas the strength declines from 34.4 MPa to 28.6 MPa. The differences in modulus and strength across different GR types highlight the influence of particle size and dispersion efficiency. Larger GR particles (such as G3) may result in less uniform stress distribution, increasing the likelihood of crack initiation, whereas smaller particles (G1) tend to form a more interconnected network, enhancing the modulus but still exhibiting strength reduction due to stress localization.
Overall, the observed increase in flexural modulus with higher GR content reinforces the critical role of GR as an effective stiffening agent. However, the reduction in strength at higher loadings suggests that excessive filler concentrations lead to mechanical weaknesses, likely due to poor interfacial bonding and stress concentration effects. This trade-off highlights the importance of optimizing GR concentration and particle size to achieve a balanced combination of stiffness and structural integrity in composite materials.
In PVDF/GR composites with a fixed filler content of 60 wt. % and varying GR particle sizes, the smallest-sized G1 filler demonstrated the highest flexural modulus (6.8 GPa) and strength (38.6 MPa) compared to the medium-sized G2 and the largest-sized G3 fillers. The superior mechanical performance of PVDF/G1 is primarily attributed to the increased surface area of the smaller G1 particles, which facilitates a more efficient interaction between the GR filler and the polymer matrix. The higher surface area enhances interfacial adhesion, leading to better load transfer between the GR particles and the surrounding polymer chains. This stronger interface results in greater reinforcement, which improves both stiffness and strength. Additionally, the finer particle distribution of G1 promotes a more uniform stress distribution, reducing stress concentration points that could otherwise lead to early failure. Conversely, the medium-sized G2 and large-sized G3 fillers exhibited lower flexural moduli and strengths. While larger particles may contribute to an effective stiffening effect, their reduced surface area limits polymer–filler interactions, leading to weaker interfacial bonding. Furthermore, larger GR particles may create defects or voids within the polymer matrix, acting as stress concentrators and reducing the overall structural integrity of the composite. This effect is particularly pronounced in high-filler-content composites, where the polymer chains have limited mobility and struggle to bridge larger particles, leading to premature failure under flexural loading.
In PP/G2 composites, the addition of 60 wt. % G2 increased the flexural modulus from 0.8 GPa (neat PP) to 1.7 GPa, demonstrating a significant improvement in stiffness. However, this reinforcement came at the cost of a reduction in flexural strength, which decreased from 29.6 MPa to 20.1 MPa. The decline in strength can be attributed to the inherent brittleness induced by high GR content, which disrupts the polymer’s ability to deform plastically under stress. Unlike PVDF, which possesses greater toughness, PP’s relatively low interfacial adhesion with GR limits stress transfer efficiency, exacerbating the strength reduction.
A similar trend was observed in PET/G2 composites, where the incorporation of 60 wt. % G2 increased the flexural modulus from 1.4 GPa to 6.8 GPa, indicating a substantial enhancement in stiffness. However, the flexural strength decreased from 29 MPa to 22 MPa. The pronounced increase in modulus is attributed to PET’s highly crystalline structure, which provides superior rigidity and structural stability compared to amorphous polymers. The crystalline domains in PET serve as reinforcing regions that work synergistically with GR, leading to exceptional stiffness. However, despite this reinforcement, the reduction in flexural strength suggests that high GR concentrations introduce microstructural discontinuities that hinder stress redistribution, making the material more prone to failure under bending loads.
Among the composites containing 60 wt. % G2, PET/G2 exhibited the highest flexural modulus (6.8 GPa), primarily due to PET’s intrinsic crystallinity, which contributes to its superior stiffness [45]. In contrast, PVDF/G2 displayed the highest flexural strength (33 MPa), highlighting PVDF’s superior toughness and flexibility, which allow it to better absorb and dissipate stresses under bending loads [46]. This difference underscores the importance of selecting an optimal polymer matrix based on the desired mechanical performance, with PET favoring applications that require maximum stiffness and PVDF excelling in scenarios that demand a balance between rigidity and toughness.

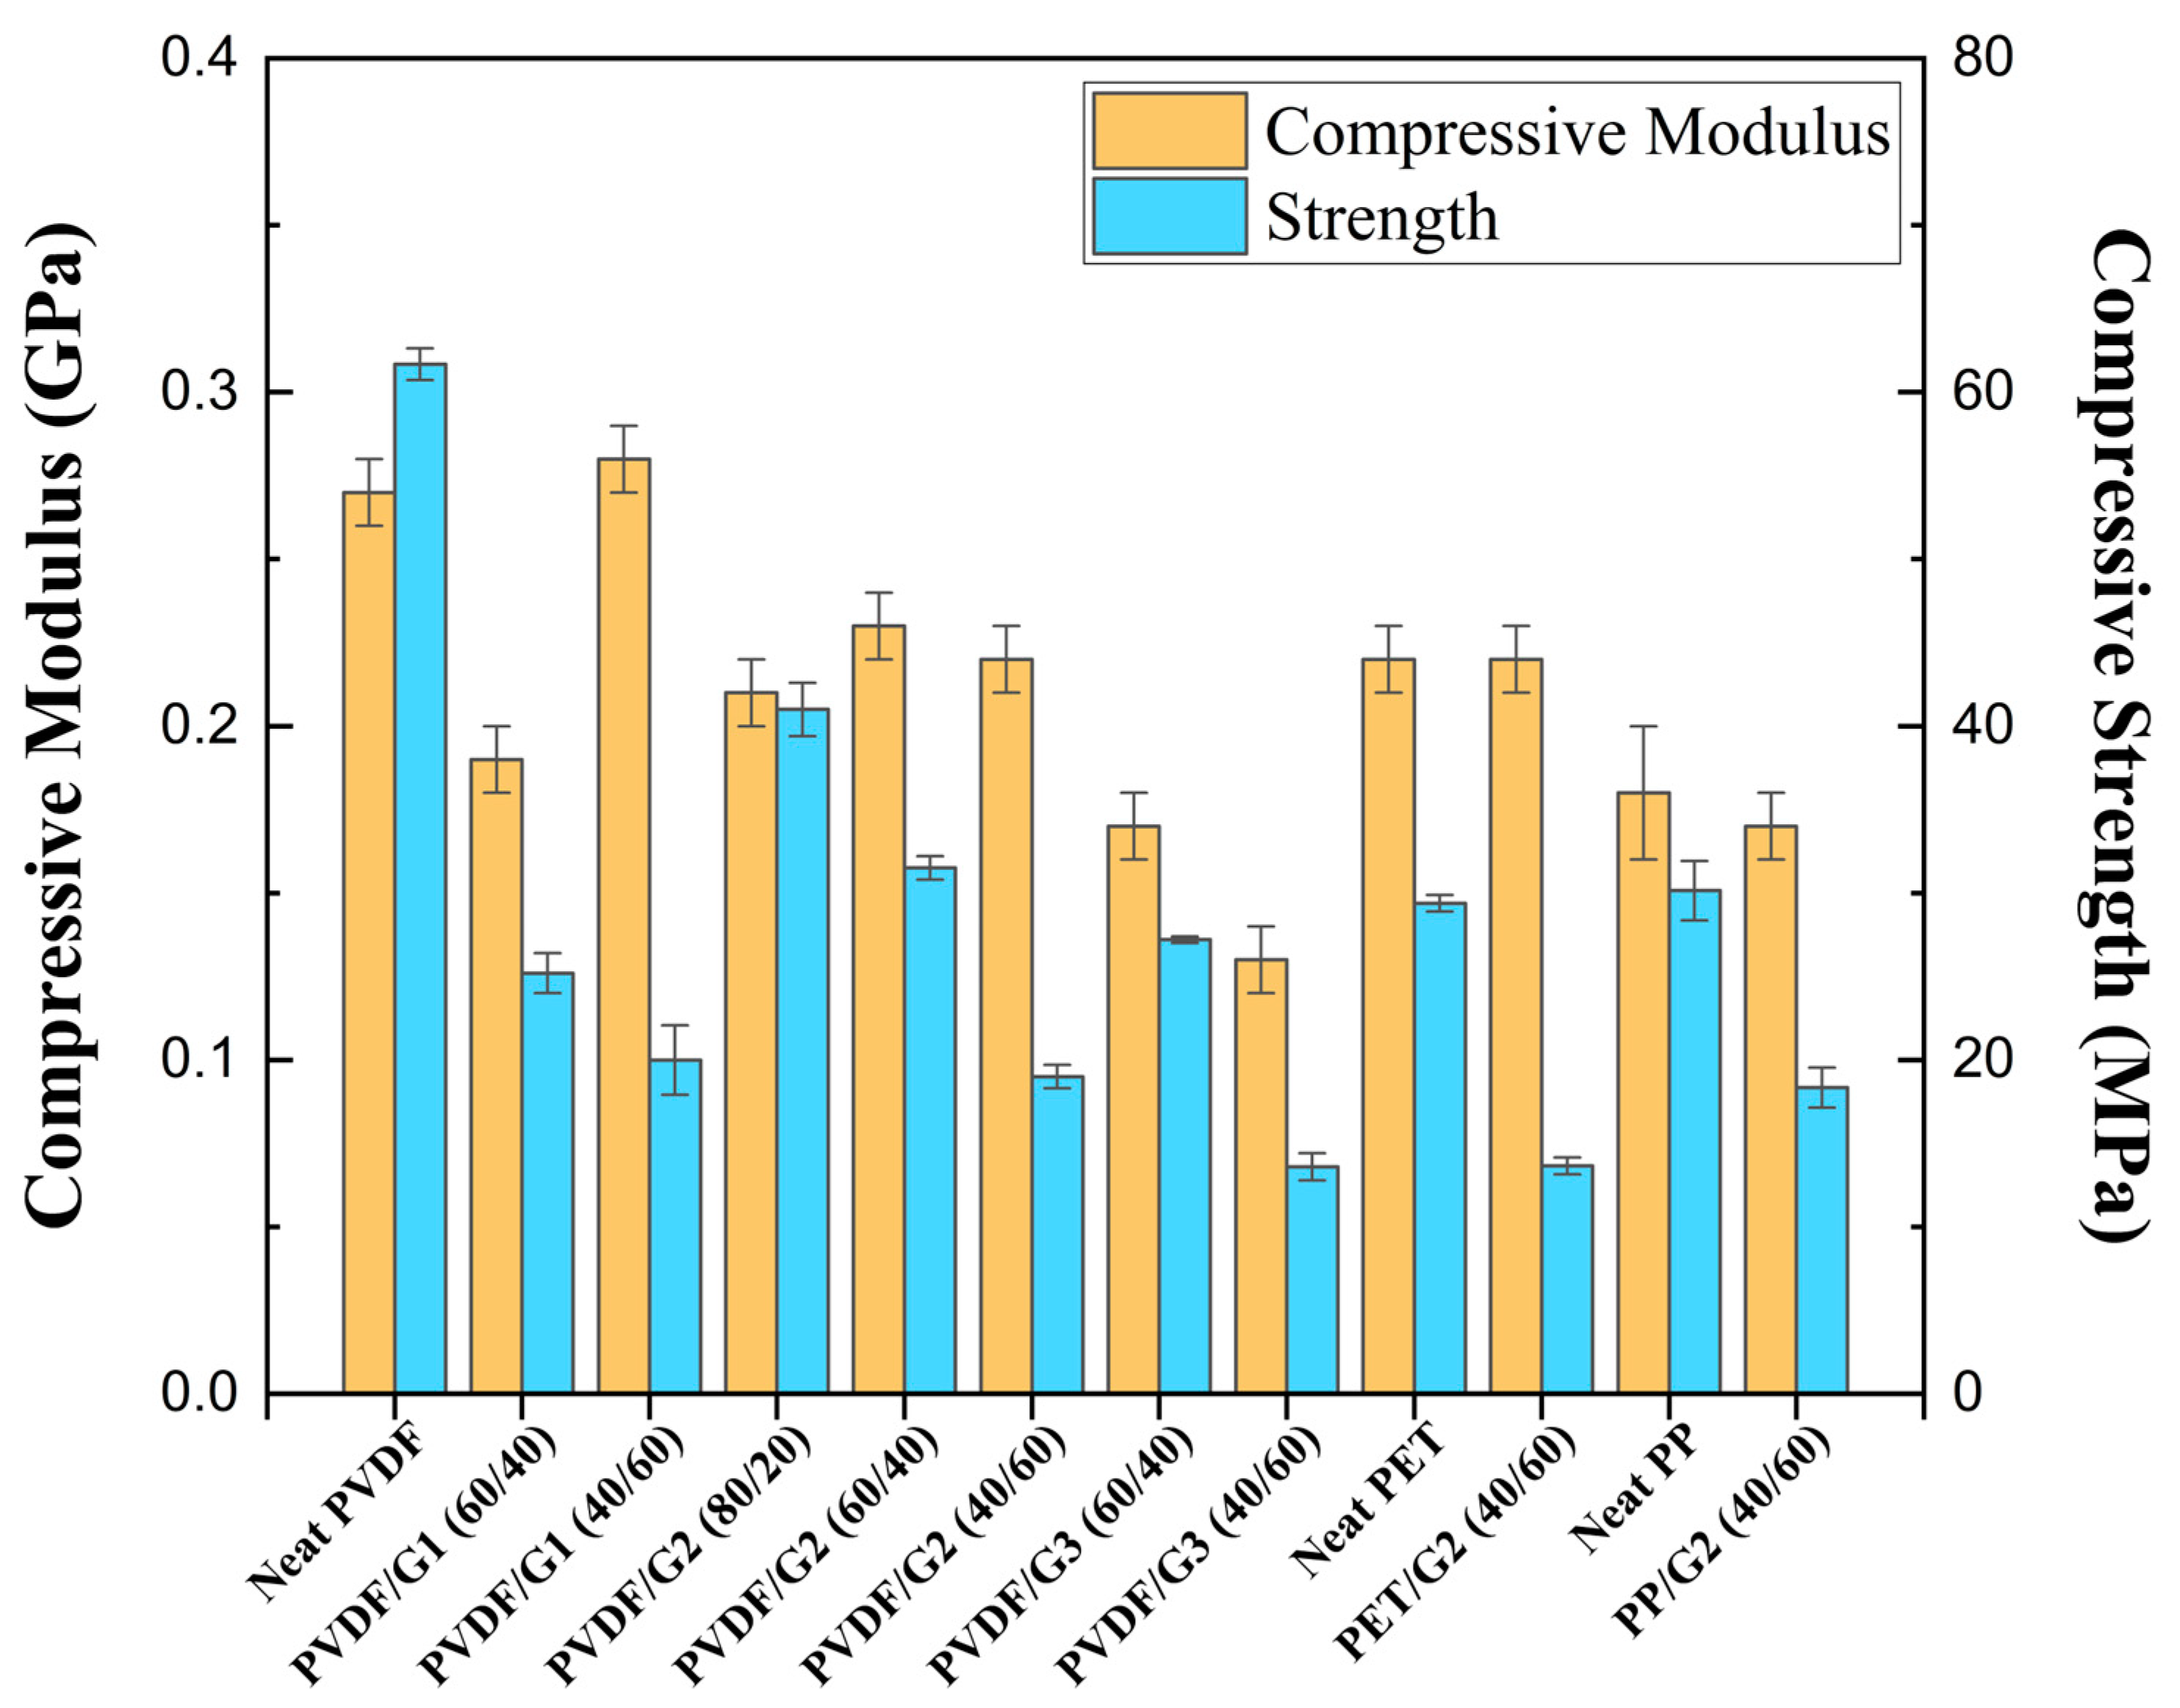
3.5.2. Composites Compression Behavior

Figure 6 presents the compressive modulus and strength results for neat and graphite (GR)-filled PVDF, PP, and PET composites, highlighting the influence of GR concentration and particle size on compressive properties. Incorporating 20 wt. % of G2 into neat PVDF resulted in a notable decrease in both compressive modulus and strength, with the modulus dropping from 0.27 GPa to 0.21 GPa and the strength declining from 62 MPa to 41 MPa. This reduction suggests that, despite the potential reinforcing effect of graphite, the presence of G2 at this concentration disrupted the polymer matrix continuity, limiting its ability to transfer load efficiently. Further increasing the G2 concentration from 20 wt. % to 40 wt. % initially led to a slight recovery in modulus (0.21 GPa to 0.23 GPa) but caused a steep drop in strength from 41 MPa to 31.5 MPa. However, when the G2 content increased to 60 wt. %, both properties degraded significantly, with the modulus decreasing to 0.22 GPa and the strength plummeting to 19 MPa. These deteriorations can be attributed to particle agglomeration, which hampers uniform dispersion and reduces effective stress transfer between the matrix and filler. The formation of agglomerates introduces weak points in the composite structure, leading to early failure under compressive loads.
For PVDF filled with G1 (which has a smaller particle size), the compressive modulus exhibited a different trend. Increasing the G1 concentration from 40 wt. % to 60 wt. % resulted in an increase in modulus from 0.19 GPa to 0.28 GPa, indicating that finer particles provided better interfacial interactions and improved stress transfer. However, the compressive strength still decreased, albeit more moderately, from 25.2 MPa to 20 MPa. This suggests that while stiffness improved due to better dispersion and increased surface area, the composite’s ability to sustain high loads before failure was still compromised by the polymer’s reduced ductility. In contrast, for PVDF filled with G3, increasing the G3 content from 40 wt. % to 60 wt. % resulted in a consistent decline in both compressive modulus (0.17 GPa to 0.13 GPa) and strength (27.2 MPa to 13.6 MPa). This trend indicates that G3, likely having a different morphology or larger particle size, was less effective in reinforcing the matrix. Poor dispersion and reduced interfacial adhesion likely played a role in weakening the composite’s mechanical integrity.
Among the PVDF/GR composites at 40/60 wt. %, the composite reinforced with G1 exhibited the highest compressive modulus (0.28 GPa) and strength (20 MPa). This superior performance can be attributed to the smaller particle size of G1, which enhances dispersion within the matrix and increases the available surface area for load transfer. The improved interfacial interactions contribute to better mechanical reinforcement, making G1 the most effective among the tested GR variants in PVDF. A similar downward trend was observed in PP/G2 composites, where increasing G2 content to 60 wt. % led to a decrease in compressive modulus (from 0.18 GPa to 0.17 GPa) and strength (from 30.1 MPa to 18.3 MPa). This suggests that the reinforcing effect of graphite was overshadowed by matrix disruptions and filler agglomeration at high concentrations, limiting the composite’s structural performance. For PET/G2 composites, the impact was even more pronounced, with the compressive strength dropping from 29.4 MPa to 13.7 MPa as the G2 content reached 60 wt. %. This drastic reduction indicates a severe loss of mechanical integrity, likely due to the insufficient stress transfer caused by graphite clustering, leading to premature material failure.
By replacing the PVDF matrix with PP and PET, the compressive modulus and strength were measured at 0.17 GPa and 18.3 MPa for PP/G2 (40/60 wt. %) and 0.22 GPa and 13.7 MPa for PET/G2 (40/60 wt. %), respectively. Consequently, PVDF/G2 (40/60 wt. %) exhibited the highest compressive modulus (0.22 GPa) and strength (19 MPa) among the composites. As shown in Figure 6, neat PVDF also outperformed the other neat matrices, achieving a compressive modulus of 0.27 GPa and a strength of 61.7 MPa. This superior performance is attributed to PVDF’s high ductility and flexibility, which enhance load distribution and resistance to compressive forces [46].
Overall, the results suggest that the effectiveness of graphite reinforcement in PVDF, PP, and PET composites is highly dependent on filler concentration and particle size. While smaller particle sizes (G1) contribute to improved modulus due to better dispersion and interfacial adhesion, higher filler loadings (above 40 wt. %) often lead to agglomeration, reducing both modulus and strength. These findings underscore the importance of optimizing filler dispersion and loading levels to achieve enhanced mechanical properties in polymer-based graphite composites.

4. Conclusions

This study provides a comprehensive investigation into the influence of graphite particle size and concentration on the electrical, thermal, and mechanical properties of conductive polymer composites based on PVDF, PP, and PET matrices. The results reveal that both the graphite particle size and concentration significantly modulate the performance of these composites, impacting their electrical conductivity, stability, and structural integrity.
PVDF composites incorporating medium-sized graphite (G2, 17.8 µm) at 60 wt. % exhibited the lowest electrical resistivity (0.77 ohm.cm through-plane 0.69 ohm.cm in-plane), indicating an optimal balance between graphite particle dispersion and interfacial contact resistance. The enhanced conductivity of PVDF/G2 underscores the importance of polymer polarity in facilitating charge transport. In contrast, PP and PET matrices showed higher resistivity, suggesting that lower matrix polarity and weaker filler–matrix interactions hinder the formation of conductive networks.
Thermal analysis revealed that graphite improved the thermal stability of the composites, particularly in PVDF/G1 (5.9 µm) systems, which reached the highest decomposition temperature (445 °C). This improvement was attributed to stronger interfacial adhesion and better filler dispersion. However, at higher graphite concentrations, matrix degradation was accelerated, indicating a trade-off between thermal stability and electrical performance.
Smaller graphite particles (G1) provided superior reinforcement due to their higher surface area and enhanced interaction with the matrix. PVDF/G1 (40/60 wt. %) composites achieved the highest flexural modulus (6.8 GPa) and flexural strength (38.6 MPa), as well as the greatest compressive modulus (0.28 GPa). Nevertheless, increasing the filler content beyond a critical threshold led to particle agglomeration and stress concentration, ultimately reducing the strength and ductility of the composites.
Overall, among the studied matrices, PVDF emerged as the most effective host polymer, demonstrating a favorable balance between high electrical conductivity, thermal stability, and mechanical reinforcement. These findings provide valuable insights for the development of next-generation conductive polymer composites, particularly for applications requiring tailored multifunctional properties. Future research should explore hybrid filler systems, surface modifications, and alternative polymer matrices to further enhance the synergy between conductivity, structural integrity, and processing feasibility.

Author Contributions

Conceptualization, E.R.-T.-E., F.M. and S.E.; methodology, E.R.-T.-E. and S.K.; software, S.K. and E.R.-T.-E.; validation, E.R.-T.-E., F.M. and S.E.; formal analysis, E.R.-T.-E. and S.K.; investigation, S.K. and E.R.-T.-E.; resources, M.B., E.O., P.P., G.J., Y.B., S.E. and F.M.; data curation, S.K. and E.R.-T.-E.; writing—original draft preparation, S.K.; writing—review and editing, E.R.-T.-E., F.M., S.E., M.B., E.O., P.P., G.J. and Y.B.; visualization, S.K. and E.R.-T.-E.; supervision, F.M., S.E. and E.R.-T.-E.; project administration, F.M., M.B., P.P. and G.J.; funding acquisition, F.M., S.E., M.B., E.O., P.P., G.J. and Y.B. All authors have read and agreed to the published version of the manuscript.

Funding

The authors are grateful to the Natural Sciences and Engineering Research Council of Canada (NSERC) (ALLRP 566716-21), as well as the Research Center for High Performance Polymer and Composite Systems (CREPEC) for their financial support of this work.

Data Availability Statement

The data supporting the findings of this study can be made available by the corresponding author upon reasonable request.

Conflicts of Interest

Authors Martin Brassard and Elaheh Oliai were employed by the company Nouveau Monde Graphite. Authors Philippe Pelletier, Guy Jourdain and Yves Bonnefoy were employed by the company Plastiques Gagnon. The remaining authors declare that the research was conducted in the absence of any commercial or financial relationships that could be construed as a potential conflict of interest.

References

  1. Dagdag, O.; Safi, Z.; Hsissou, R.; Erramli, H.; El Bouchti, M.; Wazzan, N.; El Harfi, A. Epoxy pre-polymers as new and effective materials for corrosion inhibition of carbon steel in acidic medium: Computational and experimental studies. Sci. Rep. 2019, 9, 11715. [Google Scholar]
  2. Khalil, H.A.; Tehrani, M.A.; Davoudpour, Y.; Bhat, A.H.; Jawaid, M.; Hassan, A. Natural fiber reinforced poly (vinyl chloride) composites: A review. J. Reinf. Plast. Compos. 2013, 32, 330–356. [Google Scholar]
  3. Van de Werken, N.; Tekinalp, H.; Khanbolouki, P.; Ozcan, S.; Williams, A.; Tehrani, M. Additively manufactured carbon fiber-reinforced composites: State of the art and perspective. Addit. Manuf. 2020, 31, 100962. [Google Scholar] [CrossRef]
  4. Asim, M.; Saba, N.; Jawaid, M.; Nasir, M.; Pervaiz, M.; Alothman, O.Y. A review on phenolic resin and its composites. Curr. Anal. Chem. 2018, 14, 185–197. [Google Scholar]
  5. Hsissou, R.; Abbout, S.; Berisha, A.; Berradi, M.; Assouag, M.; Hajjaji, N.; Elharfi, A. Experimental, DFT and molecular dynamics simulation on the inhibition performance of the DGDCBA epoxy polymer against the corrosion of the E24 carbon steel in 1.0 M HCl solution. J. Mol. Struct. 2019, 1182, 340–351. [Google Scholar] [CrossRef]
  6. Sauer, M.; Shiozawa, H.; Ayala, P.; Ruiz-Soria, G.; Liu, X.; Chernov, A.; Pichler, T. Internal charge transfer in metallicity sorted ferrocene filled carbon nanotube hybrids. Carbon 2013, 59, 237–245. [Google Scholar]
  7. Sijercic, E.; Leung, P.T. Effects of surface charge on the anomalous light extinction from metallic nanoparticles. Opt. Commun. 2016, 370, 198–202. [Google Scholar]
  8. Souza, P.R.; Nunes, C.S.; Freitas, A.R.; Belinato, J.R.; Pilau, E.J.; Fajardo, A.R.; Muniz, E.C. Sub-and supercritical D-limonene technology as a green process to recover glass fibres from glass fibre-reinforced polyester composites. J. Clean. Prod. 2020, 254, 119984. [Google Scholar]
  9. Mathur, R.B.; Dhakate, S.R.; Gupta, D.K.; Dhami, T.L.; Aggarwal, R.K. Effect of different carbon fillers on the properties of graphite composite bipolar plate. J. Mater. Process. Technol. 2008, 203, 184–192. [Google Scholar] [CrossRef]
  10. Radhakrishnan, S.; Ramanujam, B.T.S.; Adhikari, A.; Sivaram, S. High-temperature, polymer–graphite hybrid composites for bipolar plates: Effect of processing conditions on electrical properties. J. Power Sources 2007, 163, 702–707. [Google Scholar]
  11. Hui, C.; Liu, H.B.; Li, J.X.; Li, Y.; He, Y.D. Characteristics and preparation of polymer/graphite composite bipolar plate for PEM fuel cells. J. Compos. Mater. 2009, 43, 755–767. [Google Scholar]
  12. Ameli, A.; Nofar, M.; Wang, S.; Park, C.B. Lightweight polypropylene/stainless-steel fiber composite foams with low percolation for efficient electromagnetic interference shielding. ACS Appl. Mater. Interfaces 2014, 6, 11091–11100. [Google Scholar] [PubMed]
  13. Ameli, A.; Arjmand, M.; Pötschke, P.; Krause, B.; Sundararaj, U. Effects of synthesis catalyst and temperature on broadband dielectric properties of nitrogen-doped carbon nanotube/polyvinylidene fluoride nanocomposites. Carbon 2016, 106, 260–278. [Google Scholar]
  14. Adloo, A.; Sadeghi, M.; Masoomi, M.; Pazhooh, H.N. High performance polymeric bipolar plate based on polypropylene/graphite/graphene/nano-carbon black composites for PEM fuel cells. Renew. Energy 2016, 99, 867–874. [Google Scholar]
  15. Vesco, S.; Salvi, D.; Almonti, D. High performance particle-reinforced epoxy composites with industrial grade graphite, GNPs and hBN: A comparative study. Int. J. Adv. Manuf. Technol. 2025, 136, 1379–1391. [Google Scholar]
  16. Chodak, I.; Omastova, M.; Pionteck, J. Relation between electrical and mechanical properties of conducting polymer composites. J. Appl. Polym. Sci. 2001, 82, 1903–1906. [Google Scholar]
  17. Ghosh, A.; Goswami, P.; Mahanta, P.; Verma, A. Effect of carbon fiber length and graphene on carbon-polymer composite bipolar plate for PEMFC. J. Solid State Electrochem. 2014, 18, 3427–3436. [Google Scholar]
  18. Heo, S.I.; Oh, K.S.; Yun, J.C.; Jung, S.H.; Yang, Y.C.; Han, K.S. Development of preform moulding technique using expanded graphite for proton exchange membrane fuel cell bipolar plates. J. Power Sources 2007, 171, 396–403. [Google Scholar] [CrossRef]
  19. Wu, M.; Shaw, L. Electrical and mechanical behaviors of carbon nanotube-filled polymer blends. J. Appl. Polym. Sci. 2006, 99, 477–488. [Google Scholar]
  20. Alo, O.A.; Otunniyi, I.O.; Pienaar, H. Exploring the potential of polyethylene/epoxy/graphite composite as bipolar plate material for proton exchange membrane fuel cell. AIP Conf. Proc. 2020, 2289, 012035. [Google Scholar]
  21. Dweiri, R.; Suherman, H.; Sulong, A.B.; Al-Sharab, J.F. Structure-property-processing investigation of electrically conductive polypropylene nanocomposites. Sci. Eng. Compos. Mater. 2018, 25, 1177–1186. [Google Scholar] [CrossRef]
  22. Dweiri, R.; Sahari, J. Electrical properties of carbon-based polypropylene composites for bipolar plates in polymer electrolyte membrane fuel cell (PEMFC). J. Power Sources 2007, 171, 424–432. [Google Scholar]
  23. Derieth, T.; Bandlamudi, G.; Beckhaus, P.; Kreuz, C.; Mahlendorf, F.; Heinzel, A. Development of highly filled graphite compounds as bipolar plate materials for low and high temperature PEM fuel cells. J. New Mater. Electrochem. Syst. 2008, 11, 21. [Google Scholar]
  24. Liao, S.H.; Hung, C.H.; Ma, C.C.M.; Yen, C.Y.; Lin, Y.F.; Weng, C.C. Preparation and properties of carbon nanotube-reinforced vinyl ester/nanocomposite bipolar plates for polymer electrolyte membrane fuel cells. J. Power Sources 2008, 176, 175–182. [Google Scholar]
  25. Antunes, R.A.; De Oliveira, M.C.; Ett, G.; Ett, V. Carbon materials in composite bipolar plates for polymer electrolyte membrane fuel cells: A review of the main challenges to improve electrical performance. J. Power Sources 2001, 196, 2945–2961. [Google Scholar] [CrossRef]
  26. Rzeczkowski, P.; Krause, B.; Pötschke, P. Characterization of highly filled PP/graphite composites for adhesive joining in fuel cell applications. Polymers 2019, 11, 462. [Google Scholar] [CrossRef]
  27. Alo, O.A.; Otunniyi, I.O.; Pienaar, H.C.V.Z. Prospects of graphite-polypropylene/epoxy blend composite for high performance bipolar plate in polymer electrolyte membrane fuel cell. IOP Conf. Ser. Mater. Sci. Eng. 2019, 655, 012035. [Google Scholar]
  28. Naji, A.; Krause, B.; Pötschke, P.; Ameli, A. Extruded polycarbonate/Di-Allyl phthalate composites with ternary conductive filler system for bipolar plates of polymer electrolyte membrane fuel cells. Smart Mater. Struct. 2019, 28, 064004. [Google Scholar] [CrossRef]
  29. Cui, T.; Li, P.; Liu, Y.; Feng, J.; Xu, M.; Wang, M. Preparation of thermostable electroconductive composite plates from expanded graphite and polyimide. Mater. Chem. Phys. 2012, 134, 1160–1166. [Google Scholar]
  30. Hu, B.; Chang, F.L.; Xiang, L.Y.; He, G.J.; Cao, X.W.; Yin, X.C. High performance polyvinylidene fluoride/graphite/multi-walled carbon nanotubes composite bipolar plate for PEMFC with segregated conductive networks. Int. J. Hydrogen Energy 2021, 46, 25666–25676. [Google Scholar]
  31. Negawo, T.A.; Polat, Y.; Buyuknalcaci, F.N.; Kilic, A.; Saba, N.; Jawaid, M. Mechanical, morphological, structural and dynamic mechanical properties of alkali treated Ensete stem fibers reinforced unsaturated polyester composites. Compos. Struct. 2019, 207, 589–597. [Google Scholar] [CrossRef]
  32. Mighri, F.; Huneault, M.A.; Champagne, M.F. Electrically conductive thermoplastic blends for injection and compression molding of bipolar plates in the fuel cell application. Polymer Eng. Sci. 2004, 44, 1755–1765. [Google Scholar] [CrossRef]
  33. Planes, E.; Flandin, L.; Alberola, N. Polymer composites bipolar plates for PEMFCs. Energy Procedia 2012, 20, 311–323. [Google Scholar] [CrossRef]
  34. Yoo, M.; Frank, C.W.; Mori, S. Interaction of poly(vinylidene fluoride) with graphite particles. 1. Surface morphology of a composite film and its relation to processing parameters. Chem. Mater. 2003, 15, 850–861. [Google Scholar] [CrossRef]
  35. Salimi, A.; Yousefi, A.A. FTIR studies of β-phase crystal formation in stretched PVDF films. Polym. Test. 2003, 22, 689–700. [Google Scholar]
  36. Jahan, N.; Mighri, F.; Rodrigue, D.; Ajji, A. Enhanced electroactive β phase in three-phase PVDF/CaCO3/nanoclay composites: Effect of micro-CaCO3 and uniaxial stretching. J. Appl. Polym. Sci. 2017, 134, 44987. [Google Scholar] [CrossRef]
  37. Elashmawi, I.S.; Hakeem, N.A. Effect of PMMA addition on characterization and morphology of PVDF. Polym. Eng. Sci. 2008, 48, 895–901. [Google Scholar] [CrossRef]
  38. Fugallo, G.; Cepellotti, A.; Paulatto, L.; Lazzeri, M.; Marzari, N.; Mauri, F. Thermal conductivity of graphene and graphite: Collective excitations and mean free paths. Nano Lett. 2014, 14, 6109–6114. [Google Scholar] [CrossRef]
  39. Guo, R.; Ren, Z.; Bi, H.; Xu, M.; Cai, L. Electrical and Thermal Conductivity of Polylactic Acid (PLA)-Based Biocomposites by Incorporation of Nano-Graphite Fabricated with Fused Deposition Modeling. Polymers 2019, 11, 549. [Google Scholar] [CrossRef]
  40. Norkhairunnisa, M.; Azizan, A.; Mariatti, M.; Ismail, H.; Sim, L.C. Thermal stability and electrical behavior of polydimethylsiloxane nanocomposites with carbon nanotubes and carbon black fillers. J. Compos. Mater. 2012, 46, 903–910. [Google Scholar] [CrossRef]
  41. Jie, Z.; Yan-Wen, Z.; Jun, H. Influence of graphite particle size and its shape on performance of carbon composite bipolar plate. J. Zhejiang Univ. Sci. A 2005, 6, 1080–1083. [Google Scholar]
  42. Hui, C.; Hong-Bo, L.; Li, Y.; Jian-Xin, L. Study on the preparation and properties of novolac epoxy/graphite composite bipolar plate for PEMFC. Int. J. Hydrogen Energy 2010, 35, 3105–3109. [Google Scholar] [CrossRef]
  43. Baptista, R.; Mendão, A.; Guedes, M.; Marat-Mendes, R. An experimental study on mechanical properties of epoxy-matrix composites containing graphite filler. Procedia Struct. Integr. 2016, 1, 74–81. [Google Scholar]
  44. López Gaxiola, D.; Jubinski, M.M.; Keith, J.M.; King, J.A.; Miskioglu, I. Effects of carbon fillers on tensile and flexural properties in polypropylene-based resins. J. Appl. Polym. Sci. 2010, 118, 1620–1633. [Google Scholar]
  45. Di Lorenzo, M.L. Crystallization of Poly(ethylene terephthalate): A Review. Polymers 2024, 16, 1975. [Google Scholar] [CrossRef]
  46. Dallaev, R.; Pisarenko, T.; Sobola, D.; Orudzhev, F.; Ramazanov, S.; Trčka, T. Brief review of PVDF properties and applications potential. Polymers 2022, 14, 4793. [Google Scholar] [CrossRef]
Figure 1. SEM images: (a) Neat PVDF, (b) PVDF/G2 (80/20 wt. %), (c) PVDF/G2 (40/60 wt. %), (d) higher magnification of PVDF/G2 (40/60 wt. %), (e) PVDF/G1 (40/60 wt. %), (f) PVDF/G3 (40/60 wt. %).
Jcs 09 00178 g001aJcs 09 00178 g001b
Figure 2. FTIR spectra of neat PVDF and PVDF/G2 (80/20 wt. %).
Jcs 09 00178 g002
Figure 3. Thermal degradation behavior of neat and GR-filled PVDF, PP, and PET composites: (a) TGA curves, and (b) DTG curves.
Jcs 09 00178 g003aJcs 09 00178 g003b
Figure 4. Electrical behavior of PVDF/GR, PP/G2, and PET/G2 as a function of GR concentration and particle size (G1, G2, and G3): (a) through-plane resistivity, (b) in-plane resistivity.
Jcs 09 00178 g004
Figure 5. Flexural modulus and flexural strength of PVDF/GR, PP/GR and PET/GR composites as a function of GR concentration and particle size.
Jcs 09 00178 g005
Figure 6. Compressive modulus and strength of PVDF/GR, PP/GR and PET/GR composites as a function of GR concentration and particle size.
Jcs 09 00178 g006
Table 1. Particle sizes of the different GRs used in this study.
GRParticle Size (µm)
G15.9
G217.8
G3561
Table 2. Composition of the different PVDF/GR, PP/GR, and PET/GR composites.
SampleG1 (wt. %)G2 (wt. %)G3 (wt. %)
PVDF/G140--
PVDF/G160--
PVDF/G2-20-
PVDF/G2-40-
PVDF/G2-60-
PVDF/G3--40
PVDF/G3--60
PP/G2-60-
PET/G2-60-
Disclaimer/Publisher’s Note: The statements, opinions and data contained in all publications are solely those of the individual author(s) and contributor(s) and not of MDPI and/or the editor(s). MDPI and/or the editor(s) disclaim responsibility for any injury to people or property resulting from any ideas, methods, instructions or products referred to in the content.

