Abstract
This paper investigates the underlying interplay between the key process parameters of magnetic abrasive finishing (MAF) in improving surface quality. The five process parameters considered were the working gap, rotational speed, feed rate, abrasive amount, and abrasive mesh when MAFed independently with two abrasive particles—SiC and Al2O3. A series of experiments were conducted with an in-house built MAF tool. Based on the main effect results, a model predicting roughness reduction was developed. Results show that surface quality improvement and the underlying dominant process parameters seem unique to the abrasive type used. When MAFed with SiC, the abrasive quantity and rotational speed influence the most. On the other hand, when MAFed with Al2O3, the trend is different to SiC, i.e., the abrasive mesh size and the working gap are dominant. The prediction model was well validated by independent experiments, indicating its accuracy in estimating and optimizing the process outcome. MAF is a simple process with a complex interplay between parameters. This is very crucial when abrasive type, size, and amount to be used are concerned, which warrants a deeper investigation in terms of underlying dynamics, interactions, and the deformation of abrasive, magnetic, and workpiece materials.
1. Introduction
Surface finish is regarded as one of the key precursors of functional integrity of many high-end mechanical components. In this regard, as an alternative, magnetic abrasive finishing (MAF) recently emerged as an advanced surface technique to ensure superior finishing. MAF uses a flexible magnetic abrasive brush as a cutting tool to remove material via a combination of interrupted nanoscale/microscale indentations and shearing, with the aid of controlled magnetic force produced by permanent or electro magnets [1,2]. Figure 1 shows a schematic diagram outlining the material removal mechanism in MAF [3]. The overwhelming benefit and efficacy of MAF was extensively studied by researchers in the past [4,5,6].
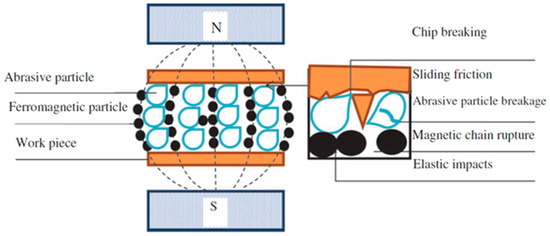
Figure 1.
Material removal mechanism in a magnetic abrasive finishing (MAF) process [3].
As an abrasive medium, SiC and Al2O3 particles are commonly used in finishing of various materials including metal, plastic, and ceramics. These particles attracted significant attention in terms of their use in MAF, although new types of abrasive particles, e.g., carbon nanotubes, are being explored by researchers [7]. As such, unbonded and bonded magnetic abrasive flexible brushes are being tried. While unbonded particles are suitable for high material removal, bonded ones tend to produce a better finish [8]. While the efficacy of bonded and unbonded MAF systems is studied, the conflicting conclusions are still often reported, reiterating that, with a combination of appropriate process parameters, inexpensive unbonded particles could exhibit a similar superior finish and high material removal to bonded particles [4]. Therefore, it is imperative to explore an alternative to bonded particles, with an expectation that the use of unbonded particles will exhibit a tremendous potential to increase productivity and reduce complexity and cost. This further necessitates investigating and confirming the efficacy of unboned particles. Furthermore, regardless of bonded/unbonded particles, the effect of abrasive type and geometry on finishing was shown to vary [9]. Often, mathematical modeling and optimization approach are employed to obtain the best set of parameters [10,11]. However, the optimum result reported in literature was found to vary widely.
For instance, using SiC abrasive, Reference [12] studied the finishing of brittle BK7 glass and concluded that the abrasive size affects roughness the most, followed by the working gap, the rotational speed, and the percentage weight of the binding agent in the mixture. A medium level of the parameters was shown to be optimum except for the rotational speed. In the finishing of thin aluminum sheet metal, Reference [13] reported that the working gap is the most influencing factor. Recently, vibration-assisted MAFs were studied to enhance further surface quality [14,15,16]. A hybrid method combining fixed abrasives and loose abrasives was employed to finish the internal surfaces [17]. While the new techniques show promising ways to improve finish quality, they may often increase the process complexity, lead time, and energy consumption, thereby eventually undermining the productivity. The key question involves determining the fundamental relationship and interplay between abrasive types and process variables impacting surface roughness, which will lead to a mathematical framework to better predict and optimize the performance.
By keeping the above in mind, this paper investigates the efficacy of simple MAF on flat prismatic surfaces with an unbonded particle mixture, focusing on the effect of the process parameters along with two key abrasive particles—SiC and Al2O3—on the surface roughness profile of AISI 1018 steel (plain carbon steel). Three process parameters (speed, feed, and working gap) and two abrasive mixture parameters (percentage of abrasive (%) and abrasive size or mesh) are studied. The effect of these five parameters is investigated when MAF is done separately with two abrasive materials—SiC and Al2O3. The aim is to understand and determine how each abrasive particle interplays with other process parameters in removing micro-material, how it and affects the resulting surface roughness. The preliminary observations are expected to help derive a mathematical relationship between the input parameters and response variable (roughness) for the purpose of potential optimization and parametric study.
2. Materials and Methods
2.1. Design of Experiments
It was shown that magnetic abrasive finishing parameters, such as finishing gap, speed, and feed, affect micro material removal and surface finish. Depending on the type of abrasive, the proportion in mixture, and abrasive mesh or size, the interaction between the magnetic abrasive brush and the workpiece material varies. Therefore, in addition to the underlying effect of process parameters, it is important to study the effect of variants of abrasive powders on surface finish. To do this, the Taguchi method [18] was employed. The first step in the design of experiments was to determine an orthogonal array based on the type and number of control parameters involved.
Five control factors were considered, in which three were related to finishing process and two to polishing materials (i.e., abrasive powders). They were the working gap between the magnetic brush and the workpiece, g (mm); the percentage of abrasive (in weight) in mixture, r (wt.%); abrasive mesh number, s; spindle speed, N (rpm); and feed rate, f (mm/min). Each control factor was set to three levels as per the recommended range of the finishing machine used and the available abrasive and magnetic powders. The factors and their levels used are shown in Table 1. According to the Taguchi method, based on selected parameters and levels, an orthogonal array of L27 (35-2) was chosen. This design of experiment (DOE) is aimed at addressing the underlying main effects, as well as the two-parameter interaction effects, on the response of the MAF process, i.e., surface roughness reduction. However, it is expected that main effects would be significant. In other words, this DOE excludes three-parameter interaction effects. Such fractional factorial design is considered to minimize experimental overhead and effort, while the DOE is sufficient to investigate and capture the underlying effect of control variables.

Table 1.
The factors and levels of finishing parameters.
In this study, two different abrasive powders (SiC and Al2O3) with different mesh sizes were considered. For each abrasive powder, three different mesh numbers were considered, as they are often found to be used in finishing or super-finishing operations. A higher mesh number means finer abrasive powders. Note that magnetic Fe particles of mesh size of 325 are used consistently to form magnetic abrasive particle mixtures throughout all the experiments. The mean particle size shown in Table 1 is provided by the supplier. It is to be noted that, while the aim was to use the mesh size level for each abrasive type to ensure consistency in comparison, these mesh sizes that are reasonably close at the corresponding level are readily available from the supplier. Figure 2 shows representative SEM (Merlin, Carl zeiss Co., Oberkochen, Germany) photos of the geometric shape and distribution of magnetic Fe (mesh 325), and abrasive Al2O3 (mesh 150) and SiC (mesh 600) particles.
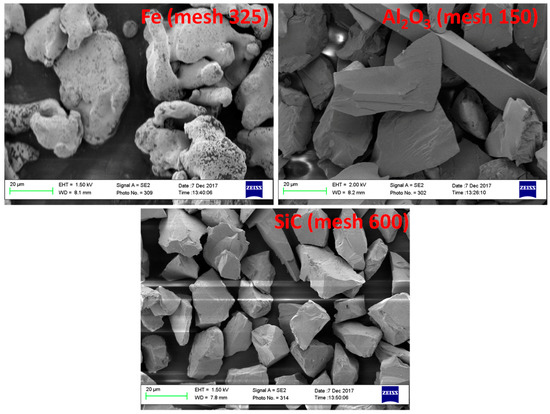
Figure 2.
Representative SEM images of magnetic Fe, and abrasive Al2O3 and SiC particles.
2.2. Materials
MAF was conducted on an AISI 1018 mild steel workpiece with a size of 80 mm × 80 mm × 40 mm. Before finishing, the top surface was prepared by milling, which gives a certain roughness (recorded variable). The aim is to reduce the roughness by MAF with a combination of different parameters. The mechanical properties of the workpiece are shown in Table 2.

Table 2.
Mechanical properties of the AISI 1018 mild steel.
Unbonded mixtures (i.e., dry mixture) of abrasive and magnetic powders were shown to be less effective in removing material during MAF [4,19]. On the other hand, solid permanent bonded abrasive material in the magnetic powder mixture works as a grinding grit, often causing fracture, non-uniform material removal, and uneven surface. From our preliminary trial tests, in which MAF was done with a dry mixture of abrasive and magnetic powers, it was found that, as the rotational speed increases, powders fly out quickly from the contact zone between workpiece and magnetic pole, and the surface is barely finished. This forced us to consider slightly bonding the mixture, running the tests with different rotational speeds to ensure that an adequate amount of mixture remains within the effective cutting zone, thereby resulting in a visible finish on the surface. Therefore, a small amount of cutting oil (e.g., SAE 30) was added to the mixture to increase cohesion between abrasive and magnetic powders. The ratio of the amount of cutting oil to the abrasive powders was kept constant while preparing different percentages of the mixtures. It was expected that the magnetic brush with loosely bonded abrasive powders would provide the flexibility of abrasive particles to move within the finishing zone, thereby enabling cutting micro-material from the surface more evenly.
2.3. Finishing Tests
According to design of experiments (L27), a series of finishing tests were conducted on a flat workpiece surface. Figure 3 shows a schematic of the experimental set-up. The tests were performed on a three-axis milling machine (Metal-Master BM-52VE), in which the workpiece was attached on the table which could move along X- and Y-directions on a horizontal plane, and a cylindrical permanent magnetic pole attached with an in-house built tool holder was mounted onto the spindle head. The magnetic pole (composed of Nd, Fe, and B elements) was 25 mm in diameter, and had a magnetic flux density of 0.59 T with a pulling strength (force) of up to 260 N. Such magnetic strength was found to be sufficient to create adequate magnetic pressure at the interface between the workpiece and the abrasive brush to cut micro material from the surface. The appropriate amount of abrasive and magnetic powder mixture was attached on the bottom face of the magnetic pole, forming a flexible magnetic abrasive brush (FMAB). Each finishing pass was 80 mm of linear movement of the magnetic brush (approximately 25 mm in diameter) against the workpiece along the x-axis, resulting in a finished area of 80 mm × 25 mm. At each test condition, three finishing passes were continuously performed, resulting in a total linear distance of 240 mm traveled by the FMAB. Surface roughness was measured before and after finishing to compare the quality of surface finish improvement. Note that each test was repeated at least three times to ensure the reliability of measured data (i.e., surface roughness as a response variable) with an acceptable statistical significance.
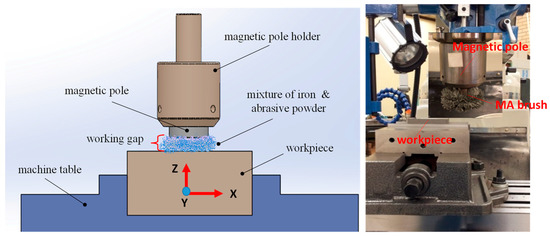
Figure 3.
Schematic of magnetic abrasive finishing (left) and its experimental set-up (right).
2.4. Surface Roughness Measurement
Surface roughness (Ra) was measured with a Mitutoyo’s Surftester (Model: SJ 211 by Mitutoyo, Japan), whereby measurements were taken along five different lines (y-axis) perpendicular to the FMAB feed direction (x-axis) on the finished surface, as shown in Figure 4, and their average was taken as the final value. The cut-off length used the during roughness test was 2.5 mm. Samples before MAF were prepared by face-milling with an initial roughness Ra ranging between 0.2 and 0.46 µm (mean Ra of 0.33 µm). For the sake of performance improvement comparison, the percentage of reduction in Ra due to MAF was considered as the final response output, ∆Ra, which can be defined as the difference between the initial roughness (before MAF) and the final roughness (after MAF), as expressed below.
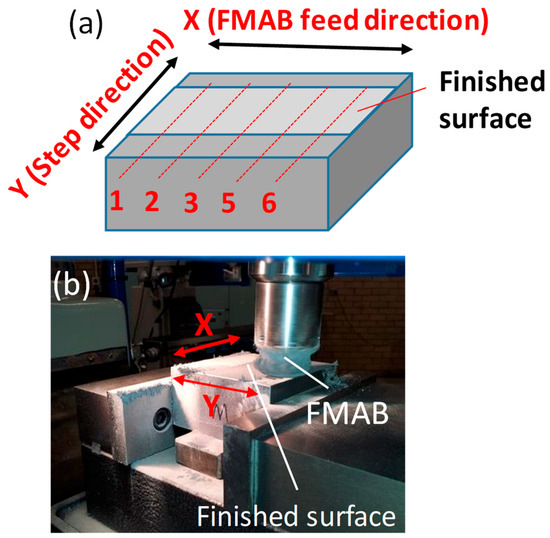
Figure 4.
(a) Surface roughness measurement locations, and (b) actual finished surface.
Characteristics and topography of finished surfaces were observed using an optical profilometer (Wyko NT 9100, Veeco Co., New York, NY, USA).
3. Results
3.1. Analysis of Signal-to-Noise (S/N) Ratio
Table 3 and Table 4 summarize the results of roughness and S/N ratio values of percentage ∆Ra for each combination of finishing parameters for MAF with SiC and Al2O3 abrasives. S/N ratios for ∆Ra were calculated using the criterion “larger is better”. This criterion considers that larger ∆Ra means an improvement in surface finish. S/N ratios were estimated using Equation (2) as follows:
where n is the total number of measurements taken on each sample for surface roughness, and Yi is the value of ∆Ra measured at the ith point (i = 1, 2, 3, …, n).

Table 3.
Roughness results and estimated signal-to-noise (S/N) ratios of ∆Ra (%) for MAF with SiC abrasives.

Table 4.
Roughness results and estimated S/N ratios of ∆Ra (%) for MAF with Al2O3 abrasives.
Figure 5 shows the main effect plots for S/N ratios of ∆Ra for SiC. It can be seen that, among all, the percentage of abrasive amount r and spindle rotational speed N are the most significant factors influencing ∆Ra. For instance, as the spindle speed decreased from 2500 rpm to 1500 rpm, S/N ratio increased from 28.5% to 30.75%, thus indicating the highest improvement in surface finish. As shown in Figure 5, the maximum roughness reduction in the ascending order of S/N ratio was observed when N = 1500 rpm, r = 25%, f = 30 mm/min, g = 1.75 mm, and s = 600.

Figure 5.
Signal-to-noise (S/N) ratio plots of ∆Ra (%) for SiC abrasive (g = working gap, r = percentage of abrasive, s = abrasive mesh number, N = rotation speed, and f = feed rate).
Figure 6 shows the main effect plots for S/N ratios of ∆Ra for Al2O3. The trend of the influence was found to be completely different to that for SiC. It appears that the working gap g and the abrasive mesh number s are the most influencing parameters. As the working gap and the abrasive mesh number decreased, S/N ratio increased drastically. Among all, the highest surface roughness reduction with S/N ratio of 34% was noticed when the working gap was 1.50 mm. On the other hand, the variation of S/N ratio with the change in the percentage of abrasive amount, spindle speed, and feed rate was minimal. As shown in Figure 6, the maximum roughness reduction in the ascending order of S/N ratio was observed when g = 1.50 mm, s =150, f = 10 mm/min, r = 30%, and N = 2500 rpm. As compared to MAF with SiC, the highest surface roughness reduction (∆Ra = 65.6%) was achieved at the working gap of 1.50 mm in finishing with Al2O3. Furthermore, it is evident that the effect of process parameters varies with the type of abrasive materials used. In other words, a single combination of optimum parameters exhibiting the highest surface reduction may not exist for all types of abrasive materials in MAF.

Figure 6.
S/N ratio plots of ∆Ra (%) for Al2O3 abrasive (g = working gap, r = percentage of abrasive, s = abrasive mesh number, N = spindle speed, and f = feed rate).
3.2. ANOVA
In order to further investigate the underlying effects of the key parameters, we performed an analysis of variation (ANOVA) on the experimental results. ANOVA is a well-known statistical method adopted by many researchers to determine the interactions between the controlling factors in empirical parametric studies [20,21]. By doing this analysis, the percentage contribution of each factor and the interacting factors toward the dependent variable can be obtained to measure the effects on their quality characteristics.
Results of pooled ANOVA of ∆Ra for MAF with SiC and Al2O3 are summarized in Table 5 and Table 6, respectively. The ANOVA analysis was performed for a level of significance of 5%. It is seen from Table 5 that that the spindle speed N and the percentage of abrasive amount r are the most dominating factors, making the contribution to the total variability of as much as 15.28% and 22.92%, respectively. Also, p-values of r and N are quite low and, correspondingly, their F-values are high, indicating the significance of r and N. The results are consistent with conclusions drawn by the earlier S/N ratio analysis. In addition, the interactions of feed rate f with working gap g (g × f), percentage of abrasive amount r (r × f), and abrasive mesh number s (s × f) were found to be reasonably significant. The interactions among other parameters are not shown as they are statistically insignificant. This means that the feed rate f also plays a significant role in reducing surface roughness, while the other appropriate parameters are selected. As can be seen from Figure 5, when MAFed with SiC, a larger feed rate is beneficial.

Table 5.
Results of pooled ANOVA of ∆Ra for SiC.

Table 6.
Results of pooled ANOVA of ∆Ra for Al2O3.
As can be seen from Table 6, when MAFed with Al2O3, the working gap g and the abrasive mesh number s are statistically the most influencing factors, making contributions to the total variability of 76.61% and 10.82%, respectively. Also, the p-value of g is the lowest and, correspondingly, its F-value is the highest, indicating the most significant influence of g on the roughness reduction. The interaction between the parameters was found to be quite insignificant. Similar to the results for SiC (Table 5), the ANOVA results for Al2O3 are consistent with its S/N ratio analysis. ANOVA analysis again confirmed that the most influencing parameters change with the change of abrasive materials used with magnetic powders in MAF.
However, it is clear from both S/N ratio and ANOVA analysis, regardless of the abrasive type used, as compared to the process parameters, the percentage of abrasive r and abrasive mesh size s (i.e., fineness of abrasive particles) in the mixture are crucial and the most dominant parameters which must be considered when selecting the control parameters. As observed from Figure 5 and Figure 6, while SiC with finer-meshed (600) or smaller particles seems to reveal a larger roughness reduction, it is completely opposite for Al2O3, i.e., roughness reduction is higher when MAFed with coarser abrasive particles (mesh of 150).
3.3. Modeling
The effect of process parameters on the polishing performance (i.e., the response of roughness reduction, ∆Ra) was mathematically modeled for SiC and Al2O3. To do that, an exponential model was considered to estimate roughness reduction (%), which can be expressed in the following form:
where g, r, s, N, and f are the working gap, the percentage of abrasive, abrasive mesh number, spindle speed, and feed rate, respectively, and m, n, l, o, p, u, v, x, y, and z are the model parameters to be determined. The behavior of surface roughness reduction can be characterized from the sign of the exponents in the above equations. For example, a positive value of an exponent means that surface roughness reduction will increase with the increase of the associated process parameters, while the magnitude of the exponent indicates the weight of the parameter. In order to determine the model parameters, Equations (3) and (4) can further be written in the following forms by taking logarithm transformation on both sides:
ln∆Ra = lnCK + l ln g + m ln r + n ln s + o ln N + p ln f for SiC;
ln∆Ra = lnCL + u ln g + v ln r + x ln s + y ln N + z ln f for Al2O3.
The model parameters were determined with regression analysis using the least-squares method. After obtaining the values of the parameters, the final models were obtained as follows:
∆Ra (%) = 2506 g−0.0489 r 0.3908 s 0.0294 N −0.8602 f 0.221 for SiC;
∆Ra (%) = 304.93 g −3.5377 r 0.4991 s −0.3389 N 0.09062 f −0.257 for Al2O3.
Using the models, the response surfaces illustrating the effect of the process parameters on surface roughness reduction were plotted. As a representative, Figure 7 and Figure 8 show the influence of the significant parameters for SiC and Al2O3, respectively. It is seen from Figure 7 that the reduction in surface roughness increased significantly with the increase in percentage of abrasive amount (r) and the decrease in spindle speed (N). Similarly, as the working gap (g) and the mesh number (s) increased, the reduction in surface roughness increased as shown in Figure 8. The response surface plots showing the effect of parameters estimated by the models are quite consistent with the S/N and ANOVA analysis.
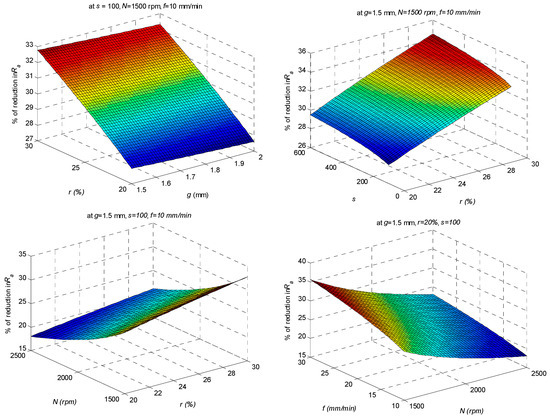
Figure 7.
Response surface plots for SiC.
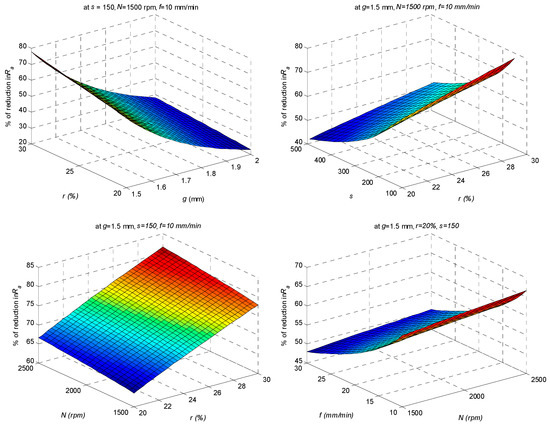
Figure 8.
Response surface plots for Al2O3.
3.4. Model Validation
A residual analysis was performed to verify the correlation between experimental and predicted responses for MAF with SiC and Al2O3 abrasives. The residual can be defined as the difference between the experimental and predicted values for each point in the L27 experimental plan considered in this study. The residual analysis shows a good correlation for modeling of surface roughness reduction, in which the quality of fit R2 = 42.46% for SiC and R2 = 91% for Al2O3 abrasives. In addition, the normal probability plots of the residuals between experimental and predicted values for ∆Ra (%) are depicted in Figure 9 and Figure 10. It can be seen from both figures that the residuals closely match with the straight lines, indicating a normal distribution. Furthermore, an independent finishing test was conducted to confirm the accuracy of the models for MAFed with SiC and Ai2O3. Test trial parameters were chosen as g = 1.65 mm, r = 27%, N = 1800 rpm, and f = 15 mm/min, with s = 400 for SiC and 360 for Al2O3, whereas the percentage of roughness reduction was predicted by the model and was obtained from the experiments compared in Table 7. It is seen that the models for SiC and AI2O3 were able to predict ∆Ra accurately, with an error of 23.32% for SiC and 9.5% for Al2O3. The large error for SiC model would be due to a very complex interplay in the mechanism involving wear of particles and heat generation, which may affect micro material removal in MAF. Dynamics of interactions between type and geometric shape of abrasive with magnetic particles resulting in micro-cutting forces responsible for material removal are worth noting, which could be a potential inviting topic of further research to shed light on this. It may be concluded that the developed models in this study are reasonably accurate and reliable, and they can be employed for the estimation of surface roughness reduction in magnetic abrasive finishing of mild steel surfaces.

Figure 9.
Normal probability vs. residual plot for SiC.
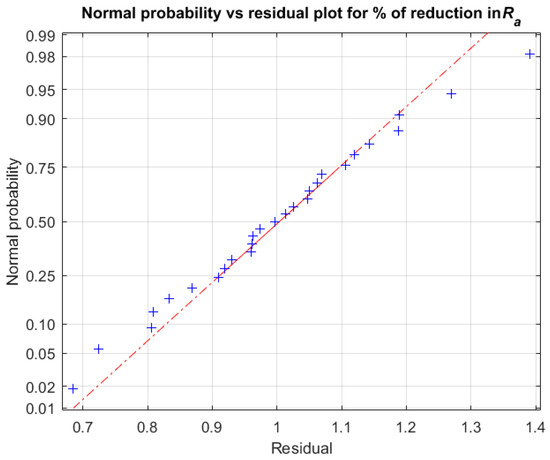
Figure 10.
Normal probability vs. residual plot for Al2O3.

Table 7.
Confirmation tests for mathematical model for .
Furthermore, Figure 11 illustrates a representative three-dimensional (3D) topography and roughness profile of the surface before and after MAF at test trial #12 (g = 1.75 mm, r = 20%, s = 400, N = 2500 rpm, and f = 20 mm/min) with SiC abrasives, showing about a 31% reduction in surface micro troughs, thereby smoothening the surface after MAF. Figure 12 illustrates a representative 3D topography and roughness profile of the surface before and after the finishing operation when MAF was performed at test trial #26 (g = 1.5 mm, r = 20%, s = 150, N = 1500 rpm, and f = 10 mm/min) with Al2O3 abrasive particles, revealing a smooth surface with about 24% roughness reduction after MAF.
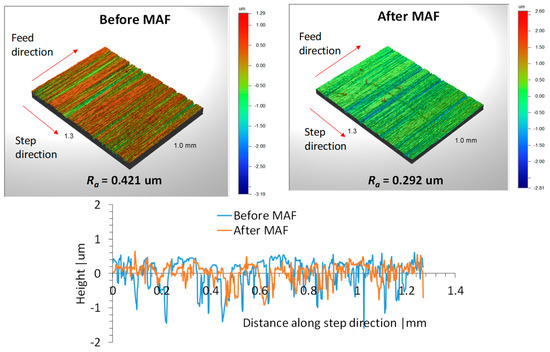
Figure 11.
Three-dimensional (3D) topography and surface roughness profile before and after MAF at g = 1.75 mm, r = 20%, s = 400, N = 2500 rpm, and f = 20 mm/min with SiC abrasives.
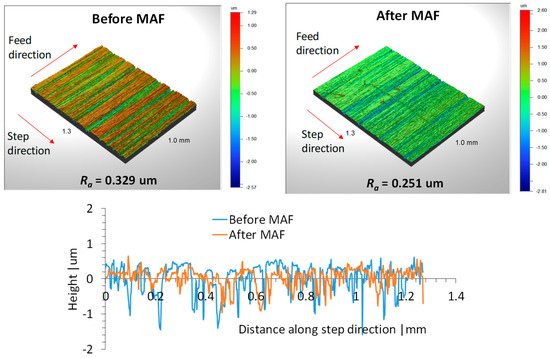
Figure 12.
Three-dimensional topography and surface roughness profile before and after MAF at g = 1.5 mm, r = 20%, s = 150, N = 1500 rpm, and f = 10 mm/min with Al2O3 abrasive particles.
4. Discussion
The interplay of different variables in MAF is very complex and, hence, the optimum condition is unique for a given type of abrasive material considered, i.e., the choice of the desired surface integrity dictates the appropriate control variables as demanded. It is, thus, evident that MAF has tremendous potential to minimize roughness on metallic surfaces, thereby enhancing the quality and life of the product.
Our results indicate that partially bonded particles, i.e., mixing particles with a small amount cutting oil, were found to be efficient in removing micro-particles. It was perceived that slightly bonded particles may create a uniform flexible magnetic abrasive brush with a favorable motion of particles within the brush, thereby resulting in a smoother surface without imparting any further skewedness into surface. It was reported by Guo et al. [9] that, upon keeping other process variables constant in MAF, SiC and coarse abrasives show higher material removal rate (MRR) than Al2O3 and fine abrasives, meaning that SiC with larger abrasives reduces surface roughness significantly. They also highlighted a slight discrepancy in the force data, indicating that finer abrasives cause higher force, which is not the case in the micro-cutting of material. Surprisingly, our results suggest an opposite perspective. In most cases, coarser Al2O3 was found to be more beneficial than finer SiC abrasives, although a moderate fluctuation of roughness reduction between them was observed across the test trials (see Figure 13). This can be attributed to the long and sharp geometric edge of Al2O3 particles (see Figure 2), which enabled removing more materials via significant grinding and polishing actions of abrasive particles as compared to round and spherically shaped SiC particles. Furthermore, due to successive grinding and polishing actions, long abrasive particles may break, which can result in sharper particles, thereby causing more material removal. A similar rationale was reported in Reference [3] via a pertinent theoretical model elucidating the mechanism for material removal in MAF. Yan et al. [22], however, reported that SiC removes slightly more material than Al2O3, but they did not explain the effect of particle size and shape other than their hardness difference. Nevertheless, it must be noted that, as MAF is an intricate process involving the dynamics of a range of parameters, comparing performance metrics against one or two process variable/s may not be a valid argument. Such a conclusion is often imperatively stressed elsewhere in literature [23]. While surface roughness is considered a widely accepted performance indictor when the quality of surface is concerned, a more microscopic observation underpinning the material removal mechanism and surface damages, i.e., micro/nano cracks, fractures, and scratches, must be investigated to provide a holistic and informed quality evaluation of MAF [9]. In other words, a future mathematical model may need to take those perspectives into account to solicit the quality prediction. Similar to conventional cutting, feed rate is a critical parameter affecting the material removal rate and roughness. In other words, a lower feed rate is often recommended while sacrificing productivity to some extent. Hence, an intermediate feed rate would be optimal. Our results indicate that, when MAFed with SiC, a high feed rate seems to improve the finish, while the opposite is true for Al2O3. This could be due to the multiple factors associated with the process, such as variation of the shape and size distribution of abrasive particles and the difference between actual and nominal (theoretical) feed rate. As can be seen in Figure 2, irrespective of mesh size, Al2O3 abrasives show a very non-uniform shape (e.g., long strips), while SiC particles are of a more regular spherical shape. Furthermore, while the nominal (commanded) feed rate is 10 mm/min, a variation of actual feed rate with respect to finishing time is clearly observed (see Figure 13), and the actual feed rate is always lower than the nominal. While this is a factor related to the machine’s limitation, such a discrepancy is likely to affect the overall material removal rate, which can result in a variation of roughness reduction between SiC and Al2O3.
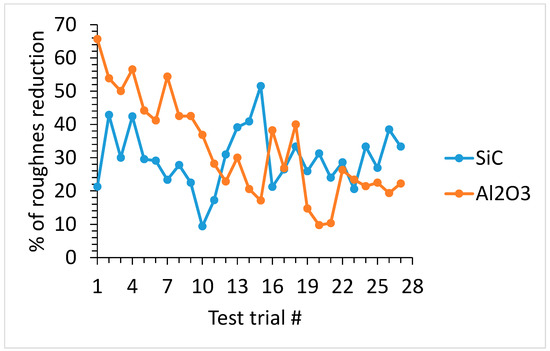
Figure 13.
Comparison of percentage of roughness reduction between SiC and Al2O3 abrasives with respect to test trials.
Overall, it is imperative to say that the difference in important factors in the final roughness is intriguing and will require further investigations and experiments with other finishing (abrasive) materials and finished parts. This will determine if additional variables will need to be considered so as to develop a generalized model of the MAF, and a set of experiments will need to be conducted with each class of abrasive material, with specific models created as a result. For instance, other important parameters such as magnetic pressure (or force) and finishing time may change surface topography, as well as material removal mechanism, thus impacting polishing performance in MAF. Future works will aim to address the above to provide comprehensive insight into the process mechanics, thereby realizing the potential benefit and robust application of MAF. In particular, mechanisms of how different abrasive shapes or distributions dynamically interact with each other in cutting material via abrasive action need to be investigated. In addition, careful attention must be paid to experimental protocol, including preparing the initial surface and the abrasive mixture, in addition to the control of process parameters, to ensure consistency and reliability of response measurements.
5. Conclusions
The current study investigated the simultaneous effect of five critical process parameters in MAF on surface roughness reduction. A very interesting observation was that the dominant control variables that revealed larger roughness reduction were different based on abrasive particle type used. A unique interplay between the characteristics of abrasives (size and type) and the process variable was a clear and evident fact. Results of S/N ratio clearly indicated that, when MAFed with SiC, percentage of abrasive (r) and rotational speed (N) were shown to be the most influential parameters. On the other hand, when MAFed with Al2O3, the most influential parameters were the working gap (g) and the abrasive mesh (s). This characteristic or phenomenon was further supported by ANOVA analysis. A mathematical model predicting roughness reduction to optimize the process for SiC and Al2O3 was validated by residual error analysis and independent finishing tests, with a best quality of fit of R2 = 91%. It is imperative to note that a roughness prediction model for the MAF should be unique to the type of abrasive particle used. Future work should endeavor underpinning the mechanisms for material removal and the resulting surface damages, in addition to determining a performance metric by taking them into account, and incorporating them into the modeling approach for an improved and robust prediction of the process outcome.
Author Contributions
M.S.U. conceptualized the study, and wrote and reviewed the manuscript. V.S. performed the observation experiments. R.M. reviewed the manuscript.
Funding
This research received no external funding.
Conflicts of Interest
The authors declare no conflicts of interest.
References
- Mori, T.; Hirota, K.; Kawashima, Y. Clarification of magnetic abrasive finishing mechanism. J. Mater. Process. Technol. 2003, 143–144, 682–686. [Google Scholar] [CrossRef]
- Shinmura, T.; Takazawa, K.; Hatano, E.; Matsunaga, M.; Matsuo, T. Study on Magnetic Abrasive Finishing. CIRP Ann. Manuf. Technol. 1990, 39, 325–328. [Google Scholar] [CrossRef]
- Sun, H.; Wang, J.; Longstaff, A.; Gu, F. Characterizing acoustic emission signals for the online monitoring of a fluid magnetic abrasives finishing process. Proc. Inst. Mech. Eng. Part C J. Mech. Eng. Sci. 2018, 232, 2079–2087. [Google Scholar] [CrossRef]
- Chang, G.-W.; Yan, B.-H.; Hsu, R.-T. Study on cylindrical magnetic abrasive finishing using unbonded magnetic abrasives. Int. J. Mach. Tools Manuf. 2002, 42, 575–583. [Google Scholar] [CrossRef]
- Singh, D.K.; Jain, V.K.; Raghuram, V. Parametric study of magnetic abrasive finishing process. J. Mater. Process. Technol. 2004, 149, 22–29. [Google Scholar] [CrossRef]
- Yamaguchi, H.; Shinmura, T.; Kobayashi, A. Development of an Internal Magnetic Abrasive Finishing Process for Nonferromagnetic Complex Shaped Tubes. JSME Int. J. Ser. C Mech. Syst. Mach. Elem. Manuf. 2001, 44, 275–281. [Google Scholar] [CrossRef]
- Heng, L.; Yang, G.E.; Wang, R.; Kim, M.S.; Mun, S.D. Effect of carbon nano tube (CNT) particles in magnetic abrasive finishing of Mg alloy bars. J. Mech. Sci. Technol. 2015, 29, 5325–5333. [Google Scholar] [CrossRef]
- Liu, Z.Q.; Chen, Y.; Li, Y.J.; Zhang, X. Comprehensive performance evaluation of the magnetic abrasive particles. Int. J. Adv. Manuf. Technol. 2013, 68, 631–640. [Google Scholar] [CrossRef]
- Guo, J.; Tan, Z.E.; Au, K.H.; Liu, K. Experimental investigation into the effect of abrasive and force conditions in magnetic field-assisted finishing. Int. J. Adv. Manuf. Technol. 2017, 90, 1881–1888. [Google Scholar] [CrossRef]
- KWAK, J.-S. Mathematical model determination for improvement of surface roughness in magnetic-assisted abrasive polishing of nonferrous AISI316 material. Trans. Nonferrous Met. Soc. China 2012, 22 (Suppl. 3), s845–s850. [Google Scholar] [CrossRef]
- Yang, L.-D.; Lin, C.-T.; Chow, H.-M. Optimization in MAF operations using Taguchi parameter design for AISI304 stainless steel. Int. J. Adv. Manuf. Technol. 2008, 42, 595–605. [Google Scholar] [CrossRef]
- Pashmforoush, F.; Rahimi, A.; Kazemi, M. Mathematical modeling of surface roughness in magnetic abrasive finishing of BK7 optical glass. Appl. Opt. 2015, 54, 8275–8281. [Google Scholar] [CrossRef]
- Givi, M.; Tehrani, A.F.; Mohammadi, A. Polishing of the aluminum sheets with magnetic abrasive finishing method. Int. J. Adv. Manuf. Technol. 2011, 61, 989–998. [Google Scholar] [CrossRef]
- Lee, Y.-H.; Wu, K.-L.; Bai, C.-T.; Liao, C.-Y.; Yan, B.-H. Planetary motion combined with two-dimensional vibration-assisted magnetic abrasive finishing. Int. J. Adv. Manuf. Technol. 2014, 76, 1865–1877. [Google Scholar] [CrossRef]
- Yun, H.; Han, B.; Chen, Y.; Liao, M. Internal finishing process of alumina ceramic tubes by ultrasonic-assisted magnetic abrasive finishing. Int. J. Adv. Manuf. Technol. 2015, 85, 727–734. [Google Scholar] [CrossRef]
- Zhou, K.; Chen, Y.; Du, Z.W.; Niu, F.L. Surface integrity of titanium part by ultrasonic magnetic abrasive finishing. Int. J. Adv. Manuf. Technol. 2015, 80, 997–1005. [Google Scholar] [CrossRef]
- Yamaguchi, H.; Nteziyaremye, V.; Stein, M.; Li, W. Hybrid tool with both fixed-abrasive and loose-abrasive phases. CIRP Ann. Manuf. Technol. 2015, 64, 337–340. [Google Scholar] [CrossRef]
- Taguchi, G.; Phadke, M.S. Quality Engineering through Design Optimization. In Quality Control, Robust Design, and the Taguchi Method; Springer: Boston, MA, USA, 1989; pp. 77–96. ISBN 978-1-4684-1474-5. [Google Scholar]
- Chou, S.-H.; Wang, A.-C.; Lin, Y.-C. Elucidating the Rheological Effect of Gel Abrasives in Magnetic Abrasive Finishing. Procedia CIRP 2016, 42, 866–871. [Google Scholar] [CrossRef]
- Amer, Y.; Moayyedian, M.; Hajiabolhasani, Z.; Moayyedian, L. Reducing Warpage in Injection Moulding Processes using Taguchi Method Approach: ANOVA; ACTA Press: Crete, Greece, 2012. [Google Scholar]
- Uddin, M.S. On the influence and optimisation of cutting parameters in finishing of metallic femoral heads of hip implants. Int. J. Adv. Manuf. Technol. 2014, 73, 1523–1532. [Google Scholar] [CrossRef]
- Yan, B.-H.; Chang, G.-W.; Cheng, T.-J.; Hsu, R.-T. Electrolytic magnetic abrasive finishing. Int. J. Mach. Tools Manuf. 2003, 43, 1355–1366. [Google Scholar] [CrossRef]
- Mulik, R.S.; Pandey, P.M. Magnetic abrasive finishing of hardened AISI 52100 steel. Int. J. Adv. Manuf. Technol. 2011, 55, 501–515. [Google Scholar] [CrossRef]
© 2019 by the authors. Licensee MDPI, Basel, Switzerland. This article is an open access article distributed under the terms and conditions of the Creative Commons Attribution (CC BY) license (http://creativecommons.org/licenses/by/4.0/).