Investigation on Product and Process Fingerprints for Integrated Quality Assurance in Injection Molding of Microstructured Biochips


Abstract
1. Introduction
2. Experimental Setup and Methods
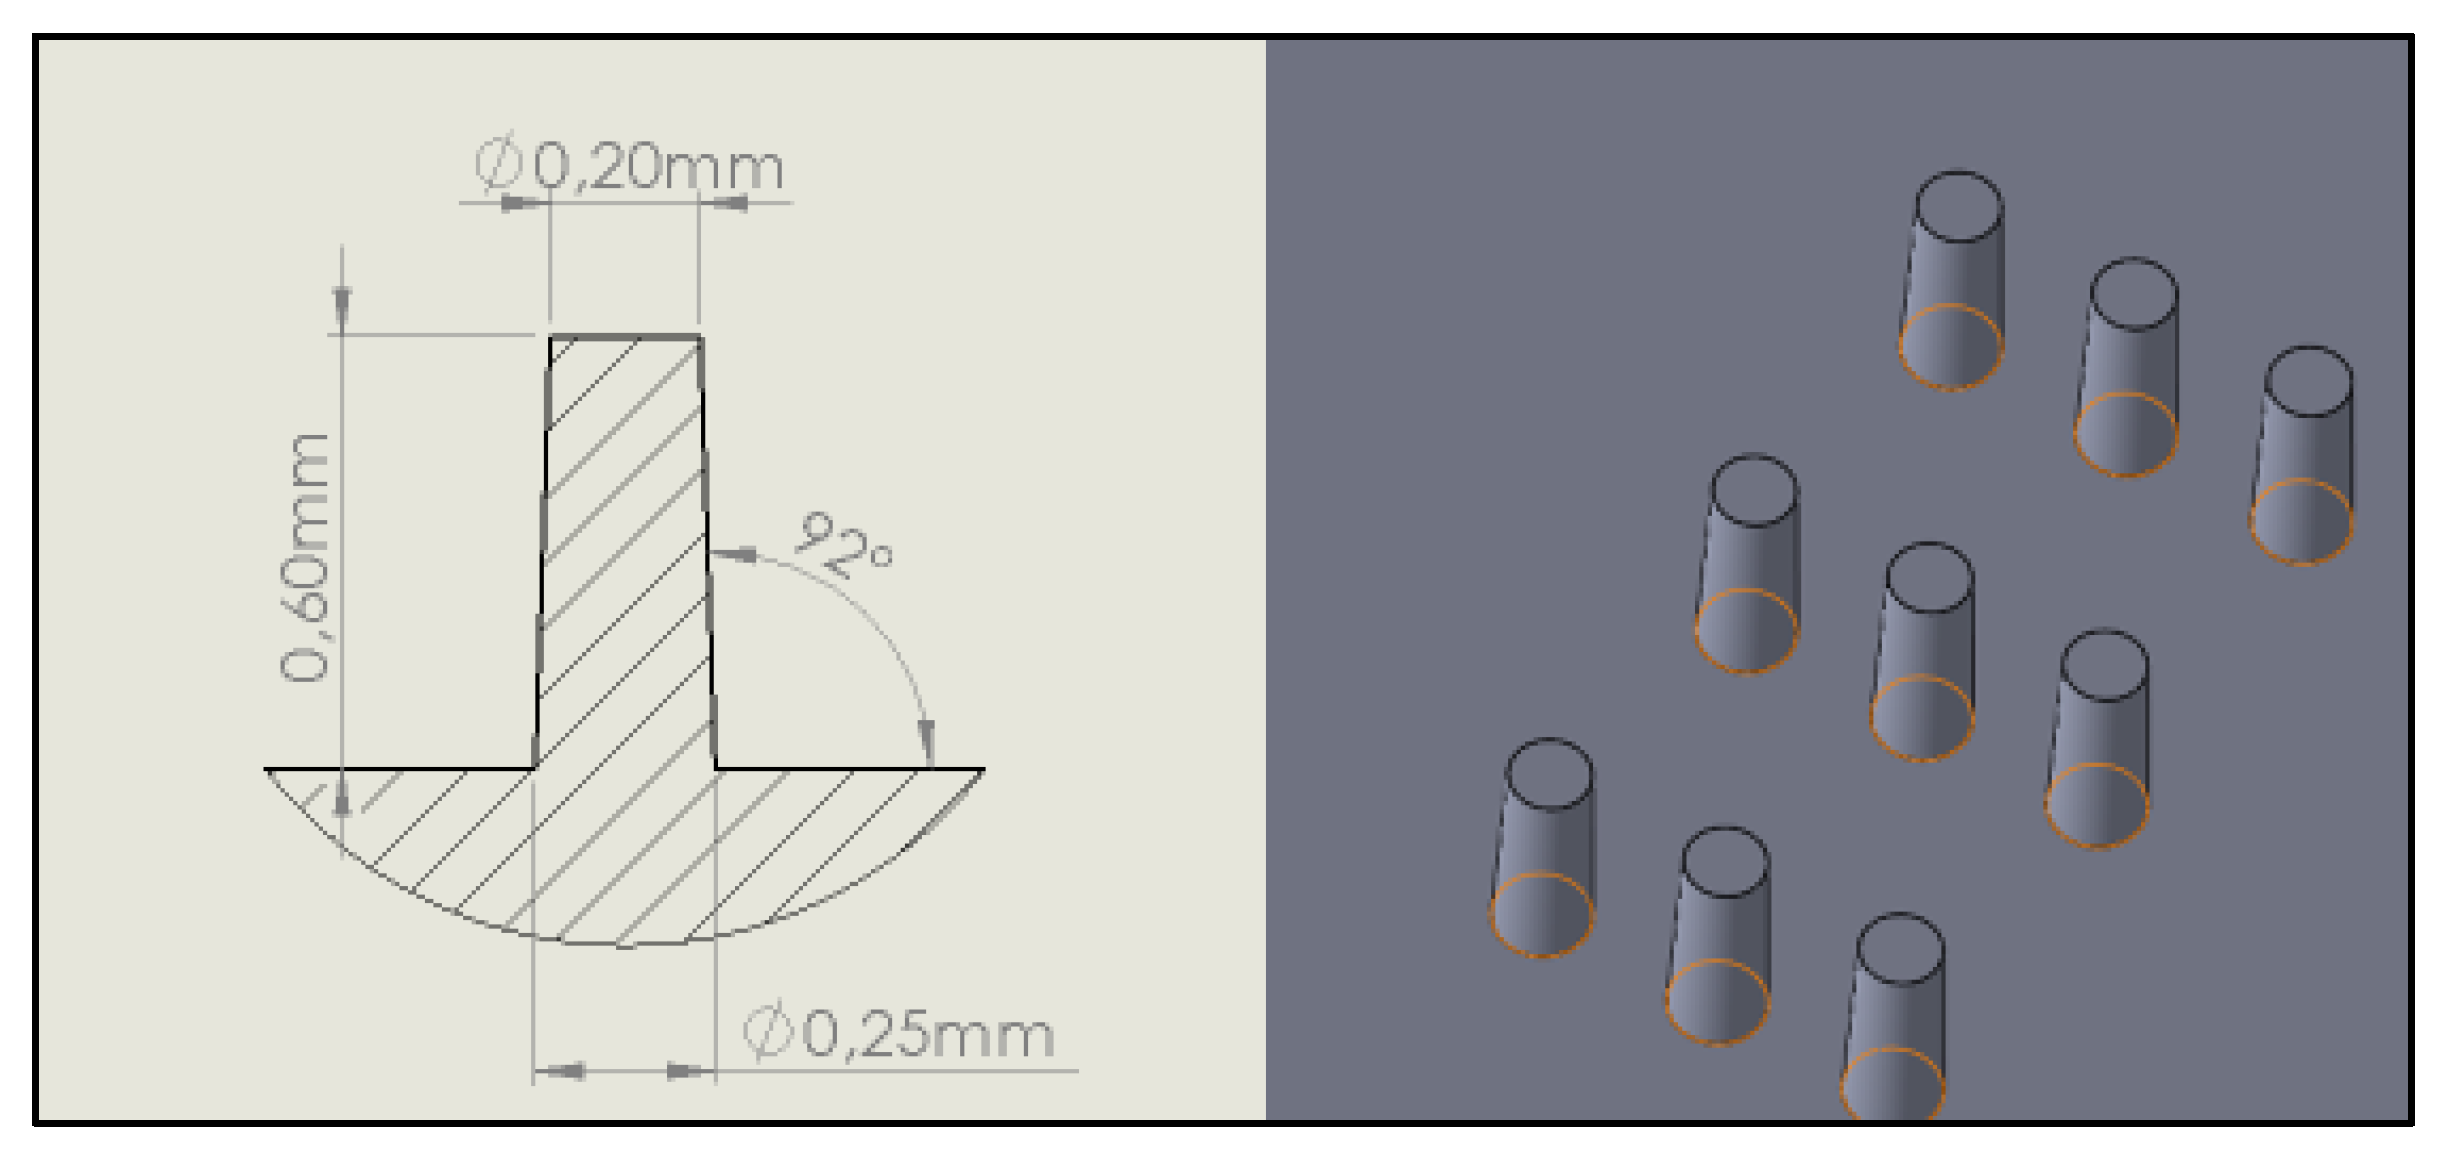
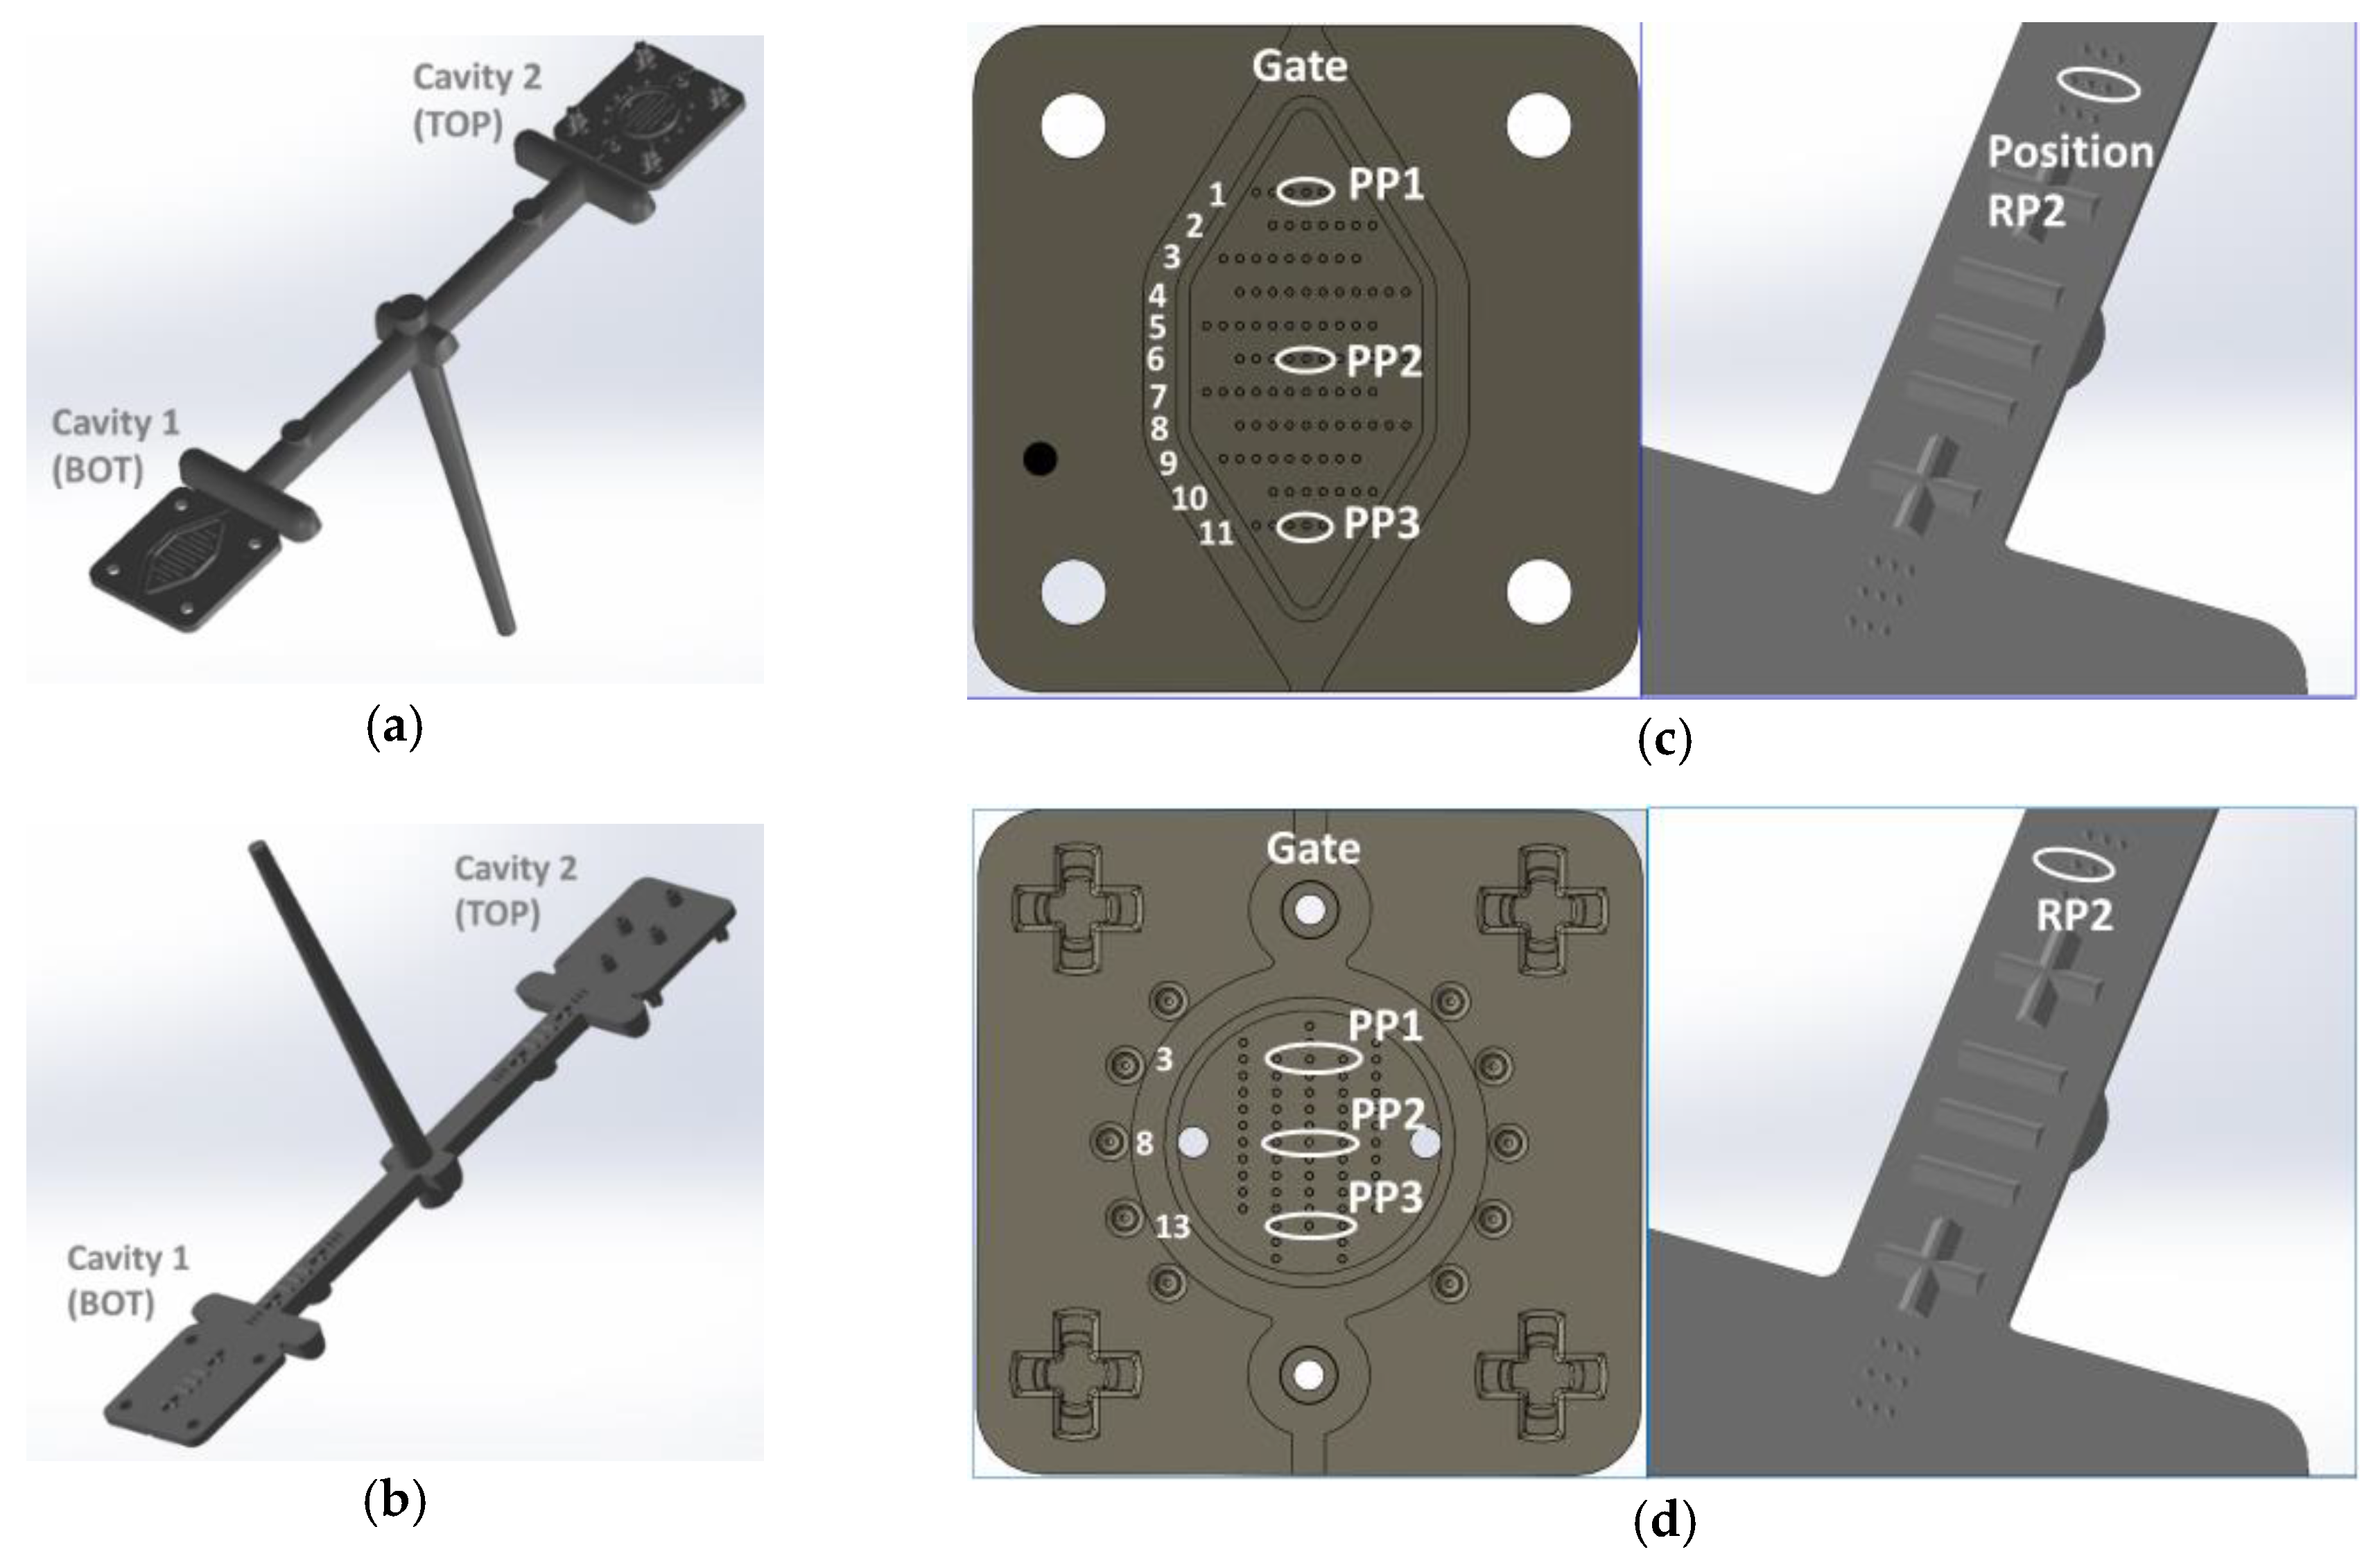
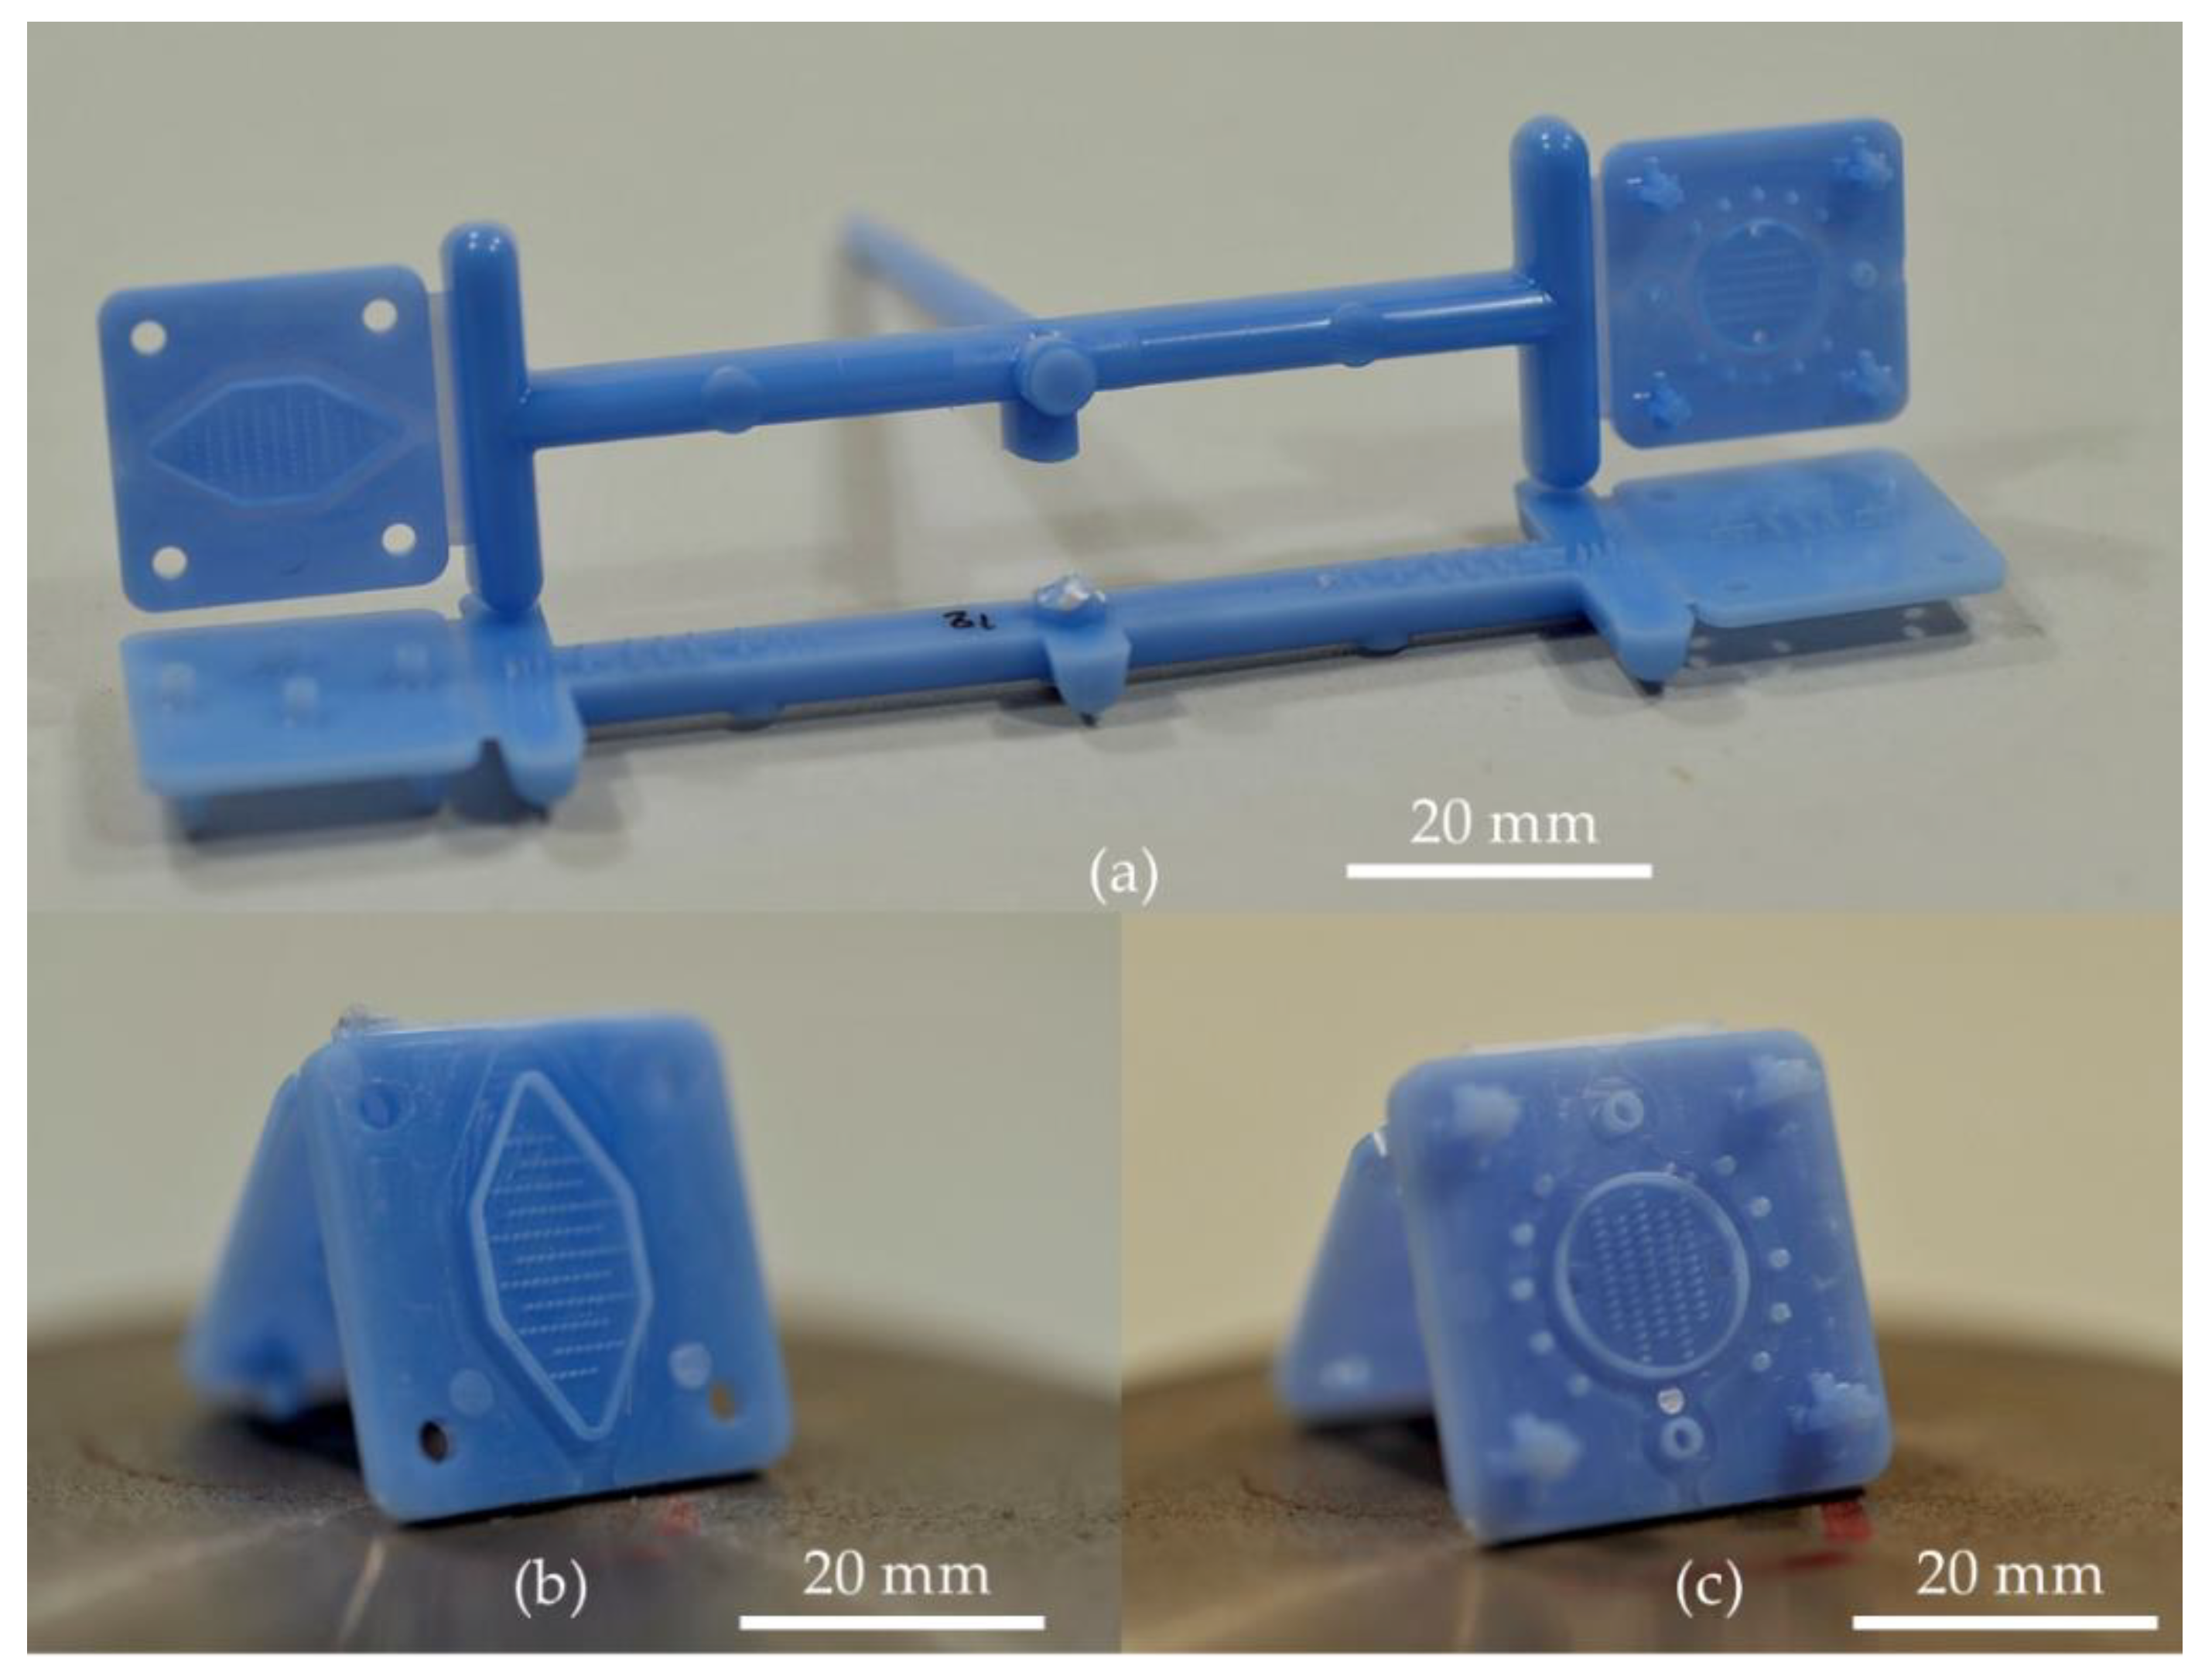
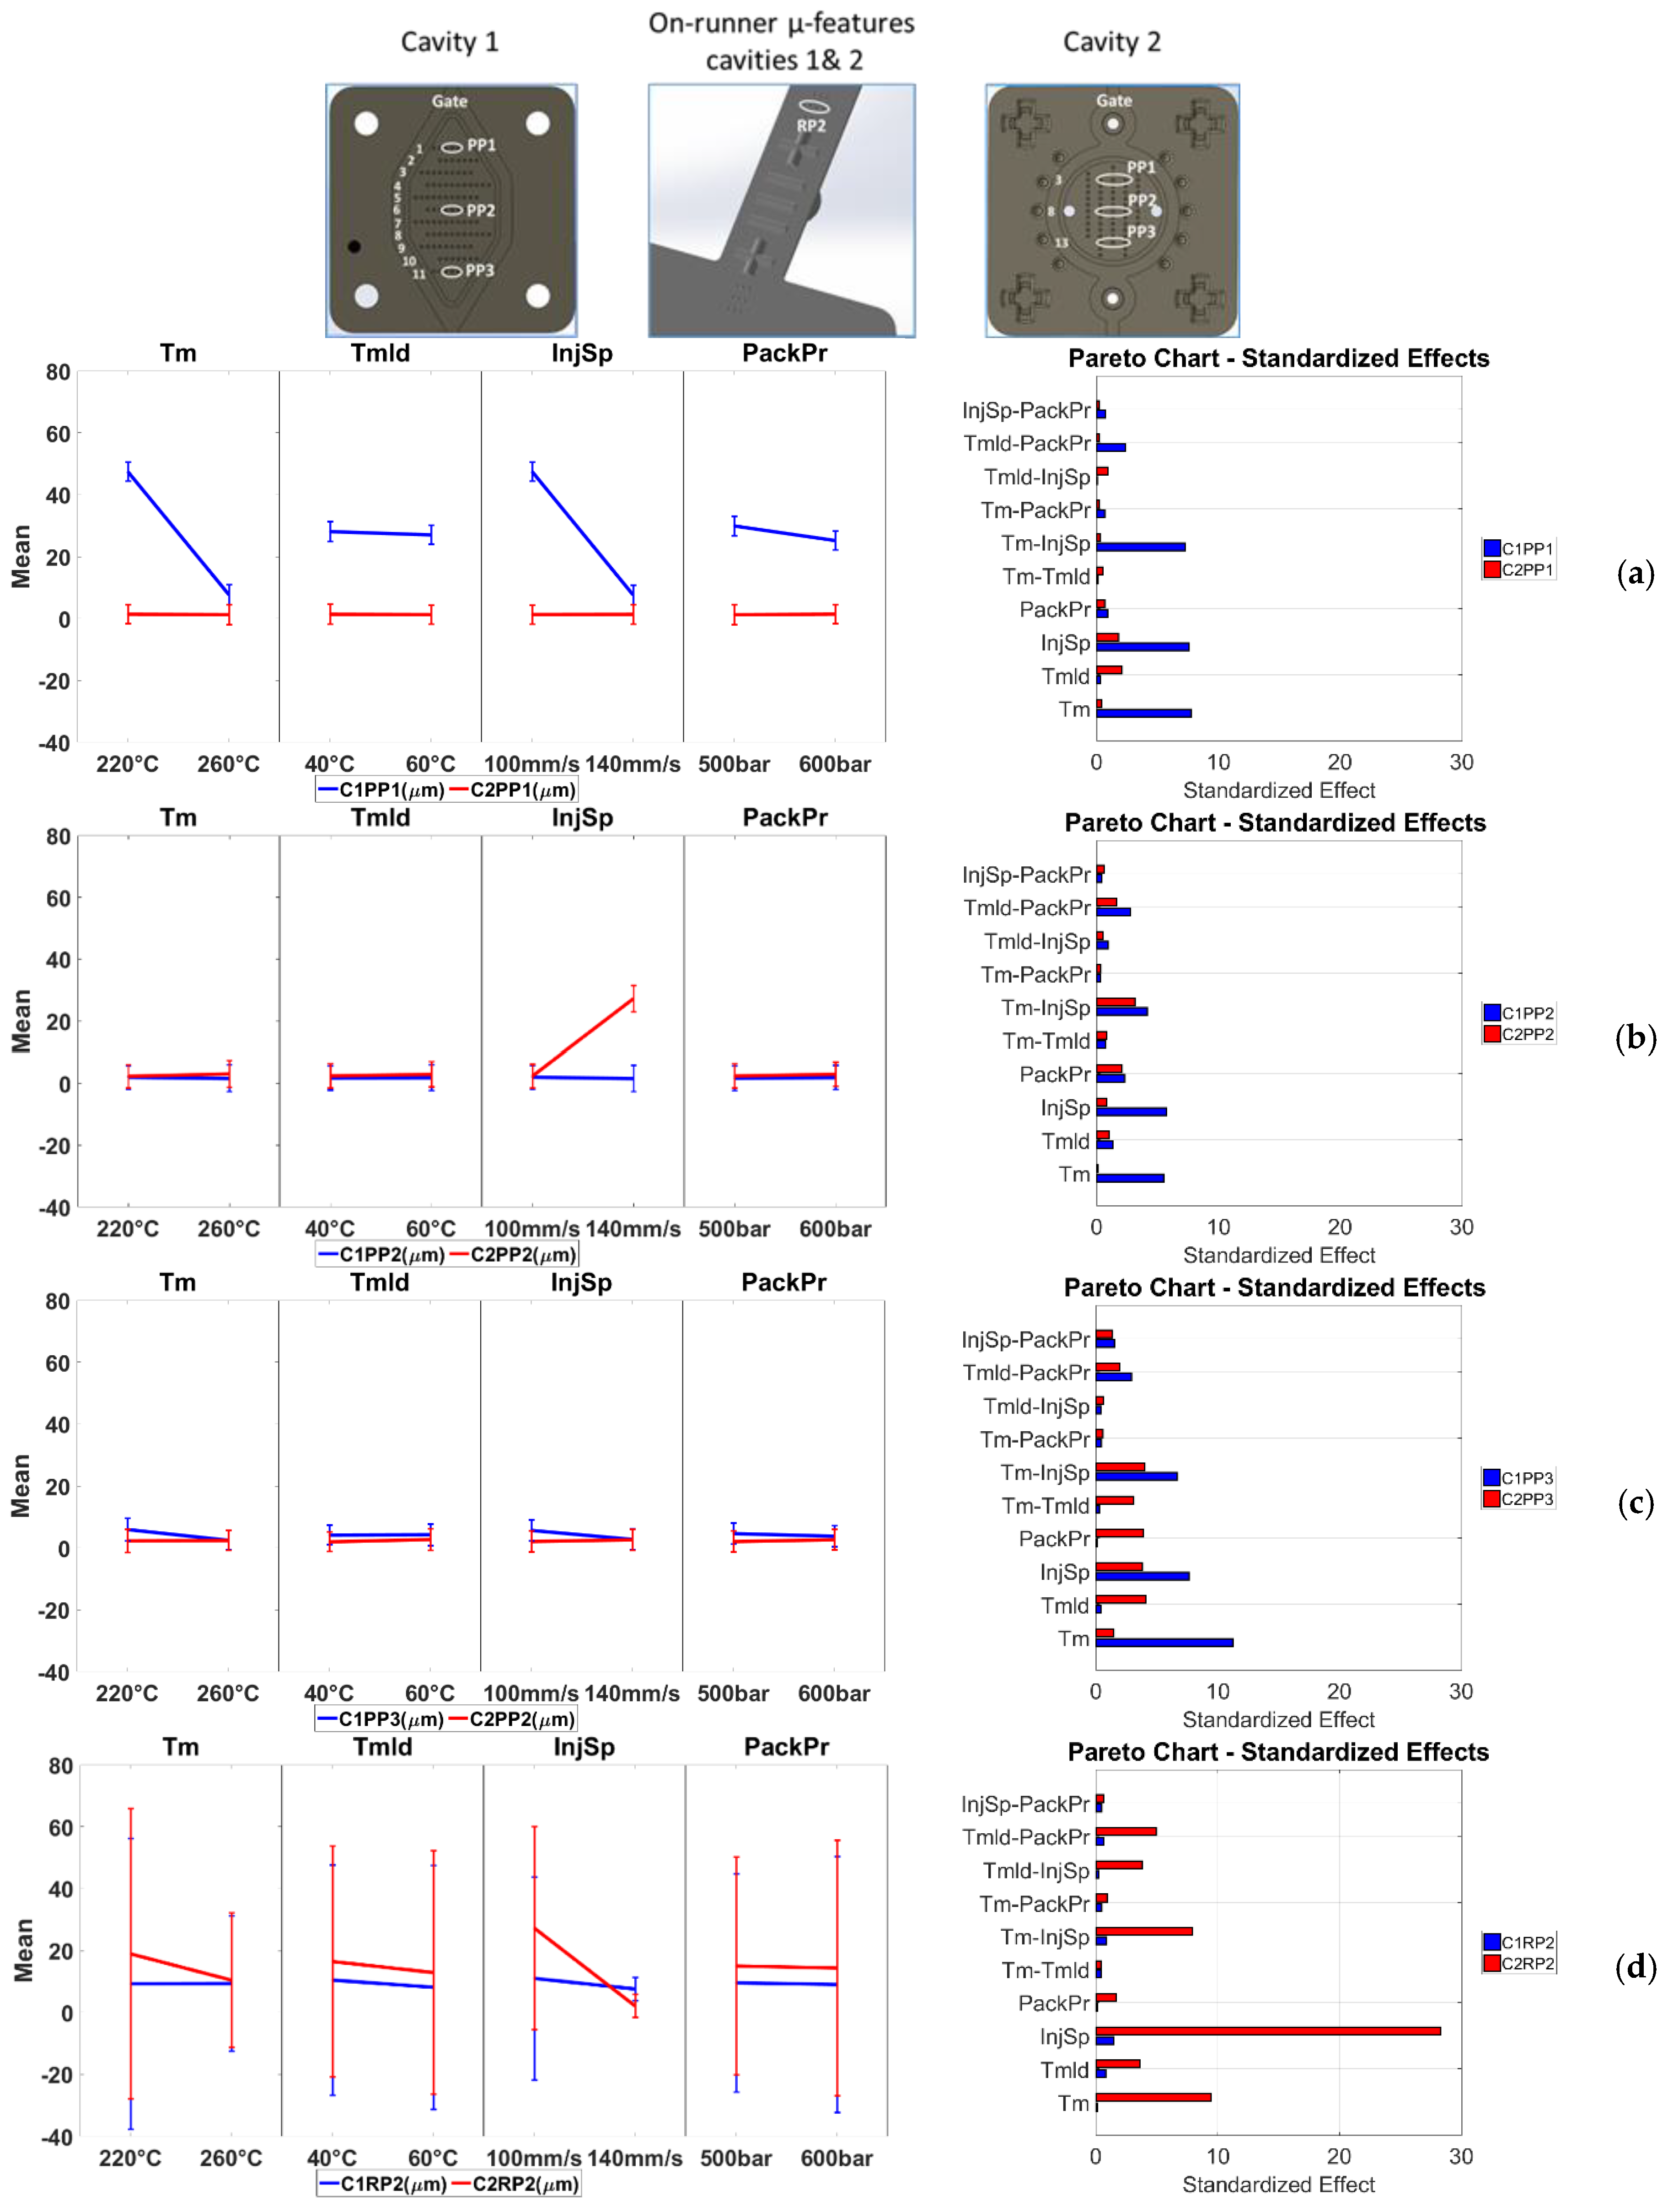
2.1. Molding Tool Geometry
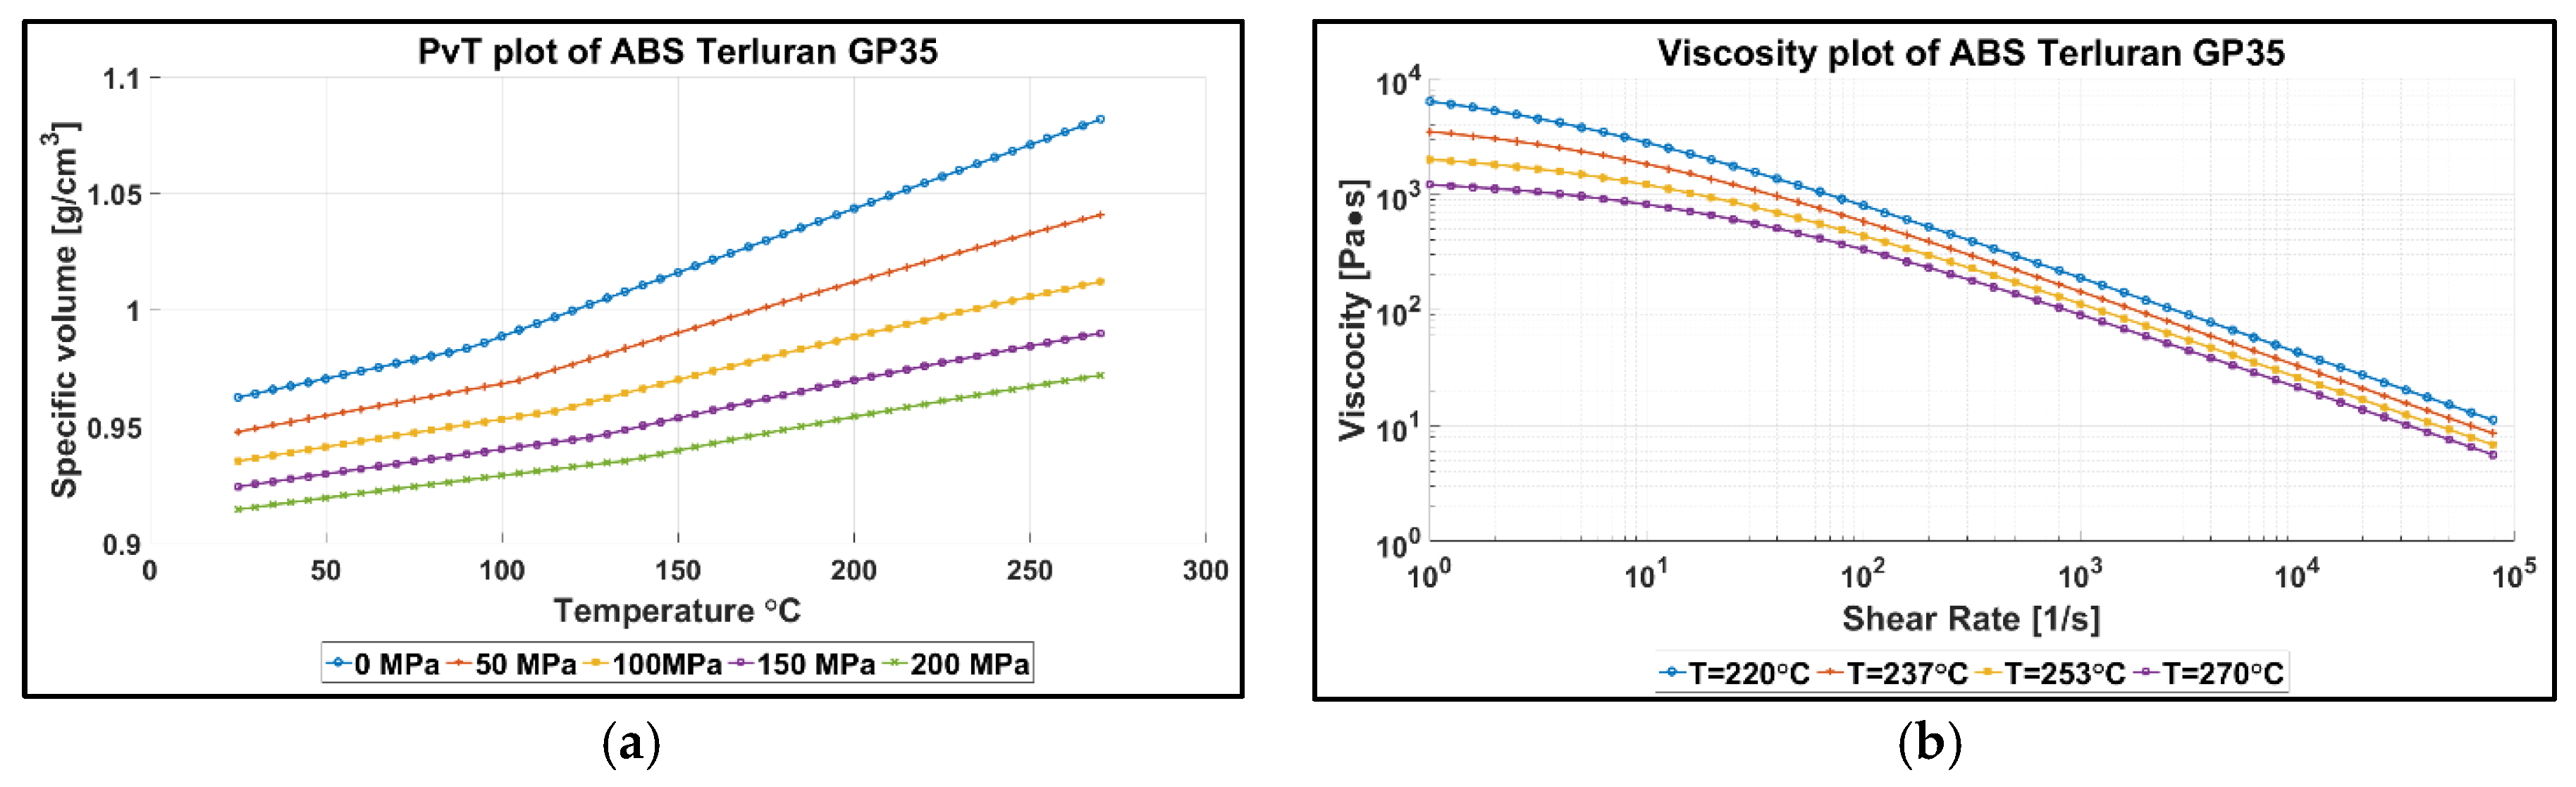
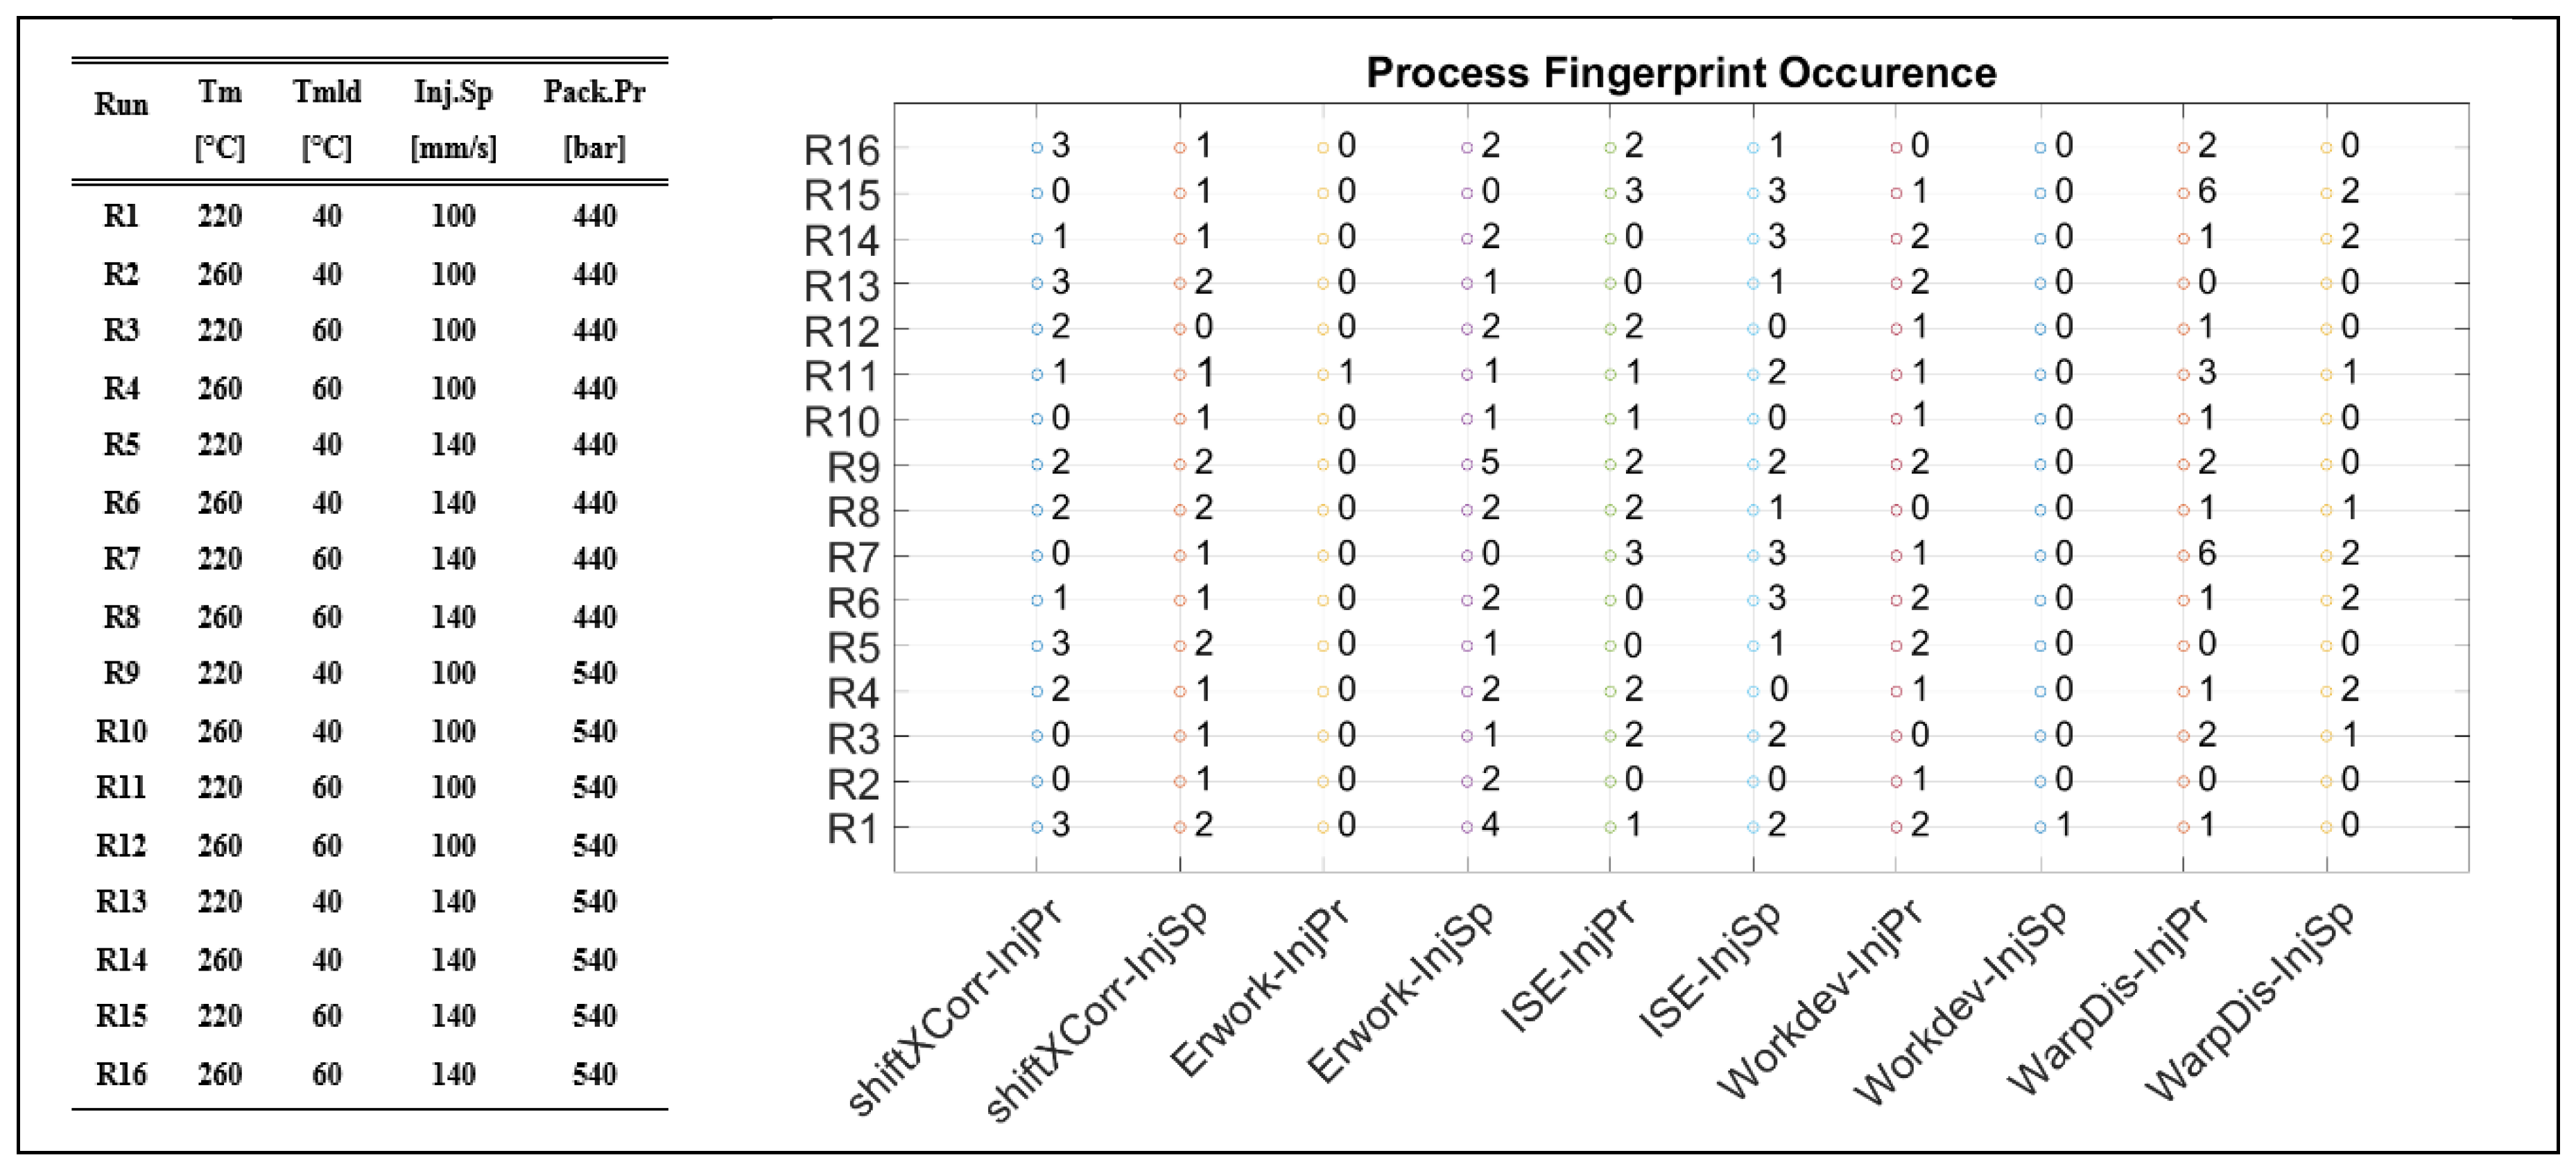
2.2. Injection Molding Process and Experimental Conditions
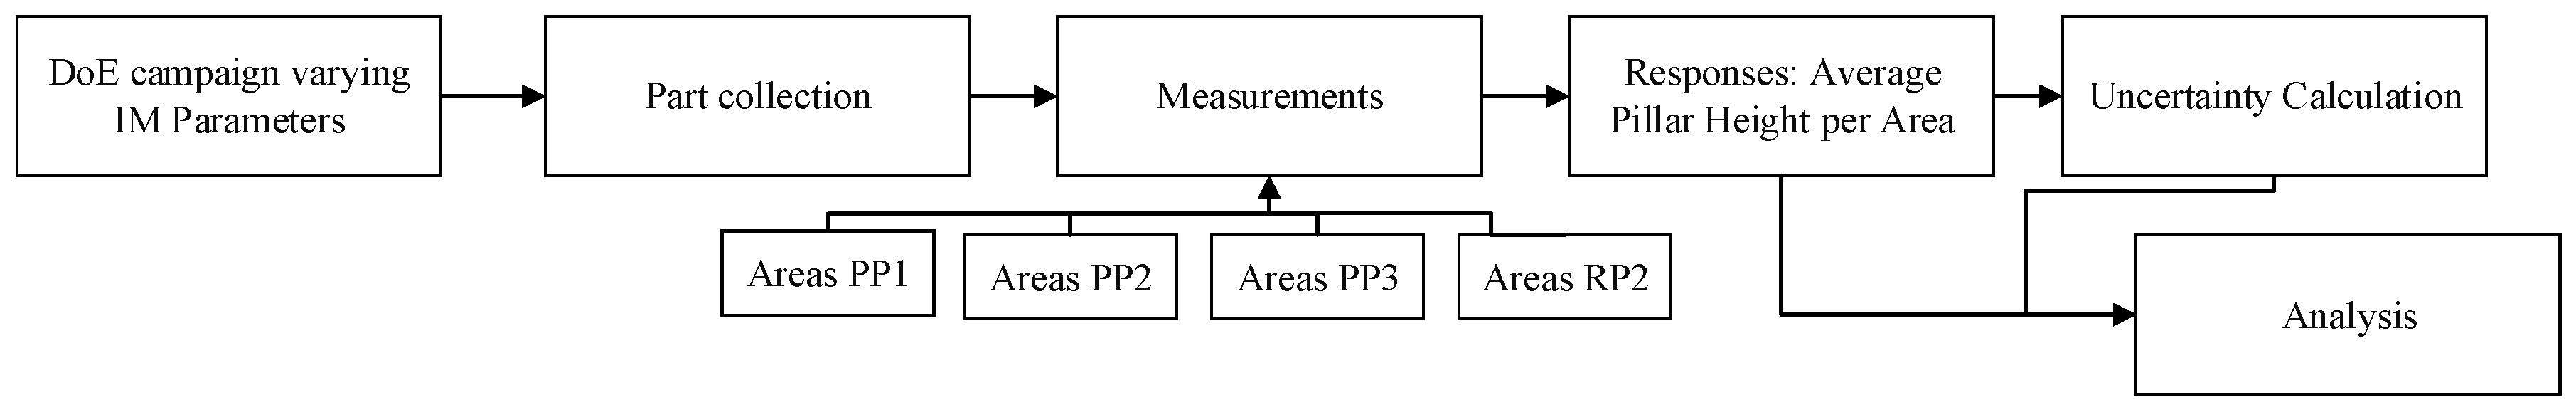
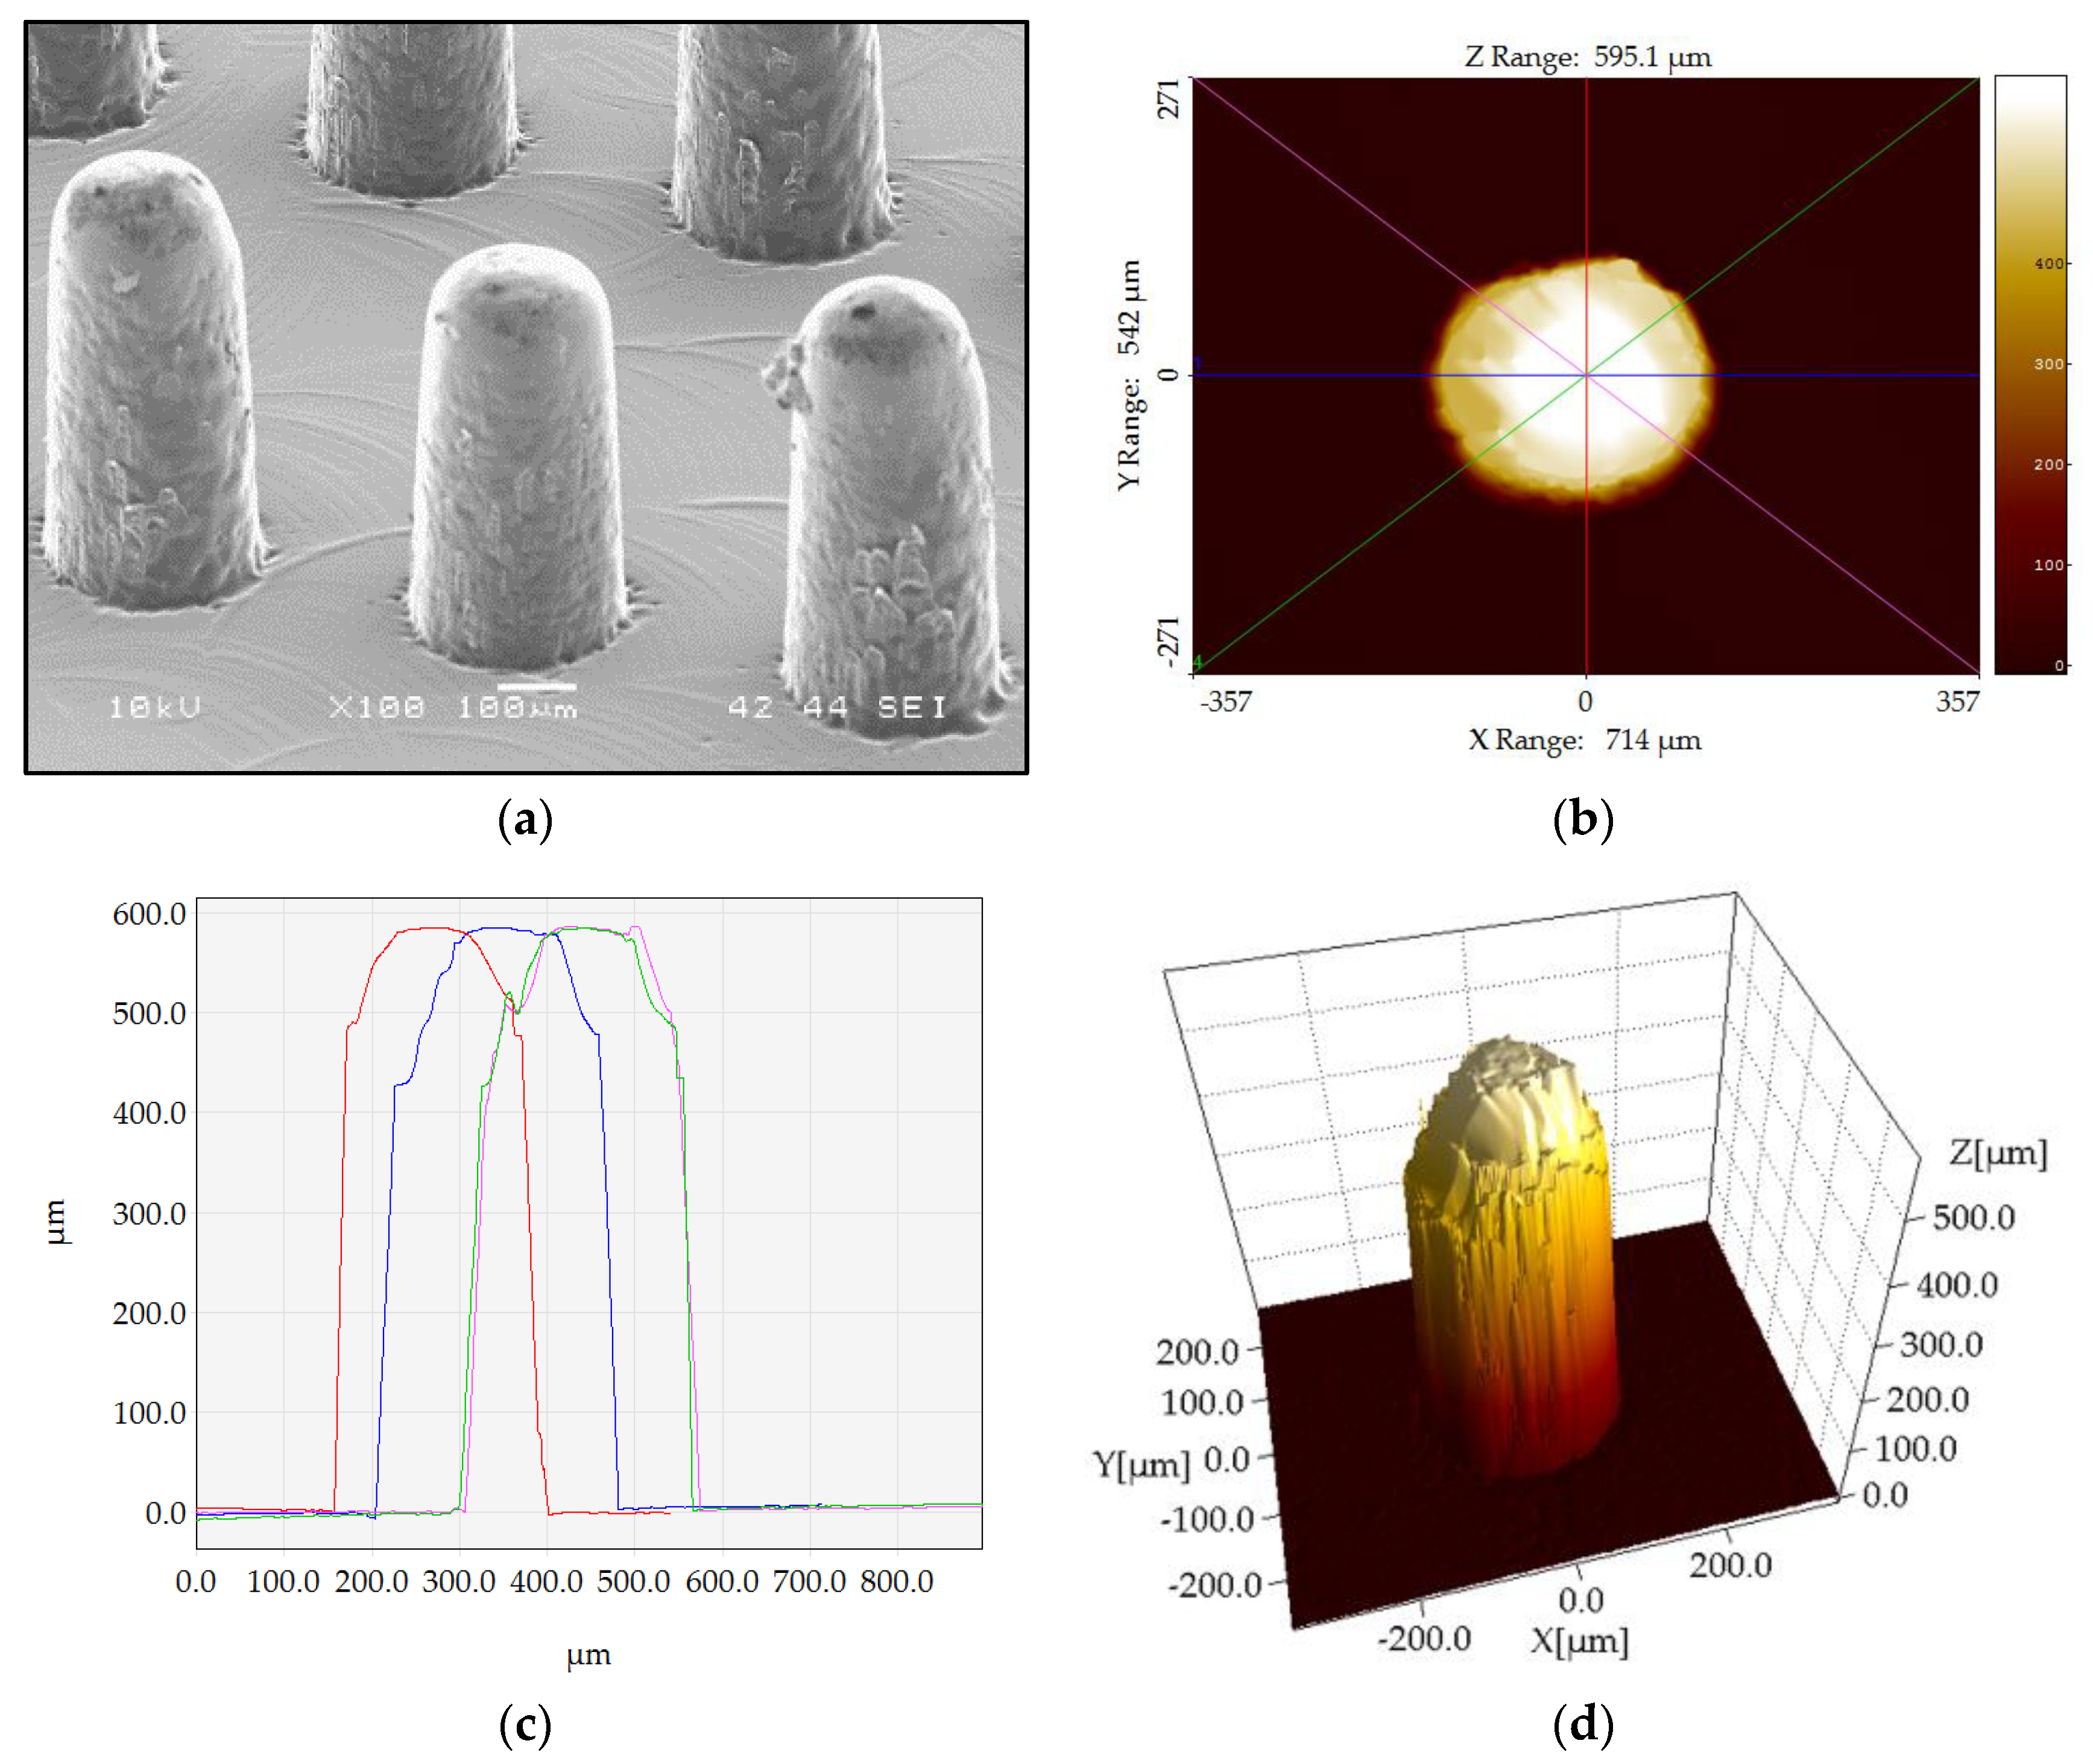
2.3. Pillar Dimensional Measurement and Uncertainty Evaluation Procedure
2.4. Product Fingerprint as Quality Indicator
2.5. Process Fingerprint as Quality Indicators
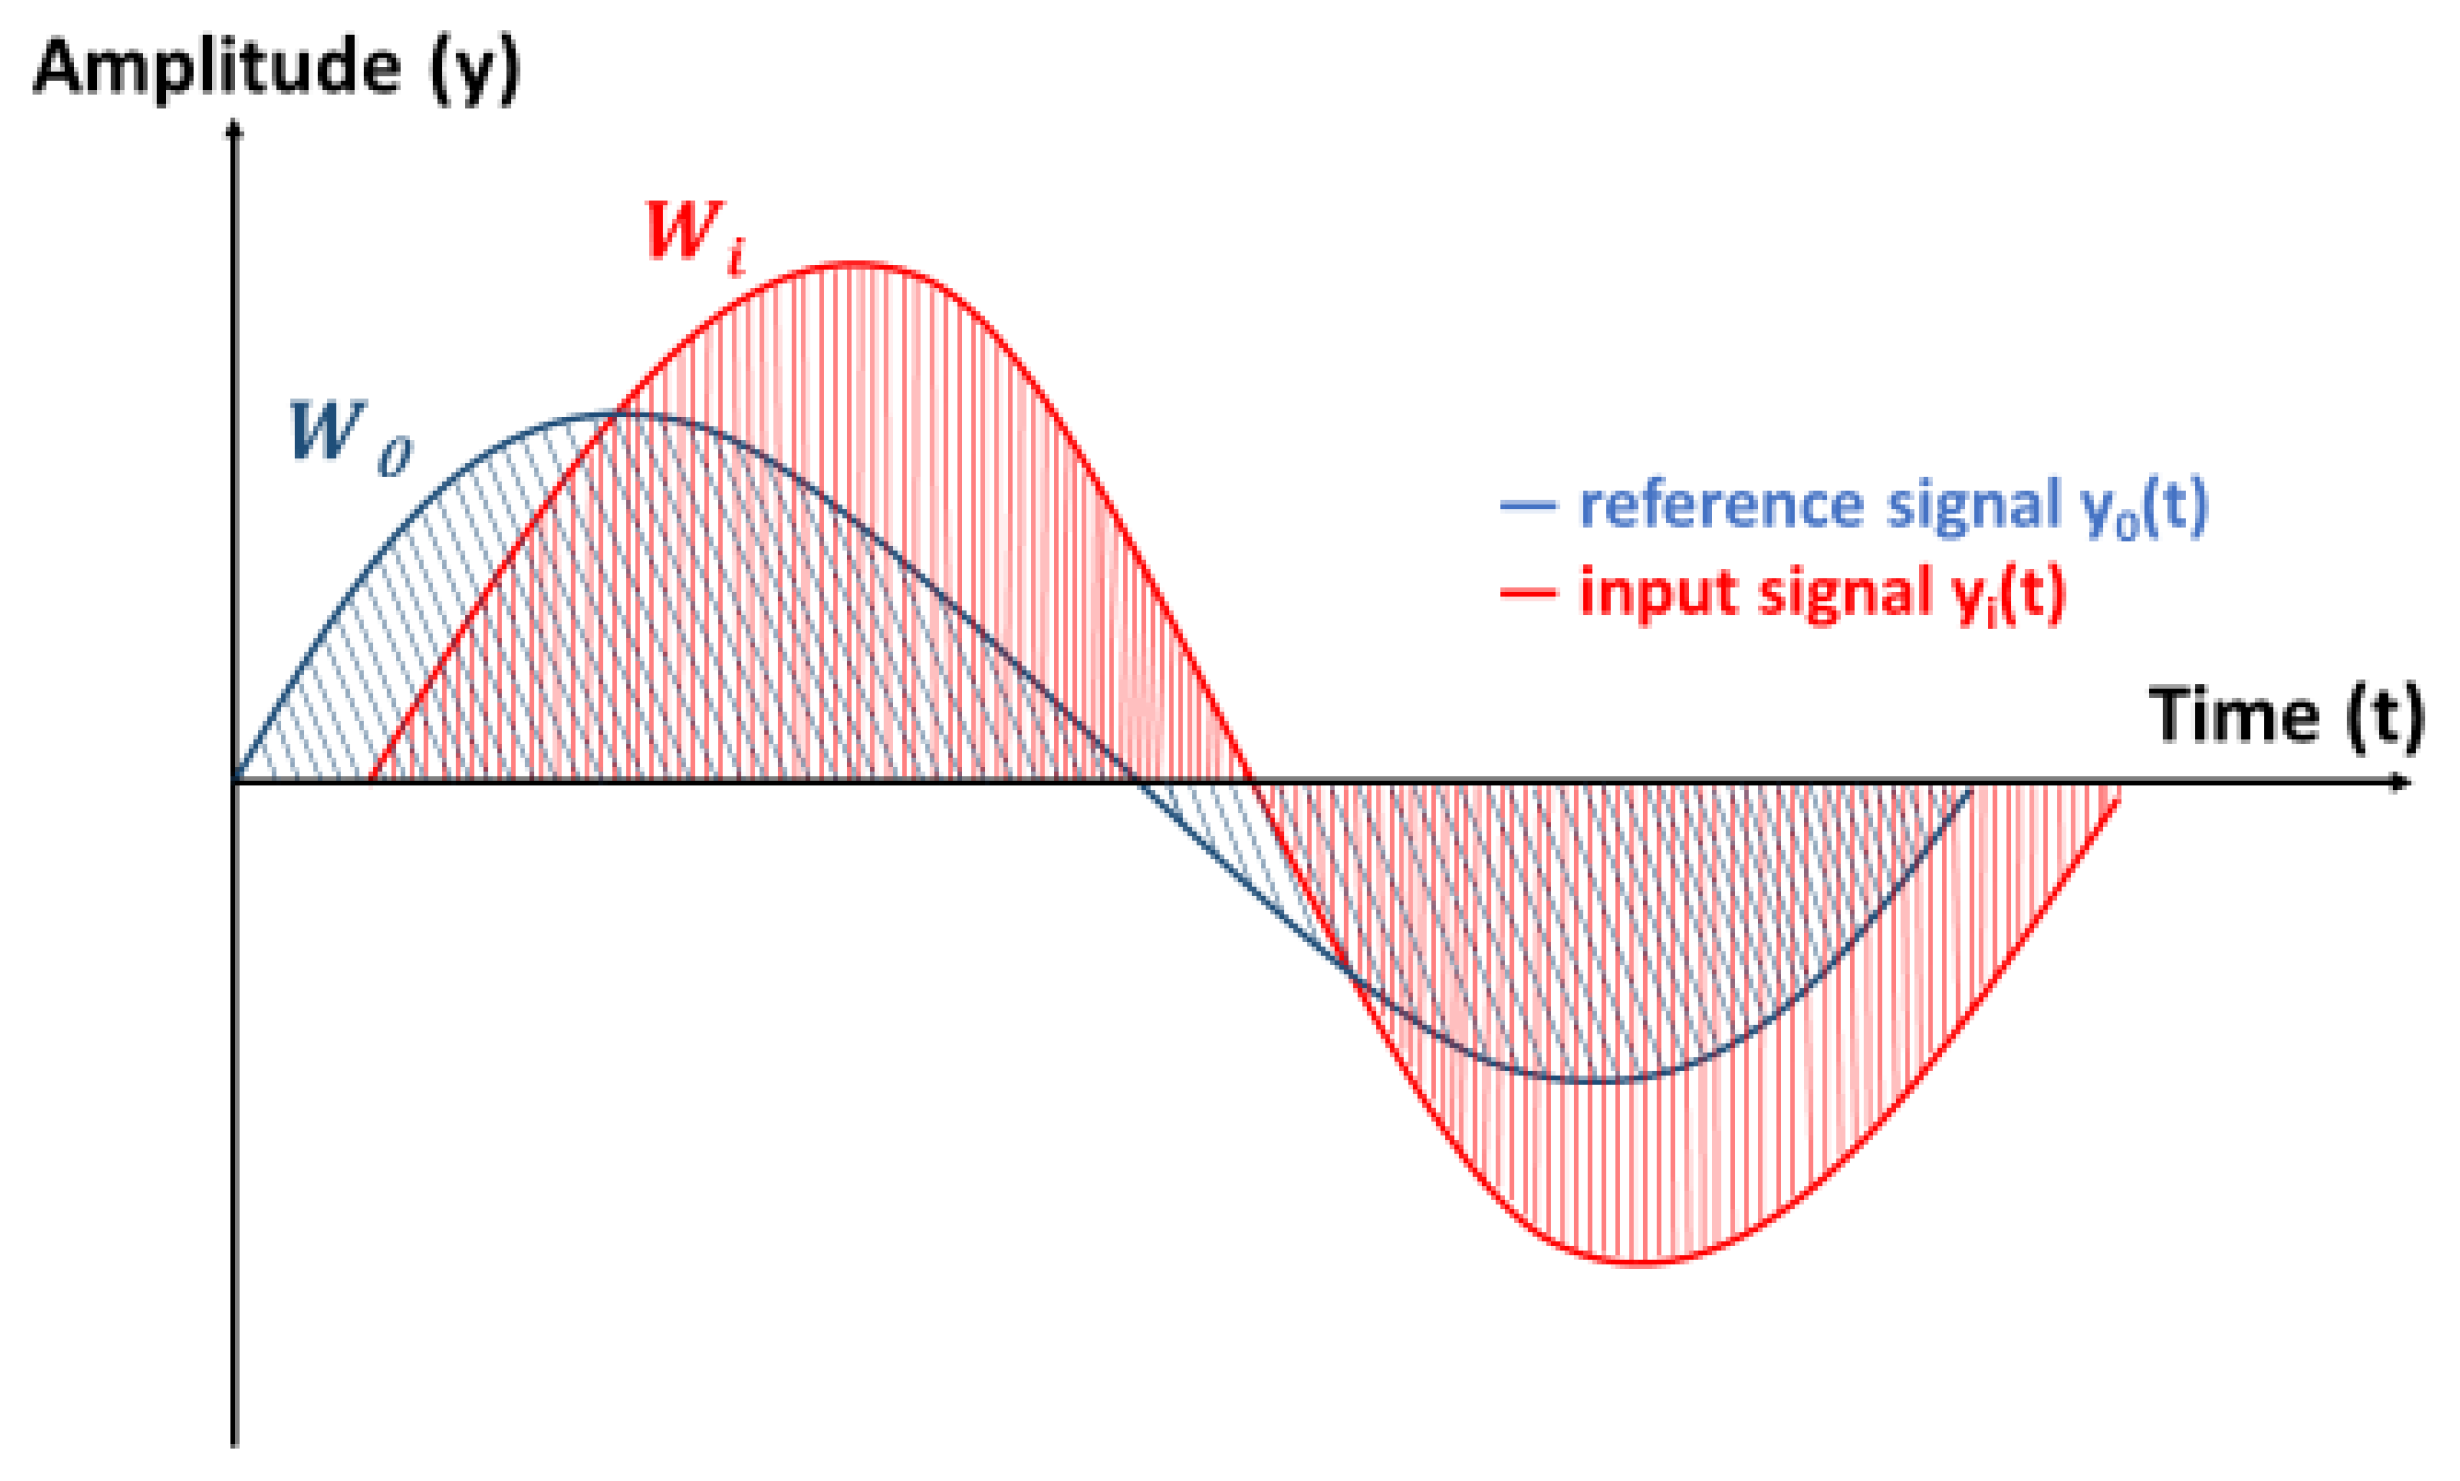
2.5.1. Work of Error and Integrated Squared Error
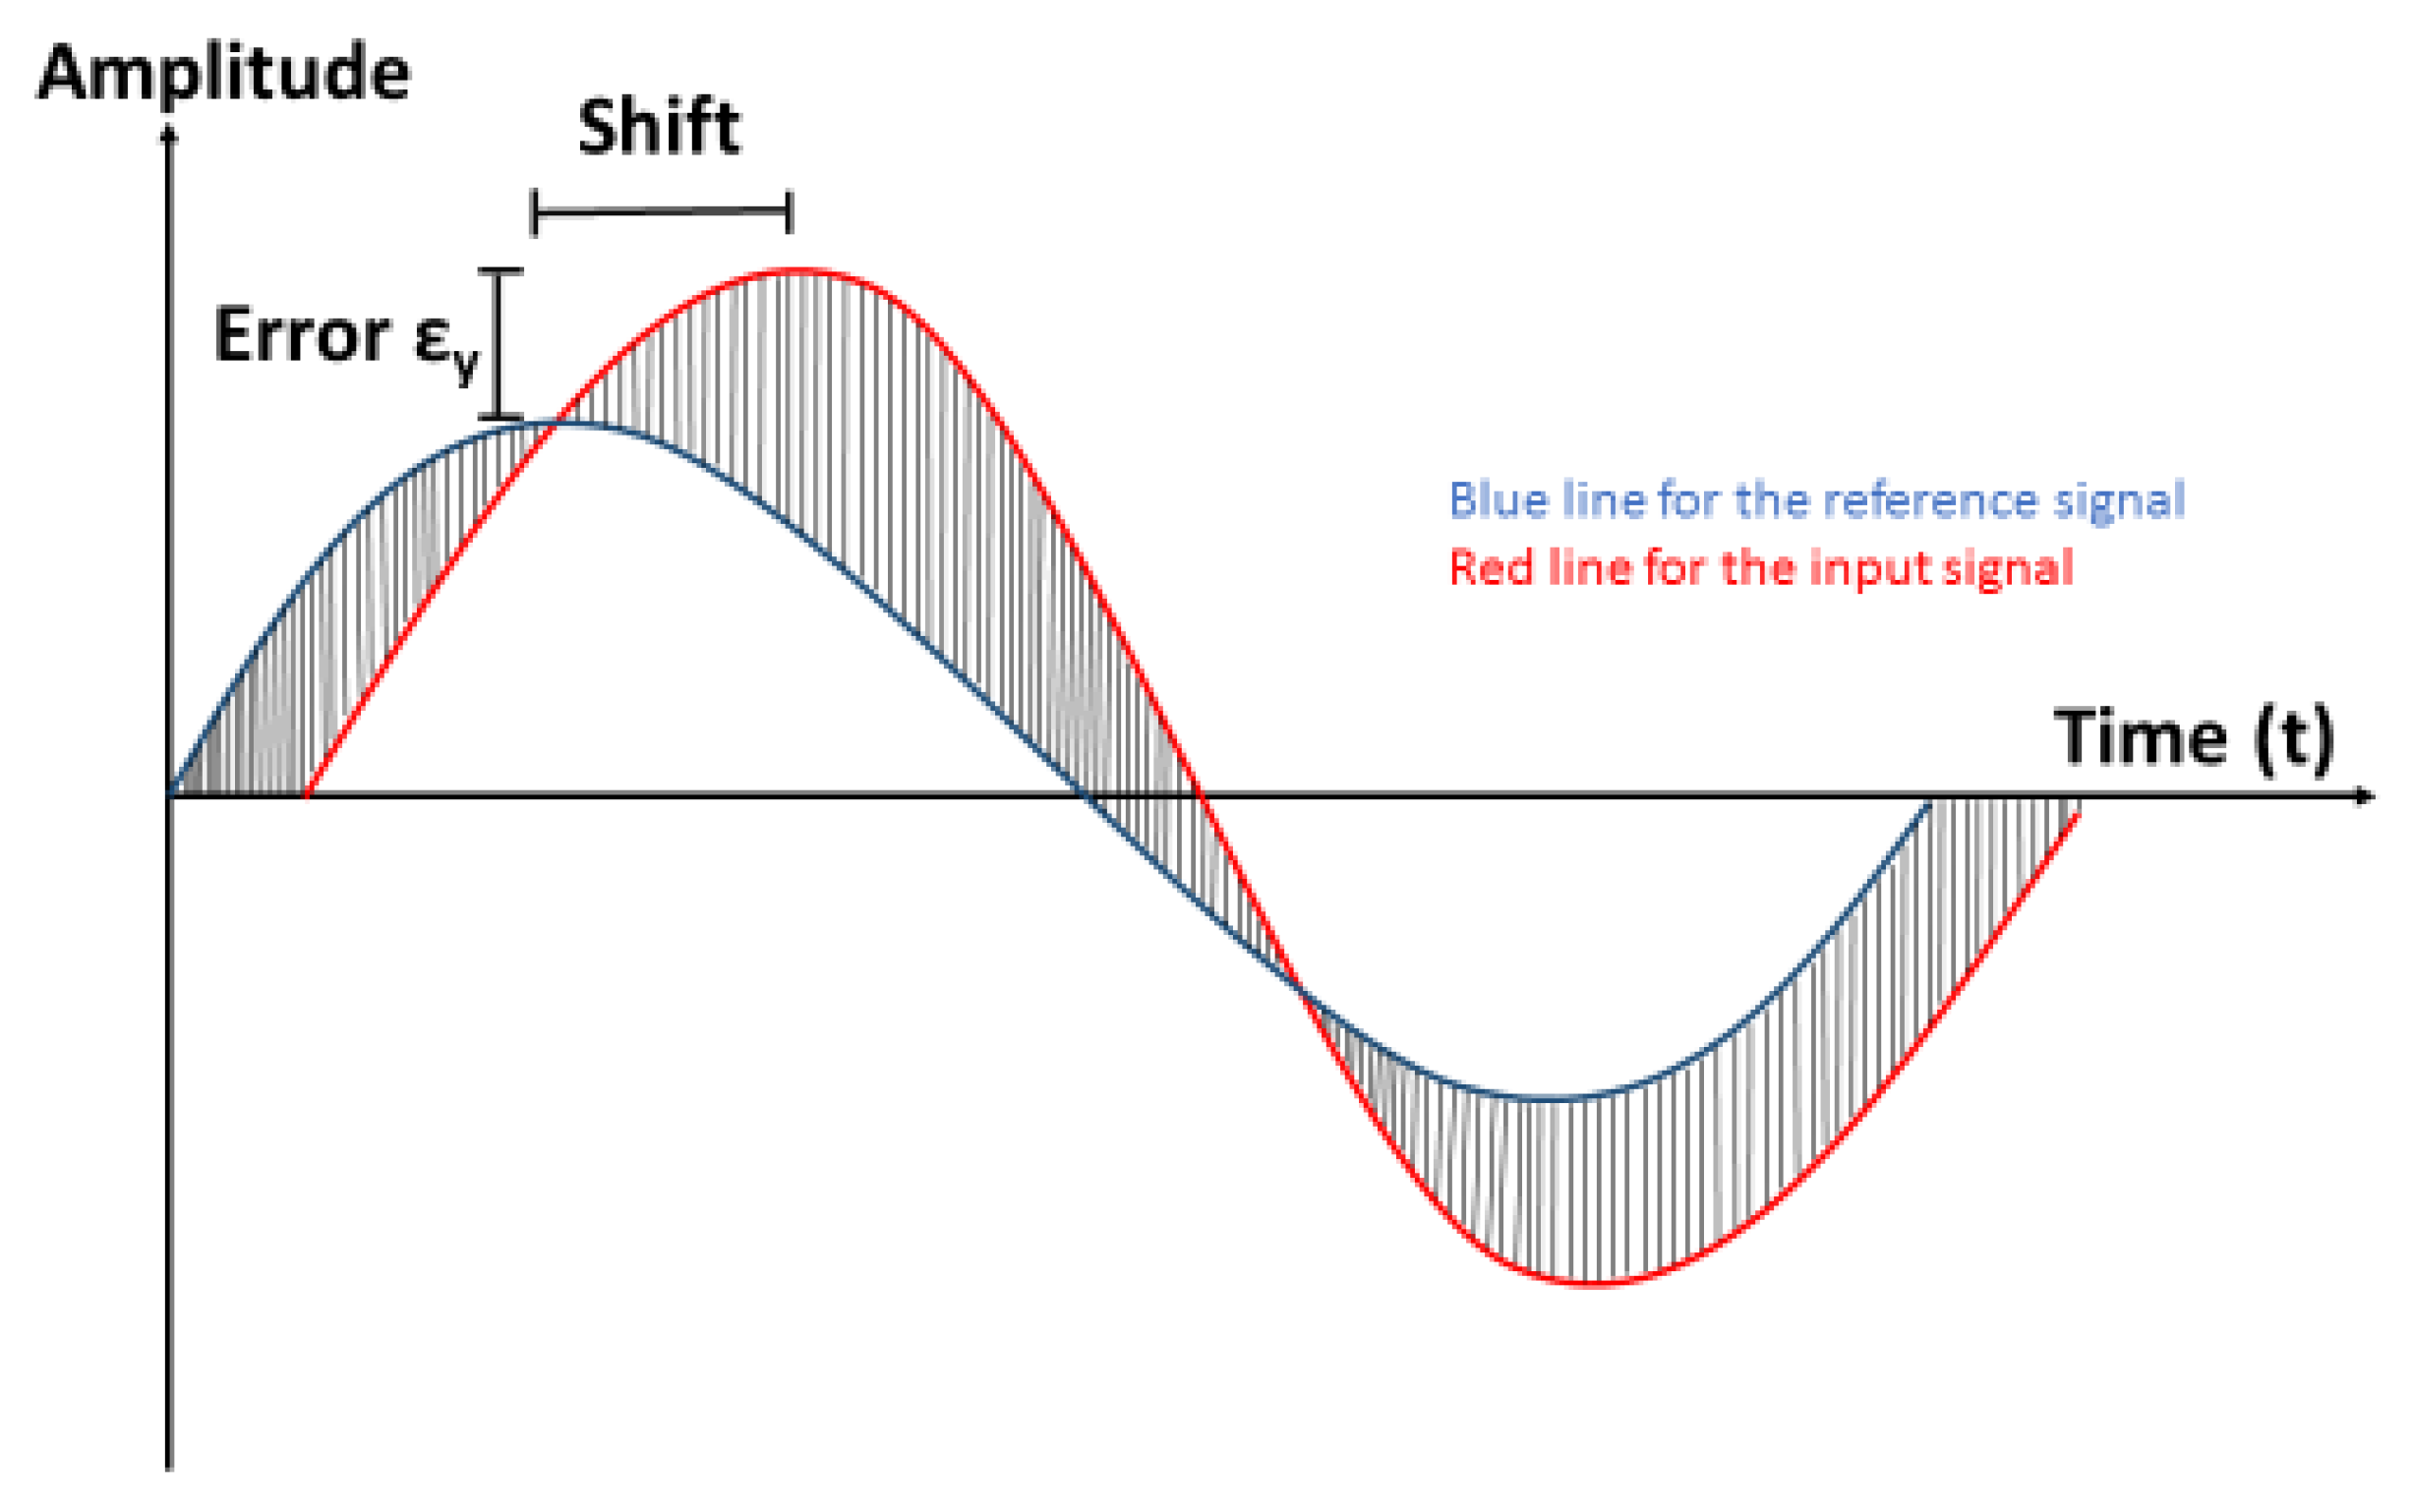
2.5.2. Shift Error
2.5.3. Work Deviation
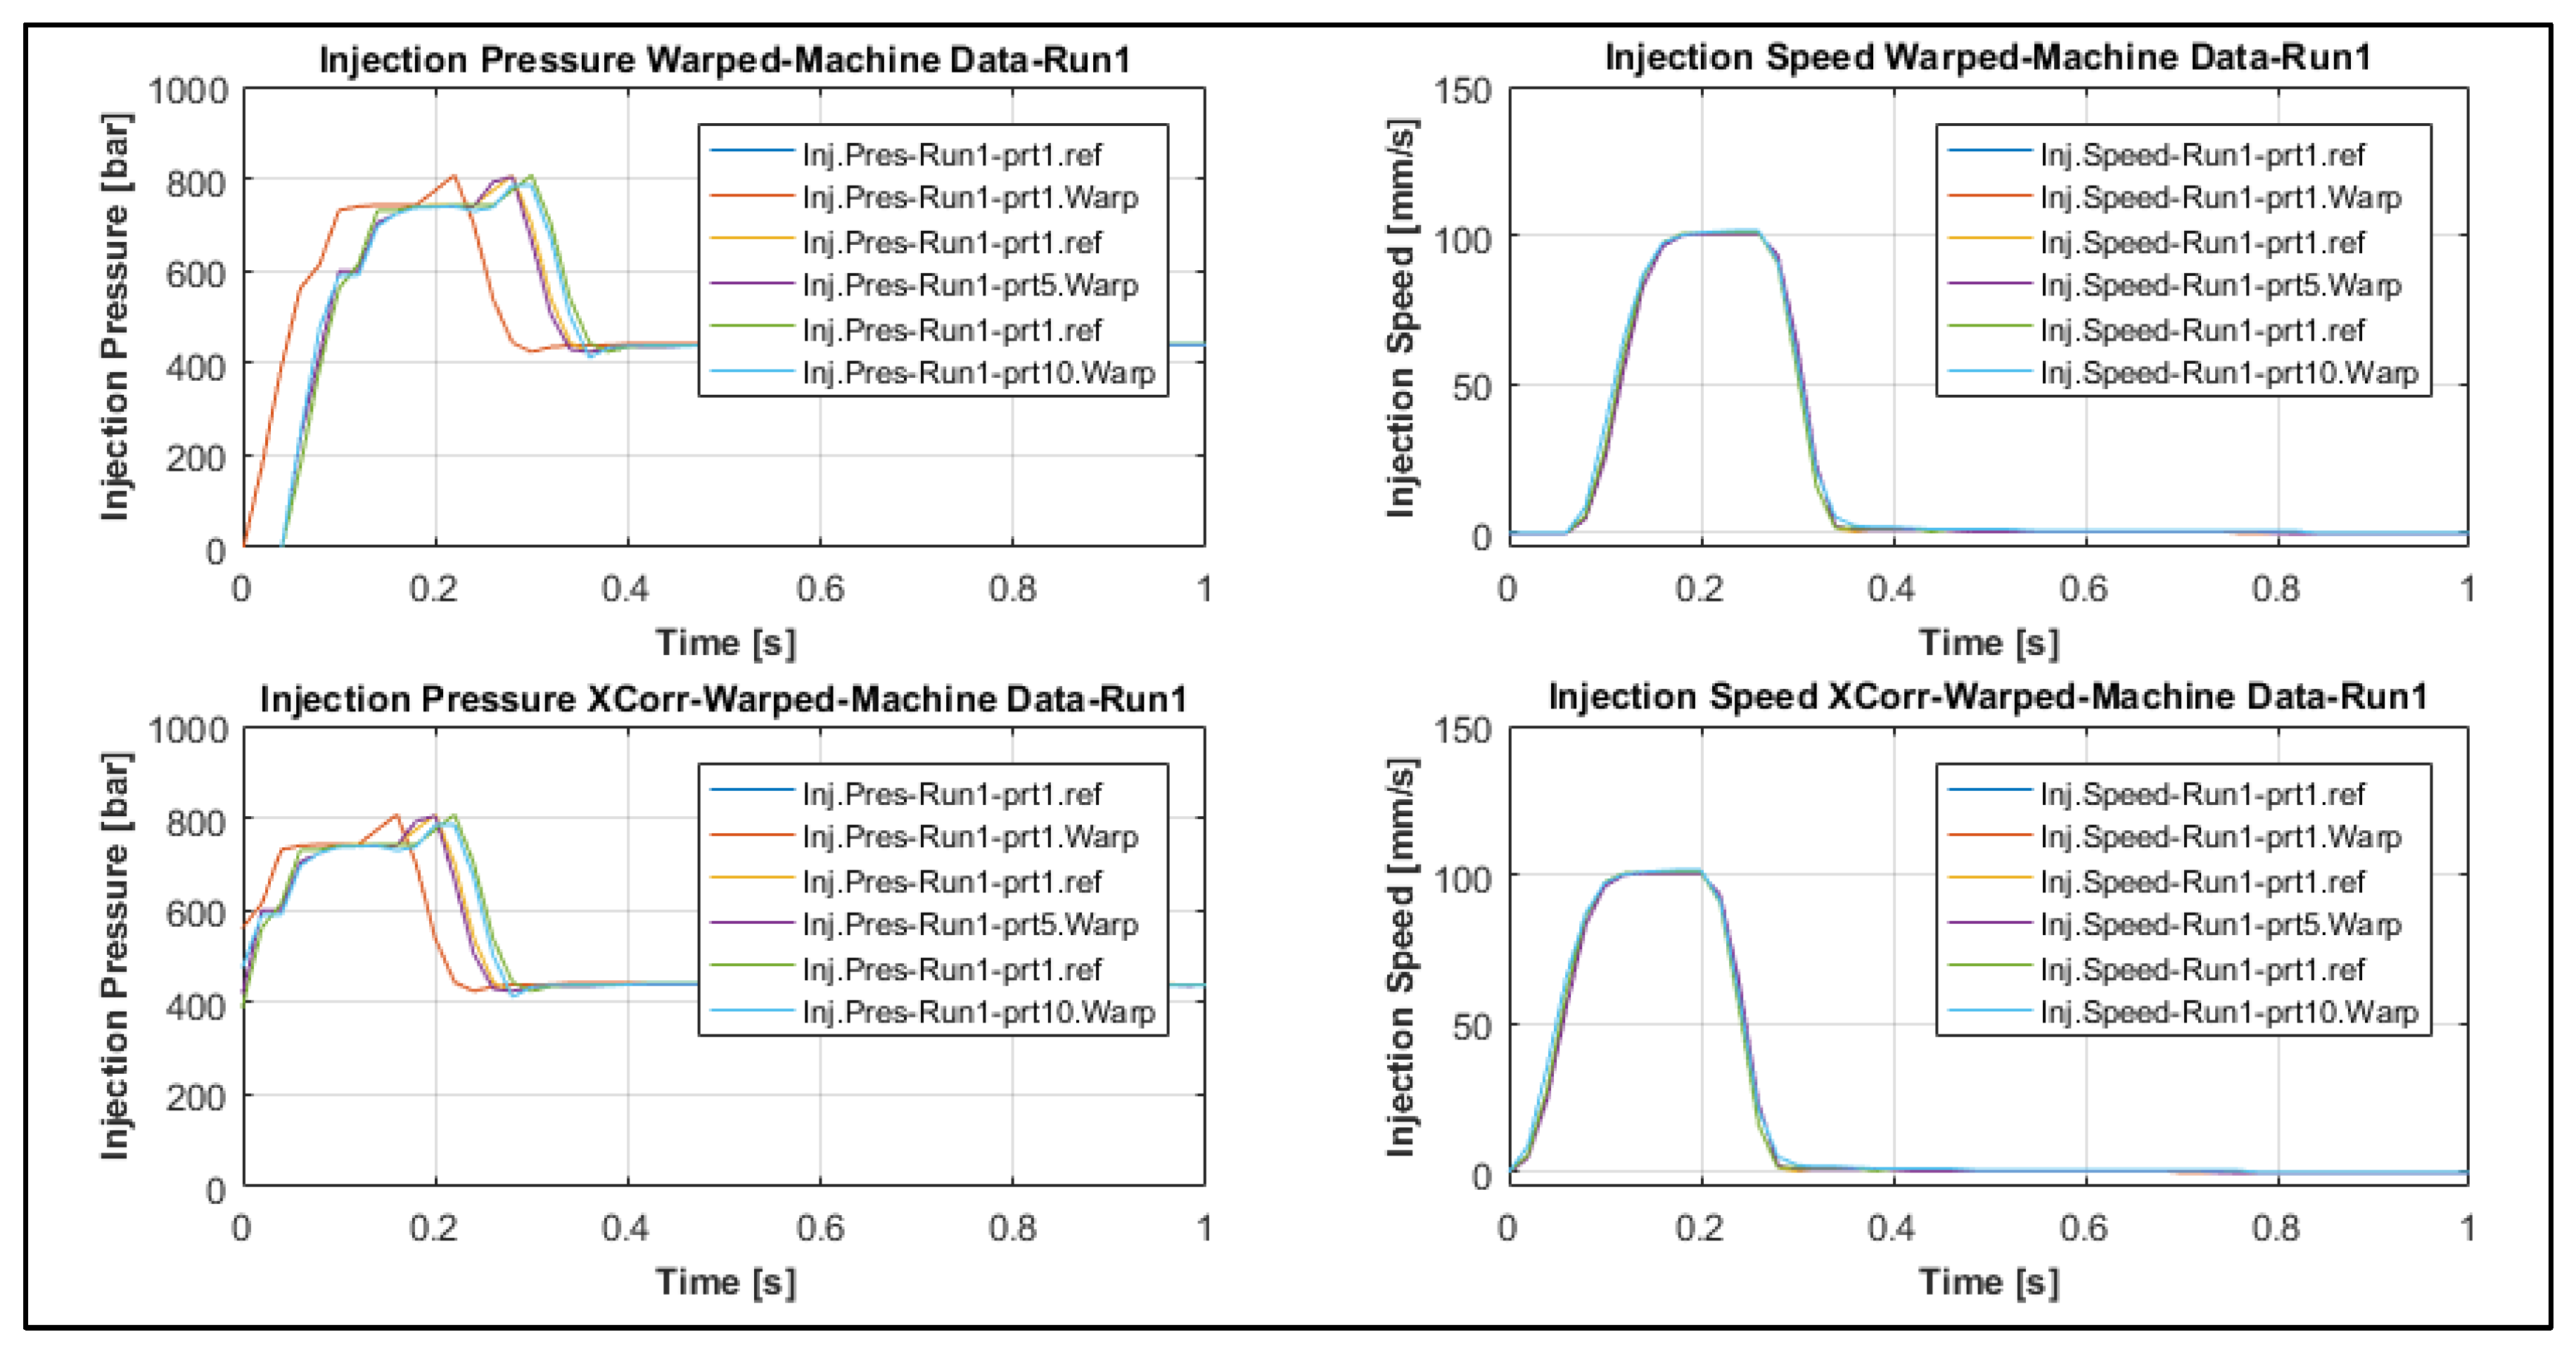
2.5.4. Dynamic Time Warping
2.5.5. Signal Integral
2.5.6. Signal Power
3. Results and Discussion
3.1. Dimensional Measurements and Uncertainty Calculation
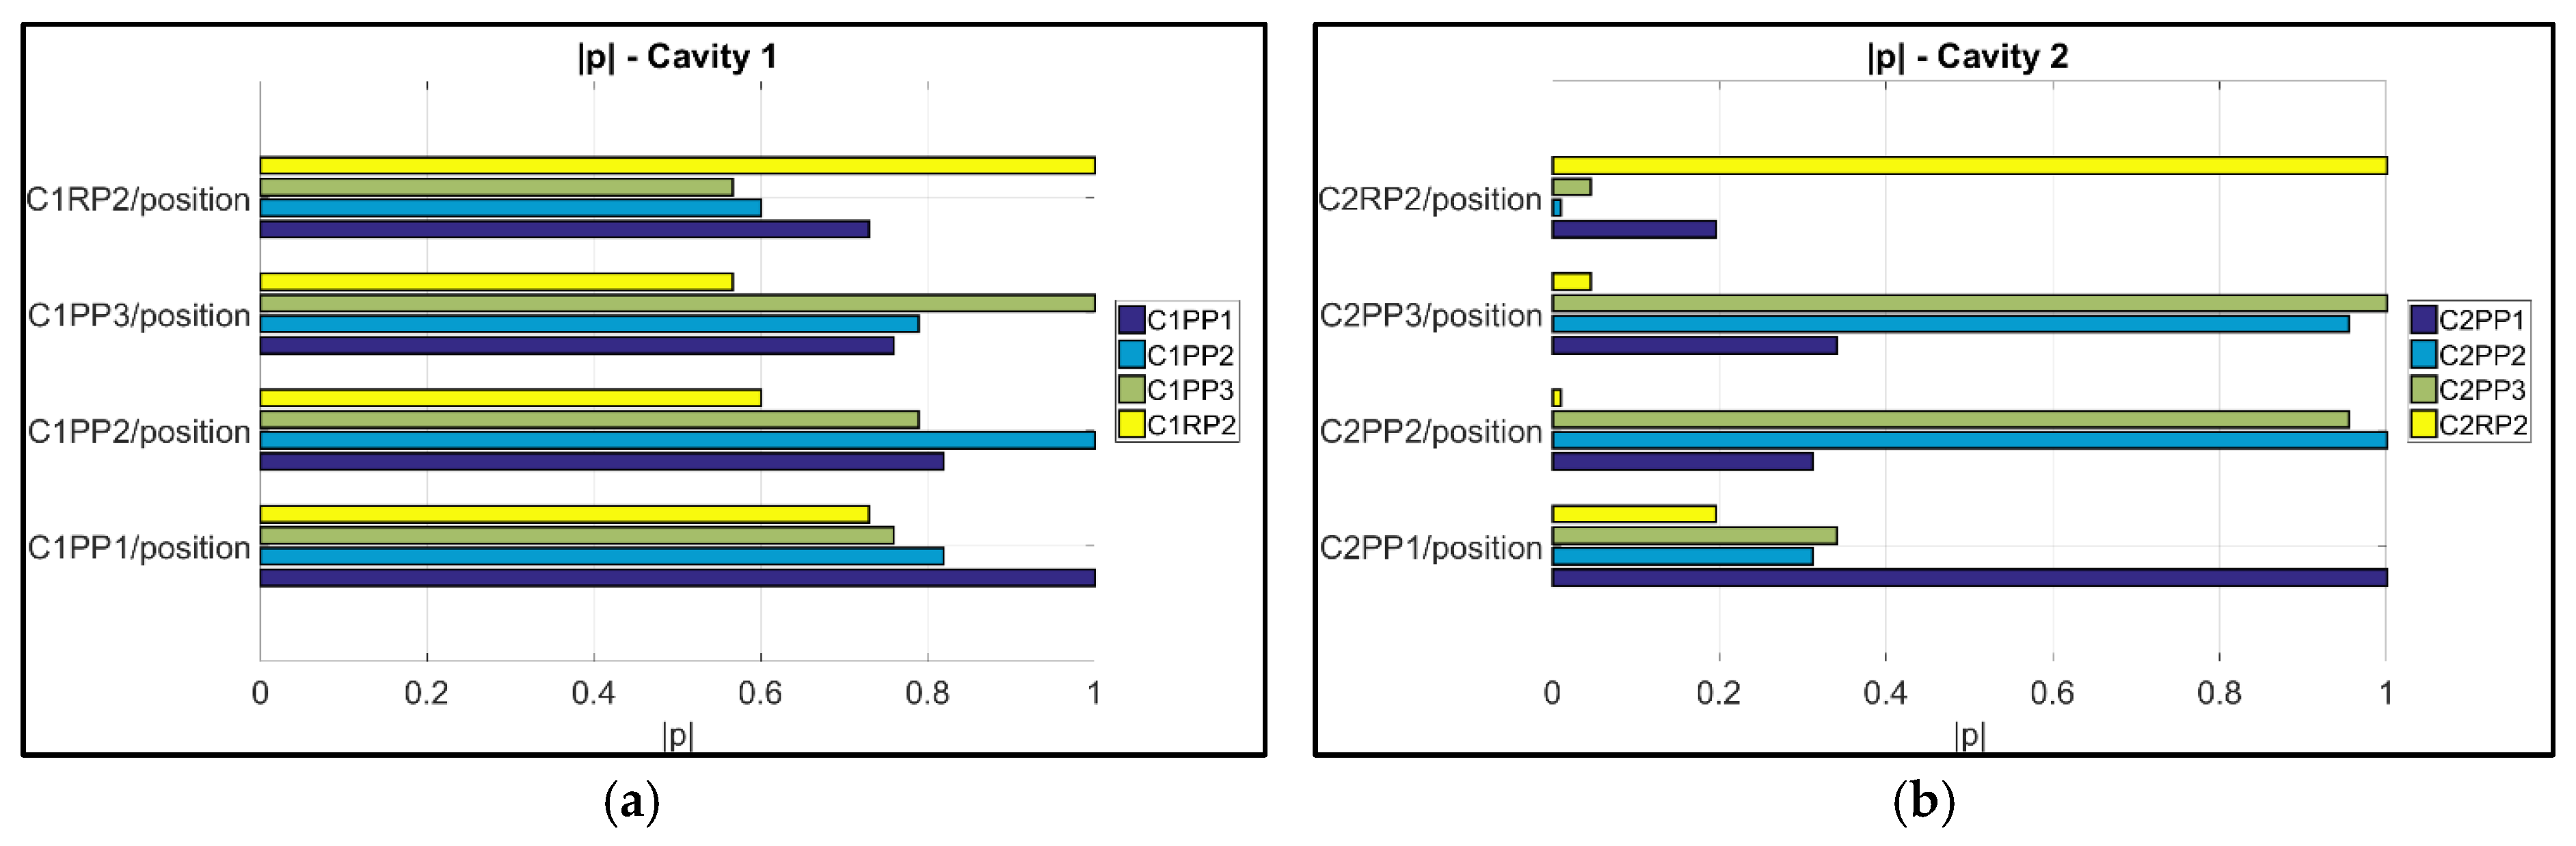
3.2. Product Fingerprint Analysis
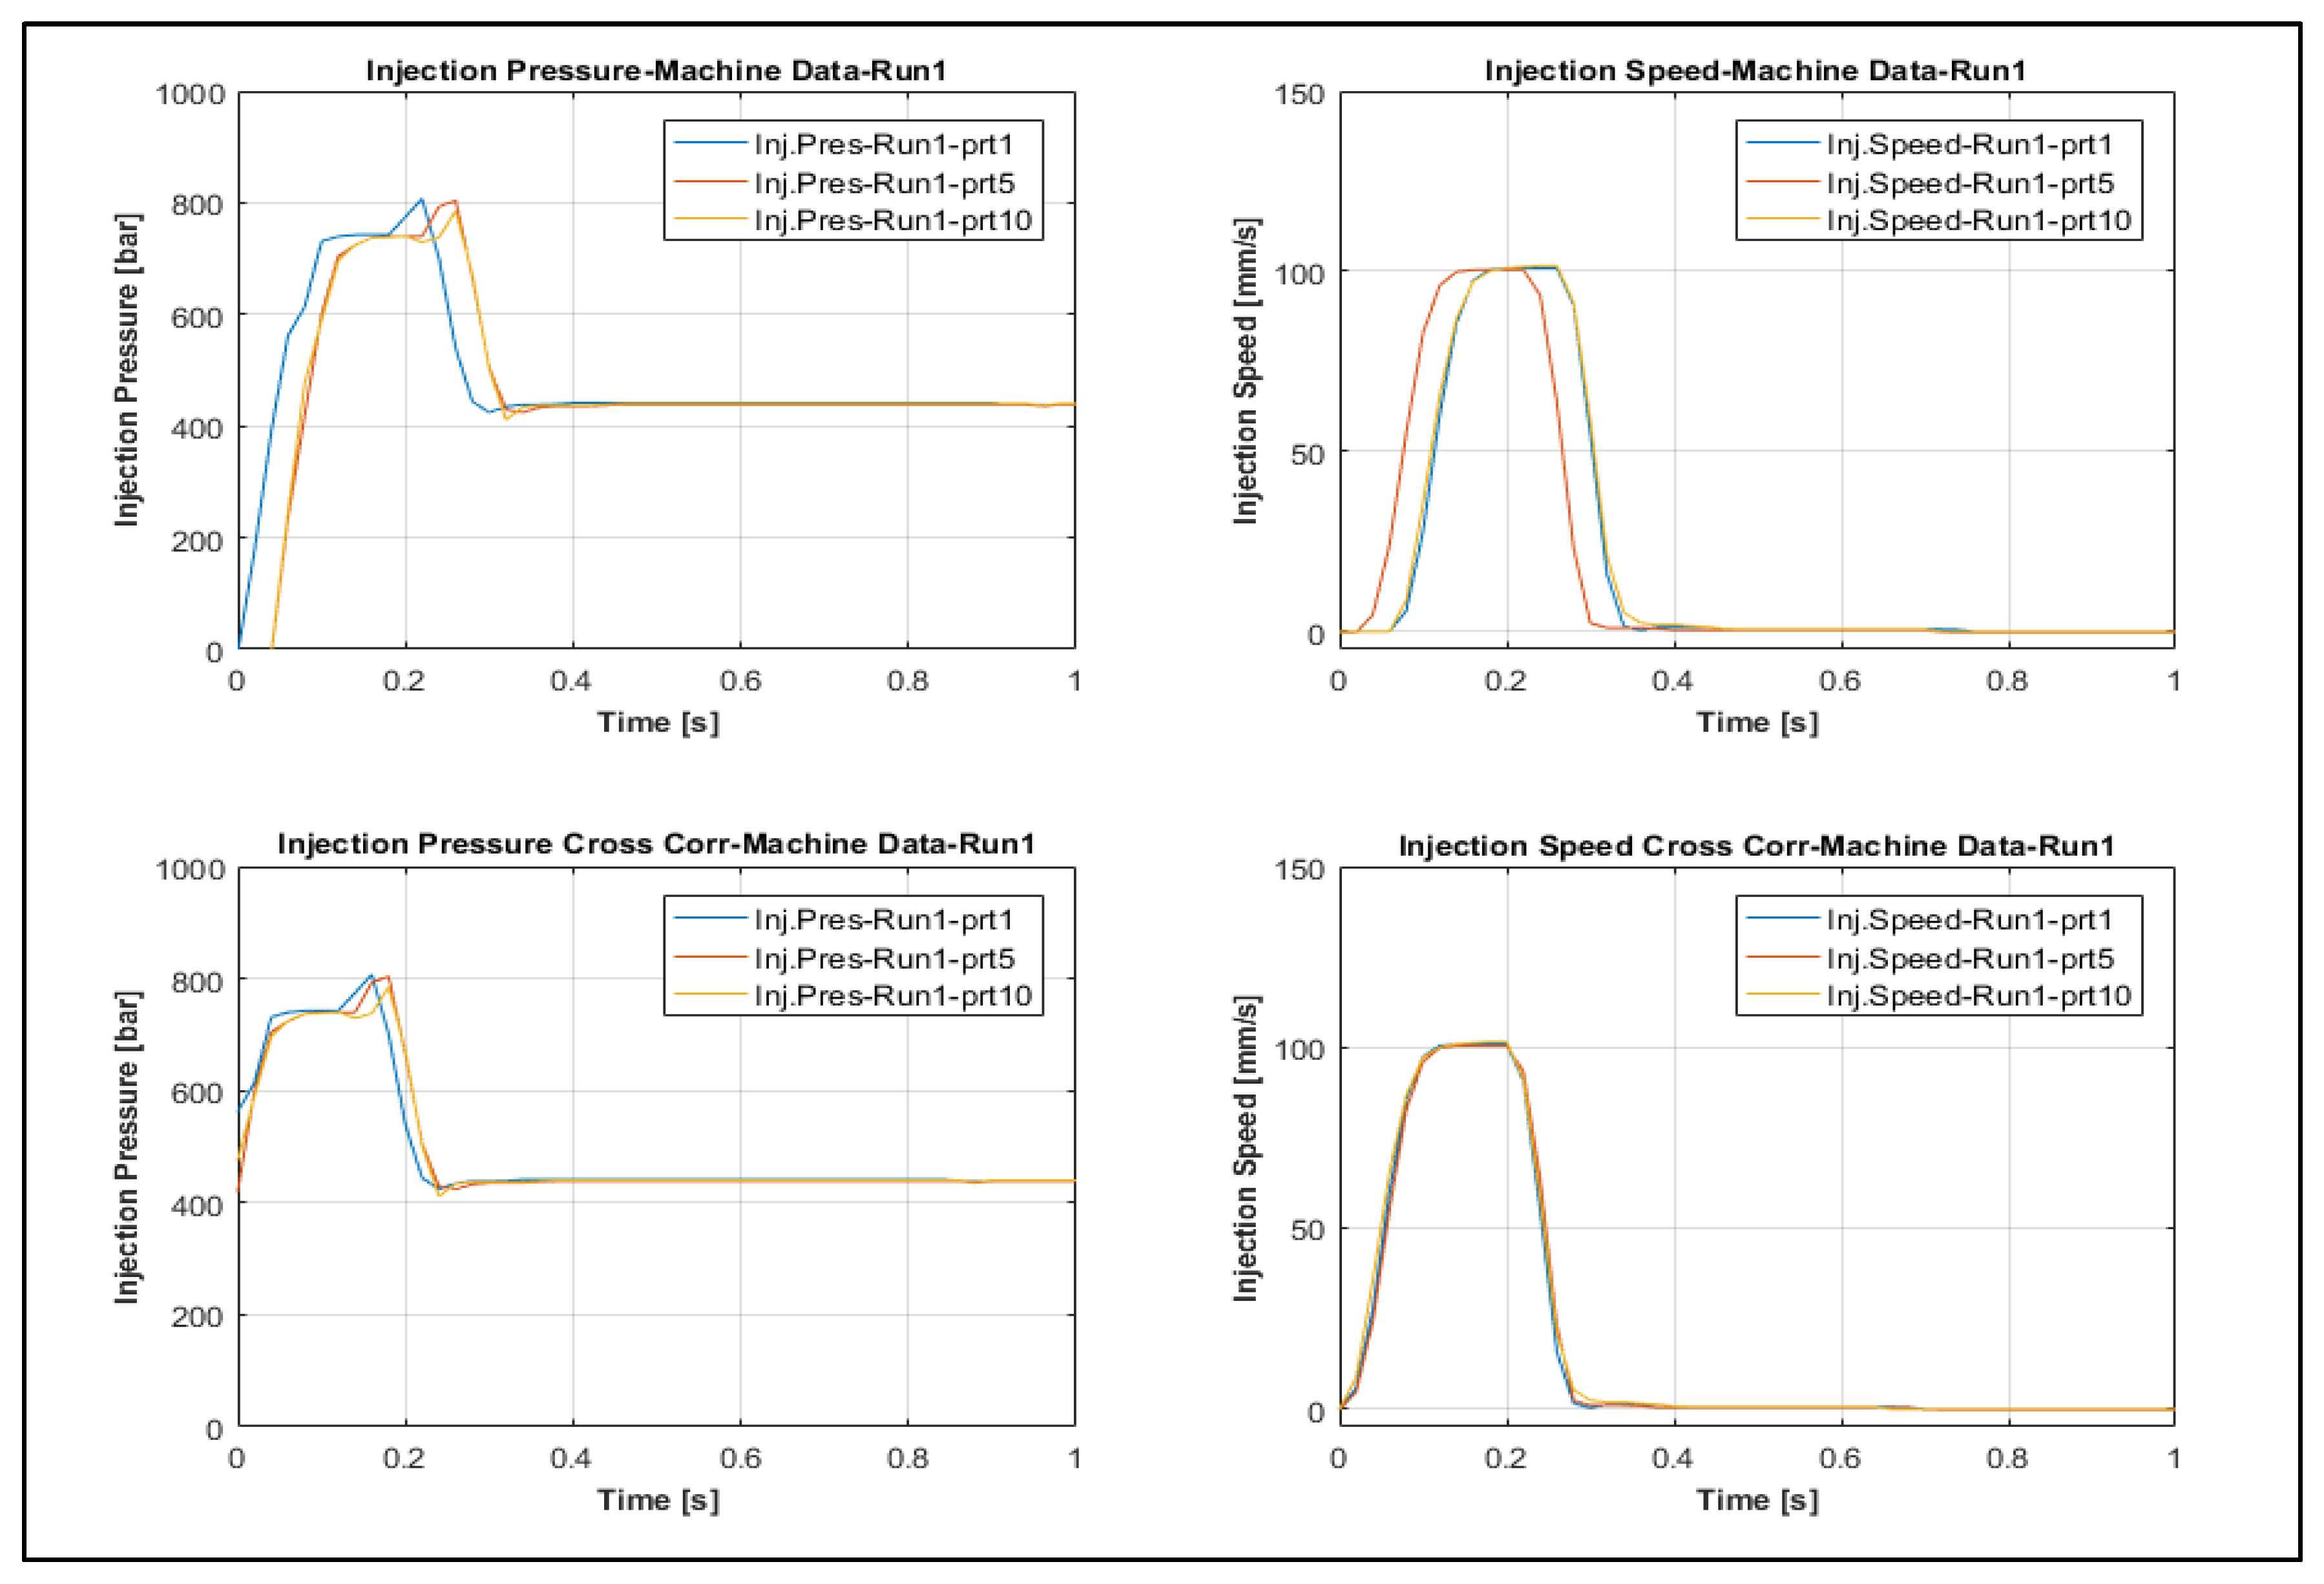
3.3. Process Fingerprint Analysis
- (1)
- The first type is characterized by those indicators which originated from the deviation of both the transient injection pressure and injection speed signals with respect to the reference signals such as error of alignment (ε(t)), integrated squared error (ISE), cross correlation shift error (Shift), and dynamic time warping (WarpDis);
- (2)
- Those indicators where the “signal integral” (Ix) and “signal power” (SPx) were calculated from each signal to extract the information from the signal curve and are subsequently converted into a single value representative of the second type.
3.3.1. Process Fingerprint Based on Indicators of Type 1
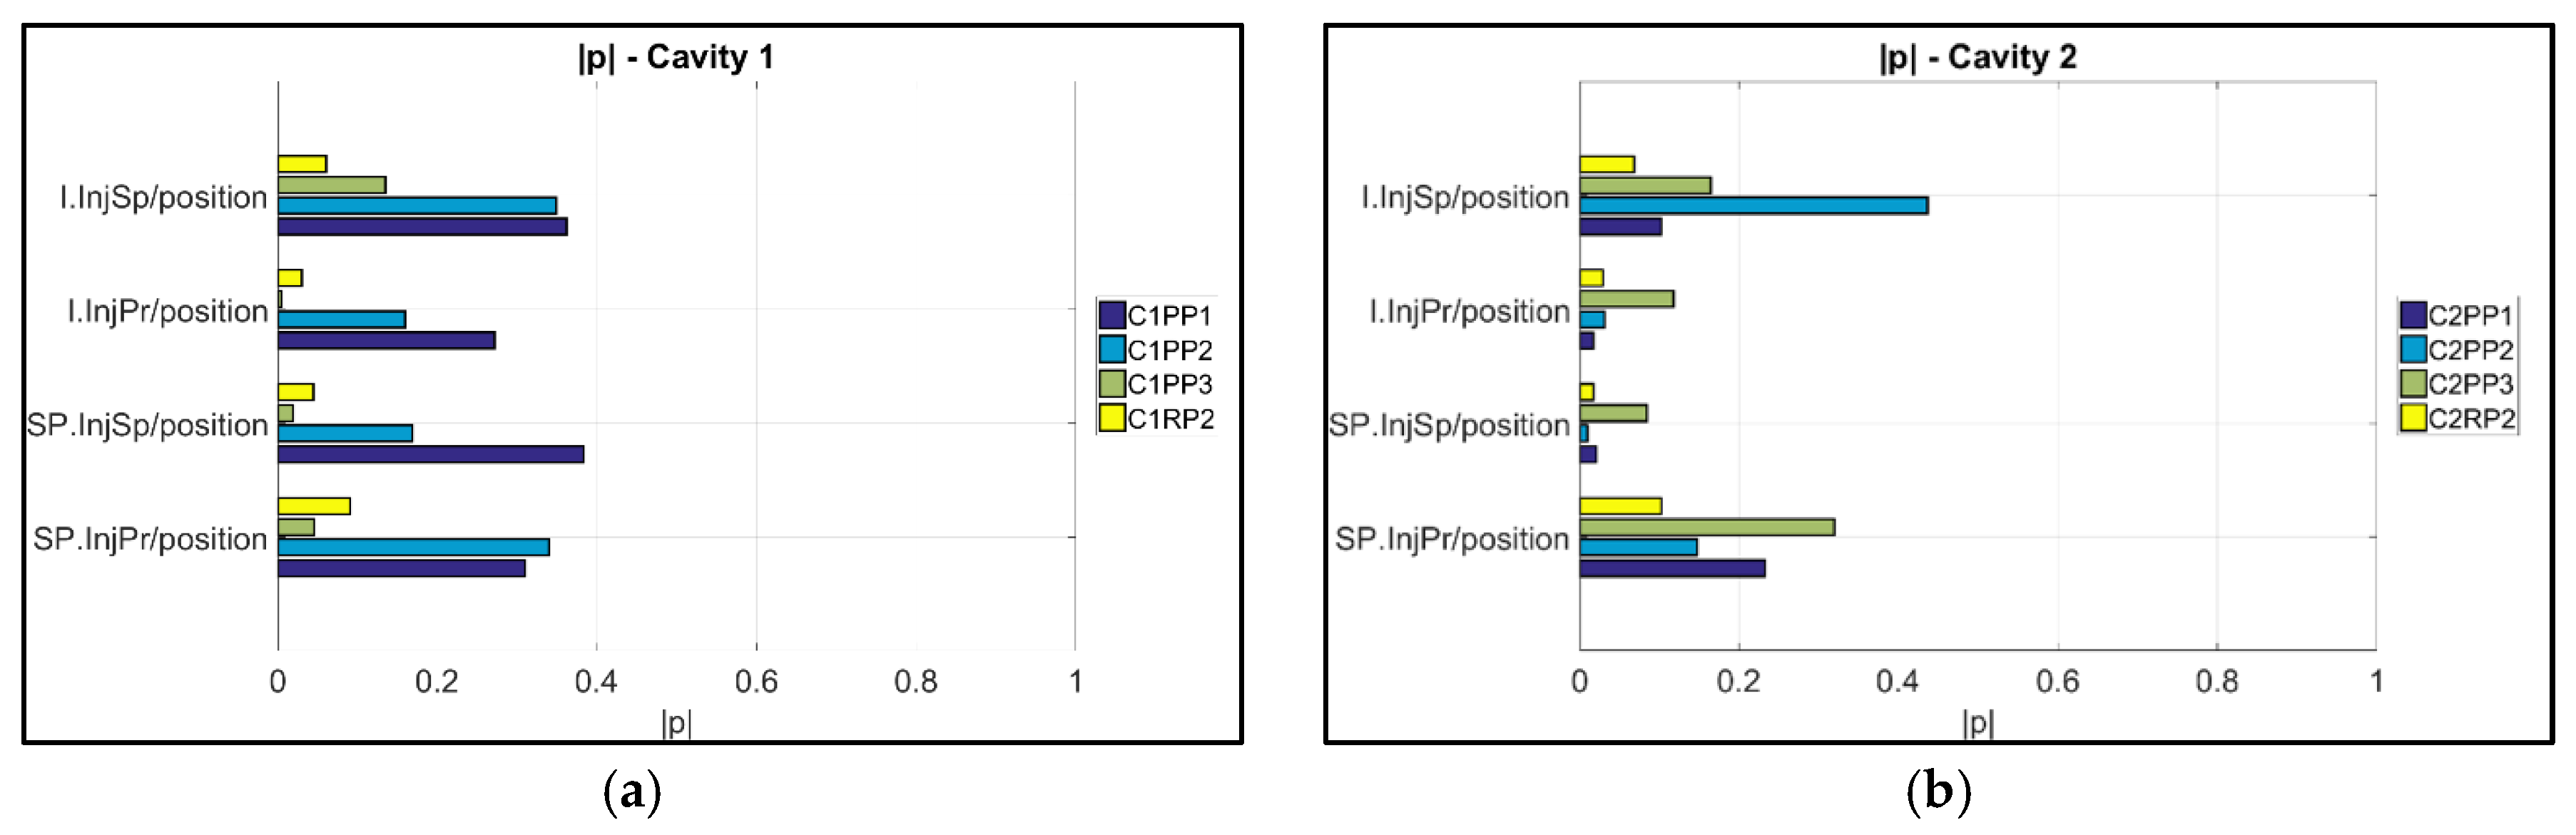
3.3.2. Process Fingerprint Based on Indicators of Type 2
4. Conclusions
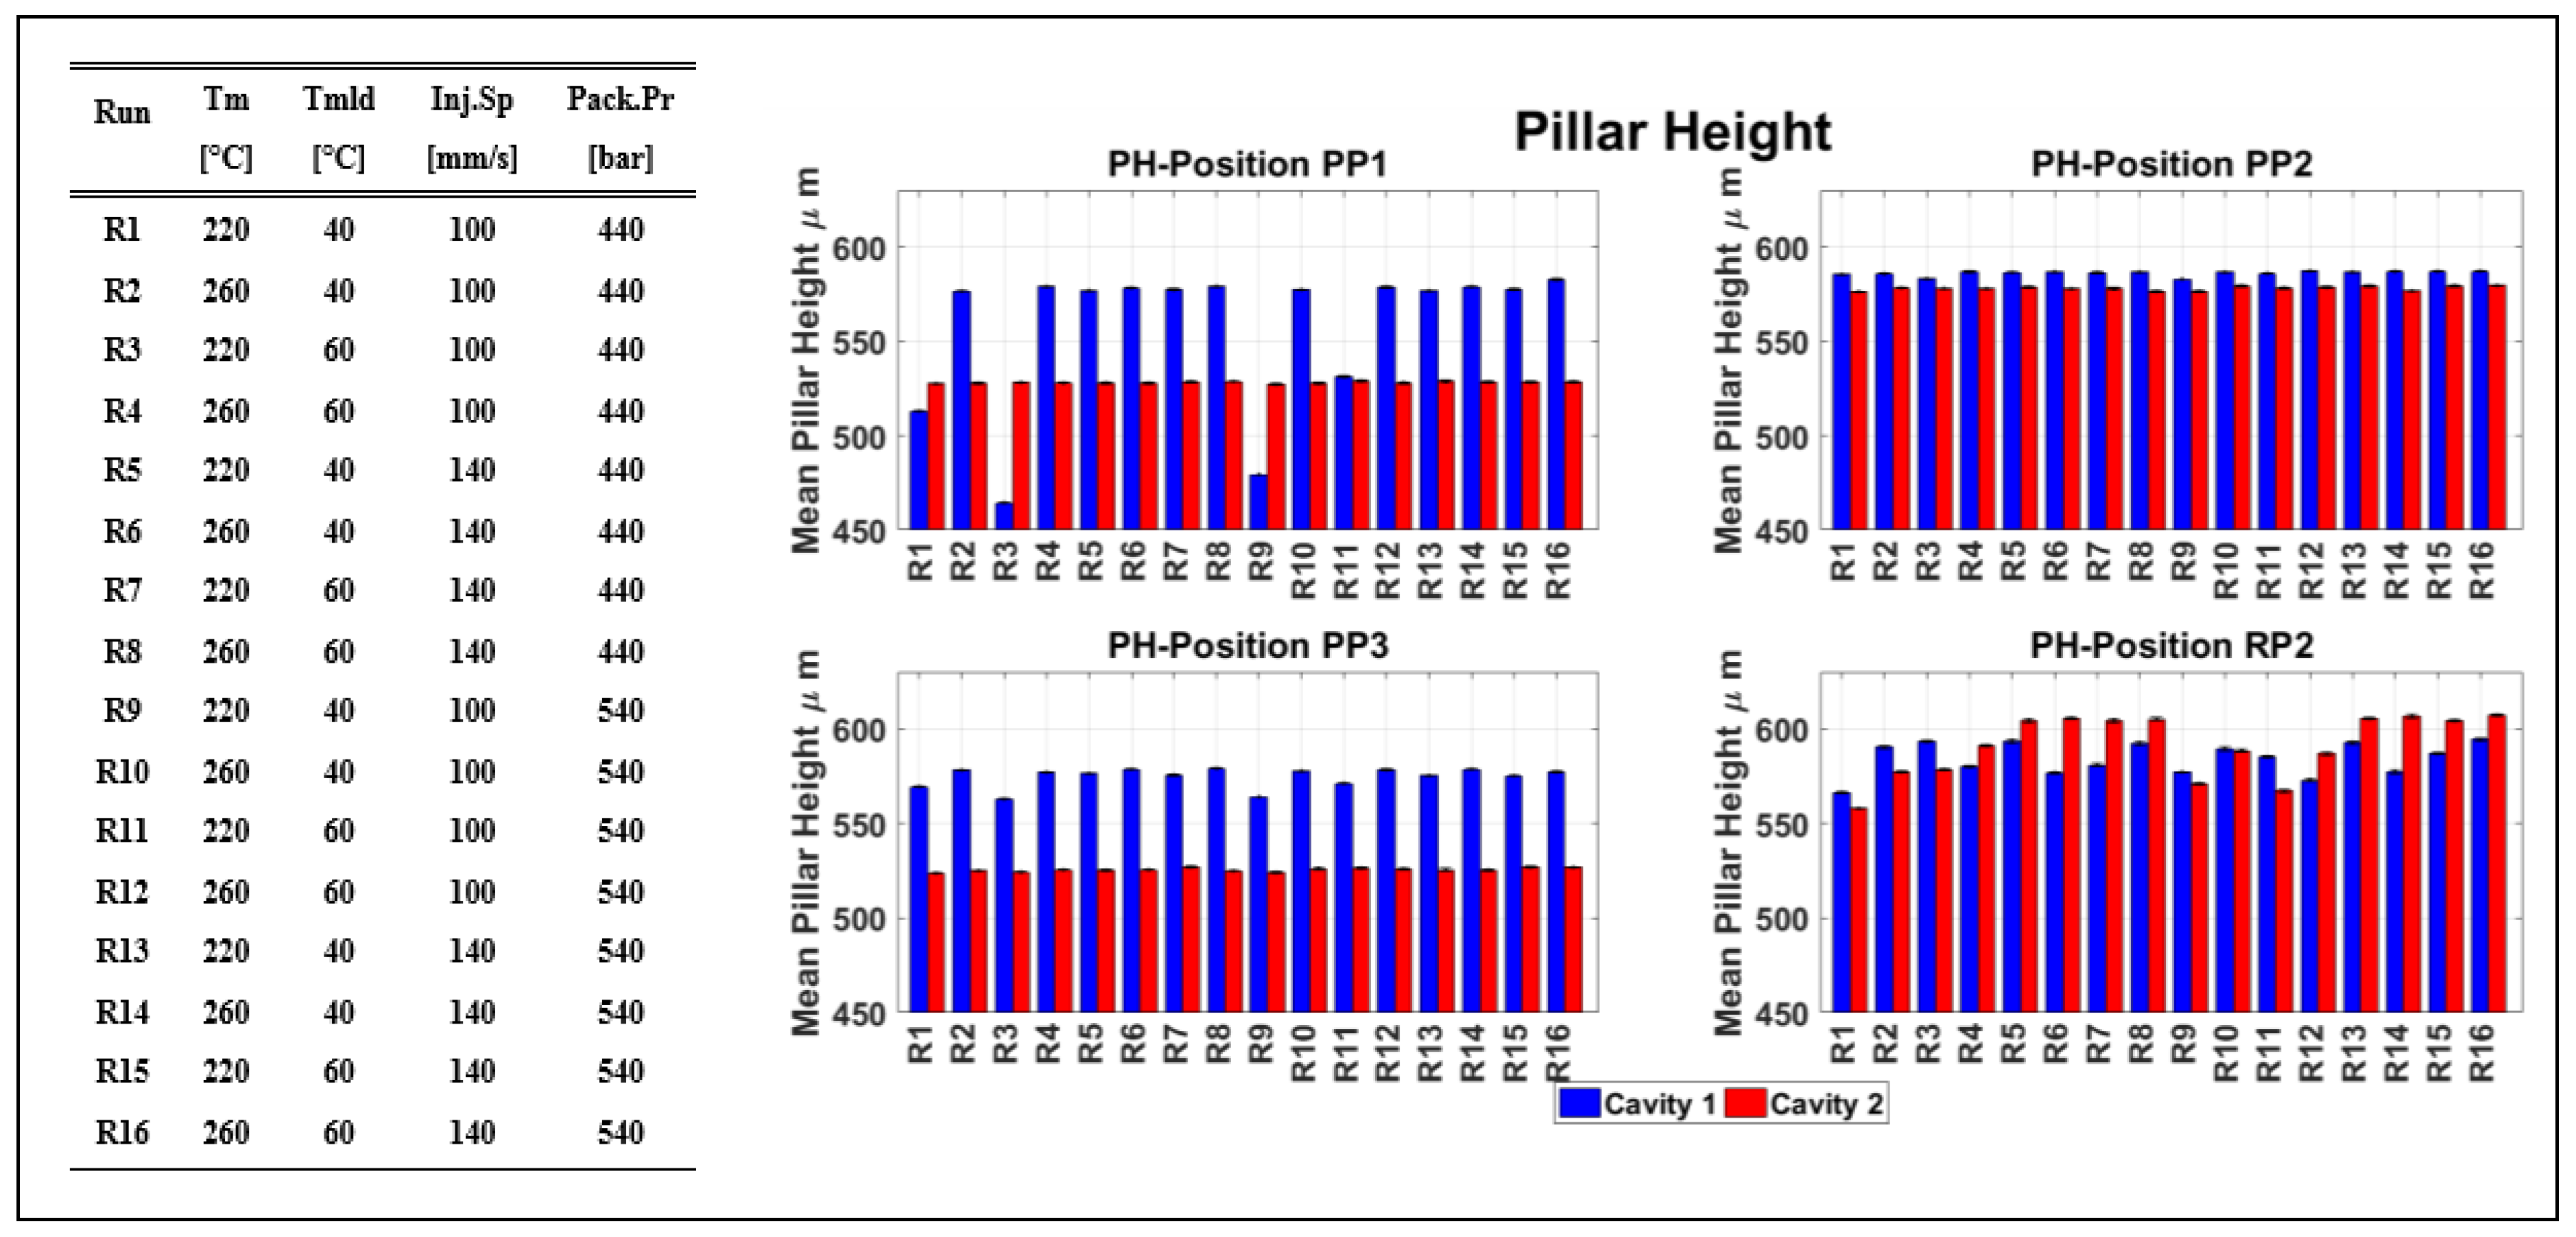
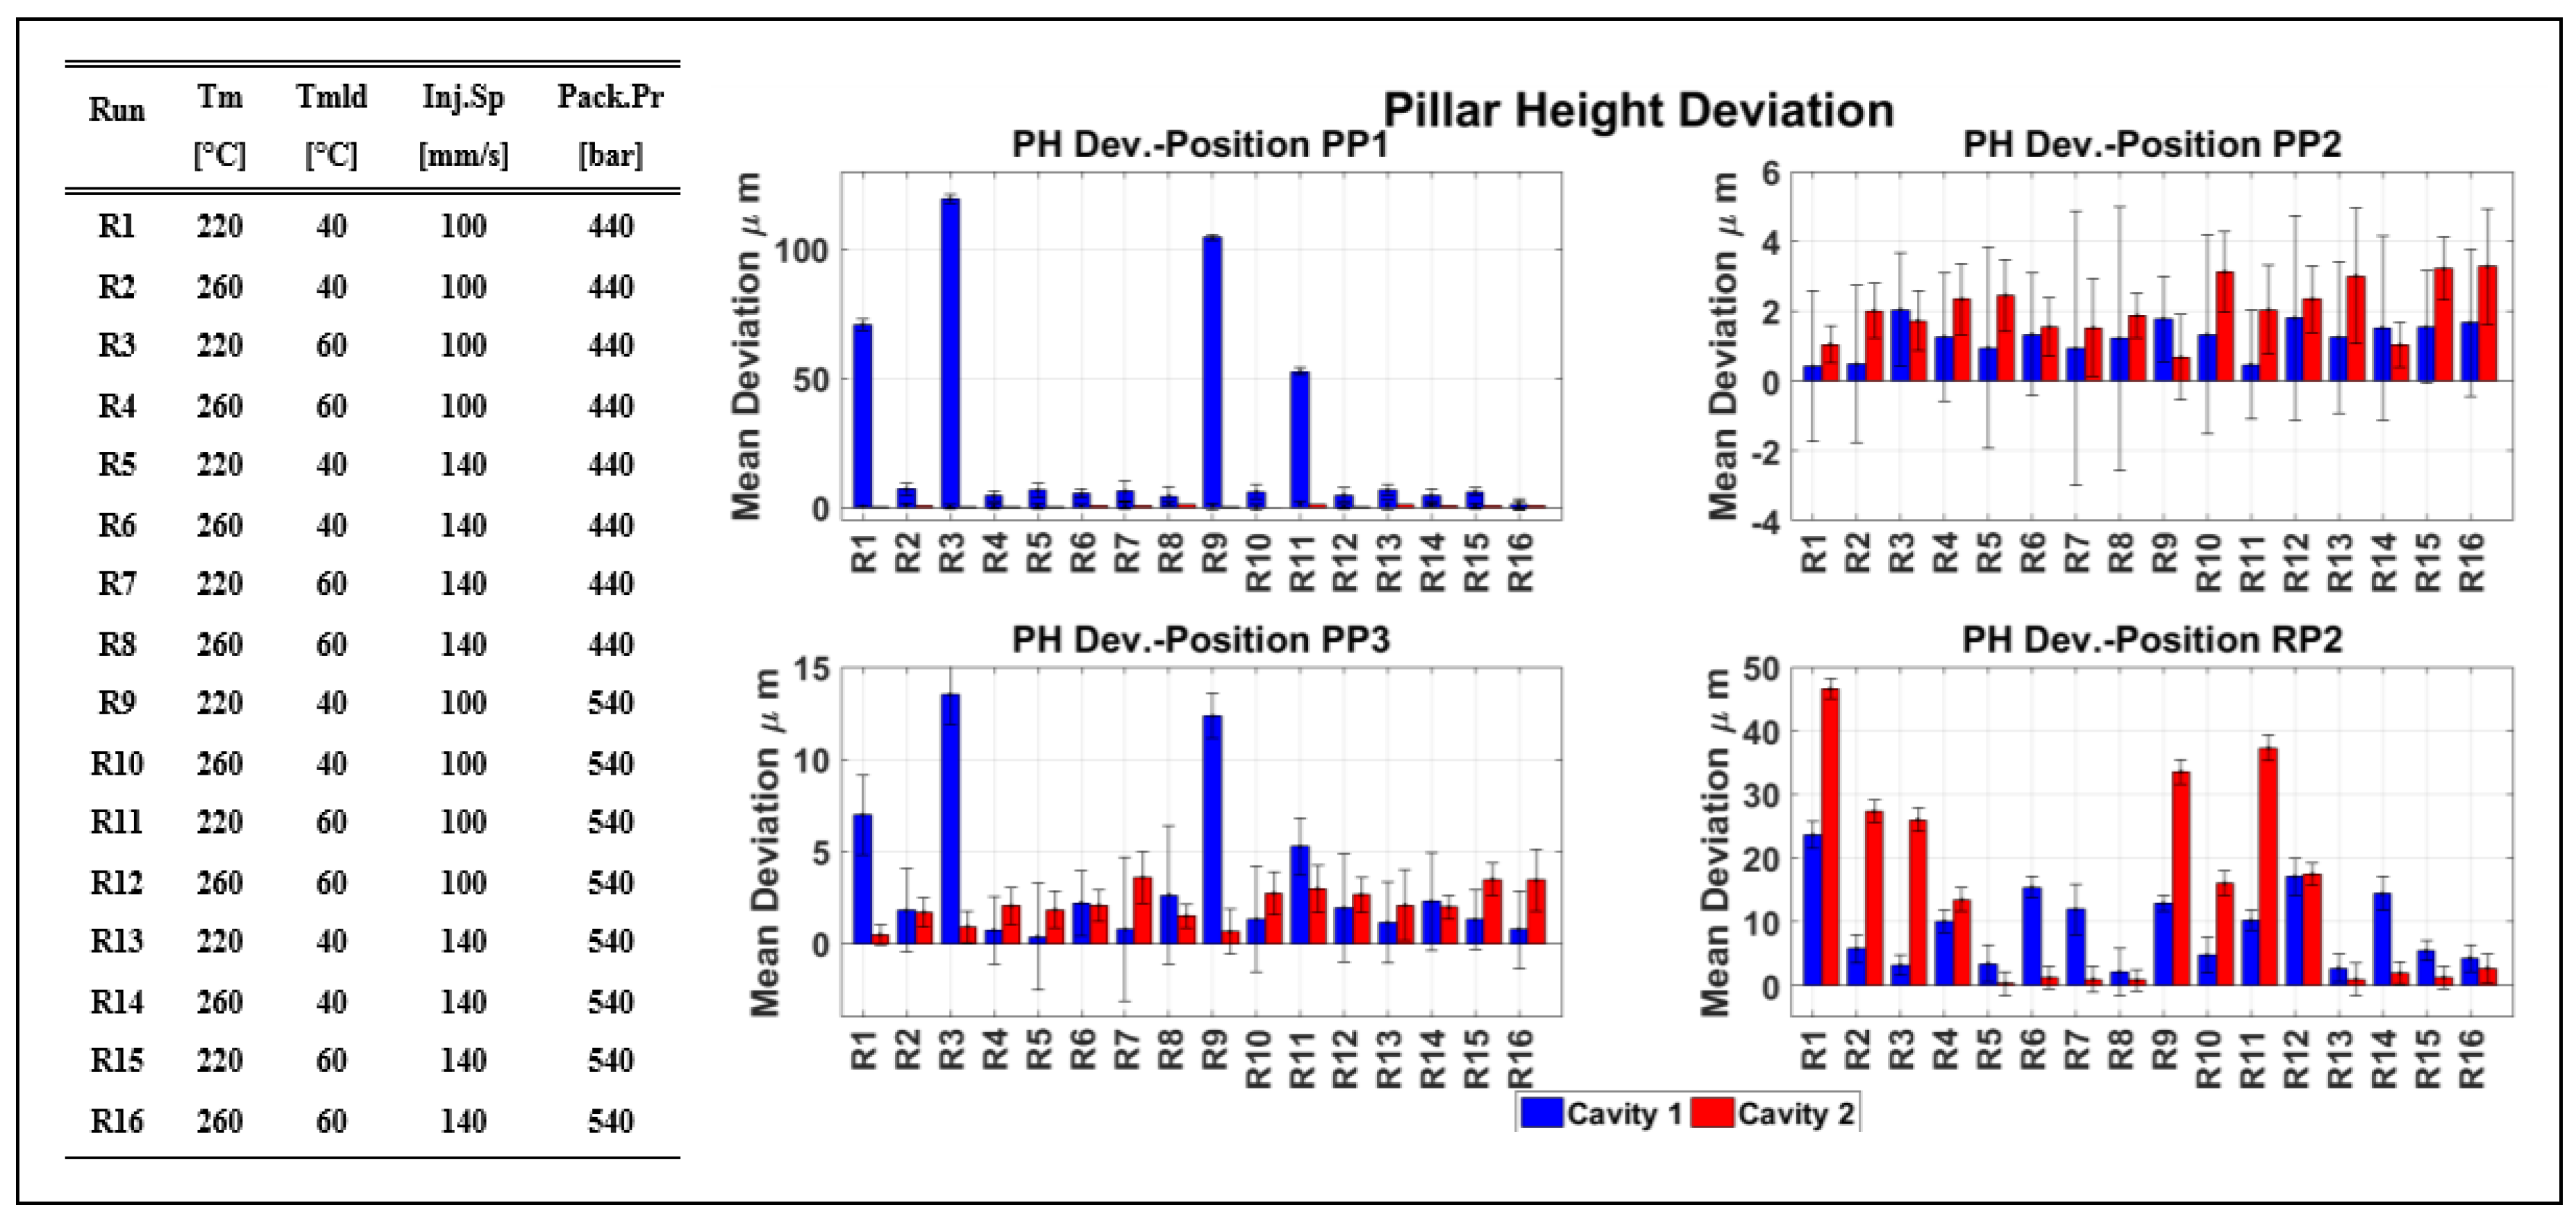
- The variation of the IM process parameters settings has an effect on the manufacturing quality and replication of the molded μ-pillar structured components placed both in the cavities as well as on the runners.
- The variation of the process was used to assess the suitability of μ-pillars in the eight different positions to act as product fingerprint. The analysis was based on their replication quality. A correlation analysis was then used for verification. This track was focused on the μ-pillars positioned on the runners of the molding in positions C1RP2 and C2RP2. For Cavity 1, it can be seen that the dataset position C1RP2 can be used to monitor the quality of the μ-features on the part, especially for position C1PP1 (near the gate) with the highest correlation to originate to the combination is C1PP1/C1RP2 (|| = 0.73) (i.e., near the gate/on the runner), followed by C1PP2/C1RP2 (|| = 0.60) and C1PP3/C1RP2 (|| = 0.57) (i.e., far from the gate/on the runner). Instead, the μ-pillars on the runner of Cavity 2 (C2RP2), did not present strong correlations with respect to the measurands of the features in the cavity, indicating that these μ-pillars are not suitable to serve as a “product fingerprint”.
- Two different types of process fingerprint candidates were assessed for their suitability to act as quality indicators of the micro structures on the molded parts. Results show that only a small number of process fingerprint candidates from the category of deviation-based process fingerprints (i.e., Type 1) were considered suitable for process monitoring when considered together with the proper measurand. From the Type 2 indicators in fact, no candidate presented a strong correlation with the quality of a measurand. This indicates that the integral and signal power of machine injection pressure and speed signals could not be used for the monitoring of the overall part quality in the current application.
- Finally, it can be concluded that the deviation of the quality of the part’s μ-pillars can be monitored by monitoring the deviation of the “Workdev-InjPr”, “ISE-InjPr”, “ISE-InjSp”, and “WarpDis-InjPr” process fingerprints. These fingerprints present similar trends with measurands for most of the treatments in the investigated process window.
Author Contributions
Funding
Acknowledgments
Conflicts of Interest
References
- Alting, L.; Kimura, F.; Hansen, H.N.; Bissacco, G. Micro Engineering. CIRP Ann. Manuf. Technol. 2003, 52, 635–657. [Google Scholar] [CrossRef]
- Brousseau, E.B.; Dimov, S.S.; Pham, D.T. Some recent advances in multi-material micro- and nano-manufacturing. Int. J. Adv. Manuf. Technol. 2010, 47, 161–180. [Google Scholar] [CrossRef]
- Wang, X.; Gu, J.; Shen, C.; Wang, X. Warpage optimization with dynamic injection molding technology and sequential optimization method. Int. J. Adv. Manuf. Technol. 2015, 78, 177–187. [Google Scholar] [CrossRef]
- Theilade, U.A.; Hansen, H.N. Surface microstructure replication in injection molding. Int. J. Adv. Manuf. Technol. 2006, 33, 157–166. [Google Scholar] [CrossRef]
- Giannekas, N.; Tosello, G.; Zhang, Y. A study on replication and quality correlation of on-part and on-runner polymer injection molded micro features. In Proceedings of the World Congress on Micro and Nano Manufacturing (WCMNM), Kaohsiung, Taiwan, 27–30 March 2017; pp. 365–368. [Google Scholar]
- Marhöfer, D.M.; Tosello, G.; Islam, A.; Hansen, H.N. Gate Design in Injection Molding of Microfluidic Compoments Using Process Simulations. J. Micro Nano-Manuf. 2016, 4, 025001. [Google Scholar] [CrossRef]
- Tosello, G.; Gava, A.; Hansen, H.N.; Lucchetta, G. Study of process parameters effect on the filling phase of micro-injection moulding using weld lines as flow markers. Int. J. Adv. Manuf. Technol. 2010, 47, 81–97. [Google Scholar] [CrossRef]
- Calaon, M. Process Chain Validation in Micro and Nano Replication. Ph.D. Thesis, Technical University of Denmark, Kongens Lyngby, Denmark, 2014. [Google Scholar]
- Gao, R.X.; Tang, X.; Gordon, G.; Kazmer, D.O. Online product quality monitoring through in-process measurement. CIRP Ann. Manuf. Technol. 2014, 63, 493–496. [Google Scholar] [CrossRef]
- Kusić, D.; Kek, T.; Slabe, J.M.; Svečko, R.; Grum, J. The impact of process parameters on test specimen deviations and their correlation with AE signals captured during the injection moulding cycle. Polym. Test. 2013, 32, 583–593. [Google Scholar] [CrossRef]
- Wong, H.Y.; Fung, K.T.; Gao, F. Development of a transducer for in-line and through cycle monitoring of key process and quality variables in injection molding. Sens. Actuators A 2008, 141, 712–722. [Google Scholar] [CrossRef]
- Kazmer, D.O.; Gordon, G.W.; Mendible, G.A.; Johnston, S.P.; Tang, X.; Fan, Z.; Gao, R.X. A Multivariate Sensor for Intelligent Polymer Processing. IEEE/ASME Trans. Mechatron. 2014, 1, 1–9. [Google Scholar] [CrossRef]
- Mendibil, X.; Llanos, I.; Urreta, H.; Quintana, I. In process quality control on micro-injection moulding: The role of sensor location. Int. J. Adv. Manuf. Technol. 2017, 89, 3429–3438. [Google Scholar] [CrossRef]
- Chen, Z.; Turng, L.-S.; Wang, K.-K. Adaptive Online Quality Control for Injection Molding by Monitoring and Controling Mold Separation. Polym. Eng. Sci. 2006, 46, 569–580. [Google Scholar] [CrossRef]
- Johnston, S.; Mccready, C.; Hazen, D.; Vanderwalker, D.; Kazmer, D. On-Line Multivariate Optimization of Injection Molding. Polym. Eng. Sci. 2015, 55, 1–8. [Google Scholar] [CrossRef]
- Yang, Y.; Yang, B.; Zhu, S.; Chen, X. Online quality optimization of the injection molding process via digital image processing and model-free optimization. J. Mater. Process. Technol. 2015, 226, 85–98. [Google Scholar] [CrossRef]
- Ozcelik, B.; Erzurumlu, T. Comparison of the warpage optimization in the plastic injection molding using ANOVA, neural network model and genetic algorithm. J. Mater. Process. Technol. 2006, 171, 437–445. [Google Scholar] [CrossRef]
- Liu, C.; Manzione, L.T. Process Studies in Precision Injection Moulding I: Process Parameters and Precision. Polym. Eng. Sci. 1996, 36, 1–9. [Google Scholar] [CrossRef]
- Moldflow Synergy; Autodesk: San Rafael, CA, USA, 2017.
- Dansk Standards-ISO. 15530-3 Geometrical Product Specifications (GPS)—Coordinate Measuring Machines (CMM)—Technique for Determining the Uncertainty of Measurement—Part 3: Use of Calibrated Workpieces or Measurements Standards. 2011. Available online: https://www.ds.dk/en/standards/buy-standards (accessed on 8 October 2018).
- Gasparin, S.; Hansen, H.N.; Tosello, G. Traceable surface characterization using replica moulding technology. In Proceedings of the 13th International Conference on Metrology and Properties of Engineering Surfaces, Lyngby, Denmark, 12–15 April 2011; pp. 310–315. [Google Scholar]
- Giannekas, N.; Gammelby, R.; Tosello, G.; Tcherniak, D.; Zhang, Y. Feasibility study on integrated process/product quality assurance framework for precision injection moulding based on vibration monitoring. In Proceedings of the Euspen’s 17th International Conference & Exhibition, Hannover, Germany, 29 May–2 June 2017; pp. 508–509. [Google Scholar]
- Gajic, Z. Correlation of Discrete-Time Signals. In Linear Dynamic Systems and Signals; Prentice Hall: Englewood Cliffs, NJ, USA, 2003; pp. 90–100. [Google Scholar]
- Chen, H.; Li, Y.; Wu, Z. Dynamic time warping distance method for similarity test of multipoint ground motion field. Math. Probl. Eng. 2010, 2010. [Google Scholar] [CrossRef]
- Sakoe, H.; Chiba, S. Dynamic Programming Algorithm Optimization for Spoken Word Recognition. IEEE Trans. Acoust. 1978, 26, 43–49. [Google Scholar] [CrossRef]
- Sanguansat, P. Multiple Multidimensional Sequence Alignment Using Generalized Dynamic Time Warping. WSEAS Trans. Math. 2012, 11, 668–678. [Google Scholar]
- Lee Rodgers, J.; Nicewander, W.A. Thirteen ways to look at the correlation coefficient. Am. Stat. 1988, 42, 59–66. [Google Scholar] [CrossRef]


| Run | |||||||||||||||||
|---|---|---|---|---|---|---|---|---|---|---|---|---|---|---|---|---|---|
| Parameter | Unit | 1 | 2 | 3 | 4 | 5 | 6 | 7 | 8 | 9 | 10 | 11 | 12 | 13 | 14 | 15 | 16 |
| Tm | [°C] | 220 | 260 | 220 | 260 | 220 | 260 | 220 | 260 | 220 | 260 | 220 | 260 | 220 | 260 | 220 | 260 |
| Tmld | [°C] | 40 | 40 | 60 | 60 | 40 | 40 | 60 | 60 | 40 | 40 | 60 | 60 | 40 | 40 | 60 | 60 |
| InjSp | [mm/s] | 100 | 100 | 100 | 100 | 140 | 140 | 140 | 140 | 100 | 100 | 100 | 100 | 140 | 140 | 140 | 140 |
| PackPr | [bar] | 440 | 440 | 440 | 440 | 440 | 440 | 440 | 440 | 540 | 540 | 540 | 540 | 540 | 540 | 540 | 540 |
| Measurement Settings | |
|---|---|
| Objective | ×20 |
| Exposure | 3.05 ms |
| Contrast | 1.11 |
| Vertical resolution | 299 nm |
| Uncertainty Contributions | Mold Inserts | Parts | ||
|---|---|---|---|---|
| Cavity 1 | Cavity 2 | Cavity 1 | Cavity 2 | |
| ucal [μm] | 0.1 | 0.1 | 0.1 | 0.1 |
| uth [μm] | 0.003 | 0.003 | 0.003 | 0.003 |
| ub [μm] | 0.034 | 0.034 | 0.034 | 0.034 |
| uppart [μm] | - | - | 0.26–0.97 | 0.22–0.95 |
| umold [μm] | 0.11–0.12 | 0.13–0.79 | - | - |
| Expanded Uncertainties | Mold Inserts | Parts | ||
|---|---|---|---|---|
| Cavity 1 | Cavity 2 | Cavity 1 | Cavity 2 | |
| Upart [μm] | - | - | 0.54–1.94 | 0.45–1.91 |
| Umold [μm] | 0.25–0.26 | 0.29–1.58 | - | - |
| Udev [μm] | 0.54–3.92 | |||
| Expanded Uncertainties per Run (Uexp [μm]) | ||||||||||||||||
|---|---|---|---|---|---|---|---|---|---|---|---|---|---|---|---|---|
| R1 | R2 | R3 | R4 | R5 | R6 | R7 | R8 | R9 | R10 | R11 | R12 | R13 | R14 | R15 | R16 | |
| Cavity 1 | ||||||||||||||||
| Upart | 1.04 | 1.10 | 0.77 | 0.88 | 1.42 | 0.84 | 1.94 | 1.87 | 0.55 | 1.40 | 0.74 | 1.43 | 1.05 | 1.29 | 0.76 | 1.02 |
| Udev | 1.65 | 1.74 | 1.77 | 1.86 | 1.86 | 1.77 | 2.09 | 1.69 | 1.98 | 1.95 | 2.02 | 1.83 | 2.49 | 1.68 | 1.80 | 2.28 |
| Cavity 2 | ||||||||||||||||
| Upart | 1.04 | 1.10 | 0.79 | 0.97 | 1.42 | 0.84 | 1.94 | 1.87 | 1.18 | 1.40 | 1.24 | 1.43 | 1.91 | 1.29 | 0.85 | 1.64 |
| Udev | 1.65 | 1.74 | 1.77 | 1.86 | 1.86 | 1.77 | 2.09 | 1.69 | 1.98 | 1.95 | 2.02 | 1.83 | 2.49 | 1.68 | 1.80 | 2.28 |
| Ume. per Run-Cavity 1 | |||||||||
| Tm [°C] | Tmld [°C] | InjSp [mm/s] | PackPr [bar] | ||||||
| Position | Unit | 220 | 260 | 40 | 60 | 100 | 140 | 440 | 540 |
| PP1 | [μm] | 5.6 | 3.6 | 3.9 | 3.8 | 3.0 | 3.8 | 3.2 | 3.0 |
| PP2 | [μm] | 5.7 | 2.2 | 5.1 | 4.2 | 6.2 | 0.8 | 3.5 | 5.7 |
| PP3 | [μm] | 16.0 | 1.8 | 13.3 | 13.3 | 17.3 | 3.2 | 12.6 | 14.0 |
| RP2 | [μm] | 27.5 | 21.5 | 23.9 | 25.6 | 26.2 | 21.0 | 27.2 | 21.8 |
| Ume. per Run-Cavity 2 | |||||||||
| Tm [°C] | Tmld [°C] | InjSp [mm/s] | PackPr [bar] | ||||||
| Position | Unit | 220 | 260 | 40 | 60 | 100 | 140 | 440 | 540 |
| PP1 | [μm] | 3.1 | 3.2 | 3.2 | 3.0 | 3.1 | 3.2 | 3.2 | 3.1 |
| PP2 | [μm] | 3.7 | 4.3 | 3.9 | 4.1 | 3.9 | 4.2 | 4.0 | 3.9 |
| PP3 | [μm] | 3.7 | 3.2 | 3.1 | 3.5 | 3.4 | 3.3 | 3.4 | 3.3 |
| RP2 | [μm] | 46.8 | 21.8 | 37.3 | 39.4 | 32.8 | 3.7 | 35.2 | 41.3 |
© 2018 by the authors. Licensee MDPI, Basel, Switzerland. This article is an open access article distributed under the terms and conditions of the Creative Commons Attribution (CC BY) license (http://creativecommons.org/licenses/by/4.0/).
Share and Cite
Giannekas, N.; Zhang, Y.; Tosello, G. Investigation on Product and Process Fingerprints for Integrated Quality Assurance in Injection Molding of Microstructured Biochips. J. Manuf. Mater. Process. 2018, 2, 79. https://doi.org/10.3390/jmmp2040079
Giannekas N, Zhang Y, Tosello G. Investigation on Product and Process Fingerprints for Integrated Quality Assurance in Injection Molding of Microstructured Biochips. Journal of Manufacturing and Materials Processing. 2018; 2(4):79. https://doi.org/10.3390/jmmp2040079
Chicago/Turabian StyleGiannekas, Nikolaos, Yang Zhang, and Guido Tosello. 2018. "Investigation on Product and Process Fingerprints for Integrated Quality Assurance in Injection Molding of Microstructured Biochips" Journal of Manufacturing and Materials Processing 2, no. 4: 79. https://doi.org/10.3390/jmmp2040079
APA StyleGiannekas, N., Zhang, Y., & Tosello, G. (2018). Investigation on Product and Process Fingerprints for Integrated Quality Assurance in Injection Molding of Microstructured Biochips. Journal of Manufacturing and Materials Processing, 2(4), 79. https://doi.org/10.3390/jmmp2040079