Abstract
During the 2008 Major League Baseball (MLB) season, there was a perception that the rate at which wood bats were breaking was on the rise. MLB responded by implementing changes to the wood bat regulations that were essentially transparent to the players, e.g., changing the orientation for the hitting surface on maple bats, setting a lower bound on wood density, and reducing the allowable range for the slope of grain (SoG) of the wood used to make bats. These new regulations resulted in a 65% reduction in the wood-bat breakage rate. It is proposed that a further reduction to the multi-piece failure (MPF) rate can be realized by accounting for the role that bat profile plays with respect to bat durability. Durability is defined here as the relative bat/ball speed that results in crack initiation, i.e., the higher the breaking speed, the better the durability. The aim of the current work is to complete a parametric study to investigate if bat profile influences bat durability with respect to SoG. Three bat profiles with very different geometries and volumes are analyzed using the finite element software, LS-DYNA®. The mechanical behavior of the wood is modeled using the *MAT_WOOD material model in combination with the *MAT_ADD_EROSION option. The effective wood material properties are varied as a function of wood density and SoG. Results include how varying bat profile and SoG influences bat durability. The study is limited to maple wood bats.
1. Introduction
Historically, professional baseball games use wooden baseball bats, which can be classified to break in one of two modes: single-piece failure (SPF) and multi-piece failure (MPF). In response to a perceived increase in MPFs in baseball games, Major League Baseball (MLB) issued changes to the Wooden Baseball Bat Specifications (WBBS) which set a required range for allowable slope of grain (SoG) in the wood used to manufacture professional baseball bats, as well as instituted inspections of the bats by a third party [1]. Traditionally, any species of wood could be used in an MLB game, but changes to WBBS for the 2010, 2011, and 2012 seasons specified allowable wood species and gradually increased the lower bound of wood density used in professional bats [2,3,4,5]. In turn, this increase in the minimum allowable density would increase the minimum breaking strength of wood. These changes led to a 65% reduction in MPF rate [6].
It is proposed that a further reduction in the MPF rate can be realized by also considering the role that bat profile has with respect to bat durability. Previous work has shown that SoG directly affects baseball bat durability [7]. The aim of the current work is to conduct a parametric study to understand if bat profile is influential in the durability of the baseball bat with respect to SoG.
2. Methodology
2.1. Bat Profiles
The four major regions of a baseball bat profile, i.e., shape, are shown in Figure 1. The knob is a register point for the hands and helps to keep the bat in the player’s hands during the swing. The handle is where the player grips the bat and is the thinnest part of the baseball bat. The taper region transitions the handle to the barrel. The player hits the baseball with the barrel portion of the bat, which is the thickest section of the bat. Depending on a player’s desired handle and barrel length and diameter, the taper can vary significantly from bat profile to bat profile.
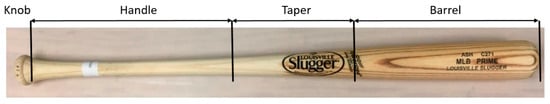
Figure 1.
The four sections of a baseball bat.
For this investigation, three bat profiles that had varying geometries and volumes were selected. Table 1 visually compares the bat profiles and Table 2 shows bat diameter measurements for each of the three profiles at specific axial locations of interest. These locations were measured from the knob end of the bat. Of the three profiles, Bat Profile A had the largest handle, barrel, and the largest diameters at the 12 in (30.5 cm), 16.5 in (41.9 cm), 18 in (45.7 cm), and 21 in (53.3 cm) locations. At the 18 in (45.7 cm) and the 21 in (53.3 cm) locations, Bat Profile A had the largest measurements by a relatively large amount, which indicates that the taper region increased in diameter very quickly compared to Bat Profiles B and C. Bat Profile C had the median diameter of the three but the smallest maximum barrel diameter, which suggests it had the most gradual diameter change through the taper region of the baseball bat. Lastly, Bat Profile B had the smallest minimum handle diameter but had dimensions that were in between the geometries of Bat Profiles A and C for the measured locations through the taper and barrel region of the bat.

Table 1.
Bat Profile Visual Comparison.
Table 2.
Bat Profile Geometric Comparison.
2.2. Finite Element Modeling
All finite element analyses were completed using LS-DYNA (Livermore Software Technology Corporation, Livermore, CA, USA), and the models were constructed using Altair HyperMesh (Altair Engineering, Inc., Troy, MI, USA). Post-processing was conducted in LS-Prepost (Livermore Software Technology Corporation, Livermore, CA, USA). The bat models were analyzed for a range of baseball impact velocities that ranged from 90 mph (145 km/h) to 180 mph (290 km/h) in 5 mph (8 km/h) increments. The mechanical properties of the maple wood used in the models were reported by Fortin-Smith et al. [8].
Each bat model was constructed of eight-noded brick elements with single-point integration. Material model #143 from LS-DYNA (*MAT_WOOD) was used in the finite element models. Table 3 summarizes the volume and densities of each of the bat profiles. Because the volume of each bat profile was different, the resulting densities were calculated to maintain each 34-in (86.4-cm) bat at 31 oz. (879 g). As a result of the varying densities, the strain-to-failure values and mechanical properties also varied as a function of density, as reported by Fortin-Smith et al. [8].
Table 3.
Volume and density of bat profiles.
To specify the SoG of the baseball bat, the AOPT option for *MAT_WOOD was utilized. Each of the three bat profiles was given SoGs between ±10° to investigate and to quantify the relationship between SoG and bat profile durability. The SoGs used in the models were −10°, −5°, −3°, −2°, −1°, 0°, 1°, 2°, 3°, 5°, and 10°. The sign convention for positive and negative SoG is shown in Figure 2a.
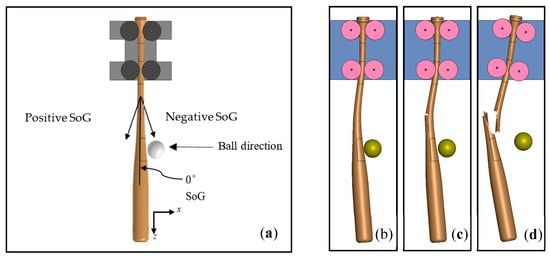
Figure 2.
Finite element analysis terminology (a) Sign convention used in the finite element models (b) no failure (NF); (c) single-piece failure (SPF) outcome; and (d) multi-piece failure (MPF) outcome.
2.3. Wood Failure Criteria
There are three potential outcomes for a bat/ball impact, i.e., no failure (NF), single-piece failure (SPF), and multi-piece failure (MPF). NF occurs if the bat does not crack as a result of the impact. SPF occurs if the baseball bat cracks but does not break into multiple large pieces, which is defined as a piece of bat that weighs 1.00 oz. (28.4 g) or more. To capture failure, the strain-to-failure criterion in the *MAT_ADD_EROSION keycard of LS-DYNA was used, and the strain-to-failure varied as a function of wood density [8]. An illustration of the three possible outcomes of the finite element analyses is shown in Figure 2b–d.
2.4. Dynamic Impacts
Two ball impact locations were investigated, i.e., 2.0 in (5.1 cm) and 14.0 in (35.6 cm) as measured from the tip of the barrel end of the bat, as shown in Figure 3. These two impact locations have been observed to be critical locations for breaking bats in professional baseball games. Impacts at these locations are positioned away from the nodes of the first and second bending modes of vibration. These off-node impacts induce large-amplitude vibrations along the length of the bat, which create large strains on the bat, leading to breakage.
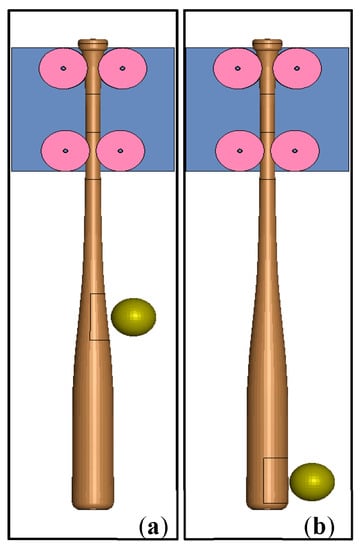
Figure 3.
Side-by-side comparison of (a) 14.0 in (5.1 cm) model and (b) 2.0 in (35.6 cm) model.
The range of velocities initially used in this study spanned from 90 to 180 mph (145 to 290 km/h) depending on the impact location. For the 14.0 in (35.6 cm) ball impact model, the velocity range was 90–145 mph (145–233 km/h). This velocity range corresponded to a 60%–100% maximum velocity impact assuming a 90 mph (145 km/h) pitch and a 90 mph (145 km/h) swing speed measured 2.0 in (5.1 cm) from the barrel end of the bat rotating about an axis 6.0 in (15.2 cm) from the knob. Using this same methodology, the 2.0 in (5.1 cm) baseball impact model had a ball velocity up to 180 mph (290 km/h), as this velocity corresponded to a maximum 100% velocity impact at the 2.0 in (5.1 cm) location, assuming the same pitch and swing speeds as in the 14.0 in models. Upon analyzing the results after running all of these combinations, it was determined that the range of speeds needed to be expanded from 90–180 mph (145–290 km/h) to 70–210 mph (113 to 322 km/h) to get a complete mapping of the boundaries between NF and SPF and SPF and MPF. A total of 1551 combinations of bat profile, impact speed, impact location, and SoG were analyzed using LS-DYNA.
3. Results
The results of the finite element models were analyzed to explore how durability, i.e., breaking speed, changed as a combination of SoG and bat profile. Table 4 and Table 5 summarize the peak speed resulting in NF and SPF, respectively, as a function of bat profile, impact location, and SoG. Contour plots illustrating the three outcomes as a function of ball impact velocity and SoG are shown for each bat profile and each ball impact location (Figure 4). The potential outcomes of NF, SPF, and MPF for each combination of SoG and impact ball speed are denoted by the color bands. The dashed vertical lines define the positive and negative bounds of SoG that are compliant with the current MLB allowable range, i.e., ±3°. The solid vertical line denotes the 0° SoG location on the plot.
Table 4.
Peak speed and associated slope of grain (SoG) for NF outcome.
Table 5.
Peak speed and associated SoG for SPF outcome.
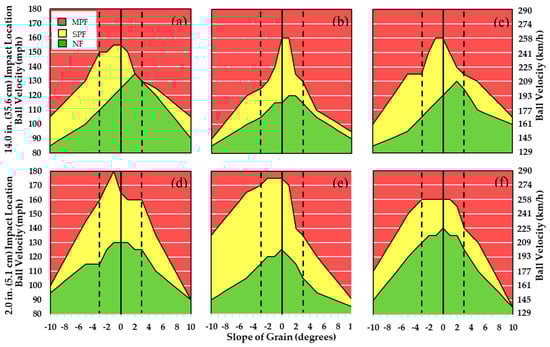
Figure 4.
Top row, left to right—14.0 in. (35.6 cm) impact models for (a) Profile A, (b) Profile B, and (c) Profile C. Bottom row, left to right—2.0 in. (5.1 cm) impact models for (d) Profile A, (e) Profile B, and (f) Profile C.
4. Discussion
The data in Table 4 and Table 5 show the maximum threshold speeds for the transition from NF to SPF and from SPF to MPF, respectively, for the three bat profiles. Figure 4 shows the finite element model outcomes as a function of impact location, SoG and bat profile. Upon examining the SoG associated with the peak breaking speed, it was noted that the maximum speeds for the outside (2 in, 5.1 cm) impacts occurred at −1° to 0°, while the maximum speeds for the inside (14-in, 35.6 cm) impact location occurred at +2° for a NF outcome and 0° for a SPF outcome. The different impact locations created different crack initiation locations on the baseball bat. The outside (2.0 in, 5.1 cm) impact location created crack initiation on the impact-side of the bat, whereas the inside (14 in, 35.6 cm) pitch location created crack initiation on the opposite side of impact. Because a majority of the peak velocities were at 0° SoG, it was implied that 0° SoG is the optimal choice for robust durability for any of these bat profiles. Further, the fact that the peak breaking speed fell within the MLB-specified ±3° SoG range supports the choice of this range for the wood bat specifications.
Figure 4 shows that for any value of SoG, each bat profile behaved differently. The 14.0 in (35.6 cm) ball impact location showed that the MPF durability of Bat Profile B was more dependent on SoG than Bat Profiles A and C, despite maintaining one of the highest SPF-MPF threshold velocities. Conversely, Bat Profile A had a relatively flat SPF-MPF threshold velocity from −3° to + 1° SoG, indicating that it had the lowest influence by SoG than the other bat profiles. The 2.0 in (5.1 cm) impact location plots also show that SoG had the least influence on Bat Profile C because of how flat its SPF-MPF threshold velocities were within the MLB standard of ±3° SoG. It was observed that more of the plots were asymmetric about their respective peaks. There was a significant decrease in bat durability as the SoG progressed in the positive direction away from the peak SPF-MPF threshold velocity compared to the same progression in the negative direction. These plots also show that bat durability decreased rapidly as SoG progressed outside the range of ±3°.
The differences in SPF-MPF threshold velocity curves and their respective asymmetries indicate that bat profile plays an influential role in bat durability in conjunction with SoG. By examining the SoG dependent nature of each bat profile, the near-optimal bat durability could be reached with smaller ranges of allowable SoG. To achieve this level of optimization would require modeling of each bat profile and additional impact locations. Among the examined bat profiles with ranging volumes, there was a tendency for the optimal SoG range to be −3° to + 1°.
5. Conclusions
Three different baseball bat profiles were analyzed using the finite element method to explore how bat durability changes as a function of ball impact velocity, impact location, and SoG. The results show that bat profiles are affected by the SoG differently, but among the profiles examined there could be a reduction in MPF rate if the allowable SoG range was decreased from ±3° to −1 ± 2° SoG.
Acknowledgments
The authors appreciate the initial development of the models by Joshua Fortin-Smith.
Conflicts of Interest
The authors declare no conflict of interest. No funding sponsor had a role in the design of the study; in the collection, analyses, or interpretation of the data; in the writing of the manuscript, and in the decision to publish the results.
References
- Major League Baseball. Major League Baseball 2009 Bat Supplier Regulations. The Office of the Commissioner of Baseball, 15 December 2008. [Google Scholar]
- Major League Baseball. Major League Baseball 2010 Bat Supplier Regulations. The Office of the Commissioner of Baseball, 6 January 2010. [Google Scholar]
- Major League Baseball. Agreement Regarding Players’ Use of Approved Bats in Major League Games for the 2010 Season. The Office of the Commissioner of Baseball, 7 January 2010. [Google Scholar]
- Major League Baseball. Major League Baseball 2011 Bat Supplier Regulations. The Office of the Commissioner of Baseball, 2011. [Google Scholar]
- Major League Baseball. Major League Baseball 2012 Bat Supplier Regulations. The Office of the Commissioner of Baseball, December 2012. [Google Scholar]
- Saraceno, J. Taking Swing at Safer Bats, Man Says His Creation Curbs Exploding Effect. USA TODAY, 15 August 2016; FA CHASE EDITION P.1C. [Google Scholar]
- Fortin-Smith, J.; Sherwood, J.; Drane, P.; Ruggiero, E.; Campshure, B.; Kretschmann, D. A Finite Element Investigation into the Effect of Slope of Grain on Wood Baseball Bat Durability. Appl. Sci. 2019, 9, 3733. [Google Scholar] [CrossRef]
- Fortin-Smith, J.; Sherwood, J.; Drane, P.; Kretschmann, D. Characterization of Maple and Ash Material Properties for the Finite Element Modeling of Wood Baseball Bats. Appl. Sci. 2018, 8, 2256. [Google Scholar] [CrossRef]


© 2020 by the authors. Licensee MDPI, Basel, Switzerland. This article is an open access article distributed under the terms and conditions of the Creative Commons Attribution (CC BY) license (https://creativecommons.org/licenses/by/4.0/).