1. Introduction
Since performance advancements have become more challenging in the tennis racket industry, manufacturers rely increasingly on consumer feedback in terms of racket feel to provide direction in the development process. The feel of a piece of sports equipment has also been highlighted as a major factor influencing a consumer’s buying decision [
1]. As a result, manufacturers incorporate user perception into the development process of new rackets and rely on the meaningfulness of subjective data. Due to the complex nature of the game, however, subjective assessments of racket feel often lack reliability and include multiple sources of inconsistency.
Previous research on feel in tennis has explored certain parameters in isolation, such as moment of inertia [
2] and sound [
3]. These studies focused on establishing links between subjective and objective data. However, no study to date has investigated the reliability and suitability of methods used to gather subjective data.
Sensory evaluation of consumer products has been traditionally separated into analytical tests, performed by trained panels, and hedonic tests using consumers [
4]. Racket brands constantly update their products, therefore internal development decisions must be made quickly and the time-consuming process of training a panel is not desirable. In the food industry, sensory evaluation techniques are heavily used and the use of consumers for analytical evaluation of sensory characteristics has lately gained appreciation [
4].
As a result, so-called rapid sensory profiling techniques have evolved [
5], with one of the most popular methods being free-choice profiling (FCP) [
6]. FCP allows testers to self-define a series of attributes on which they wish to judge the sample of products, based on their initial perceptions of the most salient features. This addresses the issue of testers being forced to rate rackets according to attributes defined and deemed suitable by the investigator. FCP also offers the advantage of assessing the sensory characteristics of a sample of products in a single session, whilst providing the most prominent, marketable terms at the same time.
The main aim of this study, therefore, is to evaluate the suitability of FCP in determining the sensory profile of tennis rackets. FCP will be considered suitable if
Common attributes emerge amongst multiple testers (attribute prominence).
Testers are able to differentiate consistently between rackets with regard to a particular attribute (discrimination capability).
Multiple testers judge the rackets in the same way on the most prominent attributes (degree of agreement).
Application of statistical techniques, such as principal component analysis (PCA) or multiple factor analysis (MFA) in the context of subjective data analysis from tennis racket tests, will also be discussed. Increasing knowledge about novel sensory evaluation methods in tennis research will help racket engineers to make more efficient decisions in the development process by applying methods to obtain more meaningful on-court data. Accurate determination of sensory profiles of rackets will allow feel characteristics to be tailored to the consumer and could even be used to enhance marketing strategies.
2. Materials and Methods
Thirty-eight male tennis players were recruited to perform the FCP task (age = 45 ± 10 years). The group of participants consisted of recreational tennis players, playing at least once a week but not competitively. This specific demographic group of tennis players was used because they best represent the target group of the rackets under investigation. All tests were performed on the outdoor clay courts of two local clubs in Vorarlberg, Austria.
2.1. Rackets
Four different rackets (A, B, C, and D) were evaluated. The exact specifications of the rackets are confidential; however, the ranges within which they fall are given in
Table 1. All rackets were less than 295 g in mass and differed considerably in head sizes, stiffness, balance, swing weight, and frame geometry. All rackets were strung at 24 kg with the same string, equipped with string dampers and had a 16 × 19 string pattern. Rackets exhibiting a broad spectrum of varying characteristics were chosen over rackets only differing in one characteristic; as such, a selection would evoke a wider range of racket-specific vocabulary, making it particularly suitable for FCP.
2.2. Free-Choice Profiling Protocol
The unique characteristic of FCP is that testers can define their own attributes. After a five minutes warm-up, all testers were given instructions on how to perform the task. Four testers were tested at a time on two adjacent courts. A duplicate set of rackets was produced, in order to allow smooth flow of the protocol. On each court, two testers shared one of the two identical sets of rackets. The testers were all German speaking, and all attributes mentioned in this study were translated from German into English by the lead investigator, who is fluent in both languages.
Testers were allowed to provide between one and four attributes. They were encouraged to only select attributes, for which they perceived the largest differences between rackets. Each tester had to play with each racket at least once before making their first rating and they could swap rackets as many times as they wanted to. If testers experienced difficulties in verbalizing perceived differences, the investigators supported them in finding appropriate descriptors.
The ratings were recorded using 100 mm Visual Analogue Scales (VAS) with ends marked by a minus and a plus. To aid understanding, testers could add word anchors to either end of the scale and provide descriptions of the self-defined attributes.
2.3. Statistical Analysis
Terms and descriptions for the different attributes used by the testers were compared, and those that were considered to share a similar theme were grouped together. The percentage of testers that used each sensory attribute was selected as a measure of attribute prominence. Only the most prominent attributes, which were mentioned by at least six (>15%) testers, were analyzed further.
The discrimination capability of testers on the most prominent attributes was determined by the p-values from Friedman’s two-way analysis of variance (ANOVA) by ranks and by the mean ranges of the particular VAS scale being used. To assess the degree of agreement between each tester and the group consensus, profile plots were used. Fleiss’ kappa was used as an objective measure of inter-rater agreement.
Finally, PCA was used to determine the relationship between sensory attributes. PCA was performed on a 4 × 10 matrix with one score per racket per attribute. Racket specifications and the overall liking of the rackets, assessed at the end of each session, were added as additional variables. Since averaging causes inter-tester variance to be lost and because of the occurrence of different attributes, MFA is a more common approach in FCP data analysis. Therefore, data were also analyzed by MFA and all scores were standardized by subtracting the mean and dividing it by the standard deviation. Both MFA and PCA were performed with the Rstudio software (version 1.1.463, RStudio, Inc., Boston, MA, USA) using the FactoMineR package [
7].
3. Results
The attributes most frequently used to describe the rackets are summarized in
Table 2. The table also highlights how different but related terms were grouped together and given a shared attribute name. The
p-values from Friedman’s test are shown in
Table 3. The smaller the
p-value, the more likely it is that rackets were perceived as being different. This test has only been performed on attributes exceeding the minimum recommended number of testers.
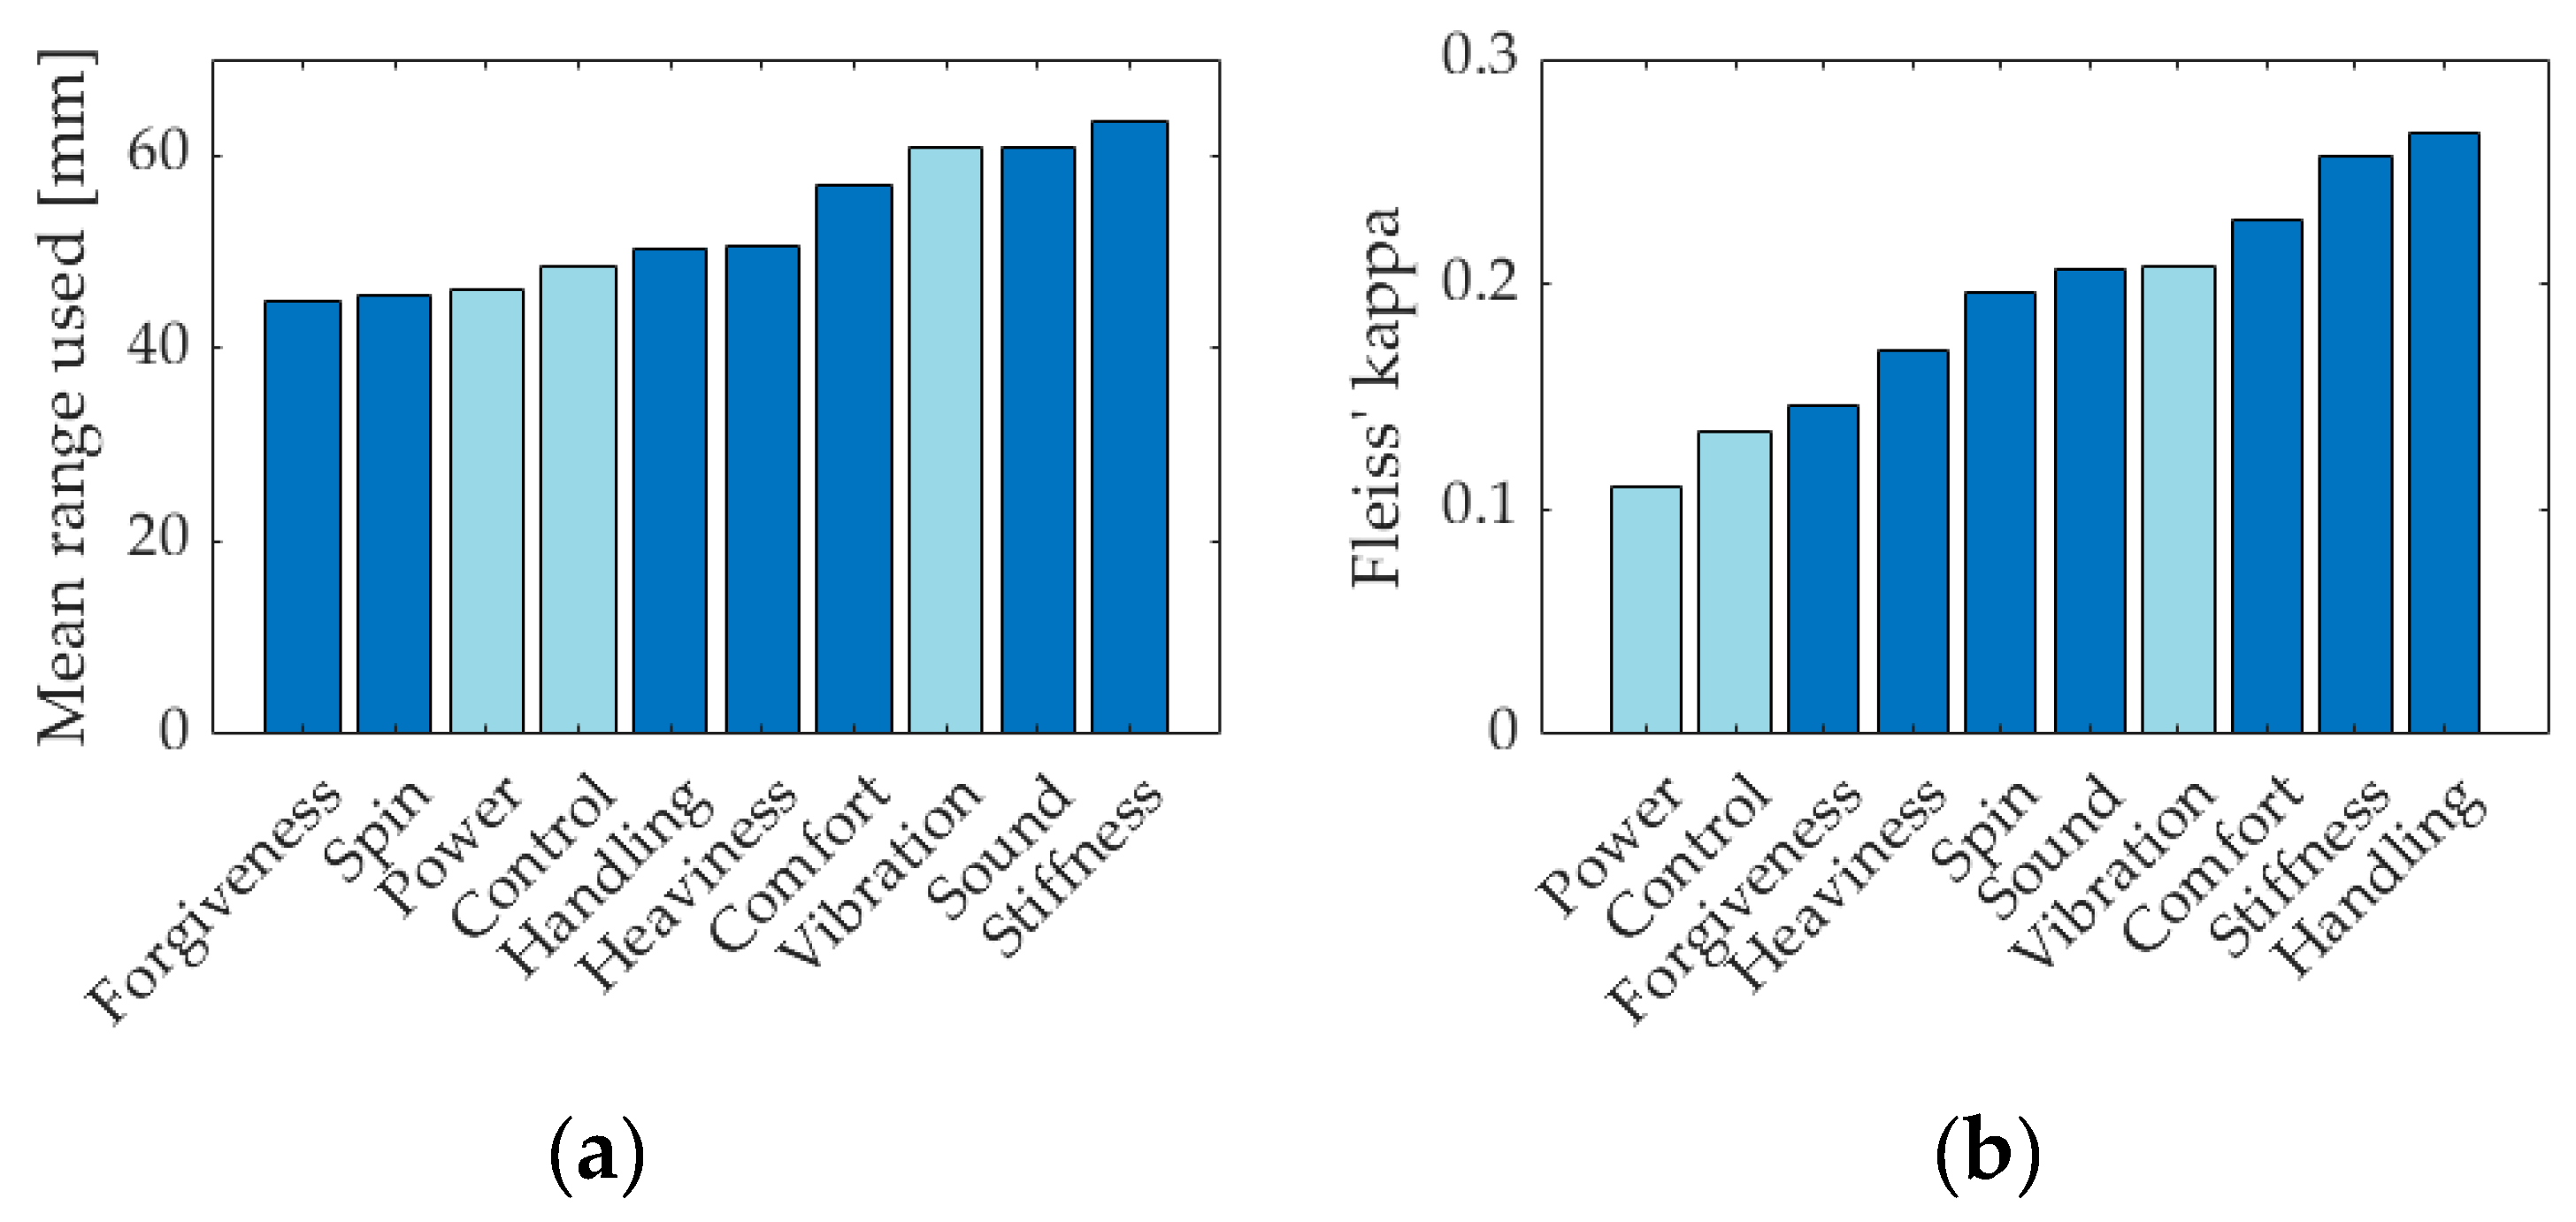
The fact that discrimination of vibration has been superior to power and control can also be observed when analyzing the mean range used by the testers for different attributes (
Figure 1a). Using a smaller range within the available scale suggests that testers had more difficulty perceiving differences between rackets for that specific attribute. Another striking result is that the inter-rater agreement correlates with the mean range of the scale used by testers (r = 0.63,
p = 0.0504), even though the inter-rater agreement is only taking ranks into account, rather than the relative differences on the scale. The degree of agreement of several attributes, calculated by Fleiss’ kappa, is shown in
Figure 1b.
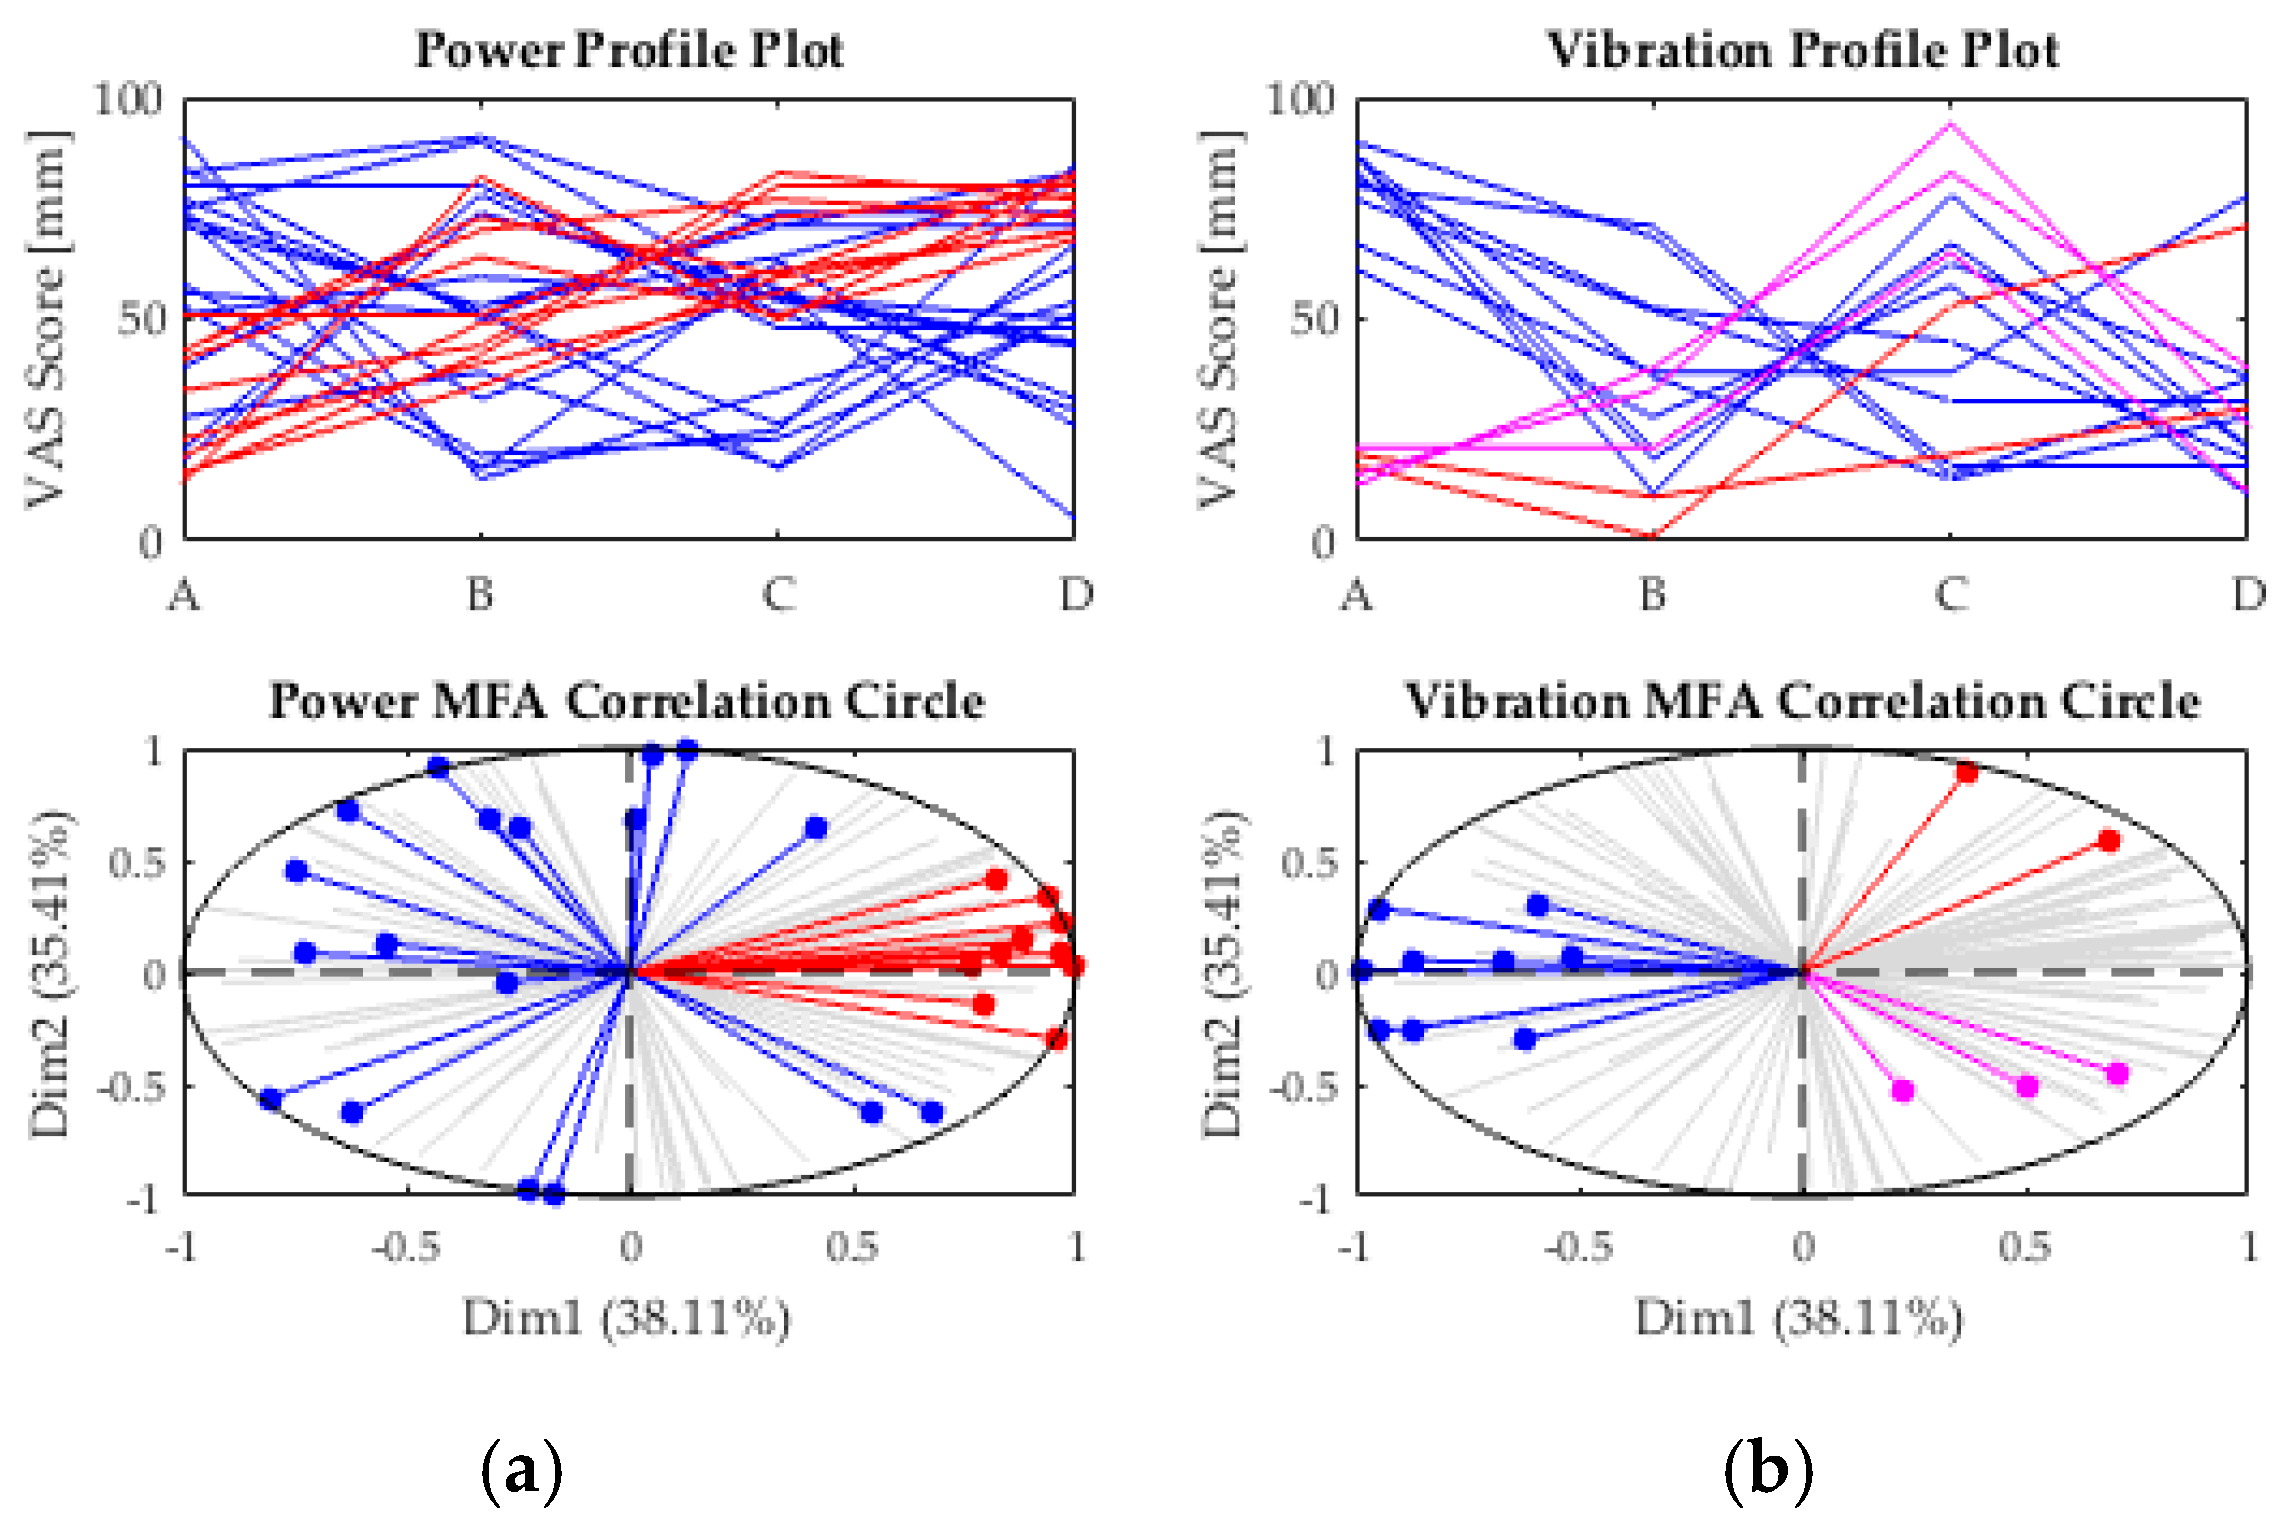
Industry-generated terms, such as power and control, lack inter-rater agreement and discrimination. This can be further illustrated by MFA correlation circles and corresponding profile plots of power (
Figure 2a) and vibration (
Figure 2b). In MFA correlation circles, close agreement is represented by vectors pointing in the same direction, whereas opposing directions indicate disagreement. Each vector represents one tester. Even though there seems to be an accumulation of power agreement at 3 o’clock in the MFA correlation circle, many outliers can be detected. This is further illustrated by random trends in the corresponding profile plots. There are fewer outliers for vibration; the vibration profile plot shows that agreement for rackets A and D is relatively high, with VAS ratings mostly ranging from 60 to 90 and 10 to 40 mm, respectively.
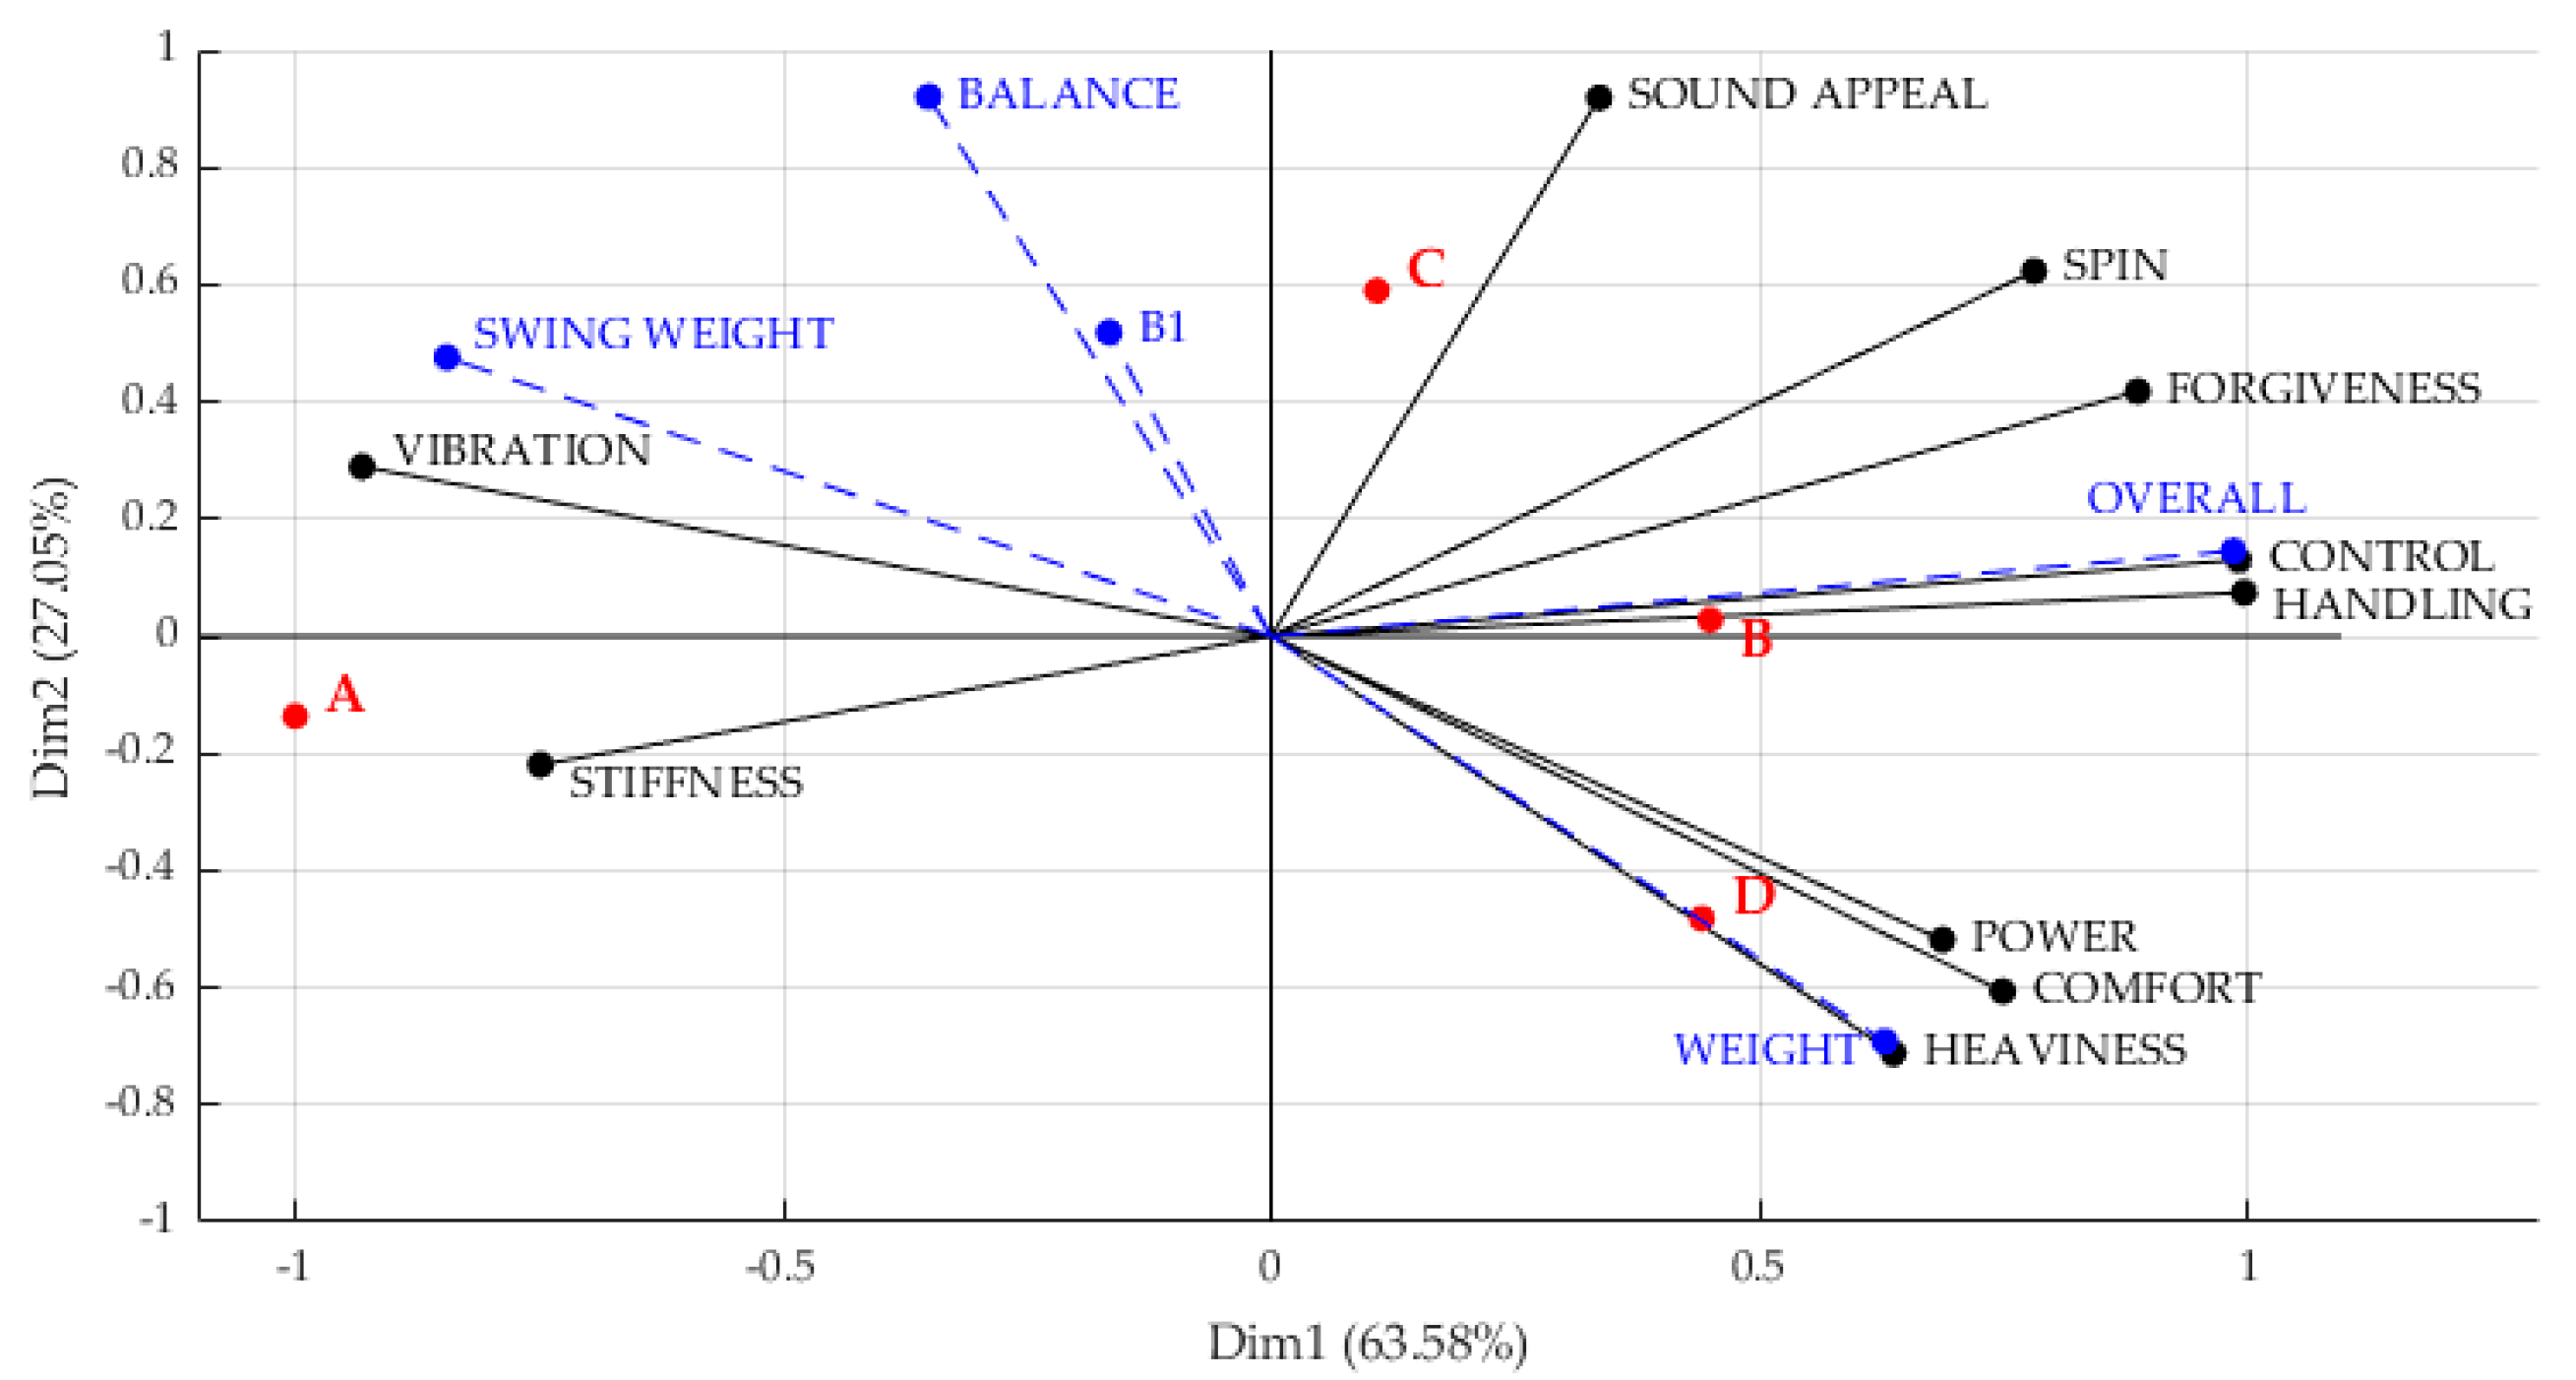
The results of the PCA are presented in the form of a variables factor map in
Figure 3, which illustrates the sensory profiles of the rackets used in this study. The first two principal components explain more than 90% of the total variance within the data and are therefore enough to visualize the correlation between the attributes. Black vectors refer to sensory attributes, whereas the blue vectors refer to additional variables, namely, the standardized rank sums of overall liking and racket specifications. The first dimension is best explained by control, handling, and overall (liking) as opposed to vibration (all cos
2 > 0.85). Sound appeal and balance best explain the second dimension.
4. Discussion
The application of FCP has been successful in assessing the most prominent sensory attributes for this specific group of consumers as well as rapidly evaluating the sensory profile of this set of tennis rackets. It is not surprising that power and control were the most commonly used attributes, considering their presence in the marketing of tennis rackets. Attributes referring to physical characteristics, such as vibration or stiffness, have been used less often but also play a significant role in the perceived quality. Many descriptors refer to the playability of the racket, being described by forgiveness, handling, required skill, or size of the sweetspot. Impact- or feedback-specific ratings were mostly explained by vibration and comfort, rather than crisp or lively. Unsurprisingly, the previously identified feel parameters cosmetics and string bed [
2] have not been used, as all rackets were coated black and strung at the same tension. It is, however, surprising that the relatively different dimensions or geometries of the rackets were not mentioned.
Even though PCA is not the common choice for statistical analysis of FCP data, it is effective in giving a comprehensive overview of relationships and sensory profiles of rackets. While racket D can be described as comfortable and heavy with easy access to power, racket B features good control and handling and racket C emits the most appealing sound. Racket A is the least liked, probably due to excessive levels of vibration and stiffness. For this specific group of players, control and handling seem to be the most important attributes when judging overall liking, whereas high levels of vibration and stiffness negatively affect the overall liking. The first bending mode does not show any relation to perceived stiffness or vibration, even though the differences are relatively large. Perceived heaviness seems to correlate with the mass of the rackets, rather than swing weight or balance. One possible explanation may be that differences between the rackets’ swing weight are not perceivable.
One disadvantage of PCA is that its results are affected by the samples under investigation. There seems to be a positive relationship between racket mass and perceived power, which, however, could be artificial. The fact that the heaviest racket felt most powerful could be due to another factor. Moreover, PCA does not take inter-tester variance into account, as input scores are mean values. MFA, on the other hand, uses every single score and accounts for different frequencies in the use of attributes. Therefore, it is the more popular choice when analyzing FCP data. However, if agreement among testers is low, data visualization might get confusing. It is therefore suggested to use both PCA and MFA for analyzing subjective data in racket studies when using FCP.
Data analysis using PCA and MFA should always be accompanied by measures of reliability. Power and control appear as major contributors when characterizing the principal component space. However, these results should be interpreted with care, as inter-rater agreement and discrimination are both poor. The results suggest that tennis players are more sensitive to parameters referring to physical characteristics, such as vibration, rather than complex constructs, such as power or control, and can verbalize their perception on these parameters more consensually. Power is generally related to a racket’s ability to generate high ball speeds, whereas control refers to the accuracy of shot placement. However, racket consumers seem to disagree on their exact definition. It is therefore suggested to investigate the general dimensions of power and control in more detail and to divide them into more clearly defined sub-themes, increasing agreement and reliability.
Even though this method allowed efficient profiling of the sensory characteristics of the rackets, the reliability and meaningfulness of subjective results in tennis racket testing require further research. The effect of different assessment types, such as pairwise comparison on reliability or the potential benefit of a trained panel, should be further investigated.
5. Conclusions
The application of FCP in sensory tennis racket analysis has proven successful in determining the most prominent attributes of the rackets under investigation, rapidly profiling them according to these attributes, establishing relationships between these attributes and identifying sources of the lack of agreement between testers in subjective evaluation of tennis rackets. Power, control, and vibration were the most commonly used attributes; however, tennis players seem to disagree on the exact meaning of power and control while judgment of attributes related to physical characteristics is more reliable. Even though FCP has been proven successful as a method for consumer research in the tennis racket industry, the use of trained panels, to potentially enhance reliability, and the effect of the assessment type on reliability must be explored.

