Abstract
This study, based on the maintenance engineering of regular national and provincial highways in Shanxi Province, aims to achieve refined maintenance of aging asphalt pavements under heavy-duty traffic conditions. Lightweight inspection equipment was used to perform frequent distress collection on the study sections, and for the first time, the EPCI (Economic Pavement Surface Condition Index, which can quickly improve the overall condition level of the pavement by identifying simple two-dimensional diseases such as transverse and longitudinal joints and tortoise net cracks, and low-cost maintenance measures can be carried out through the detection data, which does not include diseases such as subsidence, which are more complex and costly.) is proposed to assess pavement distress conditions. The study conducted six high-frequency data collections over one year on the designated road sections. EPCI evaluations were carried out on each lane in different driving directions, summarizing eight types of pavement distress, including alligator cracking, block cracking, longitudinal and transverse cracking, potholes, longitudinal and transverse crack repairs, and block repairs. The development trends of EPCI and the distribution of pavement distress were analyzed. By comparing EPCI data, it was found that EPCI values in the driving lane fluctuated more stably than those in the overtaking and slow lanes, which was attributed to differences in maintenance intensity. The overall PCI data of the pavement during the COVID-19 pandemic showed that reduced maintenance activities are more conducive to analyzing the pavement’s deterioration patterns. By examining the distressed area in each lane over time, it was observed that the slow lane had the highest distribution of alligator and block cracking, while longitudinal and transverse cracking were most prevalent in the overtaking and driving lanes. Further analysis of the relationship between distressed area and EPCI suggests that controlling the distressed area to around 500 square meters per kilometer per lane can maintain the EPCI score at approximately 80. This level of maintenance is considered the most economical while ensuring satisfactory pavement performance.
1. Introduction
By the end of 2024, China’s total highway mileage reached 5.5 million kilometers, with maintained road mileage accounting for 99.9% of the total, showing a continuous annual increase in maintenance coverage over several years. With the suspension of new construction and reconstruction projects in multiple provinces, the tightening of road maintenance funding has created an urgent need across provinces for more scientific, objective, and precise maintenance decisions. This approach is necessary to optimize road performance within limited maintenance budgets, ensuring the safety, comfort, and convenience of road users. Making scientifically sound decisions for physical maintenance projects requires detailed road condition data analysis. Since pavements are the primary recipients of road maintenance funds, accurate pavement surface inspections are essential as a foundation for developing effective maintenance strategies.
In the field of road inspection, France’s road management agencies developed the GERPHO system in the 1970s. In the 1980s, Japanese researchers created the Komatsu system based on simulated video technology [1]. In the 1990s, American researchers developed the Pavement Condition Evaluation Service (PCES), a road surface distress detection system using line-scan digital cameras [2,3]. This system enabled simultaneous image collection and processing, though it was limited in functionality and unable to distinguish types of pavement distress [4]. During the same period, rapid advancements in CCD (Charged Coupled Device) image sensor technology led a Canadian company to develop the Automatic Road Analyzer (ARAN) system [5], although it faced challenges, such as high hardware costs and asynchronous pavement data and distress detection [6,7]. Since the 21st century, 3D laser scanning technology has emerged and evolved rapidly. Researchers have applied this technology to pavement distress detection systems, such as the U.S.-based DHDV system, which enabled true automation in pavement distress detection; however, the system’s high hardware requirements and maintenance costs have limited its widespread adoption [8]. Researchers like Ravi Radhika and Habib Ayman in the U.S. [9], along with Sami Abdullah in Australia and Sakib Saadman in Bangladesh [10,11,12,13], utilized 3D point cloud data and the YOLOv5 detection model to identify longitudinal cracks, transverse cracks, alligator cracking, and potholes. Early pavement distress detection systems primarily relied on traditional texture feature extraction techniques, such as LBP and Gabor filters, which often underperformed in practical applications. Recent advances in deep learning leverage data representation learning, enhancing the accuracy of road distress detection. Deep learning image algorithms analyze all captured pavement images, identifying and locating distress, segmenting distress regions, and extracting geometric information such as area, length, and width. The aggregated data enables statistical analysis to determine the pavement Distress Rate (DR), from which the Pavement Condition Index (PCI) is derived. Numerous researchers have also made substantial contributions to road surface inspection techniques [13,14,15,16,17,18].
Compared with foreign countries, China’s pavement automatic detection technology started late, and China has a vast territory and a huge highway mileage. It is urgent to study low-cost and efficient lightweight detection equipment. Since the beginning of the 21st century, however, advancements in hardware and rapid progress in image processing technology have enabled significant achievements by domestic research institutes and universities. Numerous scholars in China have conducted studies on automated pavement inspection systems, focusing deeply on image processing techniques for pavement images and advancing the application of digital image processing in road inspections [19,20,21]. Current pavement inspection technologies in China primarily include methods based on deep learning, 3D laser scanning, vibration signal analysis, and pavement surface texture analysis [21,22,23,24,25,26,27,28].
Currently, maintenance planning for domestic expressways and primary highways primarily relies on single-lane, single-pass data collection, while for standard national and provincial highways, annual single-lane inspection data is often used to design comprehensive pavement maintenance plans. This approach, however, is evidently imprecise for formulating maintenance plans. Conducting multiple multi-lane inspections would incur high costs, while the low-cost advantage of lightweight inspection equipment supports studies on pavement distress progression, allowing for more accurate predictions of pavement deterioration, precise calculations of distress treatment areas, and improved maintenance planning. With the advancement of the ‘Made in China 2025’ initiative, promoting the digitalization, informatization, and intelligent management of road maintenance, various lightweight inspection devices have emerged on the market in recent years. Companies such as Baidu, Qianxun, Shanghai Tonglu Cloud, along with universities like Tongji University and Southeast University, have developed inspection equipment. These devices generally employ similar hardware configurations, primarily utilizing monocular cameras, stereo cameras, or industrial cameras to capture road information, followed by image processing for various types of distress recognition, ultimately yielding pavement inspection data. Pavement deterioration patterns can typically be categorized into two forms: (1) Newly constructed or recently overhauled pavements, which require minimal maintenance in the early years, exhibit slow changes in the pavement deterioration index with a low-intensity degradation trend; (2) Existing pavements in mid-to-late service life, where maintenance efforts intensify, show a wavelike decline in the deterioration index. With the recent halt in new construction projects across various provinces, the focus on existing road networks has increased, making research on the latter scenario more beneficial. On the other hand, the disease development of heavy-duty traffic pavement must be more obvious than that of ordinary traffic load grade road, and the number of diseases is also larger. In order to better statistics and analysis data, the heavy-duty traffic load section is selected as the research object.
In summary, to study the progression of pavement distress and develop better maintenance plans, this research, based on the maintenance engineering of regular national and provincial highways in Shanxi Province, employs lightweight pavement distress detection equipment. This equipment was used to perform intermittent, periodic high-frequency data collection of pavement distress on selected 100 km sections of primary asphalt highways subjected to heavy-duty traffic, with inspections conducted every 2–3 months. By calculating the pavement distress rate and conducting comparative data analysis, this study examines the development patterns of the Economic Pavement Surface Condition Index (EPCI) and the distribution of pavement distress under heavy-duty traffic conditions. Based on these findings, recommendations are provided to enhance the precision of maintenance planning.
2. Lightweight Inspection Equipment and Data Collection
This study is based on the maintenance engineering of regular national and provincial highways in Shanxi Province, focusing on the collection of pavement distress data on selected 100 km of primary asphalt highways in both the uphill and downhill driving directions across different lanes. The equipment used in this paper is led by China Highway Engineering Consulting Group Co., Ltd., R & D through the selection and assembly design of the hardware of lightweight and portable road surface detection equipment, using monocular camera to collect road surface pictures, 85,511 road surface training sample images were collected, and further through the Yolov5 target detection algorithm, coupled with convolution deep learning theory, the road surface diseases in the photos were classified and identified. Through multiple debugging and verification of the model, the overall damage missed detection rate of the research is 1.13%, the recall rate is 97.35%, and the precision rate is 98.30%, which meets the requirements of China’s detection accuracy [29].
2.1. Lightweight Inspection Equipment Overview
The lightweight equipment used in this study (Figure 1 shows the main components of the lightweight equipment) was developed under the leadership of the China Highway Engineering Consulting Corporation. The equipment mainly consists of a collection camera, a GNSS positioning system, a mobile central control system, and a vehicle-mounted tripod.
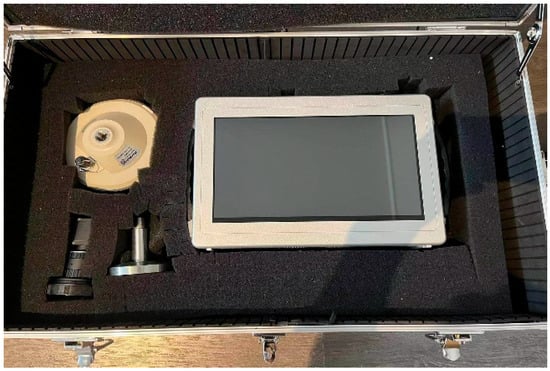
Figure 1.
Nvidia Xavier platform.
2.1.1. High-Definition Industrial Camera
Considering that the equipment needs to perform data collection outdoors for extended periods, the camera must have a certain level of interference resistance to environmental changes, dust, and vibrations. Industrial cameras, compared to standard cameras, offer stable and reliable performance, durability against distress, and the ability to operate continuously for long durations. Therefore, industrial cameras were selected as the data collection endpoint for the equipment (as shown in Figure 2).
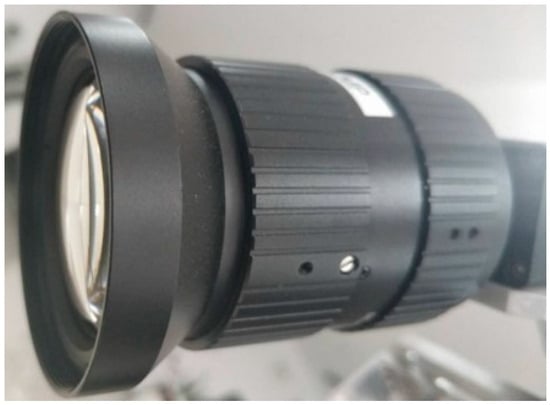
Figure 2.
4K industrial camera.
In terms of camera resolution selection, based on the required accuracy and field of view, to identify 1 mm cracks within a 4 m width, 4000 pixels are necessary in that direction. Hence, to capture clearer data on road cracks, cameras with a horizontal resolution of 4000 pixels or higher were chosen. The camera currently in use is a 4K camera (4096 × 3000), with a resolution exceeding 8 megapixels.
2.1.2. Positioning System
Currently, positioning systems mainly include GPS (Global Positioning System), GNSS (Global Navigation Satellite System), Galileo, GLONASS (Global Navigation Satellite System), among others. The domestic BeiDou satellite system has now completed its network deployment, providing strong support for positioning with related equipment and enhancing the accuracy of location data. For crack data identified through algorithms, it is essential to determine their precise locations, which aids in analyzing the specific distribution of distress along the entire stretch of road and provides data support for road maintenance.
To improve the reliability and accuracy of the detection data, this study selected a positioning board that supports GNSS + GPS dual-mode operation and high-precision multi-system, multi-frequency positioning. This module is low in power consumption, compact in size (as shown in Figure 3), and easy to integrate into vehicle-mounted and other automated equipment.
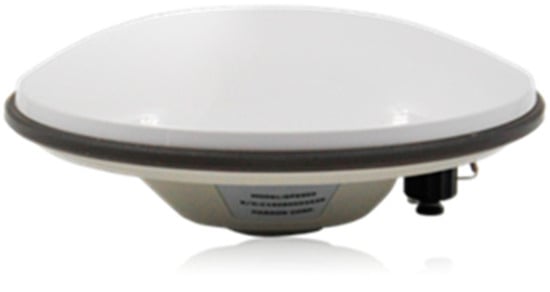
Figure 3.
Positioning System.
2.1.3. Mobile Central Control System
The collection platform serves as the central control and operating platform for the automated inspection equipment (as shown in Figure 4). It integrates a positioning data processing module, a power module, a display, and an embedded core processing platform, equipped with a large capacity to achieve large-scale storage of 4K image data. The device’s housing is modified with connection ports to enable efficient connectivity. The display supports touch screen operations, and the operating software on the display includes interfaces for algorithm parameter loading and configuration, algorithm packaging and invocation, result presentation, image list display, and processing progress display. It supports operations for road distress detection on large panel displays, effectively enhancing the efficiency of management personnel.
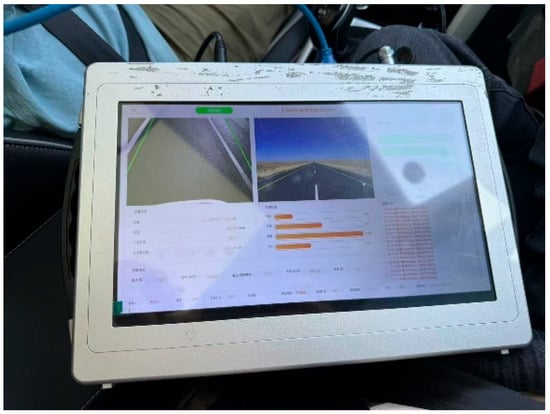
Figure 4.
Mobile central control system.
2.1.4. Vehicle-Mounted Tripod
All equipment is designed with suction cup mounts, with the industrial camera and high-definition lens installed in a spiral manner on the mount. The overall structure is affixed to the rear of the vehicle in a triangular configuration (as shown in Figure 5). A balancing device is designed between the camera and the mount at the rear of the vehicle, allowing the camera to capture images at a 30° angle to the vertical direction, thereby obtaining photos of the pavement.
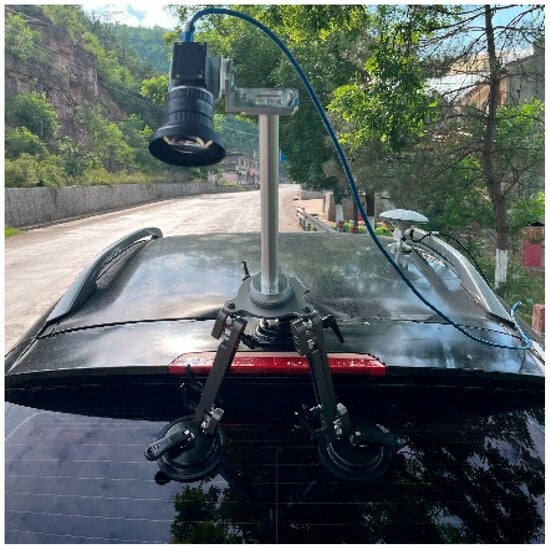
Figure 5.
Vehicle-mounted tripod.
2.2. Data Collection and Processing
The data collection site is a 100 km stretch of a high-grade highway in Shanxi Province, which serves as the project’s foundation. The data encompasses three main phases: collection, automated processing, and manual verification.
2.2.1. Data Collection
By installing the lightweight equipment on the off-road vehicle (as shown in Figure 6), the equipment is set to inspection mode. After pressing the collection button, data is collected for each lane at a speed of 40 to 80 km/h. The equipment uses a mileage-controlled collection frequency, capturing a pavement photo every 3 m of movement. Finally, the data collected by the central control device is transferred to a portable hard drive, which is then taken back to the service terminal for data processing. To ensure data uniformity, the starting stake number is set to K0 + 000 and the ending stake number to K100 + 000.
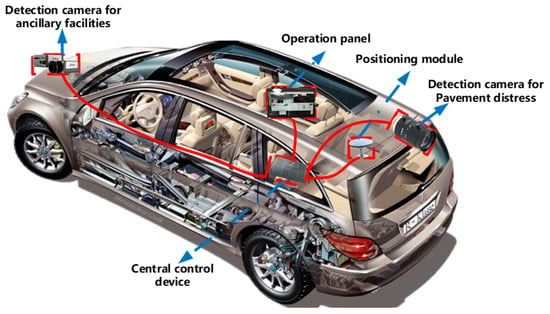
Figure 6.
Overview of collection equipment.
2.2.2. Data Processing
The equipment employs a road dimension grid mapping algorithm (as shown in Figure 7), with each grid size representing an actual dimension of 10 cm × 10 cm. Based on the principle of perspective imaging, the grids present as small trapezoids, with dense spacing in the distance and sparse spacing up close. The grid accuracy is maintained within 1 mm, with a width of 3 pixels. Subsequently, semantic segmentation extraction algorithms, image stitching algorithms, and deep learning algorithms are utilized for pavement distress detection.

Figure 7.
Road dimension grid mapping and processing.
The equipment is primarily capable of efficiently identifying transverse cracks, longitudinal cracks, patch repairs, block cracking, alligator cracking, and potholes, with the recognition results shown in Figure 8. Through comparative testing and manual field inspections of distress, the robustness exceeds 90%, meeting the accuracy requirements for lightweight detection equipment in China. Subsequently, the identified distress in the images is manually reviewed and annotated for secondary data correction.

Figure 8.
Pavement distress identification results.
By summarizing the distress distribution of 100 m and 1000 m in the distress distribution table, the distress rate (DR) is calculated to further derive the Pavement Condition Index (PCI), as shown in Figure 9. This device is an industrial camera, specifically a monocular camera, which can only identify two-dimensional surface distress. However, due to the lower data collection costs associated with this equipment, the pavement distress index derived from the processed data is defined as the Economic Pavement Surface Condition Index (EPCI). EPCI can quickly improve the overall condition level of the pavement by identifying simple two-dimensional diseases such as transverse and longitudinal joints and tortoise net cracks, and low-cost maintenance measures can be carried out through the detection data, which does not include diseases such as subsidence, which are more complex and costly. The calculation formula is shown in Formula (1) and (2).
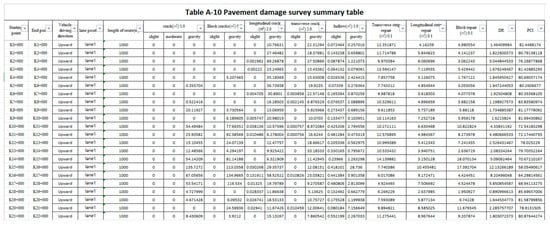
Figure 9.
Distress distribution table indicates intention.
3. Research on the Development of EPCI Indicators Under High Traffic Volume
By conducting intermittent high-frequency pavement distress detection over a period of one year on the selected 100 km of primary road (in April, June, August, and November 2024, and January and April 2025), EPCI data was obtained through data processing. A longitudinal and cross-sectional comparative analysis was performed to assess the overall condition of distress development on the same lane or different lanes.
3.1. Basic Information of the Existing Road
The project is located in the Loess Plateau, characterized by a mild climate with distinct seasons, belonging to a temperate continental monsoon climate. The average temperature in January is −4 °C, while in July, it is 25 °C. The average frost-free period is 150 days per year, with an annual average precipitation of approximately 550 mm. The selected test section was constructed in 2008, classified as a first-class road with a dual-direction six-lane configuration and a design speed of 80 km/h. The pavement structure consists of 5 cm of medium-grained asphalt concrete, 7 cm of coarse-grained asphalt concrete, a 30 cm water-stabilized gravel base, a 20 cm water-stabilized sand-gravel sub-base, and a 20 cm gravel cushion layer. The existing road has no history of major maintenance, and the surface exhibits numerous pothole repairs, transverse cracks, and longitudinal cracks, along with significant network and block cracking.
The research collected traffic volume observation data from intermittent traffic observation stations along the test section from 2019 to 2024, summarized and organized as shown in Table 1. Through analysis of the automobile traffic volume data from the observation stations, it was found that the traffic volume fluctuated significantly in 2020 due to the impact of the COVID-19 Pandemic. The latest traffic volume data indicate a cumulative volume of 21.8 × 10⁶ (vehicles) for large passenger and freight vehicles, with a traffic load classification of super heavy-duty traffic.

Table 1.
Traffic volume survey.
3.2. Analysis of the Overall Situation of Automated Detection Data
The six-lane, bidirectional highway is divided into three lanes for each direction. From the left to the right side of the central separation zone, these are designated as Lane 1 (the passing lane), Lane 2 (the driving lane), and Lane 3 (the slow lane). To compare the pavement distress conditions of different lanes, data collected during the high-temperature weather in June 2024 and low-temperature weather in January 2025 are selected as representatives for analysis. The data summary is illustrated in Figure 10, Figure 11, Figure 12 and Figure 13.
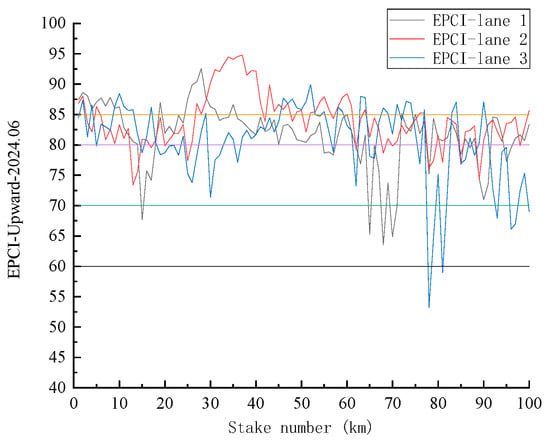
Figure 10.
Summary of upward detection data in June 2024.
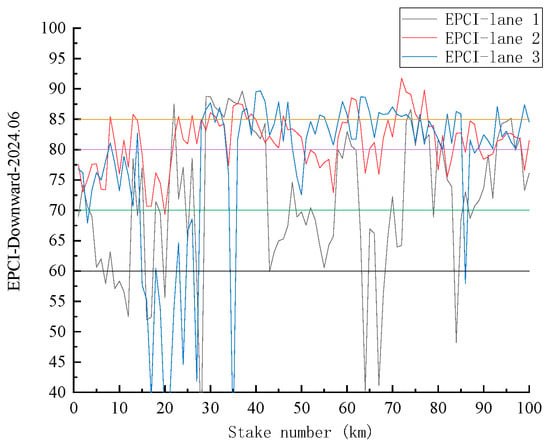
Figure 11.
Summary of downward detection data in June 2024.
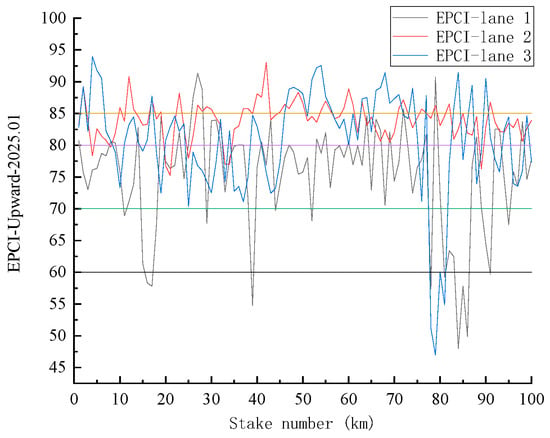
Figure 12.
Summary of upward data in January 2025.
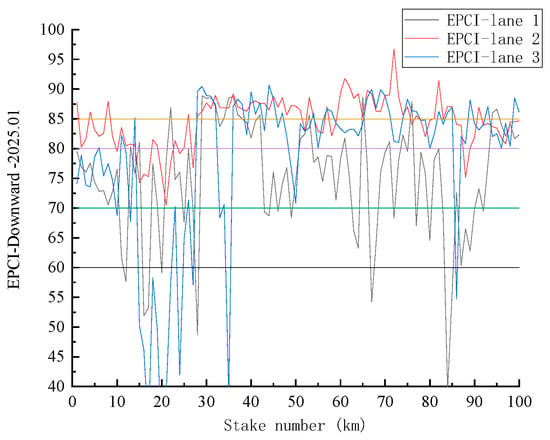
Figure 13.
Summary of downward data in January 2025.
Comparing Figure 10 and Figure 11, as well as Figure 12 and Figure 13, it can be observed that the overall EPCI for the downward lanes is poorer than that for the upward lanes, particularly for Lane 3, which primarily accommodates heavy vehicles. Field surveys indicated that coal transport trucks predominantly travel in the downward direction within Shanxi Province, while the upward direction generally returns empty. Therefore, despite routine maintenance being performed on various road segments, the downward road conditions remain poorer than those of the upward lanes.
Additionally, comparing Figure 10 and Figure 12, as well as Figure 11 and Figure 13, reveals that the EPCI for January 2025 is overall poorer than that for June 2024. The analysis suggests that, despite routine maintenance, the road surface conditions have deteriorated over the six-month period, exacerbated by a freeze–thaw cycle. However, due to uncertainties related to the intensity and timing of maintenance, it is not possible to draw specific or accurate conclusions regarding the development of road surface distresses.
Further data filtering reveals specific information as shown in Table 2. Most EPCI fall between 70 and 85. In June 2024, the proportion of EPCI below 70 for the upward direction was 3.7%, while in January 2025, this figure rose to 7.7%. In the downward direction for June 2024, the percentage of EPCI below 70 was 20.3%, which decreased to 14.4% in January 2025. This confirms that the road conditions in the upward direction are generally better than those in the downward direction.

Table 2.
Summary of data selection for each Lane.
On the other hand, research indicates that the mileage with EPCI below 70 in the downward direction in June 2024 was significant (for instance, segments K5 + 000 to K15 + 000, K40 + 000 to K60 + 000, and K65 + 000 to K75 + 000). Consequently, the maintenance unit invested substantial resources in the upkeep of these segments. Therefore, despite data degradation over six months, the overall EPCI for January 2025 remained relatively better.
3.3. Analysis of the Development of Pavement Distress Conditions
Based on the data analysis from the previous section and confirmation with the local maintenance unit, it was found that the maintenance efforts for Lane 1 and Lane 3 differ from those for Lane 2. Consequently, the data for Lane 1 and Lane 3 exhibit significant fluctuations, while Lane 2 remains relatively stable. Stable data sources are conducive to more in-depth mining of disease subcontracting, and local self-test can only detect lane 2 as the supporting data for maintenance decision-making. As a result, this section focuses on re-analyzing the data for Lane 2.
From Figure 14 and Figure 15, it can be observed that the data for Lane 2 across different months have a high overlap rate, and the intervals of the data show a generally consistent trend in curve direction. However, it is evident from the images that each EPCI curve does not exhibit a successive decreasing trend; instead, it demonstrates a wave-like decay. By calculating the differences between the data from each inspection, it was found that only a few instances showed a continuous decline over three consecutive measurements. To verify the effectiveness of analyzing older sections using shorter intervals, PCI inspection data from the years 2020, 2021, and 2022 during the COVID-19 pandemic were reviewed. Figure 16 and Figure 17 present the national inspection PCI values for Traffic Lane 2 over the past three years.
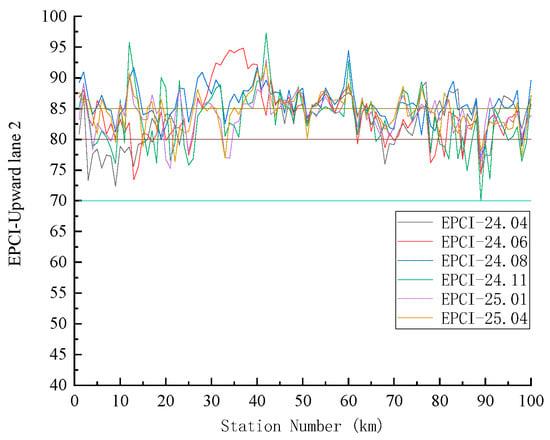
Figure 14.
EPCI in the upward direction at different times.
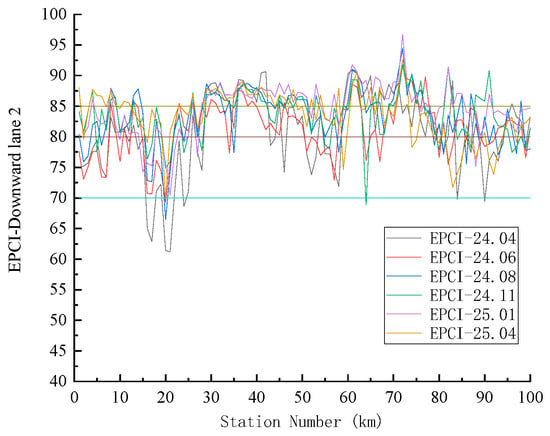
Figure 15.
EPCI in the downward direction at different times.
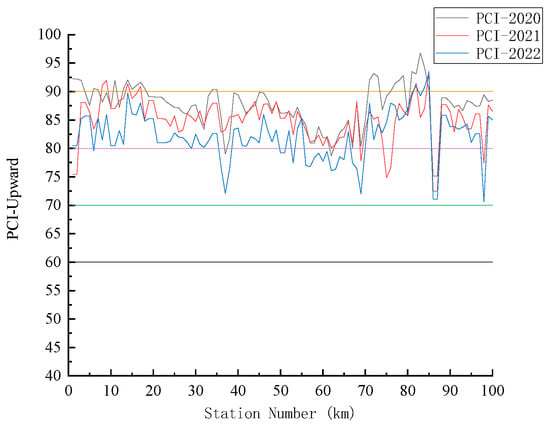
Figure 16.
PCI in the upward direction at different times.
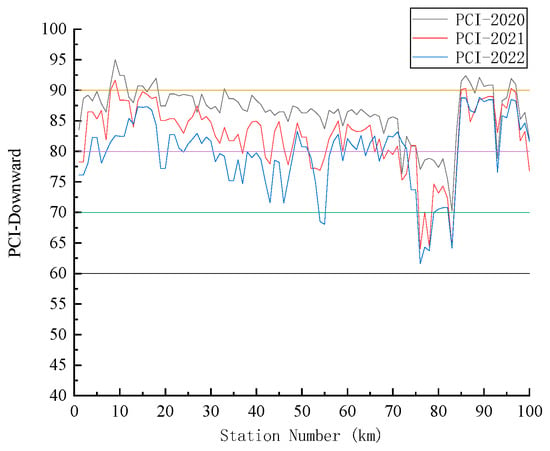
Figure 17.
PCI in the downward direction at different times.
By analyzing Figure 16 and Figure 17, it is observed that in the past three years, the reduction in road traffic volume due to the COVID-19 pandemic has resulted in minimal maintenance efforts for the pavement. Additionally, the effects of annual freeze–thaw cycles and ultraviolet aging have led to a clear trend in the data, indicating a gradual deterioration in PCI values over time.
Further data analysis reveals that the differences in upward PCI data between 2020 and 2021 and 2021–2022 are 5 points apart, with percentages of 83% and 75%, respectively. For the downward direction, the corresponding percentages are 73% and 77%. The average PCI deterioration for 100 km in the upward direction is 2.42 points and 2.84 points for the two periods, while in the downward direction, it is 4.73 points and 1.73 points. This suggests that the extended time interval and minimal maintenance efforts provide a viable basis for studying the development of pavement distress. It is also recommended to focus on segments with an EPCI difference in more than 5 points and to enhance maintenance efforts to maintain a good service level for the pavement.
On the other hand, the variability in daily maintenance efforts also confirms that conducting rapid inspections of asphalt pavements with a service life of several years at a frequency of 2–3 months poses certain challenges for analyzing the development of pavement distress. It is believed that the differences in the intensity of daily maintenance play a decisive role in the pavement deterioration data. In other words, suspending routine maintenance or collecting all maintenance records is a necessary condition for conducting high-frequency inspections to study the development of pavement distress.
4. Research on Distress Distribution of Automated Detection Under Heavy-Duty Traffic
4.1. Research on Distress Distribution of Automated Detection Under Heavy-Duty Traffic
To study the distress distribution across different lanes, a summary of the various types of distresses mentioned in Section 3.2 has been compiled. The statistics for the different types of distress across the lanes are presented in Table 3 and Table 4.

Table 3.
Statistics of distresses in each lane for upward and downward directions in June 2024.

Table 4.
Statistics of distresses in each lane for upward and downward directions in January 2025.
Based on the traffic volume data, it can be observed that the number of distress in Lane 1 is not significantly different from that in Lane 3 due to the particularly large number of small and medium-sized passenger vehicles. For analytical convenience, the distribution chart of distress proportions has been summarized in Figure 18 and Figure 19. Referring to Table 3 and the data in Figure 18, it is found that in June 2024, the total area of distress in the upward direction reached 19,279.8 m2, primarily consisting of longitudinal and transverse cracks, which accounted for 57.21% of the total disease area. The proportion of network cracks was relatively low at 11.77% of the total disease area. In the downward direction, the total area of distress was 45,111.3 m2, with longitudinal and transverse cracks comprising 54.94% of the total disease area, while network cracks had a relatively high proportion of 34.04% of the total disease area. Referring to Table 4 and the data in Figure 19, it is noted that in January 2025, the total area of distress in the upward direction reached 26,761 m2, mainly consisting of longitudinal and transverse cracks, which accounted for 38.9% of the total disease area. The proportion of network cracks was relatively low at 36.6% of the total disease area. In the downward direction, the total area of distress was 37,015.1 m2, with network cracks making up 48.38% of the total disease area, while longitudinal and transverse cracks also had a relatively high proportion of 36.05% of the total disease area.
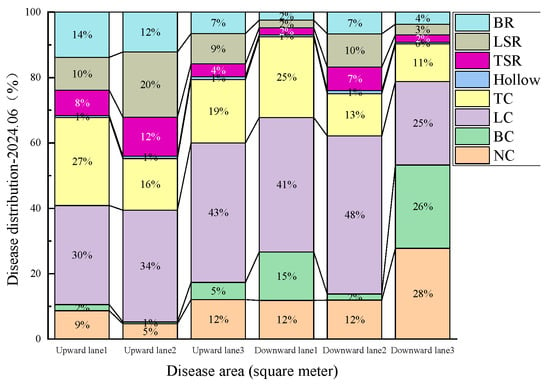
Figure 18.
Distress distribution chart for June 2024.
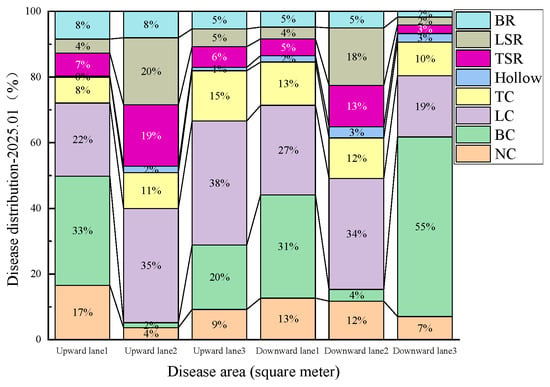
Figure 19.
Distress distribution chart for January 2025.
From the above statistical data, it can be observed that the total distress area in the downward direction of the test section is larger than that in the upward direction. Moreover, the total distress area in each lane of the downward direction exceeds that of the corresponding lane in the upward direction, which corresponds to the higher number of heavy-loaded vehicles in the downward direction. Additionally, due to the prevalence of heavy-loaded vehicles in the downward direction, lane 3 (i.e., the slow lane) in the downward direction exhibits more severe network and block cracks compared to lanes 1 and 2. By further comparing the combined data of network and block cracks, as in June 2024 (8482 m2) and January 2025 (10,073.3 m2), it is inferred that, under continuous traffic loading over six months, pavement distress continues to develop. However, due to substantial maintenance efforts, such as crack filling, patching, or preventive maintenance particularly in sections K5 + 000~K15 + 000, K40 + 000~K60 + 000, and K65 + 000~K75 + 000 the difficulty of EPCI analysis increases, making it challenging to further explore underlying patterns.
4.2. Analysis of Distress Development in the Same Lane
To study the progression of distress over different time periods, various types of distress in the sections mentioned in Section 3.2 were compiled. The statistics of various types of distress in Traffic Lane 2 over different time periods are shown in Table 5 and Table 6.

Table 5.
Statistics of various types of distress in upward lane 2 at different times.

Table 6.
Statistics of distresses in each lane for upward and downward directions in January 2024.
For analytical convenience, the data from the above table were summarized in the distress proportion distribution charts shown in Figure 20 and Figure 21.
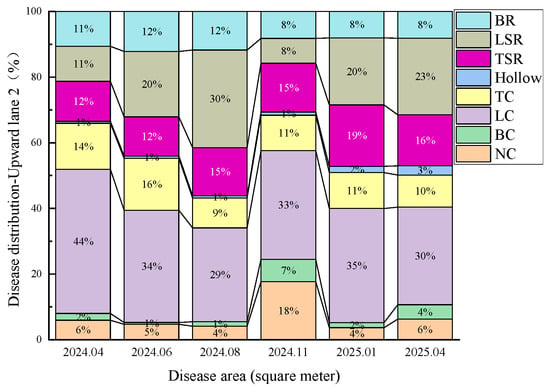
Figure 20.
Distress distribution for upward lane 2.
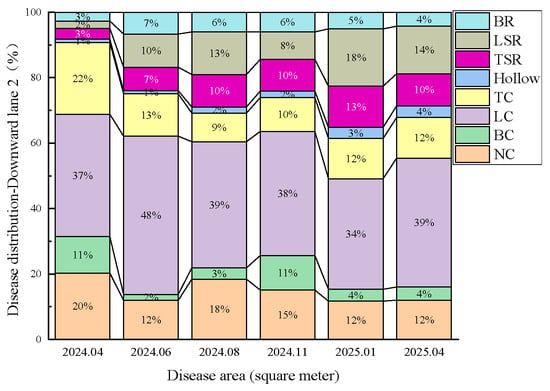
Figure 21.
Distress distribution for downward lane 2.
According to Section 3.3, network cracks and block cracks exhibit more distinct distress characteristics, as cracks may develop into block cracks, and block cracks can further deteriorate into more severe network cracks. From the data distribution of the upward direction in Lane 2, distress shows an overall downward trend from April to August 2024, indicating that higher temperatures during this period allowed for more intensive maintenance efforts. However, as temperatures dropped sharply in November 2024 and temperature fluctuations increased, the distress area suddenly expanded. Following this, as maintenance efforts intensified, the distress area decreased accordingly. Referring to Table 6, the downward direction of Lane 2 shows relatively stable distress quantities over the following months, likely due to substantial maintenance efforts in April 2024 when the initial distress volume was high. By comprehensively analyzing the distress areas in both upward and downward directions over different periods, combined with the EPCI from Figure 14 and Figure 15, it is recommended that the maintenance unit control the distress area to 400 m2 per lane per kilometer for the upward direction and 500 m2 per lane per kilometer for the downward direction. This level of maintenance is expected to maintain the EPCI at around 80 points and is considered the most economical approach.
4.3. Analysis of Pavement Distress Maintenance Points and Measures
Due to the lack of comprehensive monthly maintenance data for each kilometer of the surveyed section, this study was unable to conduct further analysis of the distress. However, based on the summarized distress data and considering local project conditions, the study aims to analyze the main causes of two major types of distress and provide reference suggestions for maintenance points or measures for aged asphalt pavements on high-grade roads in Shanxi Province.
Firstly, by comparing the distress areas in Lanes 1 and 3 and the traffic volume, it was observed that, when the volume of small and medium passenger vehicles is approximately three times that of large trucks, the pavement condition indices of the passing lane and slow lane are relatively similar. This suggests that the fatigue and kneading effects under heavy loads on aged asphalt pavement are equally significant. For special sections, such as coal mine plants or even entire directional lanes, it is recommended to use new materials and technologies, such as high-modulus asphalt mixtures (Compared with the conventional asphalt mixture, the shape change is small for the same pressure, and it is suitable for heavy load, high temperature or large traffic sections.), to address the deficiencies in pavement structure.
Secondly, for transitional months where temperatures shift, especially from high to low, automated equipment monitoring shows that EPCI are relatively low in winter. Due to thermal expansion and contraction, cracks become more prominent at lower temperatures than at higher ones, and crack filling in winter may result in re-cracking at low temperatures. Therefore, it is recommended to use high-performance cold asphalt mixtures to repair block cracks or network cracks in winter, thereby ensuring all pavement indicators meet the required standards.
5. Conclusions
This study, lightweight inspection equipment was used to perform frequent distress collection on the study sections, and for the first time, the EPCI (Economic Pavement Surface Condition Index) is proposed to assess pavement distress conditions. The study conducted six high-frequency data collections over one year on the designated road sections. EPCI evaluations were carried out on each lane in different driving directions, summarizing eight types of pavement distress, including alligator cracking, block cracking, longitudinal and transverse cracking, potholes, longitudinal and transverse crack repairs, and block repairs. The development trends of EPCI and the distribution of pavement distress were analyzed. The following conclusions are obtained:
- (1)
- When maintenance records for the section are missing, high-frequency data collection using lightweight inspection equipment for aged asphalt pavements poses challenges for analyzing the deterioration of pavement distress or establishing decay models. However, on the other hand, for sections with an EPCI difference in more than 5 points, targeted reinforcement of maintenance efforts can help maintain a good service level of the pavement.
- (2)
- Under high traffic volumes, the distribution of distress in the slow lane shows that network cracks and block cracks are the most prevalent, while the passing lane and driving lane exhibit the highest occurrence of longitudinal and transverse cracks. In other words, the condition of the passing lane and slow lane is poorer than that of the driving lane. Therefore, the variability in maintenance efforts results in significant fluctuations in the EPCI of the passing and slow lanes, while the EPCI of the driving lane remains relatively stable.
- (3)
- By controlling the distress area in the upward direction to 400 m2 per lane per kilometer and in the downward direction to 500 m2 per lane per kilometer, the maintenance unit can maintain the EPCI at around 80 points, which is considered the most economical maintenance measure.
6. Discussion
- (1)
- For the old asphalt pavement that has been in service for many years, it is recommended that the management and maintenance unit divide the road maintenance ledger by kilometer. Through the data obtained by the lightweight detection equipment, a database or disease library is established to correct the data collected by the lightweight detection equipment, so as to study the decay model of the old asphalt pavement damage and lay the foundation for the realization of fine maintenance.
- (2)
- For newly constructed sections or sections that have undergone restorative maintenance projects, high-frequency data collection and analysis using lightweight inspection equipment should be conducted within the design lifespan, considering different regions, pavement structures, and traffic load levels. This will help establish pavement distress deterioration models to analyze the optimal maintenance timing for different sections. Additionally, by calculating the distress rate, the area requiring repair can be determined, and maintenance funding can be estimated. In addition, the regions with similar climatic environments are classified, and the road sections with the same pavement structure unify their disease decay models to quickly analyze or predict the approximate disease situation of the target paragraph at any time.
- (3)
- In order to improve the accuracy of the data, more research will be invested in the future research, and the same lane of the research section will be detected in different time and space for many times, so as to analyze the data in the entity engineering application in more detail. In addition, EPCI is a new indicator. In future research, it is necessary to establish a complete system of EPCI as an indicator to judge the quality of road conditions.
Author Contributions
Formal analysis, Y.D.; Methodology, Y.D.; Resources, Y.D. and Y.H.; Supervision, Y.D., Y.H., X.C., X.T. and K.D.; Validation, Y.D.; Writing—review and editing, H.Z. and Y.D. All authors have read and agreed to the published version of the manuscript.
Funding
This research received no external funding.
Informed Consent Statement
Informed consent was obtained from all subjects involved in the study.
Data Availability Statement
The data used to support the findings of this study are included within the article.
Acknowledgments
Thanks for China Highway Engineering Consulting Corporation support.
Conflicts of Interest
Author Yuanshuai Dong, Yun Hou and Xinlong Tong, Xiangjun Cheng were employed by the company China Highway Engineering Consulting Corporation and China Highway Engineering Consulting Corporation DATA Co., Ltd. The remaining authors declare that the research was conducted in the absence of any commercial or financial relationships that could be construed as a potential conflict of interest.
References
- Sermanet, P.; Eigen, D.; Zhang, X.; Mathieu, M.; Fergus, R.; LeCun, Y. Overfeat: Integrated recognition, localization and detection using convolutional networks. In Proceedings of the 2nd International Conference on Learning Representations, ICLR 2014, Banff, AB, Canada, 14–16 April 2014. [Google Scholar]
- Girshick, R.; Donahue, J.; Darrell, T.; Malik, J. Rich feature hierarchies for accurate object detection and semantic segmentation. In Proceedings of the 27th IEEE Conference on Computer Vision and Pattern Recognition, CVPR 2014, Columbus, OH, USA, 23–28 June 2014; IEEE Computer Society: Washington, DC, USA, 2014. [Google Scholar]
- Uijlings, J.R.R.; van de Sande, K.E.A.; Gevers, T.; Smeulders, A.W.M. Selective Search for Object Recognition. Int. J. Comput. Vis. 2013, 104, 154–171. [Google Scholar] [CrossRef]
- He, K.; Zhang, X.; Ren, S.; Sun, J. Spatial Pyramid Pooling in Deep Convolutional Networks for Visual Recognition. IEEE Trans. Pattern Anal. Mach. Intell. 2015, 37, 1904–1916. [Google Scholar] [CrossRef]
- Girshick, R. Fast R-CNN. In Proceedings of the 15th IEEE International Conference on Computer Vision, ICCV 2015, Santiago, Chile, 11–18 December 2015; Institute of Electrical and Electronics Engineers Inc.: New York, NY, USA, 2015. [Google Scholar]
- Ren, S.; He, K.; Girshick, R.; Sun, J. Faster R-CNN: Towards Real-Time Object Detection with Region Proposal Networks. IEEE Trans. Pattern Anal. Mach. Intell. 2017, 39, 1137–1149. [Google Scholar] [CrossRef] [PubMed]
- Redmon, J.; Divvala, S.; Girshick, R.; Farhadi, A. You only look once: Unified, real-time object detection. In Proceedings of the 29th IEEE Conference on Computer Vision and Pattern Recognition, CVPR 2016, Las Vegas, NV, USA, 26 June–1 July 2016; IEEE Computer Society: Washington, DC, USA, 2016. [Google Scholar]
- Liu, W.; Anguelov, D.; Erhan, D.; Szegedy, C.; Reed, S.; Fu, C.-Y.; Berg, A.C. SSD: Single shot multibox detector. In Proceedings of the 14th European Conference on Computer Vision, ECCV 2016, Amsterdam, The Netherlands, 8–16 October 2016; Springer: Berlin/Heidelberg, Germany, 2016. [Google Scholar]
- Ravi, R.; Habib, A.; Bullock, D. Pothole Mapping and Patching Quantity Estimates using LiDAR-Based Mobile Mapping Systems. Transp. Res. Rec. J. Transp. Res. Board 2020, 2674, 124–134. [Google Scholar] [CrossRef]
- Fakhri, S.A.; Satari Abrovi, M.; Zakeri, H.; Safdarinezhad, A.; Fakhri, A. Pavement crack detection through a deep-learned asymmetric encoder-decoder convolutional neural network. Int. J. Pavement Eng. 2023, 24, 2255359. [Google Scholar] [CrossRef]
- Sami, A.A.; Sakib, S.; Deb, K.; Sarker, I.H. Improved YOLOv5-Based Real-Time Road Pavement Distress Detection in Road Infrastructure Management. Algorithms 2023, 16, 452. [Google Scholar] [CrossRef]
- Hedeya, M.A.; Samir, E.; El-Sayed, E.; El-Sharkawy, A.A.; Abdel-Kader, M.F.; Moussa, A.; Abdel-Kader, R.F. A Low-Cost Multi-sensor Deep Learning System for Pavement Distress Detection and Severity Classification. In Proceedings of the 8th International Conference on Advanced Machine Learning and Technologies and Applications (AMLTA2022), Cairo, Egypt, 5–7 May 2022; pp. 21–33. [Google Scholar]
- Matarneh, S.; Elghaish, F.; Al-Ghraibah, A.; Abdellatef, E.; Edwards, D.J. An automatic image processing based on Hough transform algorithm for pavement crack detection and classification. Smart Sustain. Built Environ. 2025, 14, 1–22. [Google Scholar] [CrossRef]
- Redmon, J.; Farhadi, A. YOLO9000: Better, faster, stronger. In Proceedings of the 30th IEEE Conference on Computer Vision and Pattern Recognition, CVPR 2017, Honolulu, HI, USA, 21–26 July 2017; Institute of Electrical and Electronics Engineers Inc.: New York, NY, USA, 2017. [Google Scholar]
- Law, H.; Deng, J. CornerNet: Detecting Objects as Paired Keypoints. Int. J. Comput. Vis. 2020, 128, 642–656. [Google Scholar] [CrossRef]
- Zhang, A.A.; Shang, J.; Li, B.; Hui, B.; Gong, H.; Li, L.; Zhan, Y.; Ai, C.; Niu, H.; Chu, X.; et al. Intelligent pavement condition survey: Overview of current researches and practices. J. Road Eng. 2024, 4, 257–281. [Google Scholar] [CrossRef]
- Wang, S.; Cai, B.; Wang, W.; Li, Z.; Hu, W.; Yan, B.; Liu, X. Automated detection of pavement distress based on enhanced YOLOv8 and synthetic data with textured background modeling. Transp. Geotech. 2024, 48, 101304. [Google Scholar] [CrossRef]
- Yuan, B.; Sun, Z.; Pei, L.; Li, W.; Zhao, K. Shuffle Attention-Based Pavement-Sealed Crack Distress Detection. Sensors 2024, 24, 5757. [Google Scholar] [CrossRef] [PubMed]
- Wang, R.; Wang, C.; Chu, X. Research Progress on Pavement Distress Image Recognition. J. Jilin Univ. Technol. (Eng. Ed.) 2002, 19, 91–97. [Google Scholar]
- Li, L.; Sun, L.; Chen, C. Edge Detection Methods Suitable for Pavement Distress Image Processing. J. Tongji Univ. (Nat. Sci. Ed.) 2011, 39, 688–692. [Google Scholar]
- Shi, L.; Dang, L.; Yang, L.; Shi, S. Pavement Distress Image Recognition Method Based on Manifold Features Fusion. Comput. Appl. Softw. 2016, 33, 150–152, 196. [Google Scholar]
- Zhang, Y.; Li, Q.; Xue, F.; Yu, L. Design of a Pavement Crack Detection System Based on Jetson TX2. Highway 2023, 12, 337–344. [Google Scholar]
- Chen, H.; Wang, J. Infrared Asphalt Pavement Crack Detection Method Based on Improved YOLOv5. Telev. Technol. 2023, 47, 43–50. [Google Scholar]
- Zhou, Y.; Zhang, J.; Cao, J.; Liu, Y.; Zhang, H. Research on Error Compensation Algorithm for Pavement Pothole Detection Based on 3D Laser Technology. J. Highw. Traffic Technol. 2023, 40, 17–24. [Google Scholar]
- Wu, C.; Ti, J.; Ma, J. Digitalization of Asphalt Pavement Maintenance Information Based on Holographic 3D Detection Technology. Guangdong Highw. Traffic 2023, 49, 1–7. [Google Scholar]
- Chen, M.; Zhang, M.; Liu, Z.; Han, Y.; Gu, S. Design and Implementation of a Lightweight Portable Intelligent Pavement Distress Detection System. Eng. Qual. 2022, 40, 74–79. [Google Scholar]
- Chen, X.; Gao, H.; Yang, Z.; Kong, T.; Che, R. Research on Pavement Crack Distress Detection and Recognition Based on Improved YOLOv5s. Softw. Guide 2024, 23, 206–212. [Google Scholar]
- Wang, Y.; Zhou, C.; Wang, Y.; Li, W. Digital Research on Pavement Distress Based on Improved YOLOv8 Algorithm. Highway 2024, 69, 350–356. [Google Scholar]
- Zhang, H.; Dong, Y.; Hou, Y.; Cheng, X.; Xie, P.; Di, K. Research on Asphalt Pavement Surface Distress Detection Technology Coupling Deep Learning and Object Detection Algorithms. Infrastructures 2025, 10, 72. [Google Scholar] [CrossRef]
Disclaimer/Publisher’s Note: The statements, opinions and data contained in all publications are solely those of the individual author(s) and contributor(s) and not of MDPI and/or the editor(s). MDPI and/or the editor(s) disclaim responsibility for any injury to people or property resulting from any ideas, methods, instructions or products referred to in the content. |
© 2025 by the authors. Licensee MDPI, Basel, Switzerland. This article is an open access article distributed under the terms and conditions of the Creative Commons Attribution (CC BY) license (https://creativecommons.org/licenses/by/4.0/).