You are currently viewing a new version of our website. To view the old version click .
Infrastructures
  • Article
  • Open Access

8 November 2025

Chloride Resistance of High-Strength Concrete Subjected to Different Curing Conditions and Chloride Concentrations

,
,
and
1
College of Engineering, Fujian Jiangxia University, Fuzhou 350108, China
2
Engineering Research Center of Phosphorus Resources Development and Utilization of Ministry of Education, Wuhan 430000, China
3
College of Civil Engineering, Fuzhou University, Fuzhou 350108, China
4
Blooms Union Group Co., Ltd., Wenzhou 325000, China
This article belongs to the Section Infrastructures Materials and Constructions

Abstract

High-strength concrete (HSC) is widely used in coastal regions, but its durability and structural safety is threatened by chloride ingress in marine environments. This study investigates the effects of different curing methods, normal, steam, and high-temperature autoclave on the chloride resistance of HSC using the electric flux test. A critical chloride concentration of 4.5% was identified, and accelerated deterioration tests were conducted to evaluate mechanical properties development (compressive strength, elastic modulus, toughness, specific toughness) under the various curing conditions. Additionally, the development of hydration products and microstructural characteristics were analyzed to elucidate the mechanisms underlying the observed differences. The results indicate that steam and autoclave curing enhance cement hydration and the initial mechanical properties of HSC but also increase permeability and susceptibility to chloride ion penetration compared to normal curing. Chloride penetration was found to be most severe at moderate chloride concentrations (~4.5%), while higher concentrations resulted in reduced ion migration. Although intensive curing under elevated temperature and pressure improves early strength and stiffness, it accelerates mechanical degradation under chloride exposure, highlighting a trade-off between short-term performance and long-term durability.

1. Introduction

High-strength concrete pipe piles (HSC piles) are hollow, cylindrical components with a uniform cross-section widely used in foundation engineering []. They are produced by tensioning steel reinforcement, casting high-strength concrete, and forming the pile through centrifugal compaction. After initial steam curing at ambient temperature, the prestress is released and the pile is demolded, followed by autoclave curing to enhance strength and durability []. HSC piles can be installed into the ground using either static pressing or hammer driving methods to serve as deep foundation elements. They offer several advantages, including reliable quality, cost-effectiveness, strong adaptability, and ease of construction []. As a result, HSC piles are widely used in various construction projects, such as buildings [], ports and wharves [], dams [], railways and bridges [], particularly in coastal regions [,].
However, with the extended service life of HSC piles, the degradation of concrete durability has increasingly emerged as a critical concern in recent years. This issue is particularly pronounced in HSC pile foundations subjected to harsh marine environments, where the presence of chloride ions, sulfate attack, and cyclic wetting and drying significantly accelerate the deterioration of concrete. In some instances, extensive cracking, spalling, and loss of structural integrity have been reported in less than a decade of service life, prompting the need for premature maintenance or even complete replacement of affected piles [,]. Moreover, it has shown that the service life of marine reinforced concrete structures varies markedly with exposure conditions, being on average 2.76 times longer in the fully buried zone and 1.37 times longer in the marine tidal zone than in the semi-buried zone, thereby underscoring the strong influence of chloride ingress severity on durability performance []. Therefore, improving the long-term durability of HSC piles, especially in aggressive environmental conditions, has become a key focus of current research and engineering practice. This includes the development and implementation of advanced material technologies, enhanced design methodologies, and more effective protective measures to mitigate degradation mechanisms and extend the service life of HSC pile structures.
Among these efforts, curing plays a particularly vital role. Curing is a critical post-casting step in concrete construction, aimed at facilitating the hydration of cement by maintaining appropriate environmental conditions. This process ensures that the concrete retains optimal temperature and humidity levels during the early stages of hardening, thereby enabling it to achieve the desired performance criteria. Proper curing is essential for the development of concrete properties, as it significantly influences strength gain, durability, and overall material integrity []. During the curing period, maintaining thermal equilibrium between the interior and exterior of the concrete, or minimizing temperature gradients, is crucial to reducing the risk of surface cracking [,]. Well-executed curing leads to notable improvements in concrete performance, including enhanced mechanical strength [], increased resistance to environmental degradation [], and a more refined and denser microstructure [].
Building upon the critical role of curing in enhancing durability, recent research efforts have increasingly focused on understanding how such factors influence the long-term performance of HSC. In particular, the resistance of HSC to chloride ion ingress, a key parameter governing the corrosion-induced deterioration of reinforced concrete structures []. These investigations mainly include the elucidation of chloride ion transport mechanisms [] and the determination of chloride diffusion coefficients [,]. These studies aim to provide a comprehensive understanding of how chloride ions migrate through the concrete matrix, interact with cement hydration products, and ultimately reach the reinforcement, leading to depassivation and corrosion. Furthermore, researchers are exploring the influence of material composition (e.g., water-to-binder ratio, type of supplementary cementitious materials) [], curing conditions [], environmental exposure (e.g., temperature, humidity, and wet-dry cycles) [,], and microstructural characteristics (e.g., pore structure and connectivity) [] on chloride transport behavior. For example, it was shown that properly controlled initial curing (immersion in water at 20 ± 2 °C for 7 days followed by 21 days at 50 ± 5% relative humidity) resulted in chloride penetration coefficients within 10% of those obtained under wet curing conditions (immersion in water at 20 ± 2 °C for 28 days) []. Additionally, cement samples exhibit increasing porosity in the order of standard curing < steam curing < autoclave curing, which decreases chloride binding capacity and promotes greater chloride ingress, thereby increasing the risk of reinforcement corrosion []. The findings from such studies contribute to the development of more durable concrete formulations and predictive models, which are essential for assessing service life and designing effective corrosion mitigation strategies in aggressive environments. However, the combined effects of varying chloride ion concentrations and different curing regimes on the chloride penetration resistance of HSC have not yet been systematically characterized or quantitatively assessed.
To address this knowledge gap, the present study systematically investigates the effects of different curing regimes and a wide range of chloride concentrations on the chloride resistance of HSC piles. Three curing conditions were evaluated: standard curing, steam curing, and autoclave curing. Chloride exposure was simulated using eight concentration levels: 0%, 1.5%, 3.0%, 4.5%, 6.0%, 7.5%, 9.0%, and 36.5%. Chloride ion transport was characterized by using the electric flux method in accordance with standardized test protocols. Following the identification of critical chloride thresholds, accelerated corrosion tests were performed on HSC specimens using rapid chloride migration test (RCM) for durations of 0, 1, 3, 5, and 7 days to simulate progressive levels of chloride-induced degradation. Compressive strength tests were subsequently conducted on these deteriorated specimens to evaluate the degradation patterns of the mechanical properties under different levels of chloride attack. To gain further insight into the material changes associated with chloride ingress and curing regimes, X-ray diffraction (XRD) analysis was employed to characterize the crystalline phases of hydration products. In addition, field emission scanning electron microscopy (FE-SEM) was utilized to examine the microstructural morphology of the hydration products and the evolution of the pore structure.

2. Materials and Methods

2.1. Materials and Sample Preparation

Ordinary Portland cement (P·II 52.5), produced by Huarun Co., Ltd. Dongguang, Guangdong, Cina, was used in this study. Its chemical composition, determined by X-ray fluorescence (XRF), is presented in Table 1. The fineness, measured as the residue on a 45 μm sieve, and the specific surface area were 2.0% and 335 m2/kg, respectively, as provided by the manufacturer. The P·II 52.5 cement used in this study has a compressive strength of at least 23 MPa at 3 d and 52.5 MPa at 28 d. When used to produce C50 concrete, the corresponding splitting tensile strength was approximately 1.5–2.5 MPa at 3 d and around 3.5 MPa at 28 d. Silica sand powder was used to partially replace cement. It had a fineness of 2.1% (residue on 80 μm sieve), a specific surface area of 420 m2/kg, and a density of 2.7 g/cm3. The silica (SiO2) content of the powder was 93.3%. River sand and limestone gravel were used as fine and coarse aggregates, respectively. The river sand had a fineness modulus of 2.7 and a bulk density of 2690 kg/m3. The bulk density of the limestone gravel was 2700 kg/m3. CSP-12 early-strength polycarboxylic acid high-performance water reducer, produced by Quanzhou Senrui New Materials Co., Ltd., Quanzhou, Fujian, China was used. Reagent-grade sodium chloride (NaCl, 99.99%, Shanghai Sinopharm Chemical Reagent Co., Ltd., Shanghai, China), calcium hydroxide (Ca(OH)2, 97%, Guangdong Xilong Science Co., Ltd., Shantou, Guangdong, China) and sodium hydroxide (NaOH, 97%, Tianjin Hengyuan Chemical Reagent Manufacturing Co., Ltd., Tianjin, China) were used in the electrical flux test.
Table 1. Chemical composition of cement.
The mixed design of concrete used in this study is detailed in Table 2. It consists of 322 kg/m3 of Ordinary Portland cement, 138 kg/m3 of silica sand powder as a partial cement replacement, 660 kg/m3 of river sand as fine aggregate, and 1194 kg/m3 of limestone gravel as coarse aggregate. The water content was 126 kg/m3, corresponding to a water-to-binder ratio of 0.27. Silica sand was incorporated to enhance the mechanical and durability properties of the concrete. Previous studies have shown that partial replacement of cement with silica sand can improve compressive strength, splitting tensile strength, and durability, including resistance to water absorption and chemical attack [,,]. The water reducer was added at a dosage of 10.1 kg/m3 to enhance workability while maintaining a low water content. This mix was designed to achieve high strength and durability while incorporating supplementary fine materials to reduce the clinker content and environmental impact of the concrete. The cement, silica sand powder, river sand, and limestone gravel listed in Table 2 were initially mixed in a drum mixer for 1 min. The water reducer, pre-dissolved in the mixing water, was then added to the dry mixture, followed by 3 min of additional mixing. After a 1 min rest period, mixing continued for another 2 min. The fresh concrete was immediately cast into molds and compacted on a standard vibrating table to remove entrapped air and ensure uniform density. The specimens were then covered with plastic sheets and stored at room temperature (approximately 23 ± 2 °C) before being subjected to the different curing regimes described in Section 2.2.1. A total of 45 concrete cylinders measuring 100 mm in diameter and 200 mm in height were cast for the mechanical properties test. Additionally, 36 concrete cylinders with dimensions of 100 mm in diameter and 50 mm in height were prepared for the electric flux test.
Table 2. Mix proportions of HSC (kg/m3).

2.2. Methods

2.2.1. Curing Conditions

Three curing regimes were considered in this study: normal curing, steam curing, and autoclave curing. The concrete specimens subjected to these curing regimes are designated as NC, SC, and AC, respectively. For normal curing, specimens were demolded 24 h after casting and then cured at 23 ± 2 °C with a relative humidity above 95%. For steam curing, specimens were placed in a steam curing chamber one hour after the final setting of the concrete. The temperature was increased to 85 ± 5 °C over 1.5 h, maintained at that level for 4 h, and then allowed to cool naturally to room temperature after opening the chamber.
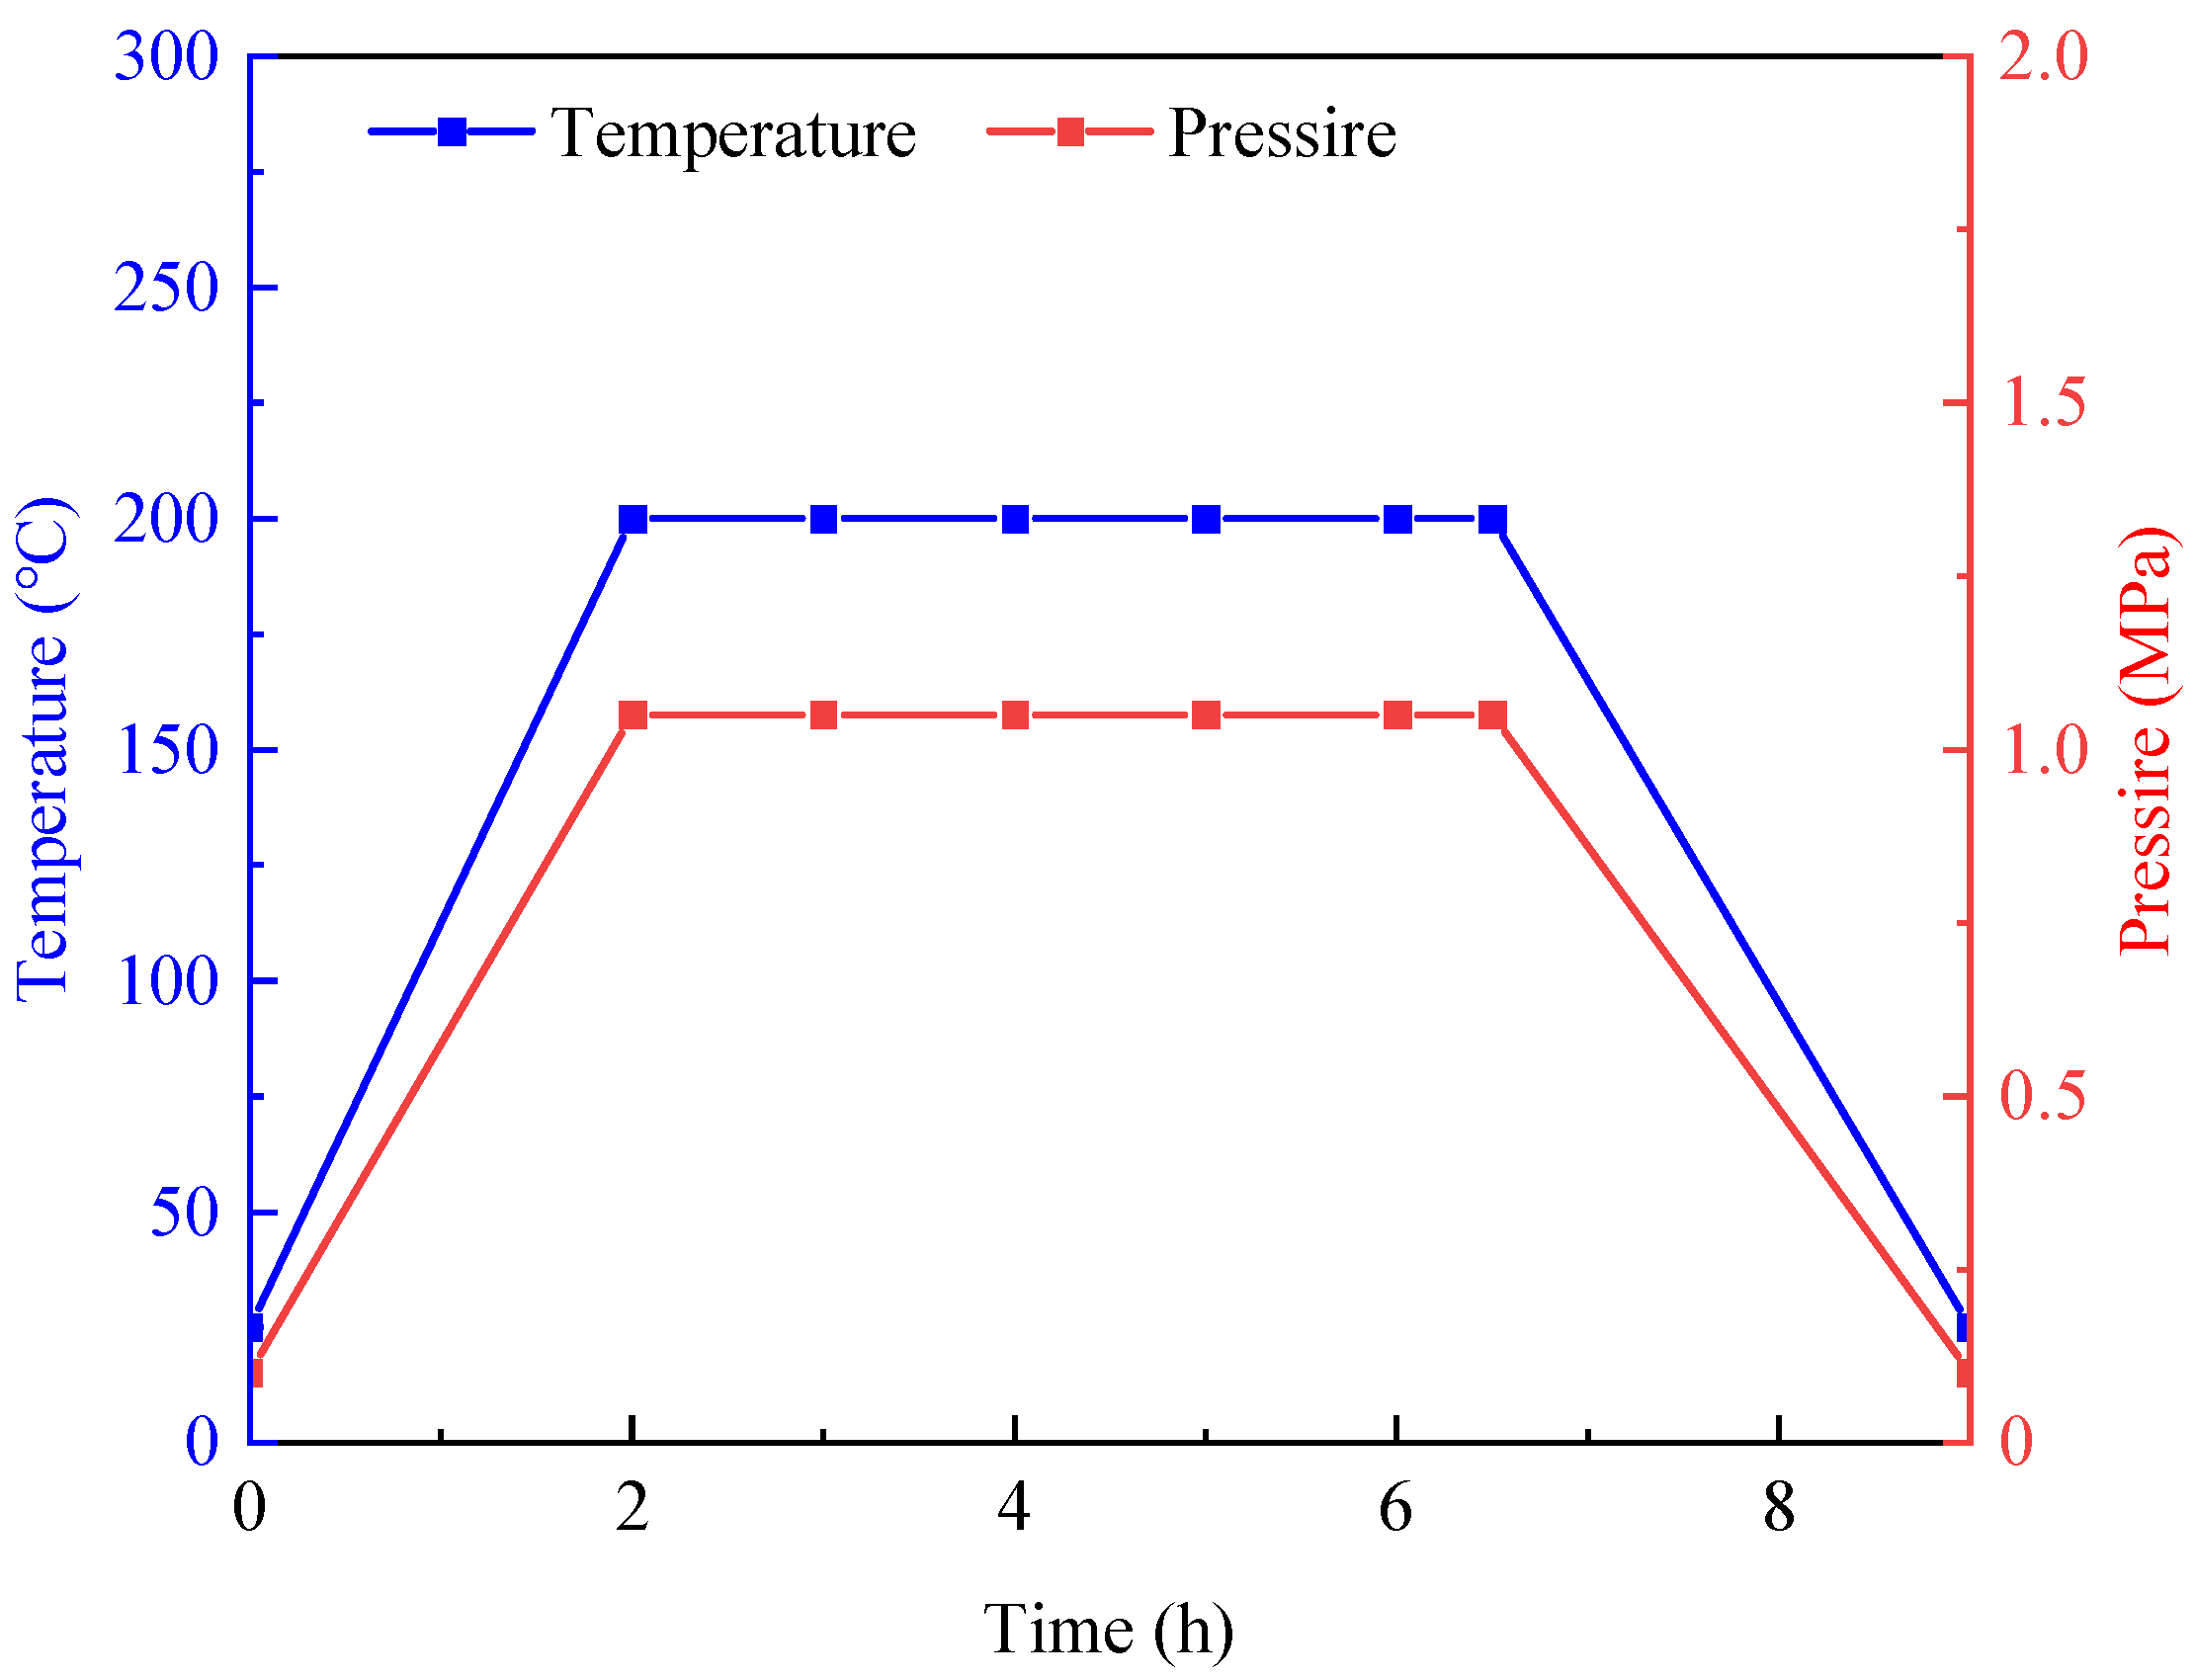
For autoclave curing, specimens were first subjected to the same steam curing process, after which they were transferred to an autoclave. Inside the autoclave, the temperature and pressure were raised to 200 °C and 1 MPa, respectively, within 2 h, maintained for 4.5 h, and then gradually reduced to ambient conditions over the course of 2.5 h. The temperature and pressure profiles during autoclave curing are illustrated in Figure 1. It is important to note that specimens subjected to both steam curing and autoclave curing were subsequently stored under normal curing conditions until 28 d after casting, prior to the tests described in the following subsections.
Figure 1. Autoclave temperature and pressure profiles.

2.2.2. Electric Flux Method

Both the electric flux and RCM tests were performed to comprehensively evaluate chloride penetration. The electric flux test was first used to study the effects of curing conditions and chloride concentration on ionic conductivity. Based on these results, the RCM test was conducted on specimens representing the worst-case scenario identified in the electric flux test to directly determine the chloride migration coefficient and assess mechanical performance under severe conditions.
The electric flux method is based on the electrical charge passed through a concrete specimen under a direct current voltage. It simulates the chloride ion penetration in concrete and is used to rapidly and effectively assess concrete durability. The test used cylindrical concrete specimens with a diameter of (100 ± 1) mm and a height of (50 ± 2) mm.
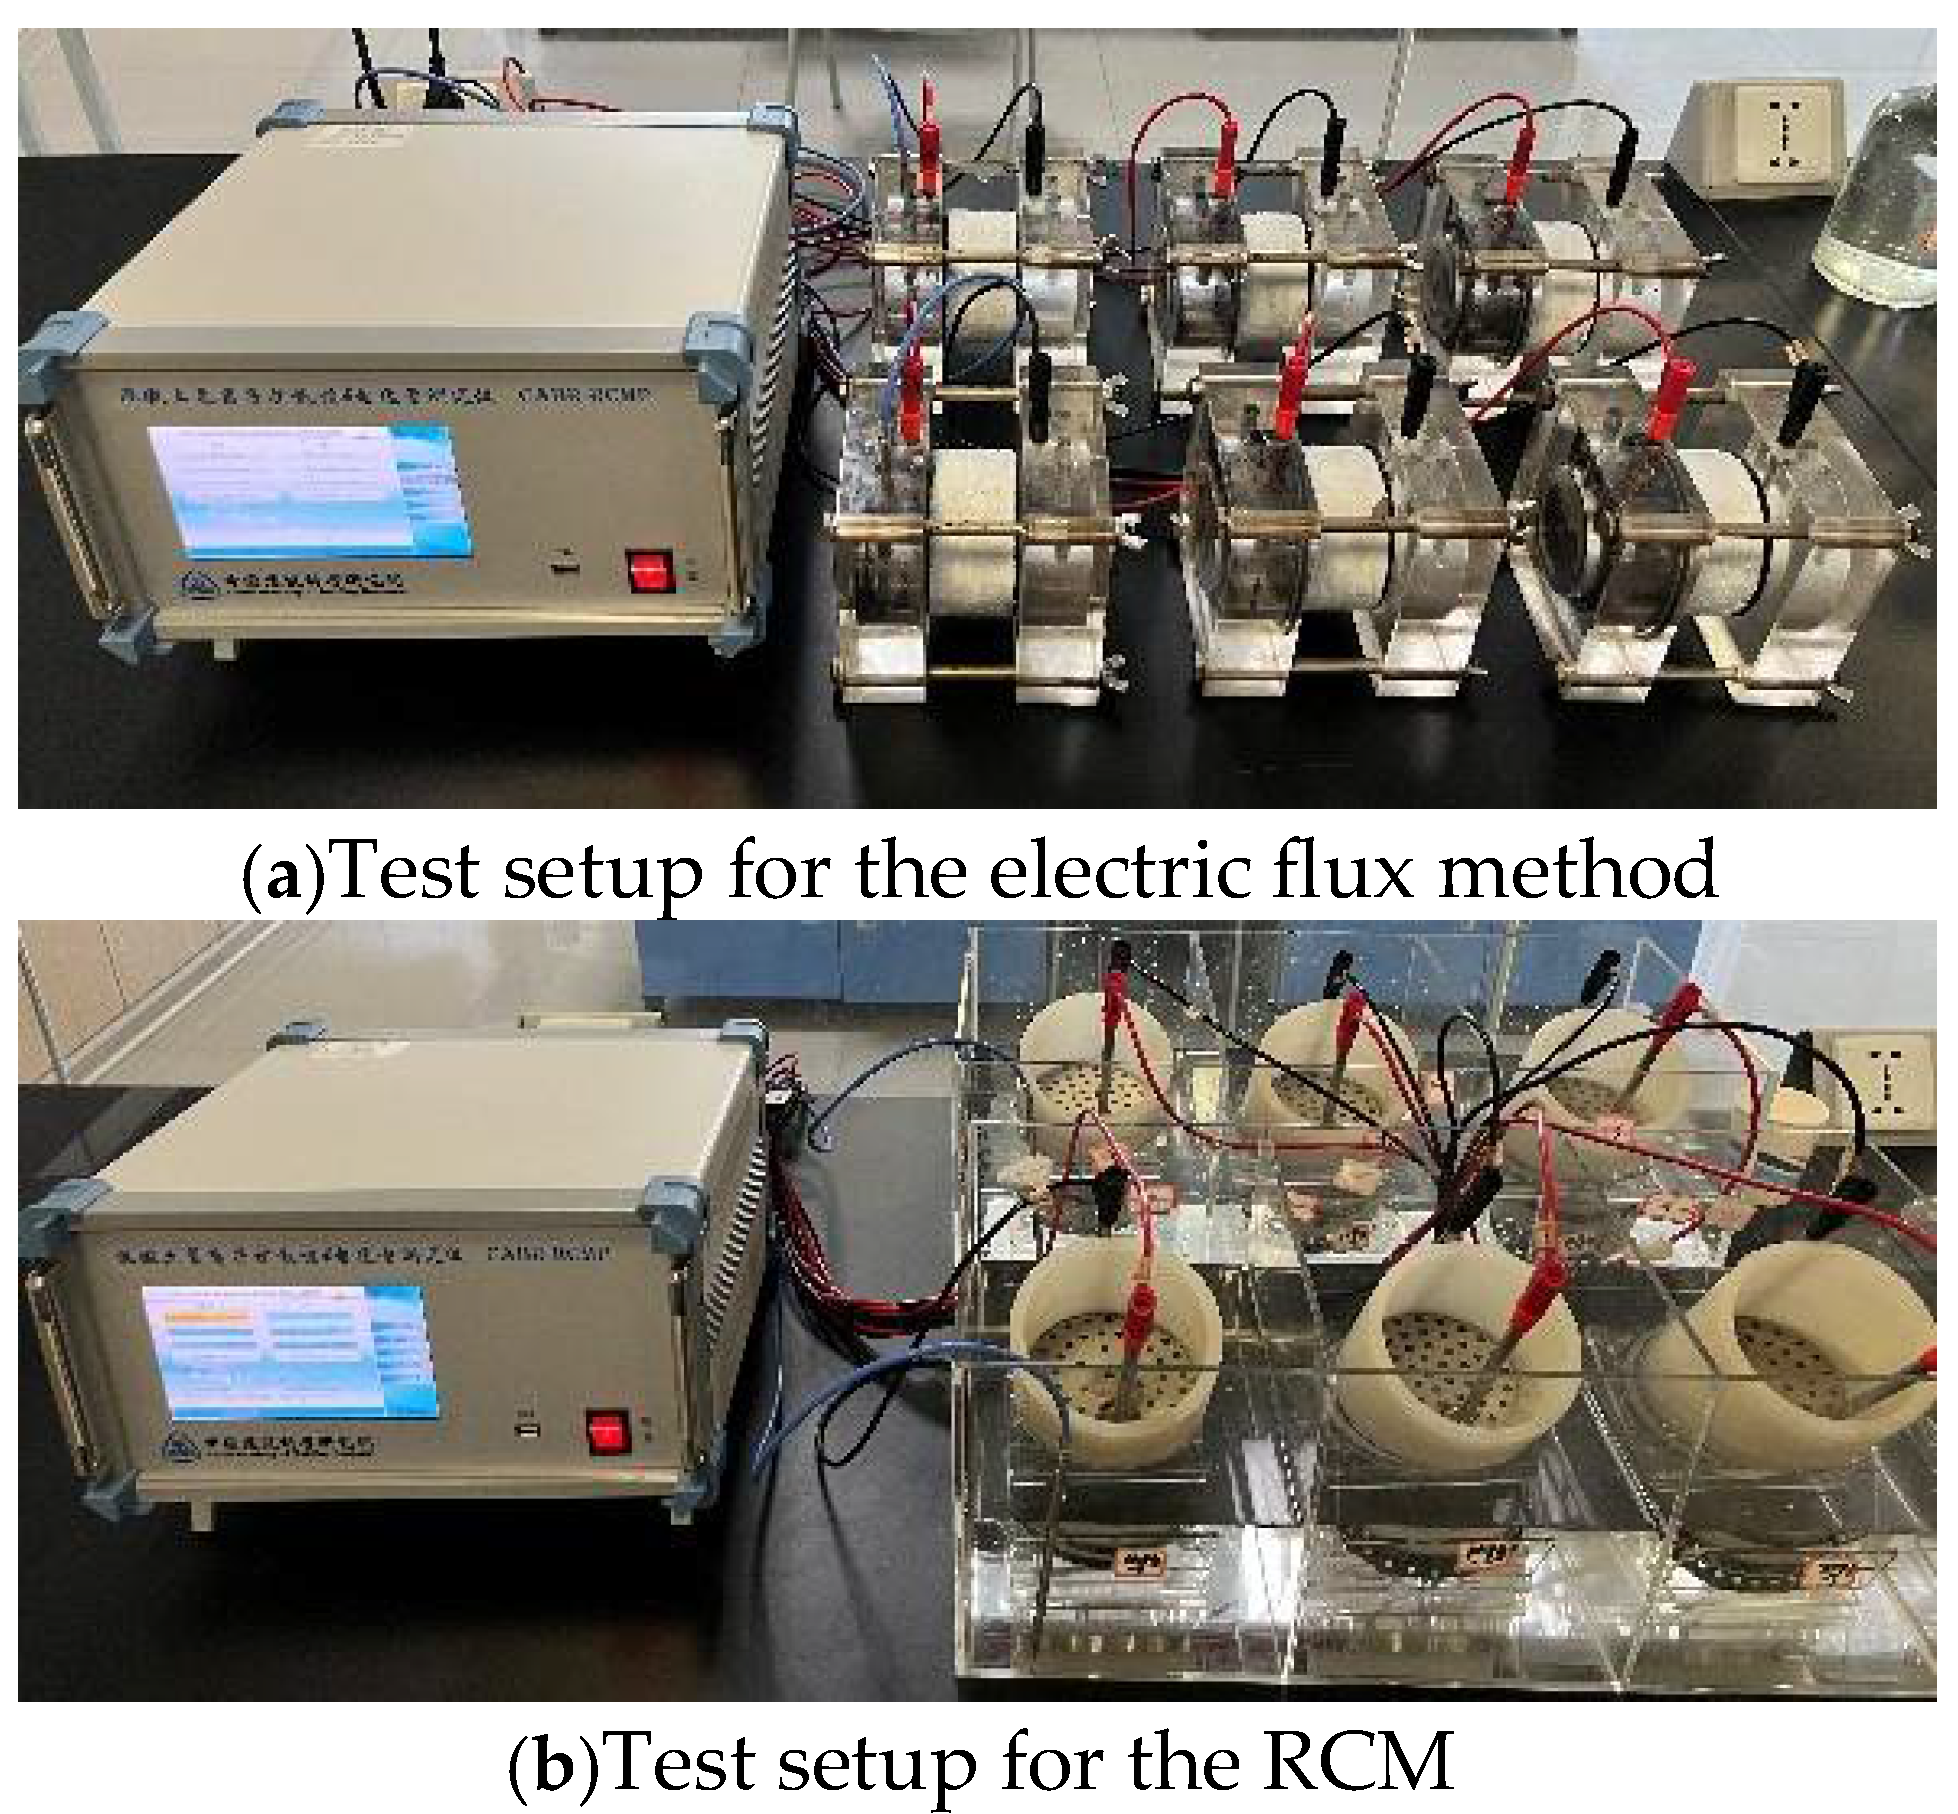
After 28 d of curing, the diameter of each cylindrical specimen is measured. The specimen’s lateral surface is sealed with silicone. Specimens are placed in a vacuum saturation device: Within the first 5 min, the absolute pressure in the vacuum chamber was reduced to 1–5 kPa and maintained at this level for 3 h. While maintaining the vacuum, distilled water was gradually introduced into the chamber. After 1 h, the pressure was restored to atmospheric conditions, and the specimens continued to soak for an additional 18 ± 2 h. Following saturation, the specimens were briefly surface-dried using a towel, and the lateral surfaces were sealed with silicone prior to testing. Specimens are installed in the test cell according to a specified setup (referenced as Figure 2a), and the sealing between the specimen and the cell is verified. The test is conducted in a controlled environment at 20–25 °C.
Figure 2. Test setups for (a) the electric flux method and (b) RCM.
Two sets of tests were conducted via electric flux test: one is the NC, SC, and AC specimens with the catholyte solution of 4.5% chloride concentration, another one is the specimens under autoclave curing and the catholyte is a NaCl solution with specific chloride concentrations of 0%, 1.5%, 3.0%, 1.5%, 6.0%, 7.5%, 9.0%, and 36.5%. The influence of chloride ion concentration on concrete durability was investigated because chloride ingress directly affects reinforcement, corrosion, and long-term performance [,,]. Real-world chloride exposure varies by environment, such as marine atmospheres or deicing conditions. In this study, a 4.5% NaCl solution was used as the baseline, representing the worst-case condition observed in preliminary electric flux tests. Additional concentrations (0%, 1.5%, 3.0%, 6.0%, 7.5%, 9.0%, and 36.5%) were applied to autoclave-cured specimens to assess durability under progressively more severe and extreme exposure scenarios. Considering the solubility of NaCl in water at room temperature is approximately 365 g/L, a chloride concentration of 36.5% was selected to represent the saturated chloride solution. Only autoclave-cured specimens were tested under varying chloride concentrations, as normal- and steam-cured concretes have been extensively studied, whereas the durability of AC specimens under chloride exposure is less well understood. The anolyte is a 0.3 mol/L NaOH solution. The initial current is recorded at the beginning of the test. The system records current readings every minute for a total duration of 6 h. A current vs. time curve is plotted. The total charge passed over the 6 h test is obtained by integrating the area under the curve. The total charge is calculated using the following formula []:
Q = 900 ( I 0 + 2 I 30 + 2 I 60 + + 2 I 300 + 2 I 330 + 2 I 360
where Q is the total charge passed (C), I0 is the initial current (A), and I(t) is the current at time t (A).
According to GB/T 50082-2024 [], the measured charge is normalized to a standard specimen diameter of 95 mm using Equation (2):
Q 95 = Q d 95 d 2
where Q95 and Qd are standardized total charge and charge for the specimen with actual diameter d (mm), respectively.

2.2.3. Mechanical Properties After RCM Exposure

To investigate the early-stage effects of chloride attack on the evolution of mechanical properties in HSC [], specimens were exposed to accelerated chloride conditions for 0, 1, 3, 5, and 7 d following 28 d of curing, as described in Section 2.2.1. The curing methods included normal curing, steam curing, and autoclave curing, with specimens designated as NC, SC, and AC, respectively. The accelerated chloride attack was conducted using the RCM as per GB/T 50082-2024 [], with the experimental setup shown in Figure 2b. Note that the RCM test was used only to cure the samples prior to mechanical strength testing and was not intended to produce independent results for analysis. The RCM preparation follows the procedures below:
After the specimens reached 28 d on different curing conditions and their diameter and height were measured, they were placed into a vacuum saturation apparatus. Within the first 5 min of the test, the air pressure in the apparatus was reduced to between 1 and 5 kPa and maintained at that level for 3 h. Then, a saturated Ca(OH)2 solution was introduced into the apparatus. After soaking for 1 h, the pressure was restored to atmospheric pressure, and the specimens continued soaking for an additional 18 ± 2 h. After saturation, the specimens were removed and lightly surface-dried using a towel to remove excess water before being placed into the test setup shown in Figure 2b. No oven-drying was performed to avoid altering the internal moisture state of the specimens. The anolyte inside the rubber sleeve was a 0.3 mol/L NaOH solution, approximately 300 mL in volume. Immersion of the anode plate also ensures the uniformity and stability of the anodic reaction. The catholyte was a 4.5% NaCl solution (instead of 10.0% as defined in GB/T 50082-2024), approximately 12 L in volume, with its surface level aligned with that of the NaOH solution in the rubber sleeve.
After the accelerated chloride-induced deterioration test, the specimens were promptly removed, rinsed with clean water to remove surface residues, and allowed to cool to room temperature under ambient conditions. Compressive strength tests were then conducted using a SANS compression machine at a loading rate of 0.5 MPa/s for NC and SC specimens, and 0.8 MPa/s for AC specimens, in accordance with GB/T 50081-2019 [], which specifies loading rates of 0.5 MPa/s and 0.8 MPa/s for concrete with compressive strengths below and above 60 MPa, respectively.
The axial deformation of specimens (100 mm in diameter and 200 mm in height) was measured using linear variable differential transformers (LVDTs) attached at mid-height of the concrete specimen. The deflection data were collected simultaneously with the applied load to generate the stress–strain curves. Three specimens were tested for each mix, and the elastic modulus was calculated from the initial linear portion of the stress–strain curve (Equation (3)). Although two LVDTs are generally recommended to account for potential bending or non-uniform deformation, the specimens were carefully centered and aligned, and preliminary tests confirmed minimal eccentricity. Therefore, a single LVDT provides a reliable measurement of axial strain for the calculation of the elastic modulus.
E = σ 2 σ 1 ε 2 ε 1
where σ2 and σ1 are stresses corresponding to the start and end of the linear portion, ε2 and ε1 are the corresponding strains.
Toughness represents the total energy absorbed by a material up to failure, reflecting both strength and ductility. In concrete, it captures not only the peak stress but also the deformation capacity, providing a more comprehensive measure of mechanical performance than compressive strength alone. Higher toughness indicates that the material can sustain larger strains and absorb more energy before fracturing, which is particularly relevant for structures subjected to dynamic or impact loads. The toughness (U) is calculated as the area under the stress–strain curve, as shown in Equation (4) below:
U = 0 ε f σ d ε
where σ, ε, and εf are the stress, strain, and the strain at failure, respectively.

2.2.4. X-Ray Diffraction

To identify the crystalline phases present in NC, SC, and AC, X-ray diffraction (XRD) analysis was performed on finely ground powders using a MiniFlex 300 diffractometer equipped with a CuKα radiation source (λ = 1.54 Å), operating at 30 kV and 10 mA. Following 28 d of curing and subsequent compressive strength testing, the concrete specimens (NC, SC, and AC) were crushed and sieved through a #200 mesh (75 µm). The resulting powders were scanned over a 2θ range of 10° to 70° in stepwise mode, with a step size of 0.02° and a scanning speed of 5°/min. It should be noted that concrete samples were used for XRD to evaluate hydration products within the full concrete matrix, reflecting actual mechanical and durability performance. While cement paste is more commonly used to avoid aggregate interference, silica sand as a partial cement replacement contains quartz, which can affect analysis. Therefore, the focus was on characteristic peaks of hydration products (such as tobermorite, CSH, CC) and their relative intensities across curing conditions, providing a representative assessment of the concrete hydration products.

2.2.5. Micro-Morphology

Following the compressive strength tests, selected fragments of the NC, SC, and AC concrete samples were subjected to microstructural analysis using a TESCAN MIRA4 field emission scanning electron microscope (FE-SEM) operated at an accelerating voltage of 15 kV. Prior to SEM analysis, the concrete specimens were coated with a thin layer of gold using a sputter coater (GVC-2000, Beijing, China, 20 mA for 60 s) to minimize charging effects and improve image quality. The morphology of key hydration products, including calcium silicate hydrates (CSH), ettringite, and CH, as well as carbonation products (i.e., CC), was examined.

3. Results and Discussion

3.1. Electric Flux

3.1.1. Effects of Curing Conditions

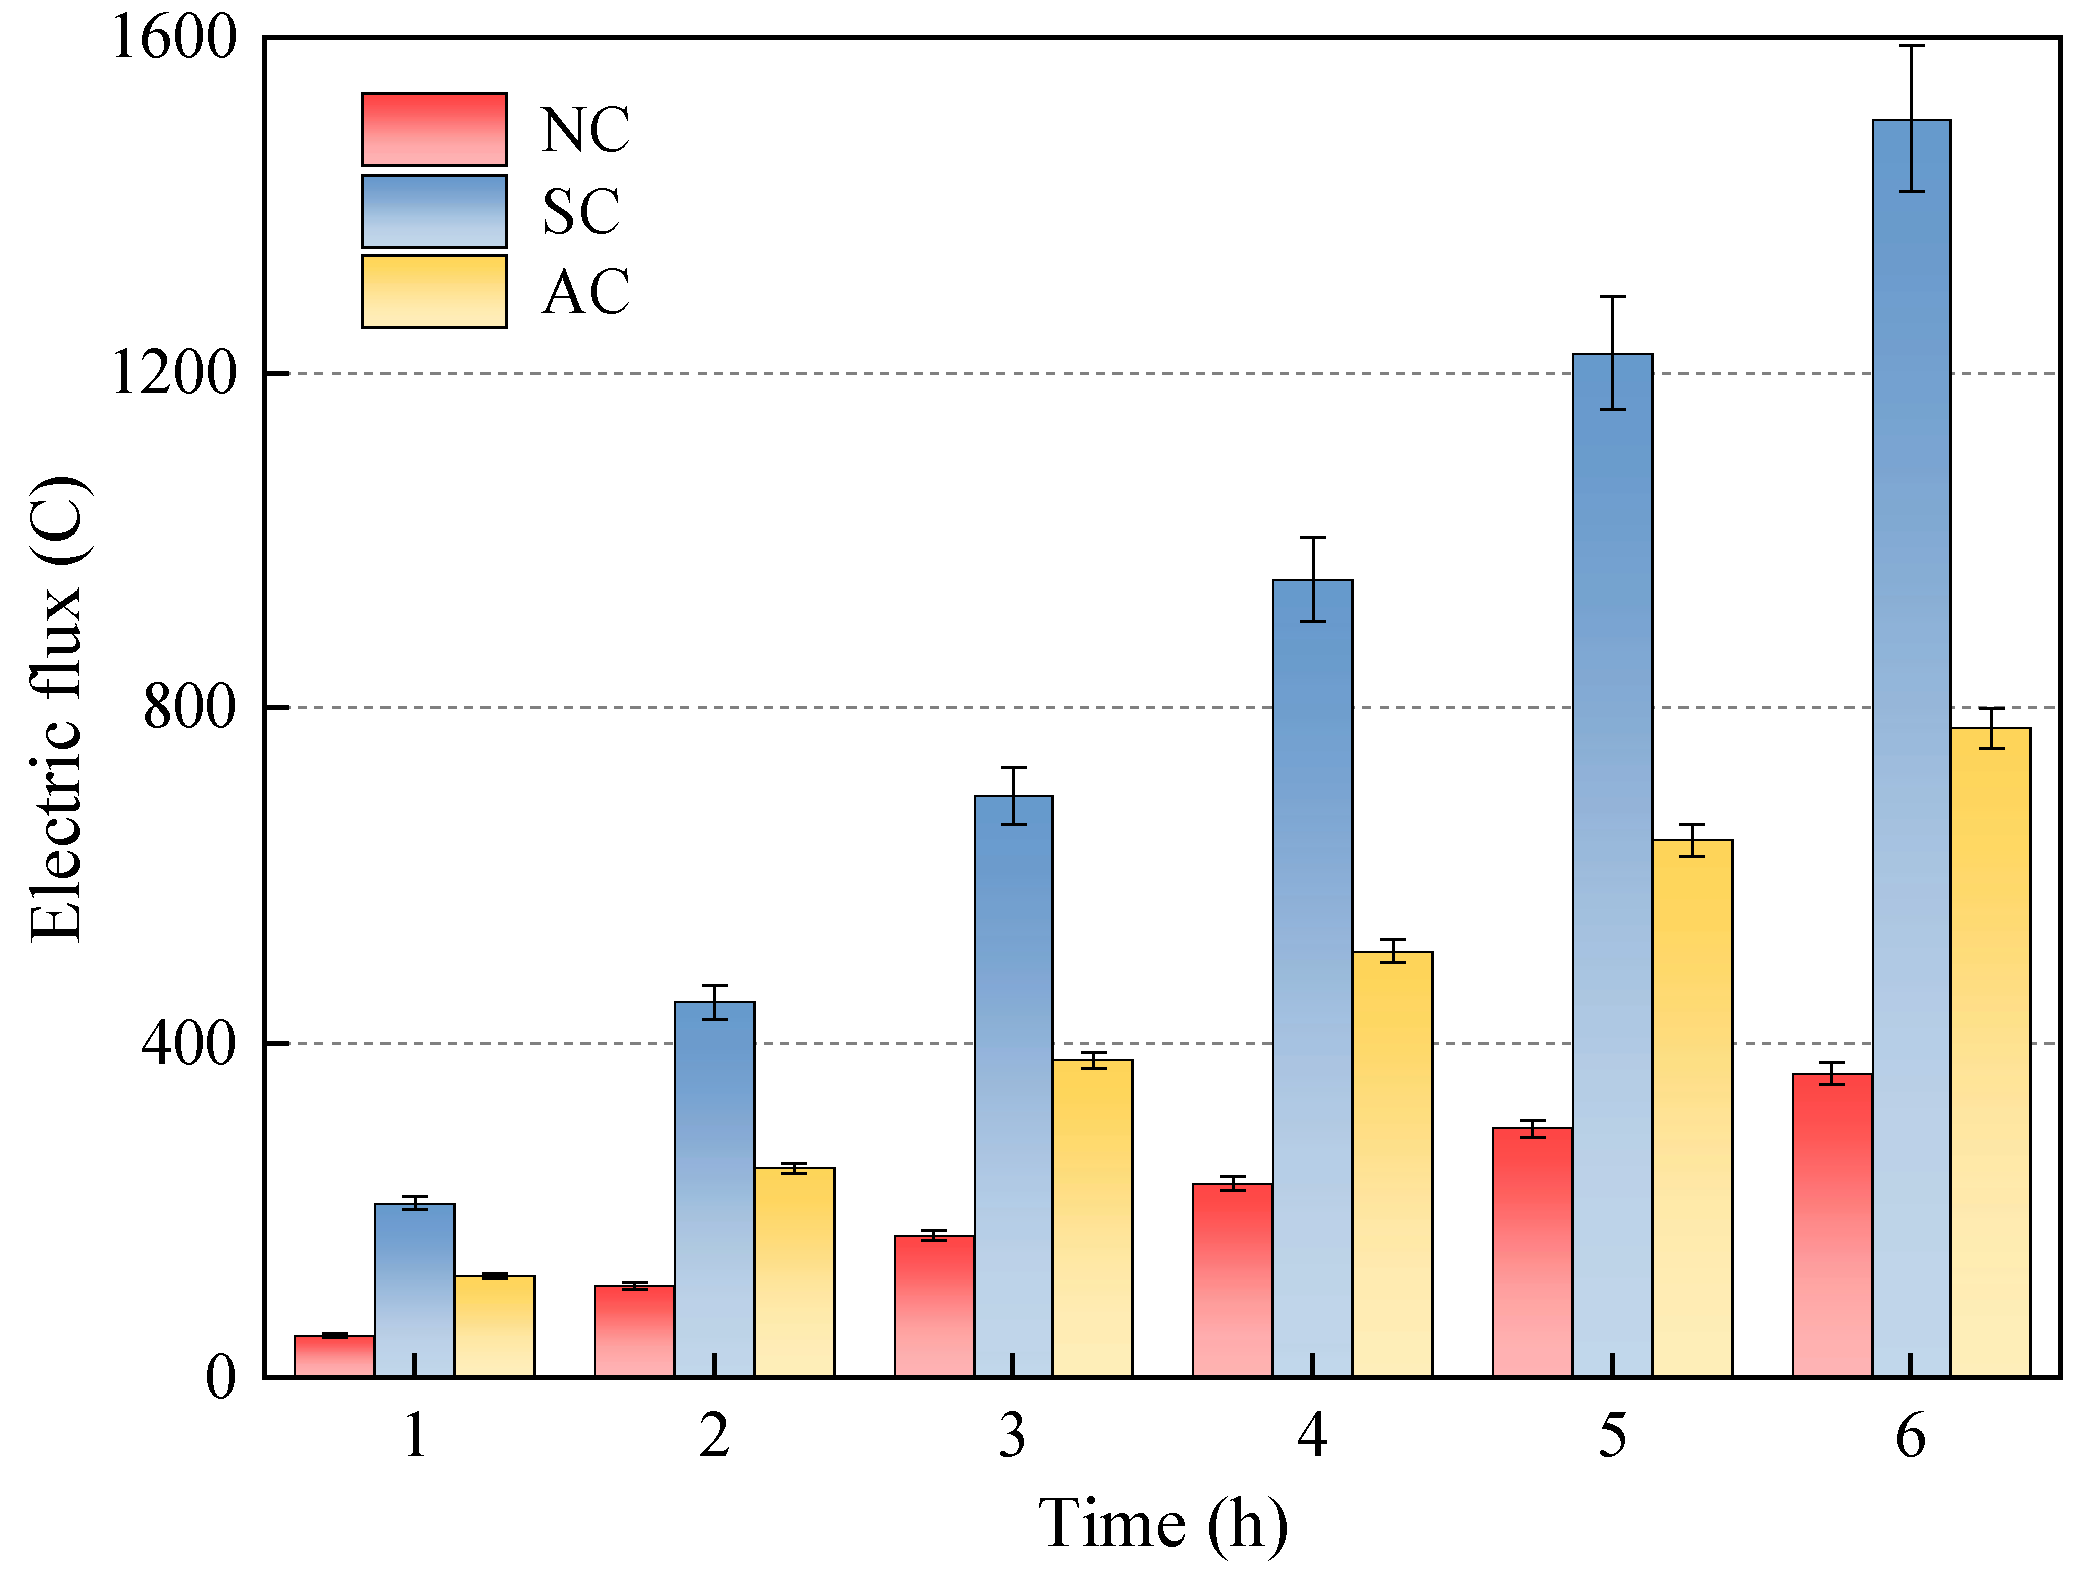
Figure 3 presents the electrical flux development of HSC subjected to different curing regimes over a 28-day period and then exposed to chloride via the electric flux test for up to 6 h. It can be observed that the electric flux of NC, SC, and AC increased linearly with time. SC consistently exhibited the highest electrical flux, reaching 1503.5 C after 6 h. AC showed moderate electric flux development, while NC yields the lowest electric flux throughout the entire period. Therefore, it can be concluded that both steam curing and autoclave curing increase the permeability of concrete, thereby reducing its resistance to chloride ion penetration.
Figure 3. Electrical flux of HSC under various curing conditions after different durations of chloride exposure.
Compared to normal curing, steam curing can accelerate cement hydration, which may lead to the non-uniform formation of hydration products. As a result, the microstructure of steam-cured concrete may be more porous than that of normally cured concrete []. Moreover, autoclave curing provides even a further improvement in cement hydration over steam curing, which may impart larger pores in concrete. However, the elevated pressure and temperature in the autoclave curing regime can also activate the inert SiO2 in silica sand powder []. This stimulation may trigger and enhance the pozzolanic reaction of silica sand powder that generates additional CSH gel, thereby filling pores and refining the concrete’s microstructure []. However, the electric flux of AC reached 775.1 C after 6 h of chloride exposure, which was still 112.8% higher than that of NC.

3.1.2. Effects of Chloride Concentrations

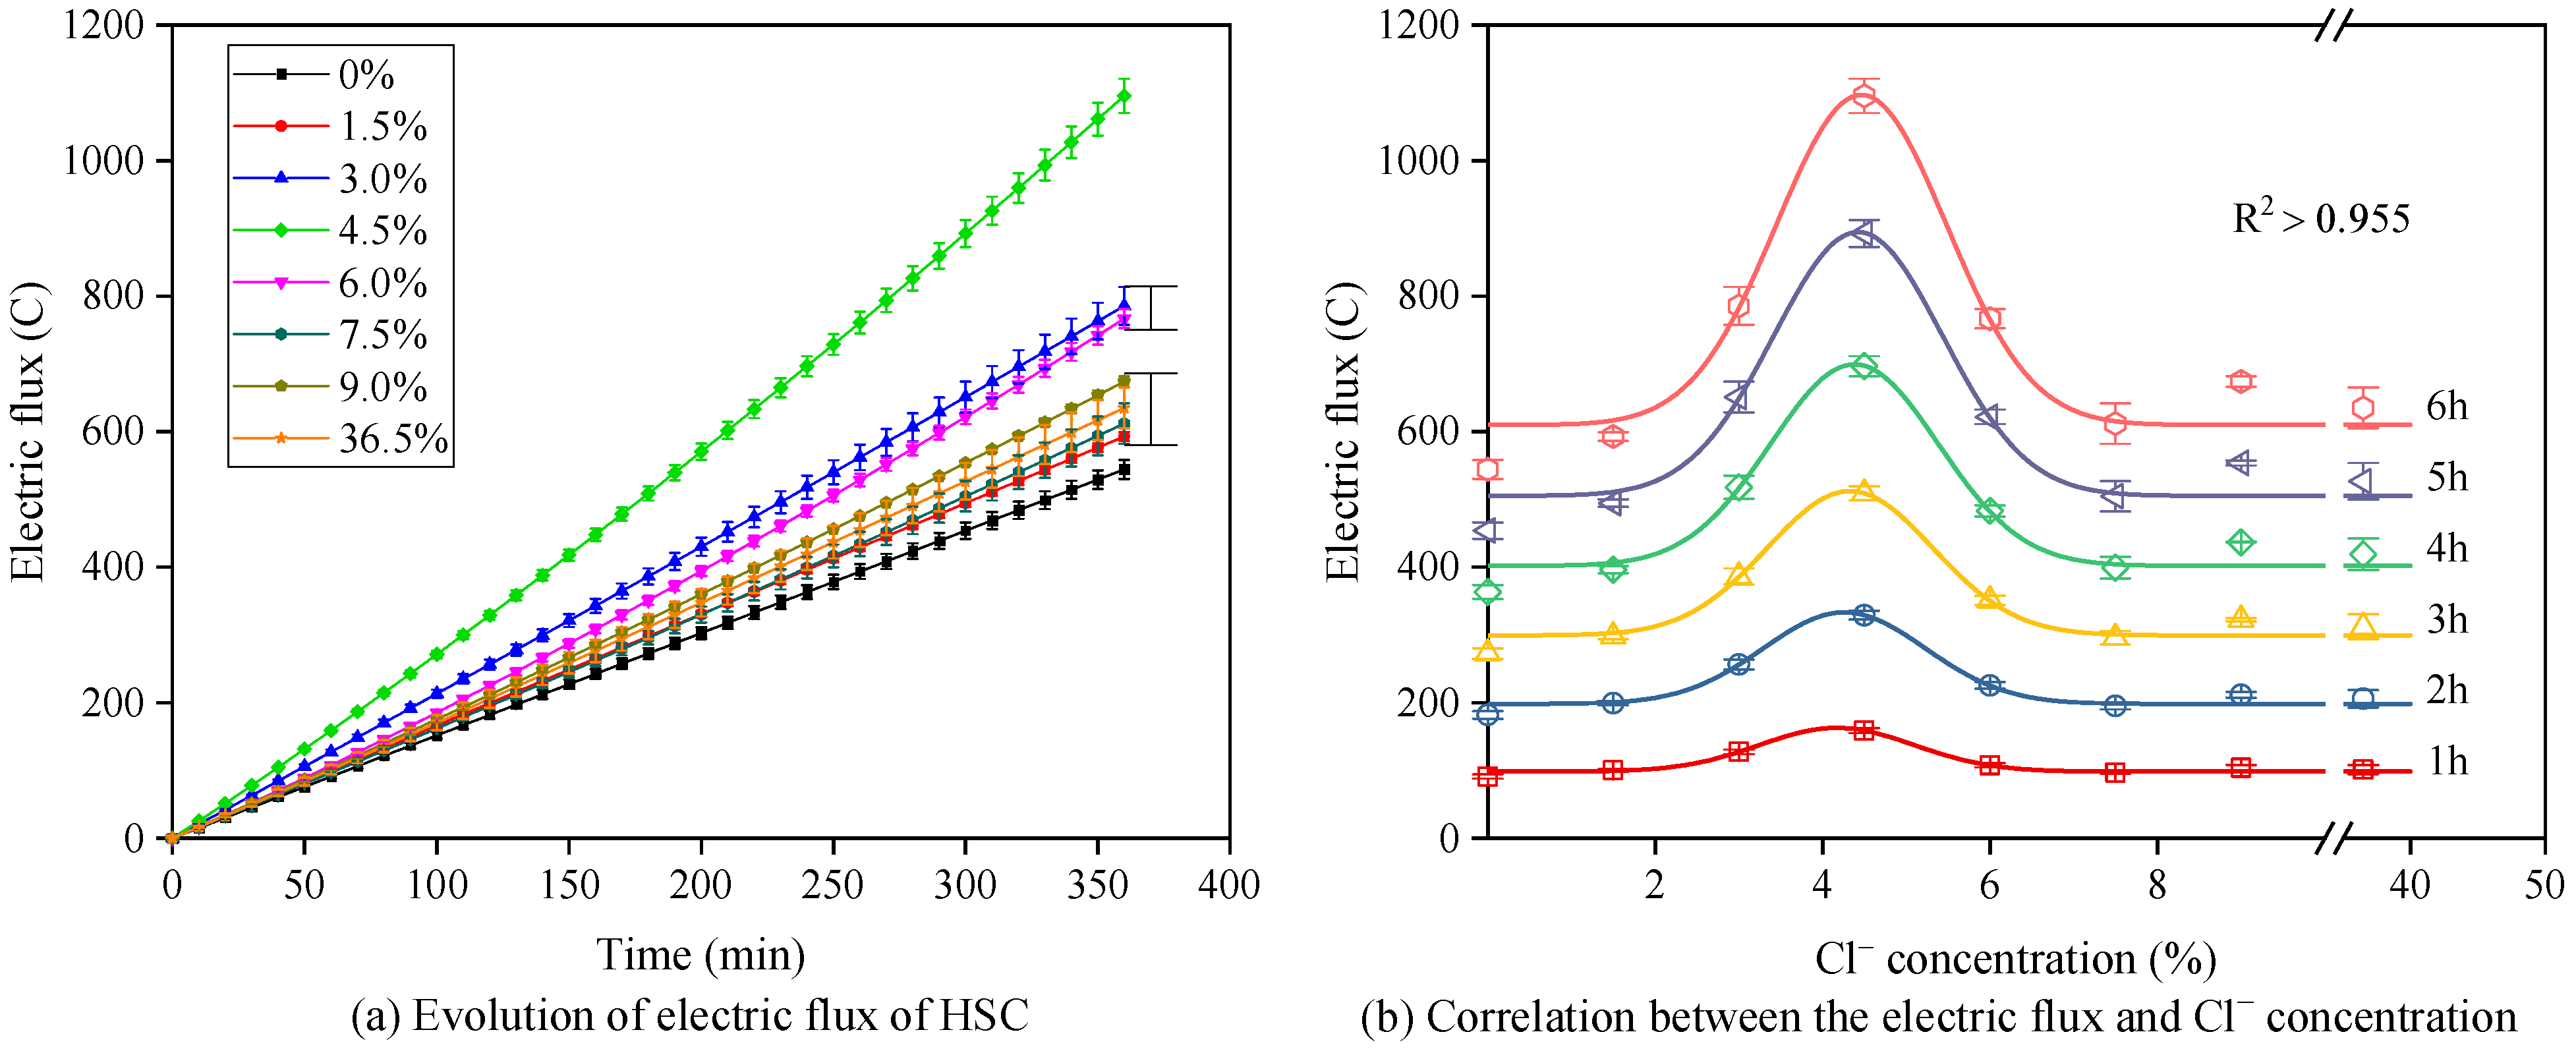
The electric flux development of AC under different chloride concentrations was presented in Figure 4a. Although all specimens exhibited a linear increase in electric flux over time, the rate of increase varied depending on the chloride concentration. Based on the differences in the rate of increase, the specimens can be categorized into four groups. Group 1 exhibited the highest electric flux increase rate and consisted of the specimen with a chloride concentration of 4.5%. Group 2 included specimens with chloride concentrations of 3.0% and 6.0%, which showed moderate increase rates. Group 3 comprised specimens with chloride concentrations of 1.5%, 7.5%, 9.0%, and 36.5%, all of which displayed lower increase rates than those in Group 2. Notably, the specimen with 0% chloride addition (group 4) exhibited the lowest electric flux increase rate among all, highlighting the significant influence of chloride presence on permeability development.
Figure 4. Electric flux development of HSC under different chloride concentrations.
Figure 4b shows the correlation between electric flux and chloride concentration at each hour, demonstrating a good fit with the Gaussian equation, as indicated by R2 values exceeding 0.955. Similar electric flux values were observed across all groups during the first hour, indicating that varying chloride concentrations had no significant effect on chloride migration in concrete at early ages. At this stage, the specimens in each group were likely in similar initial conditions. However, the influence of chloride concentration on electric flux became increasingly pronounced over time.
More interestingly, the electric flux exhibited a non-monotonic trend with increasing chloride ion concentration, reaching a maximum at 4.5%. This observation indicates that chloride penetration in AC specimens is greatest at a moderate chloride concentration level. The behavior can be attributed to the competing effects of ion concentration and transport resistance within the pore solution. At lower chloride concentrations (0–4.5%), the increasing ionic content enhances the electrical conductivity of the pore solution and facilitates ion migration through the connected pore network, resulting in higher measured flux []. Moreover, as the test duration extends from 1 to 6 h, the differences in flux growth rates become increasingly pronounced, suggesting that ionic transport is progressively accelerated under sustained electric fields. However, beyond 4.5% chloride concentration, the electric flux decreases as the system approaches ionic saturation, where electrostatic shielding and reduced diffusivity limit ion mobility []. In addition, excessive chloride concentrations may induce localized salt precipitation within pores, increasing transport resistance and further hindering charge transfer. [,]. Similar non-linear relationships between ionic strength and conductivity have been reported in previous studies [,], supporting this interpretation. The heat generated under prolonged high-voltage application may also contribute to enhanced chloride ion mobility within the concrete matrix []. In contrast, when the chloride concentration increases from 4.5% to 9.0%, the overall increase rate of electric flux tends to decrease. This phenomenon may be attributed to the heat generated under prolonged high-voltage application, which accelerates chloride ion mobility within the concrete [].

3.2. Mechanical Properties

3.2.1. Axial Stress–Strain Behavior

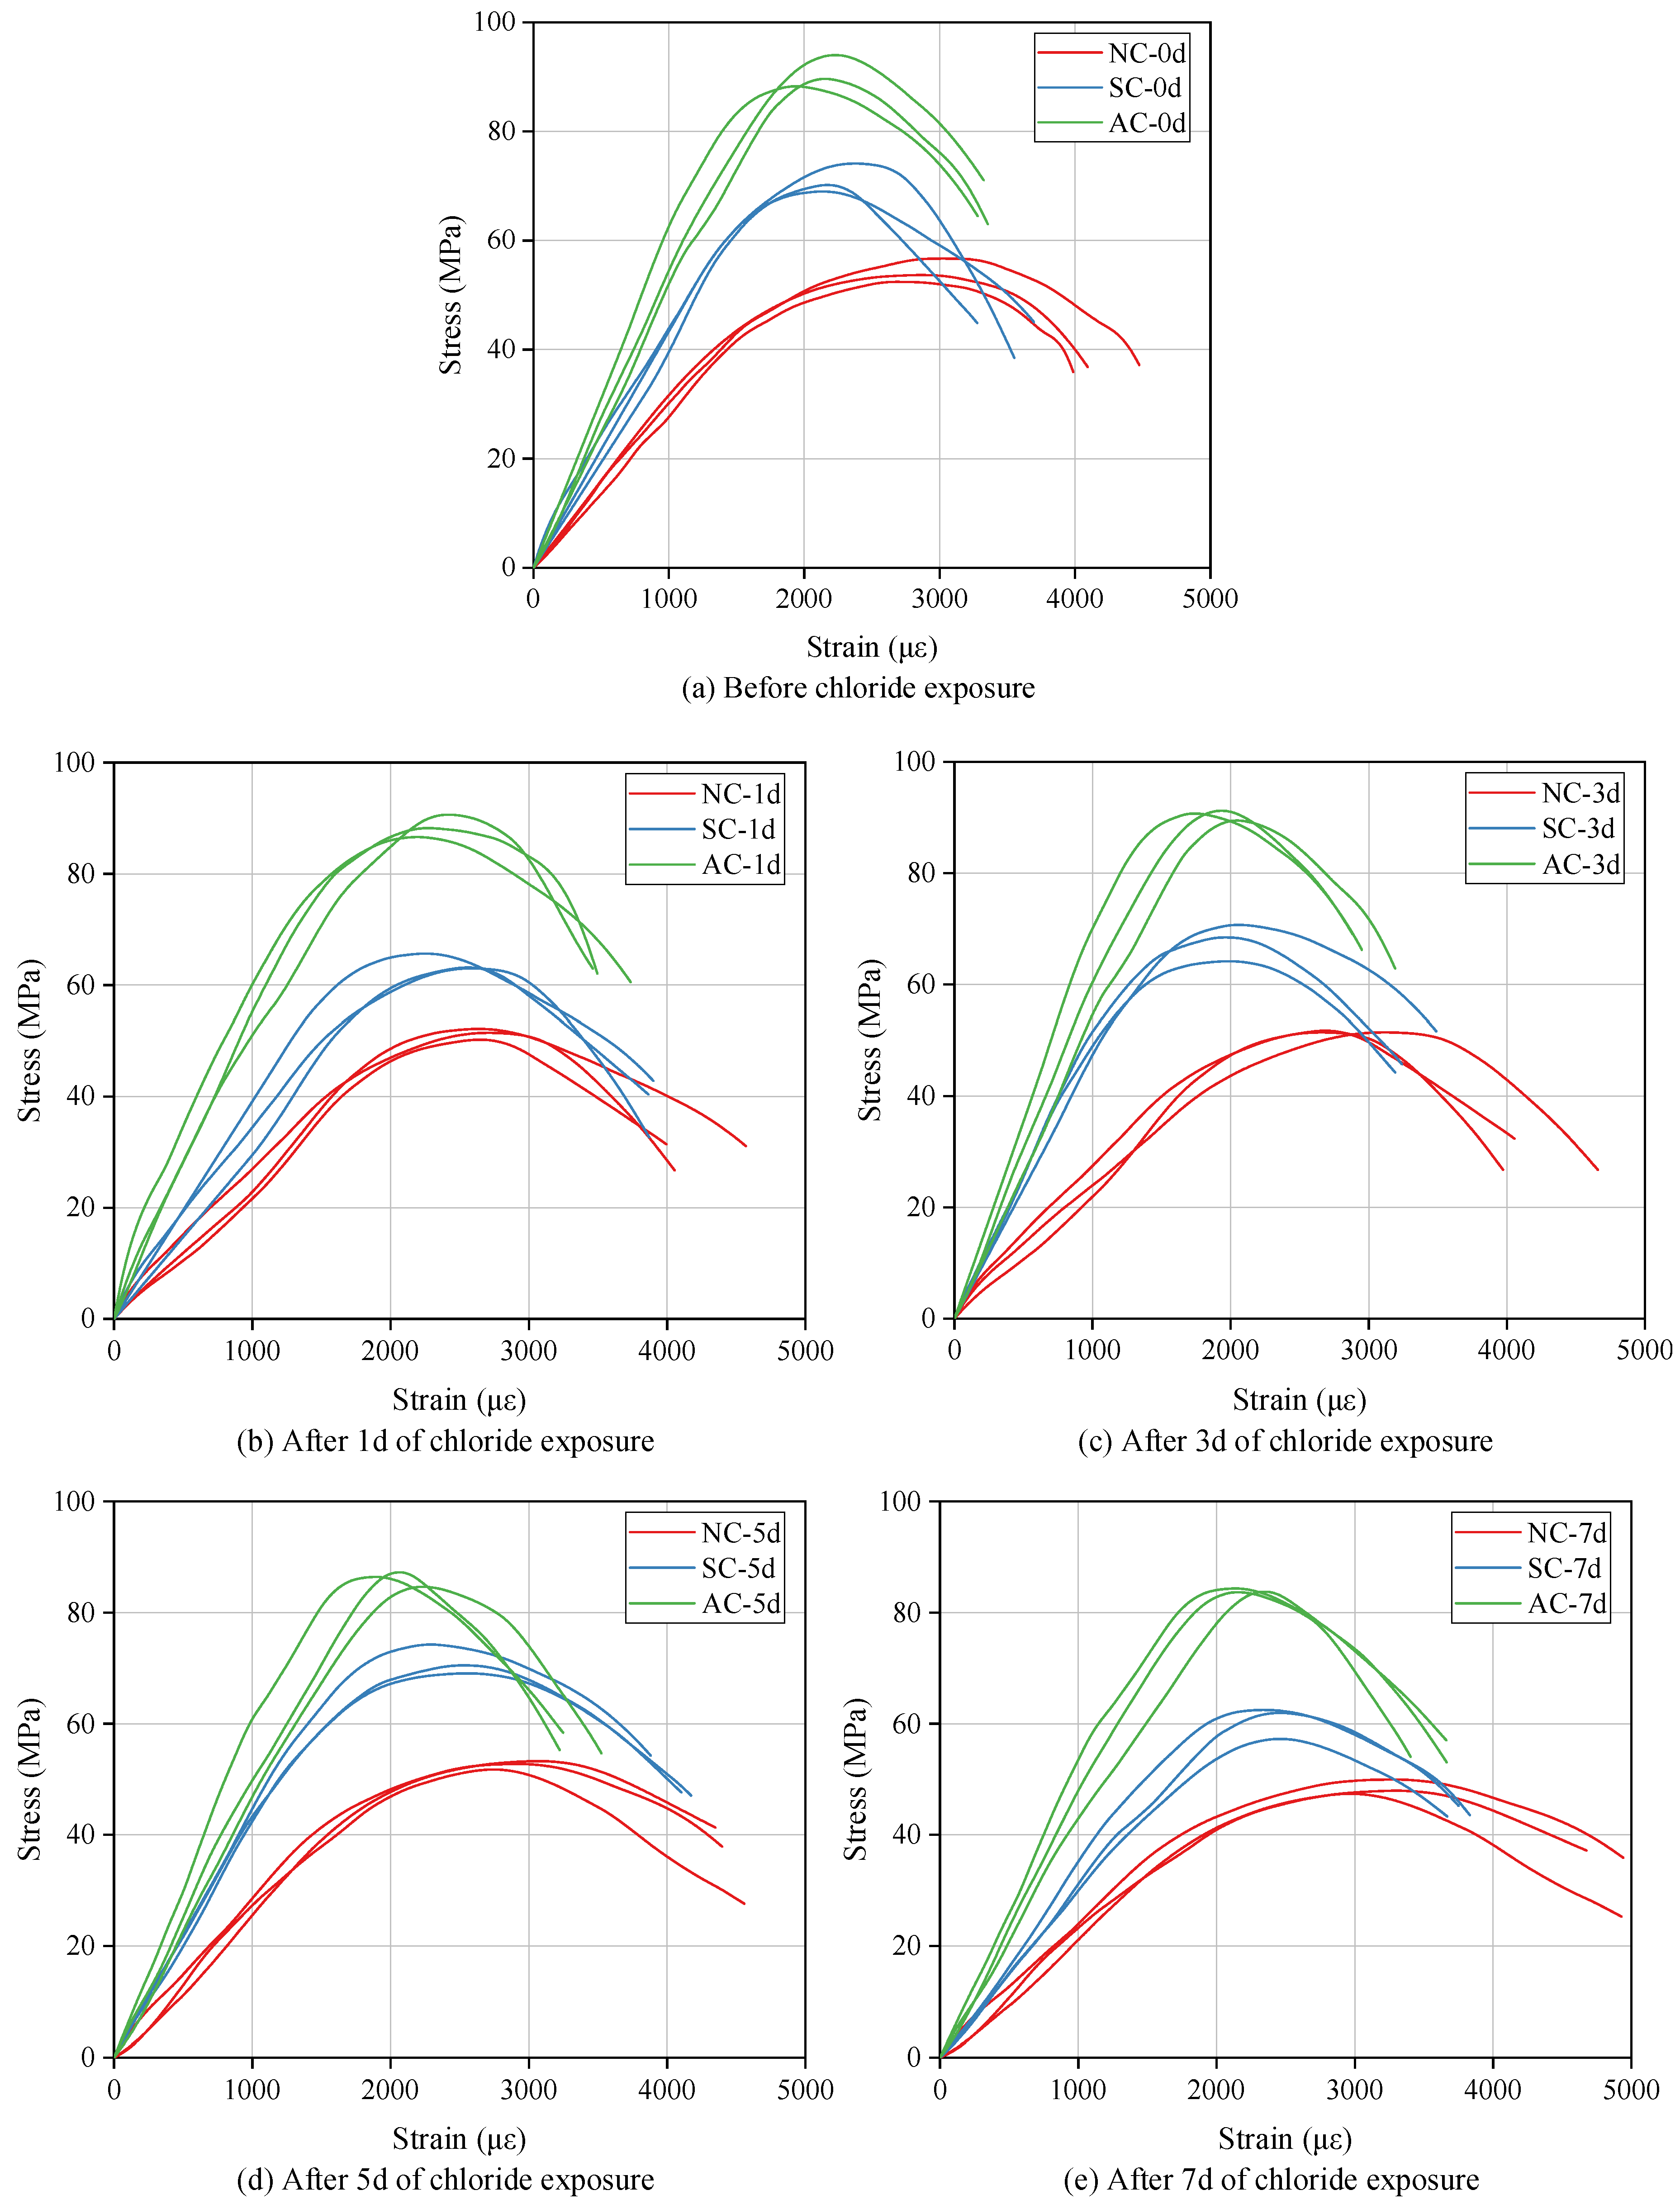
The axial stress–strain curves were then recorded under chloride exposure for up to 7 d and shown in Figure 5. It can be seen that no significant changes were observed in the stress–strain curves of HSC under specific curing conditions after exposure to chloride solution for up to 7 d. All the stress–strain curves can be divided into four stages: the elastic stage, the elastic–plastic stage, the peak point, and the descending segment.
Figure 5. Stress–strain curves of HSC exposed to a 4.5% chloride solution at various exposure durations.
It is important to note that in the descending segment of the stress–strain curves, corresponding to the failure process after the peak load, pronounced differences were observed in the HSC specimens exposed to different durations. This difference is primarily attributed to the varying impacts of the degradation process on the internal microstructure and mechanical properties of the concrete, resulting in distinct mechanical responses at failure. It can be observed that, as the degradation degree increases, the compressive strength of the specimens does not decrease or increase monotonically, but instead follows a pattern of first decreasing, then increasing, and finally decreasing again. This phenomenon reflects the complex effects of chloride salt corrosion on the mechanical properties of HSC. In the early stages of degradation, chloride salt corrosion may induce microcracks and damage within the concrete, leading to a reduction in compressive strength. However, as degradation progresses, certain components within the concrete may react with the chloride salts to form products that have strengthening effects, which partially restore the compressive strength of the specimens. Eventually, once the degradation reaches a critical point, the destructive effects of chloride salt corrosion dominate, causing the compressive strength to decline once again.

3.2.2. Compressive Strength

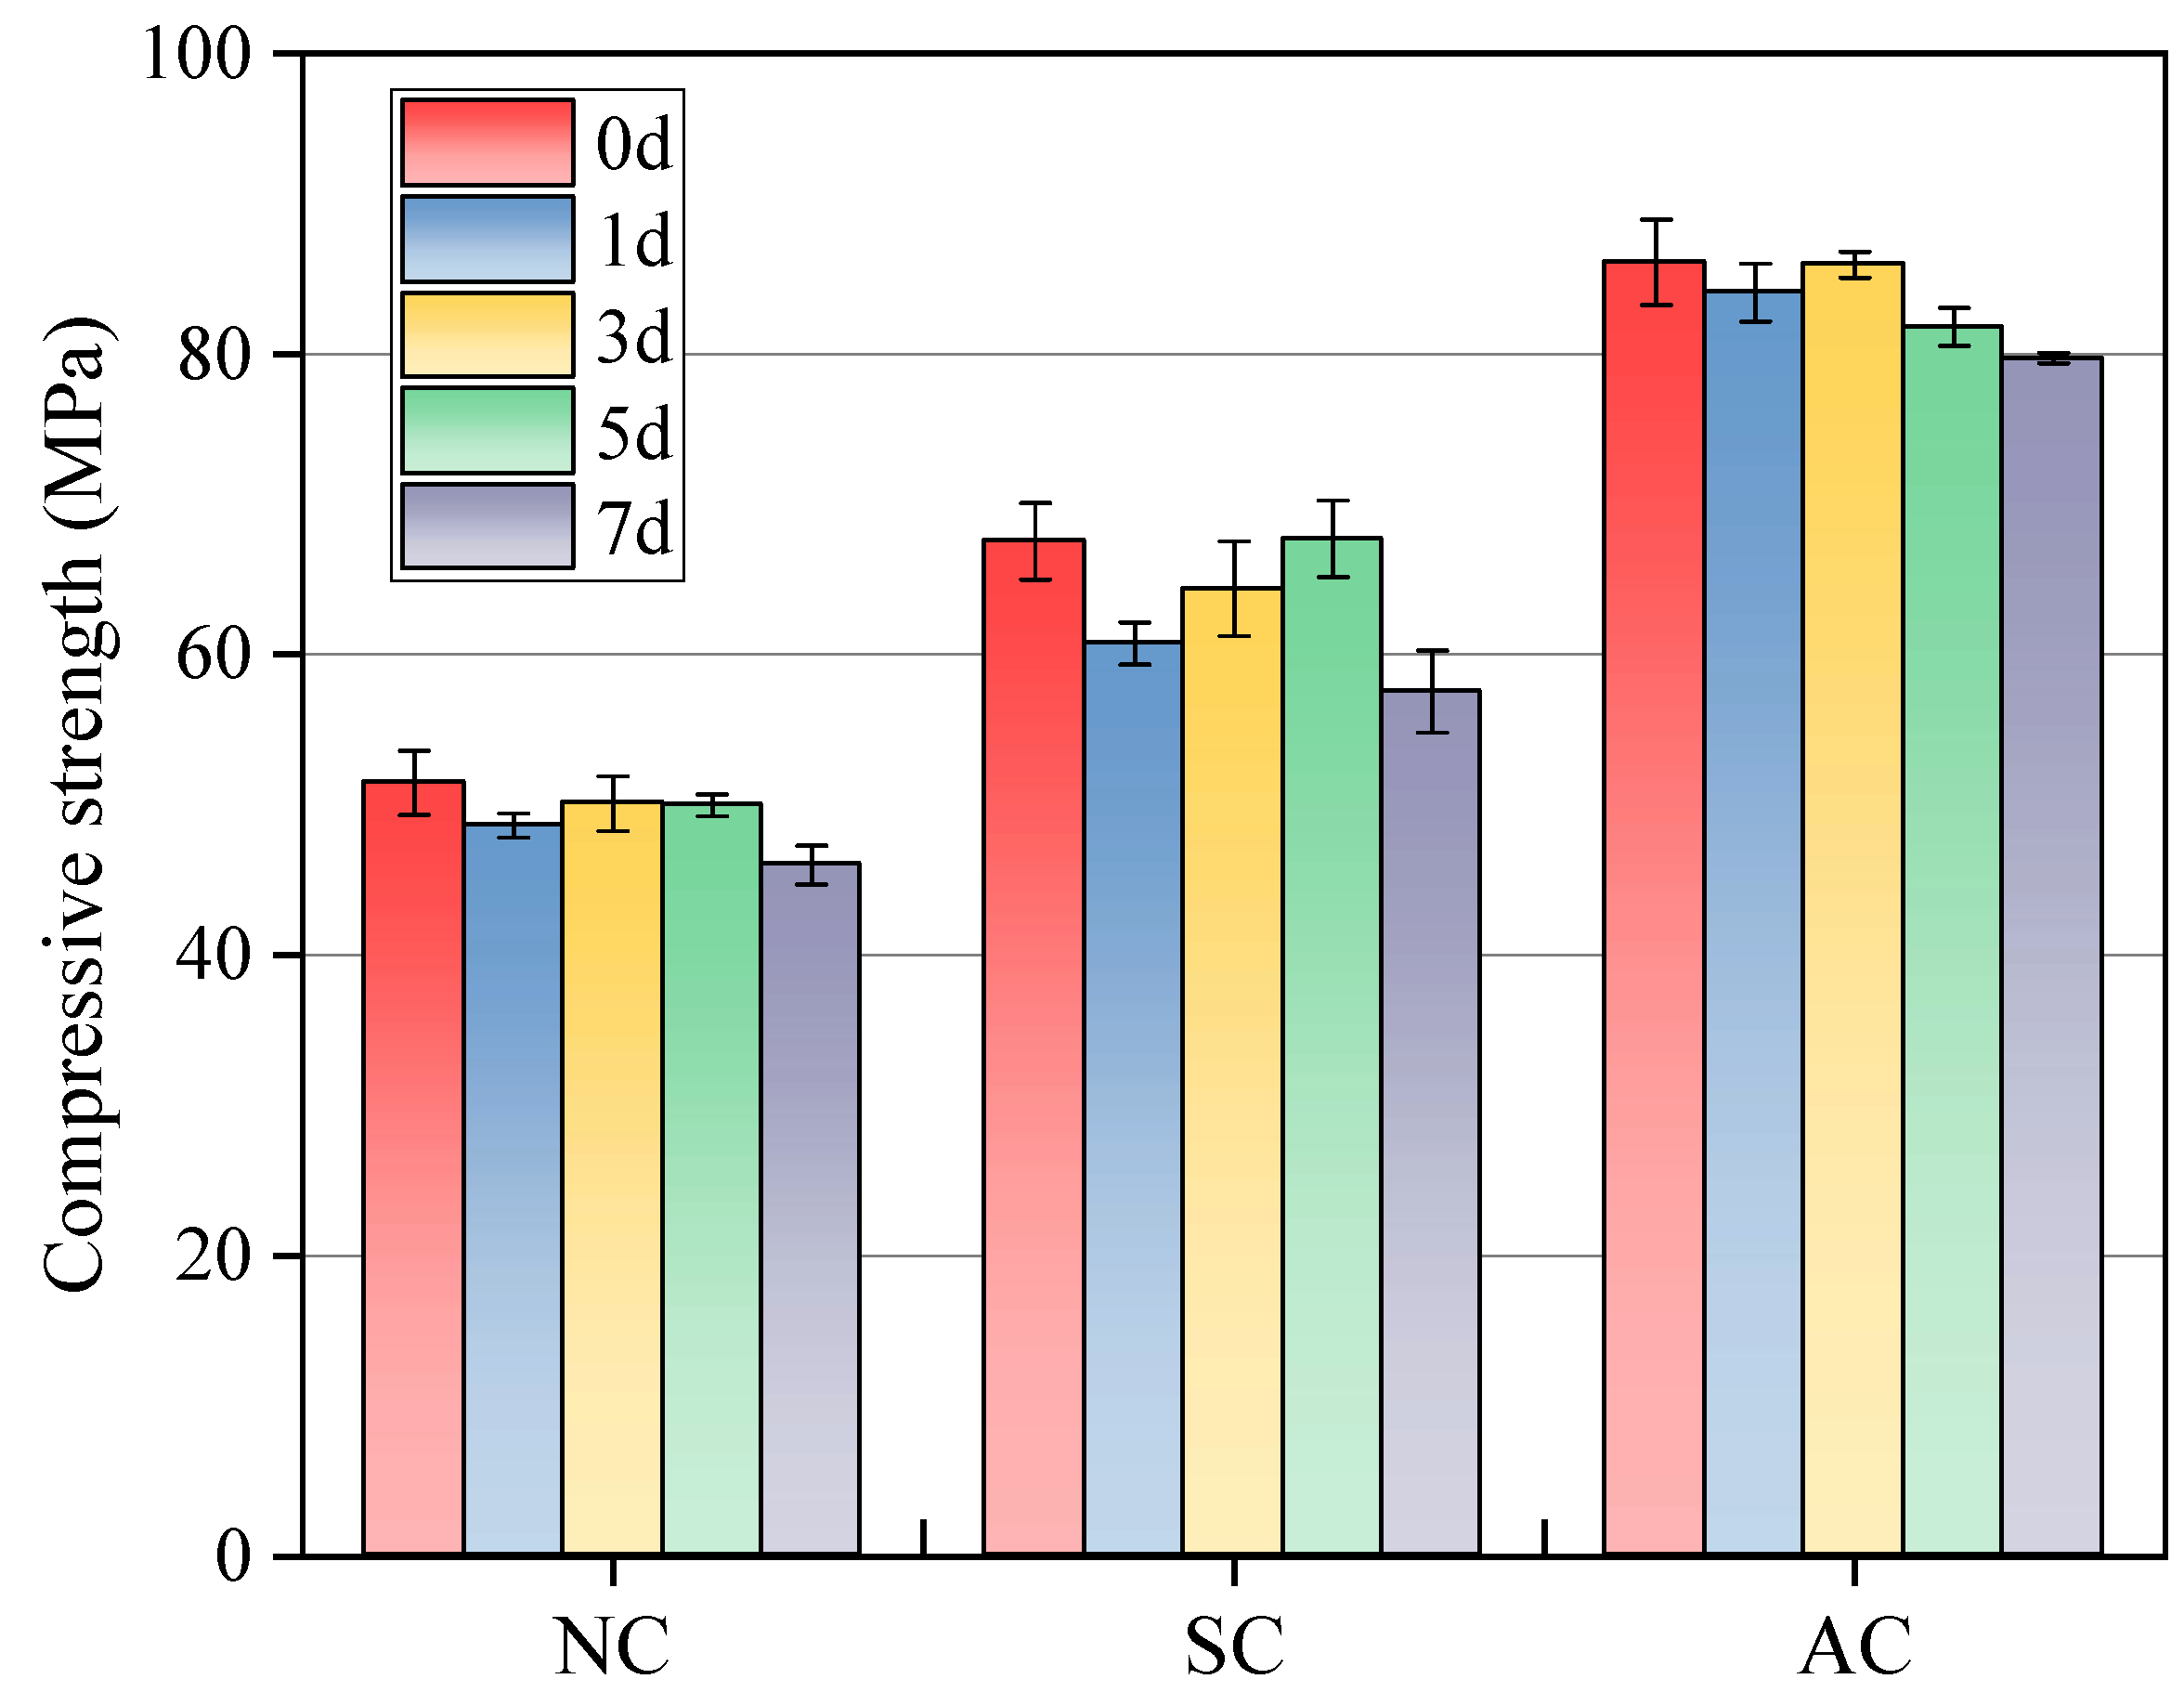
The peak values from the stress–strain curves presented in Figure 5 were extracted as the compressive strength of HSC, and the average values are displayed in Figure 6. It can be seen that NC yielded the compressive strength of 51.5 MPa after 28 d. Compared to NC, the 28-day compressive strength of SC and AC was 31.3% and 67.3% higher, respectively. It can be concluded that the elevated temperature generated by both steam curing and high-temperature autoclave curing enhances the pozzolanic activity of silica fume and promotes the hydration reaction of cement [,].
Figure 6. Compressive strength development of HSC after 28 d of casting, following different durations of exposure to 4.5% chloride solution.
Although compressive strength and electric flux are often inversely related, this relationship was not strictly observed in this study. The NC specimens exhibited the lowest electric flux but also the lowest strength, indicating that chloride permeability depends more on pore connectivity and microstructural integrity than on compressive strength alone. Under steam and autoclave curing, the accelerated hydration and formation of crystalline phases enhanced strength but may have introduced microcracks or coarser pores due to rapid temperature rise, resulting in higher ionic conductivity compared with normal curing.
The development of compressive strength of HSC exposed to 4.5% chloride solution can also be observed from Figure 6. As exposure time increased, the compressive strength exhibited a trend of first decreasing, then increasing, and finally decreasing again. Under normal curing, the compressive strength of HSC followed the pattern: a 5.5% decrease from 0 d to 1 d, a 2.98% increase from 1 d to 3 d, a 0.22% decrease from 3 d to 5 d, and a 7.9% decrease from 5 d to 7 d. For steam curing, the compressive strength followed the pattern: a 10.07% decrease from 0 d to 1 d, a 5.99% increase from 1 d to 3 d, a 5.17% increase from 3 d to 5 d, and a 15.02% decrease from 5 d to 7 d. The increased compressive strength of SC samples from 1 to 5 d of chloride exposure is likely due to ongoing hydration, which can partially offset the deleterious effects of chloride ingress at early exposure times []. After longer exposure periods, strength typically decreases due to accumulation of microcracks and chloride-induced microstructural damage []. Under high-temperature autoclave curing, the compressive strength of AC decreased by 2.35% from 0 d to 1 d, then increased by 2.21% from 1 d to 3 d, followed by a 4.82% decrease from 3 d to 5 d, and eventually a 2.53% decrease from 5 d to 7 d.

3.2.3. Modulus of Elasticity

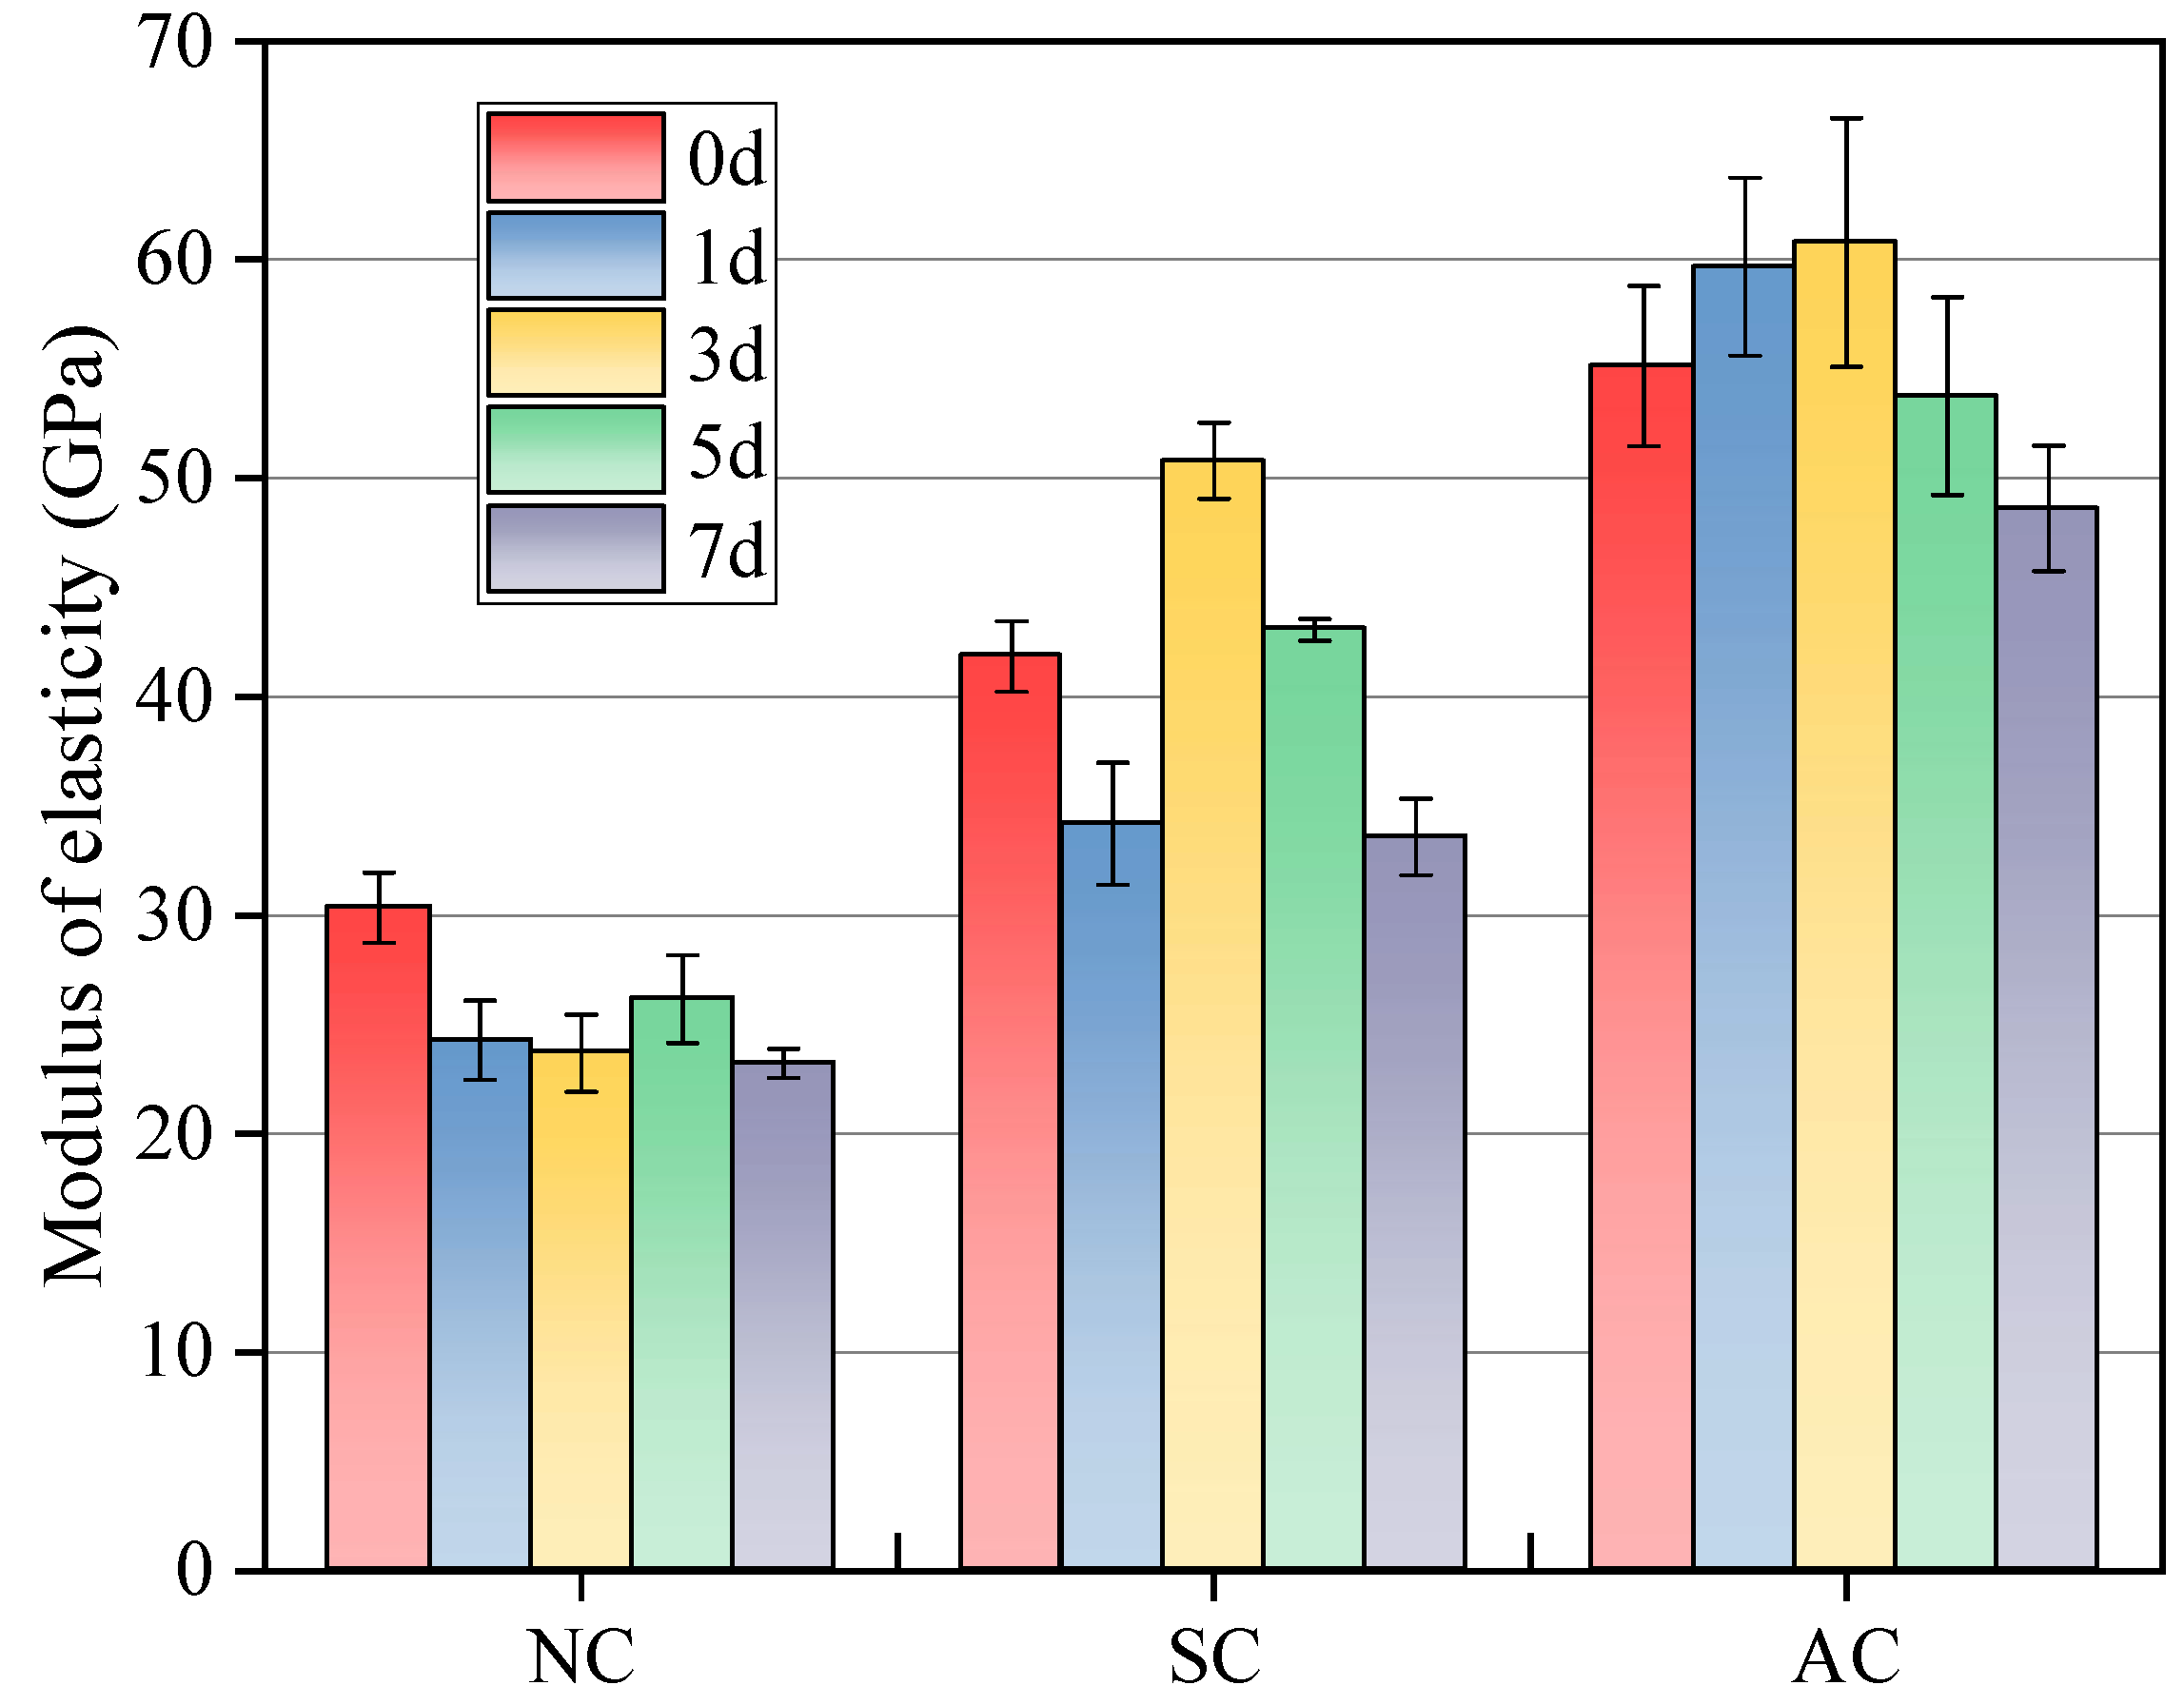
Figure 7 illustrates the effect of curing methods on the modulus of elasticity of HSC, both before and after chloride exposure, as derived from the data presented in Figure 5. After 28 d of curing and prior to chloride exposure, AC exhibited the highest modulus at 55.1 GPa, followed by SC at approximately 41.8 GPa, while NC showed the lowest value at 30.4 GPa. This highlights how more aggressive curing techniques enhance the material’s stiffness, likely due to improved microstructure densification and reduced porosity. However, after chloride exposure, all curing methods exhibit a decline in modulus, with AC and SC degrading more rapidly in the initial days (1 d–3 d). By 7 d, the modulus values converge to approximately 20–25 GPa, suggesting that the long-term durability benefits of AC and SC diminish under prolonged chloride attack.
Figure 7. Modulus of elasticity of HSC.
Moreover, it also revealed a critical trade-off between initial stiffness and chloride resistance. While AC and SC provide superior early-stage mechanical properties, their accelerated degradation under chloride exposure indicates potential vulnerability in harsh environments. In contrast, NC, though initially less stiff, shows a more gradual decline, implying better long-term stability. These findings underscore the importance of selecting curing methods based on environmental conditions, that is, intensive curing may be advantageous for short-term applications, but normal curing could be more suitable for structures exposed to prolonged chloride attack. Further research could explore modifying AC and SC processes to enhance chloride resistance without compromising initial stiffness.

3.2.4. Toughness

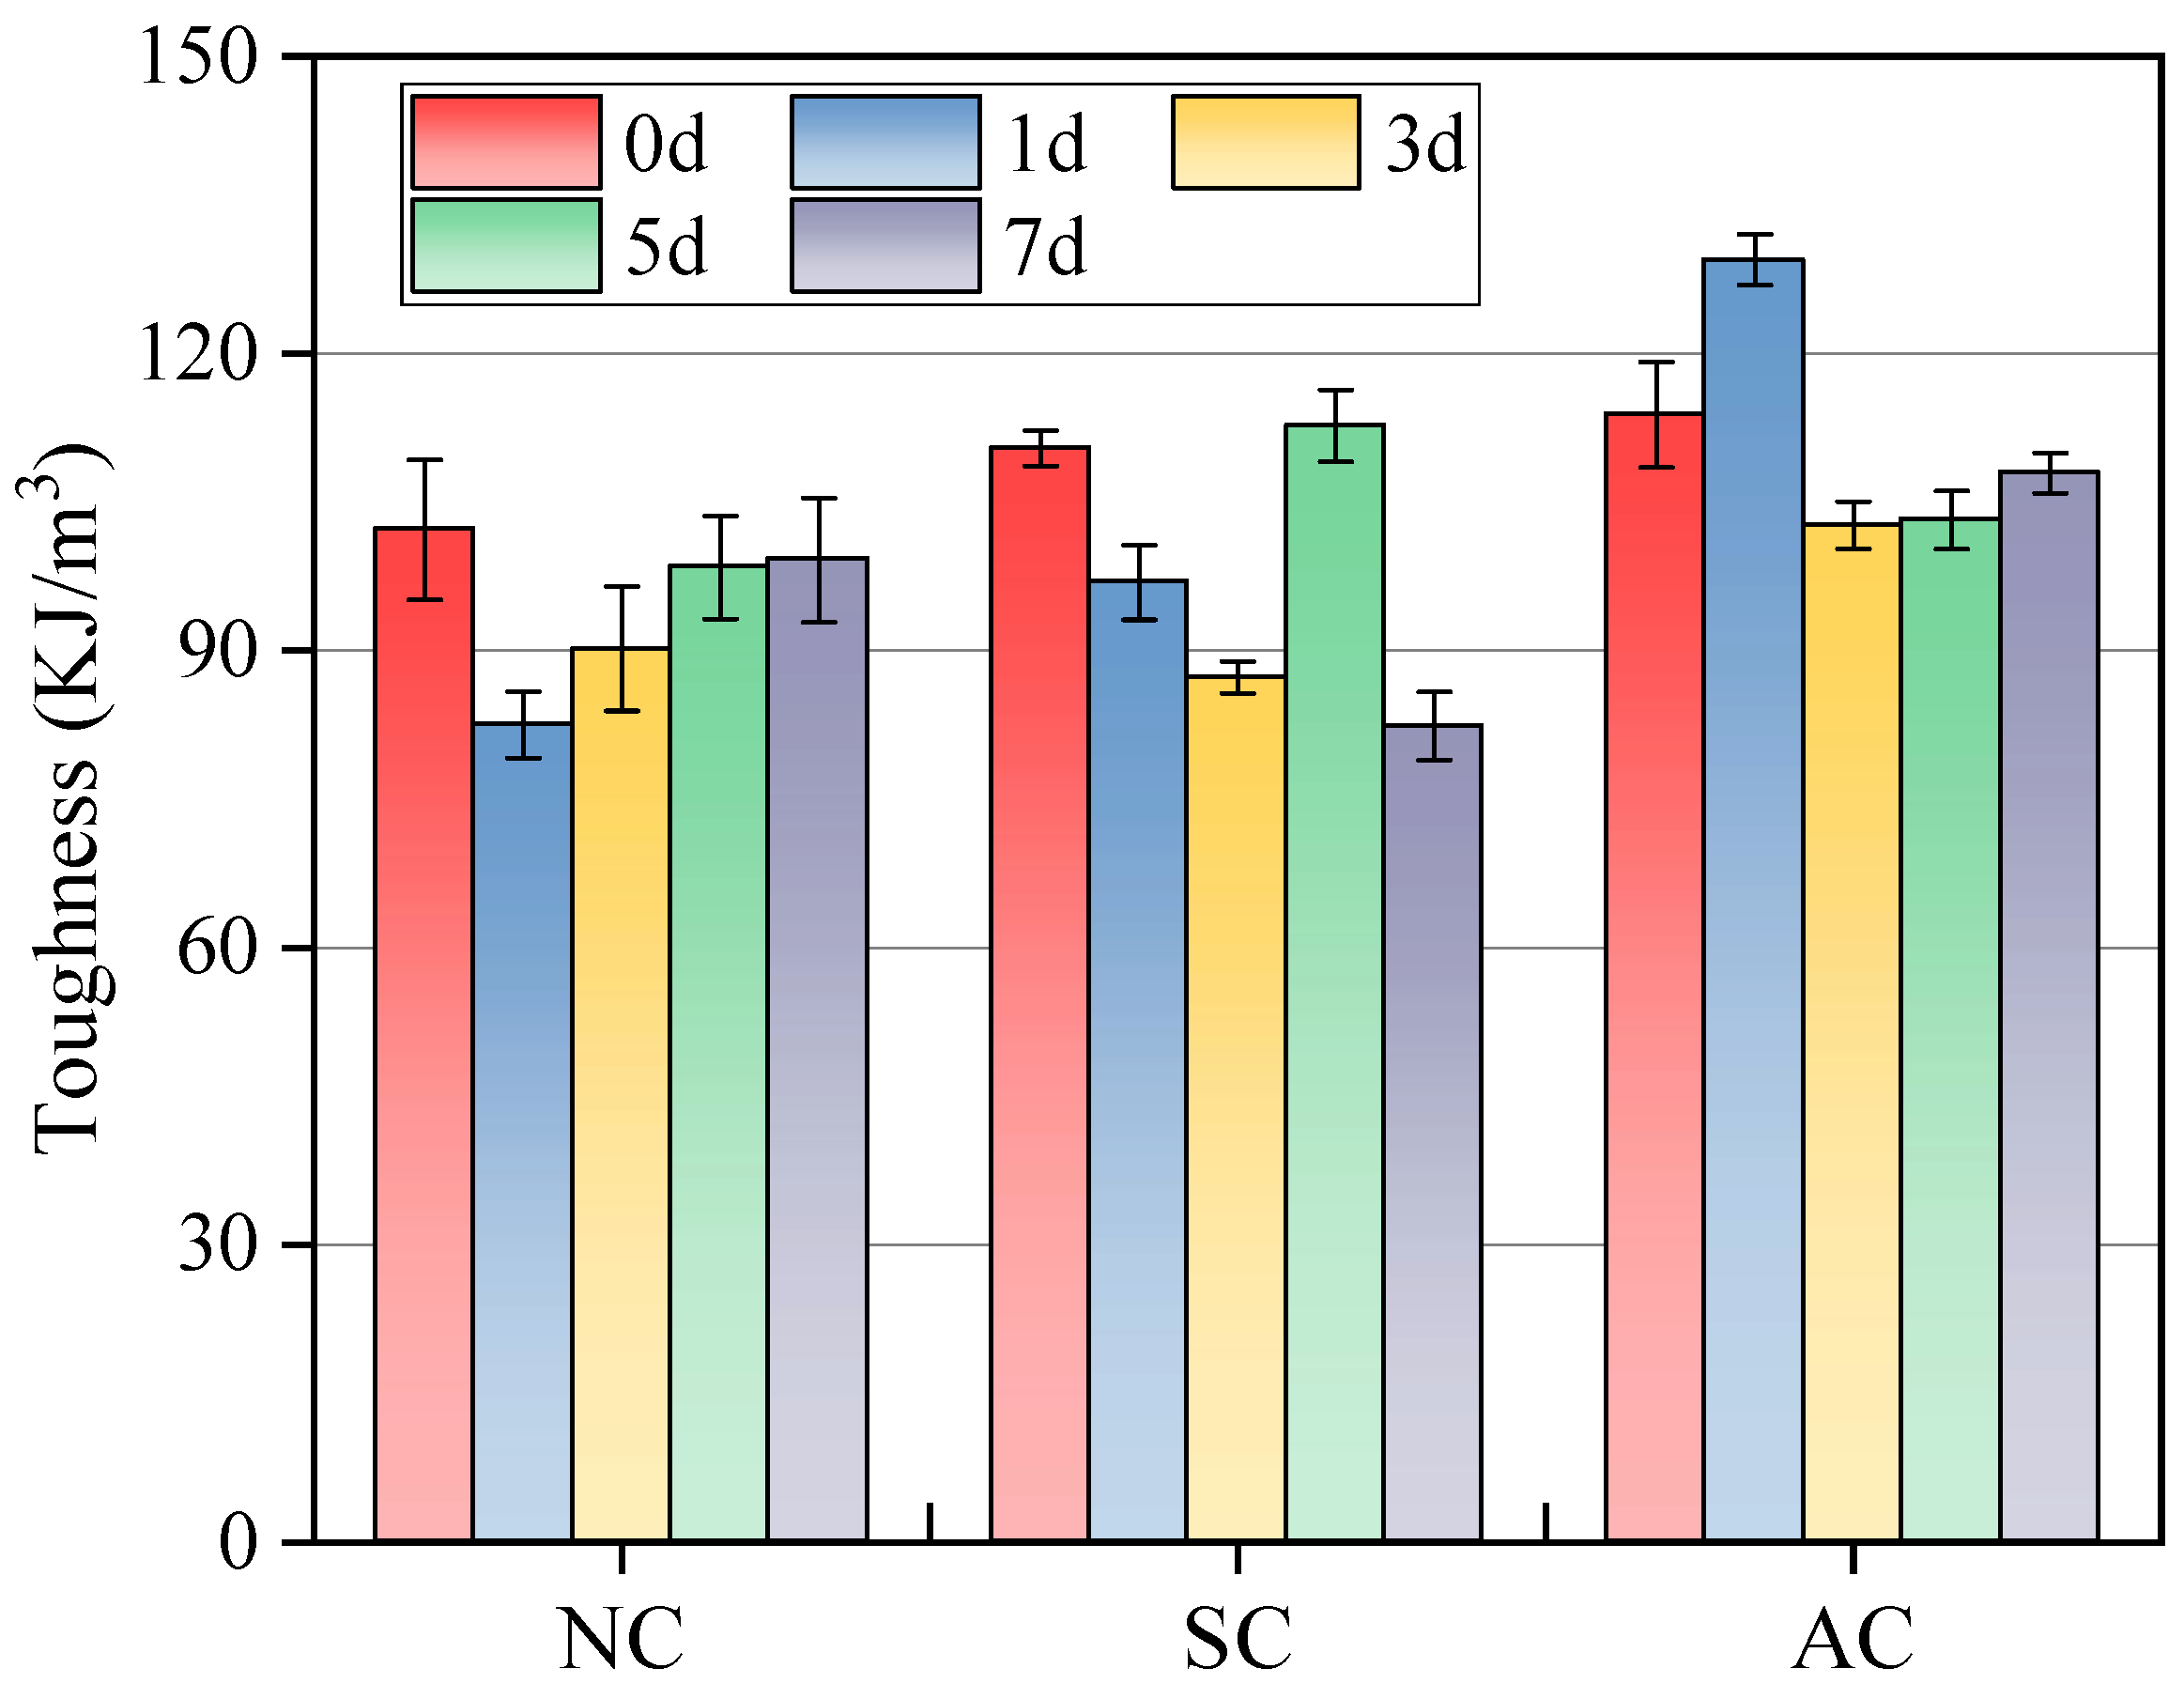
Figure 8 presents the impact of chloride exposure on HSC toughness across different curing methods. Before chloride exposure, AC showed the highest toughness (113.8 KJ/m3), followed by SC (110.4 KJ/m3) and NC (102.2 KJ/m3), reflecting the superior microstructure integrity achieved through intensive curing processes. After just 1 day of chloride exposure, both NC and SC exhibit a significant decline in toughness, whereas AC shows an increase in toughness. After 3 d, the toughness of SC and AC continues to decrease sharply, while NC exhibits a gradual increase, suggesting that the more homogeneous and milder hydration in NC may offer better resistance to early-stage chloride-induced damage.
Figure 8. Toughness of HSC.
After 5 d and 7 d of chloride exposure, the toughness values for all curing methods converge, indicating that prolonged chloride attack erodes the initial advantages of AC and SC. Notably, the toughness of NC remains relatively stable after the initial decline, outperforming SC and AC in long-term durability. This trend highlights a critical trade-off: while AC and SC provide superior initial toughness, their performance degrades rapidly under chloride exposure, whereas NC, though less tough initially, offers better sustained performance in aggressive environments. These findings emphasize the need to balance short-term mechanical properties with long-term durability when selecting curing methods for chloride-prone applications.

3.2.5. Specific Toughness

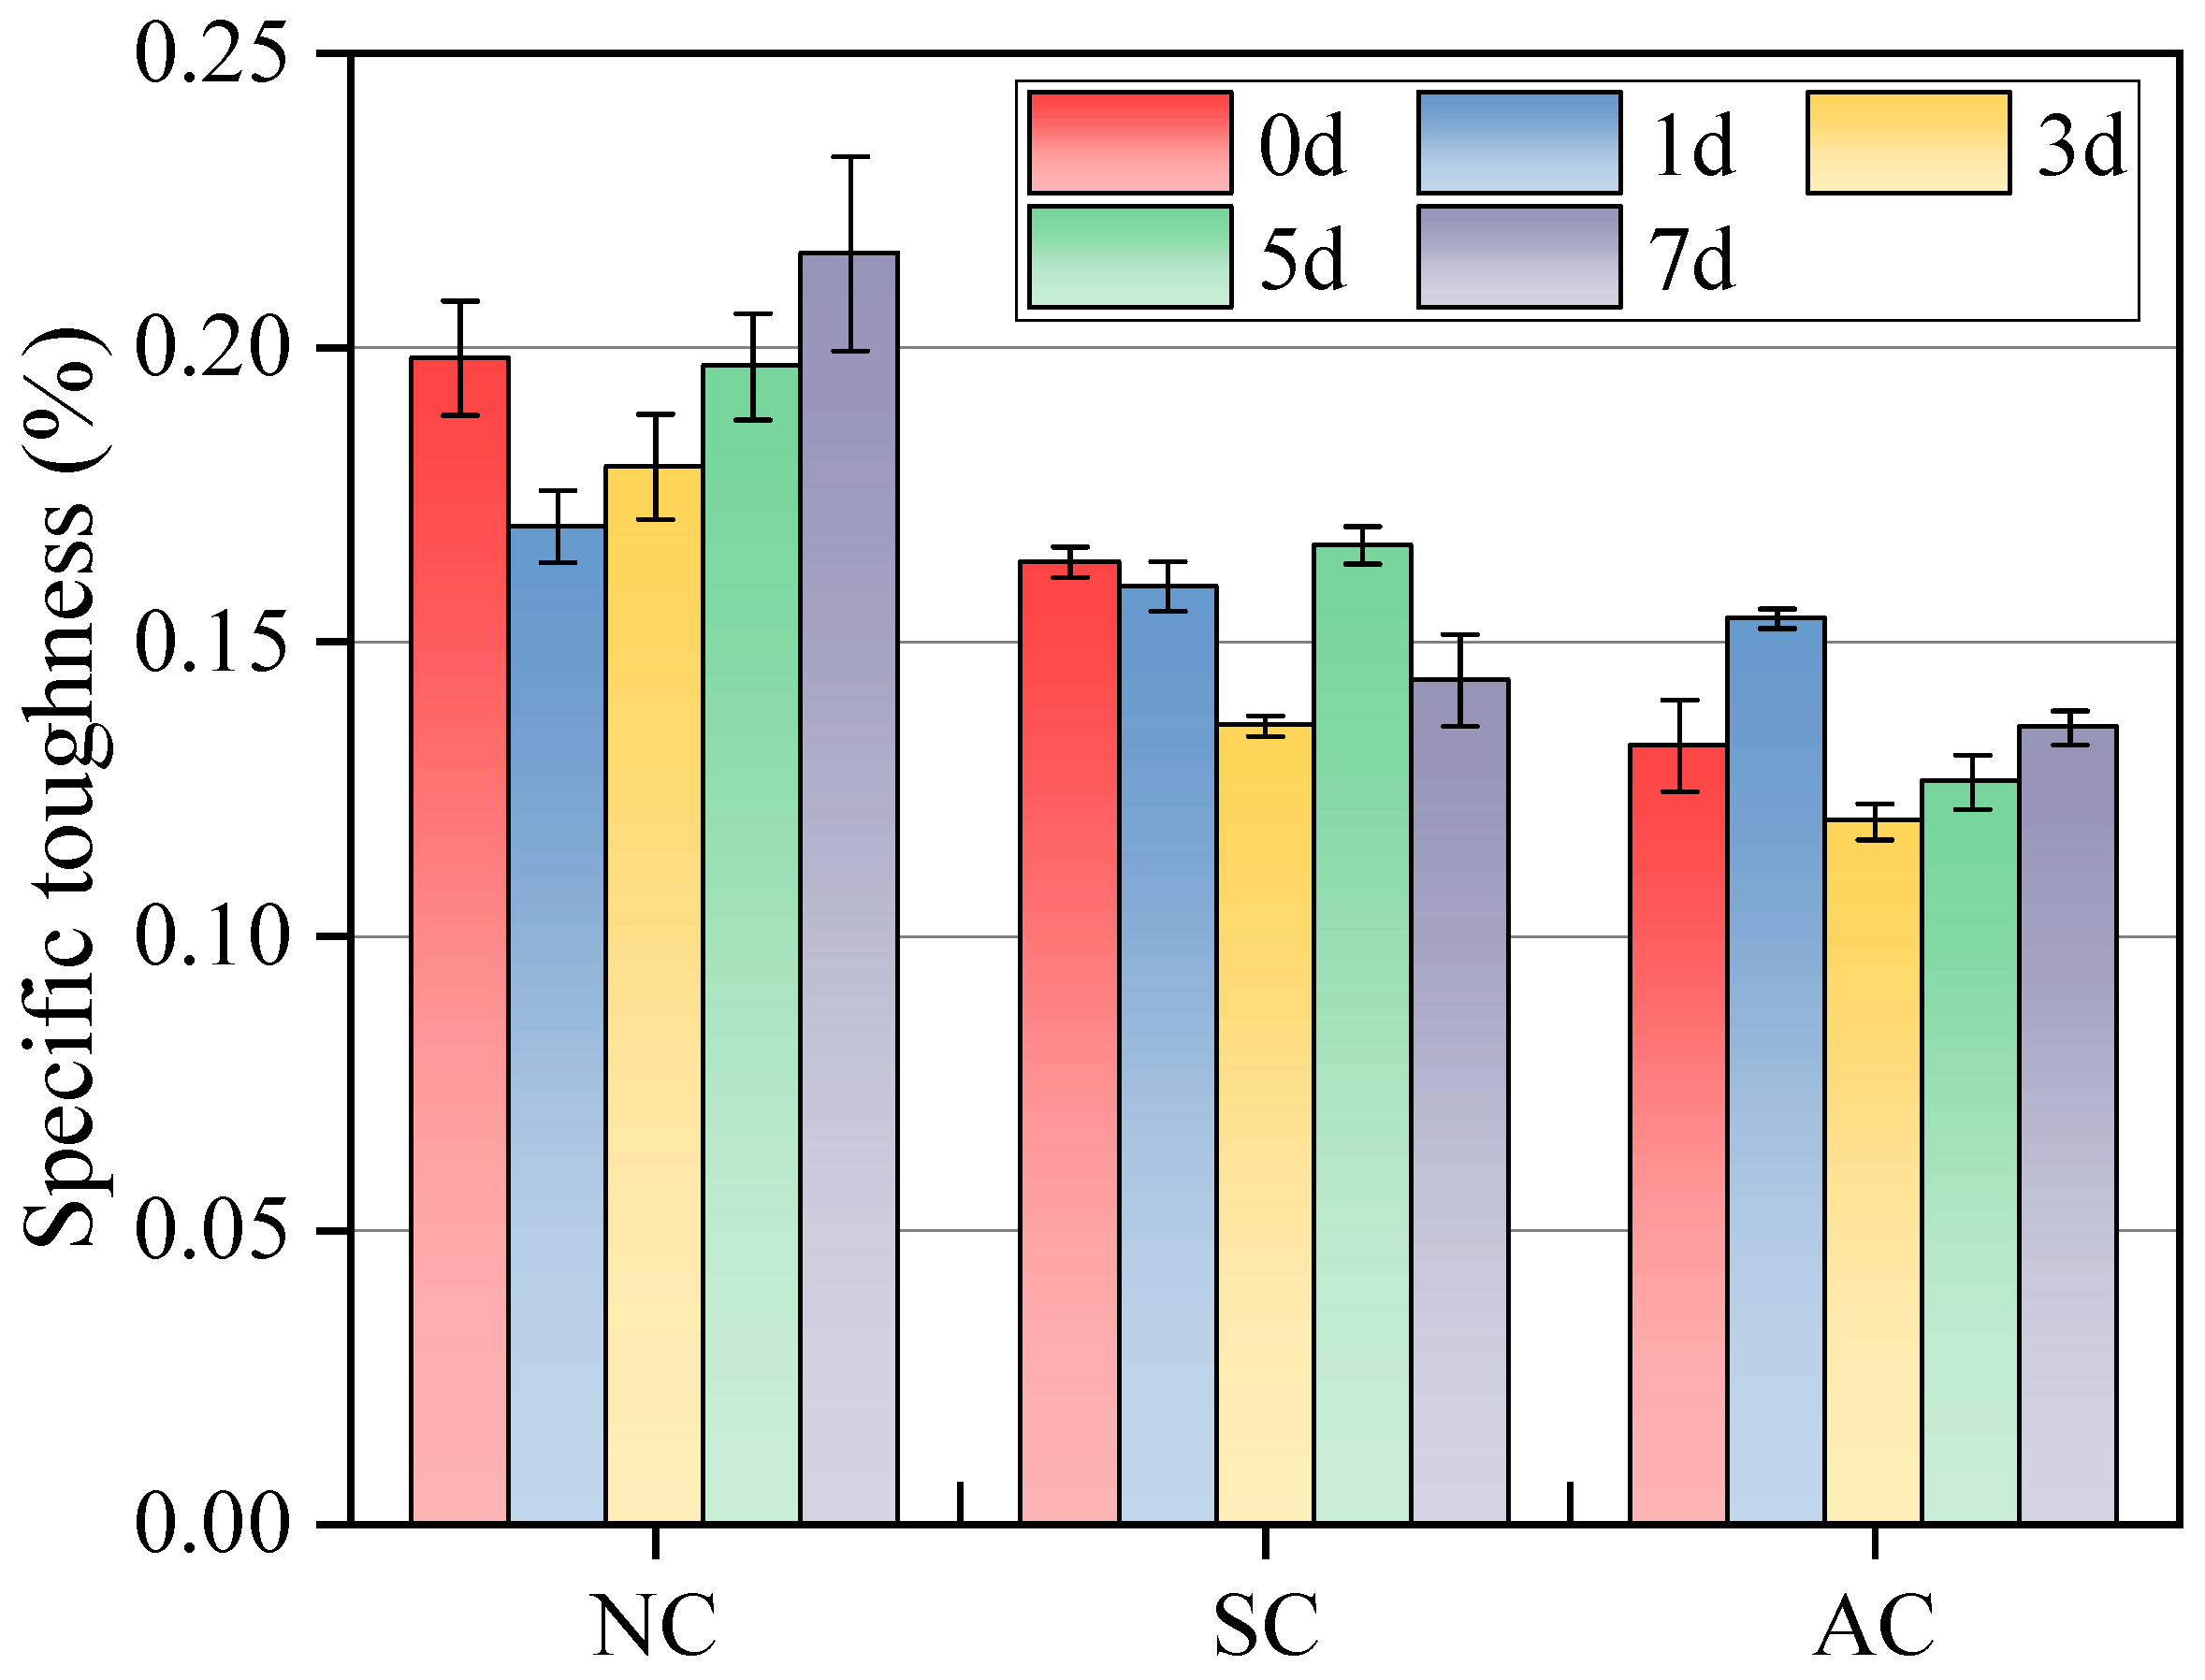
Specific toughness of concrete is defined as the ratio of its toughness to compressive strength, providing a measure of the material’s energy absorption capacity relative to its strength []. This metric is significant as it offers insight into the concrete’s ability to withstand dynamic loads and resist cracking without failure, making it an important indicator of durability []. The evolution of specific toughness for HSC subjected to NC, SC, and AC before and after chloride exposure was presented in Figure 9. Before chloride exposure (0 d), NC exhibits the highest specific toughness of 0.20%, followed by SC (0.16%) and AC (0.13%), reflecting the poorer microstructural integrity achieved through high-pressure and high-temperature curing. This initial advantage underscores the effectiveness of the milder curing methods in optimizing energy absorption capacity relative to concrete strength.
Figure 9. Specific toughness of HSC.
After 1 d of chloride exposure, NC and SC exhibit a decrease in specific toughness, with reductions of 14.4% and 2.5%, respectively. In contrast, AC showed a 16.3% increase in specific toughness from 0 d to 1 d. After 3 d, the downward trend in specific toughness continues for SC. A more pronounced decrease is observed in AC, with its specific toughness dropping to 0.12%, which is 12.0% lower than that of SC. Notably, an increase in specific toughness was observed in NC from 1 d to 7 d, further confirming the benefits of milder cement hydration in enhancing the long-term durability of concrete exposed to chloride attack.
After 7 d of chloride exposure, the specific toughness values for both SC and AC converge to around 0.14%. This convergence highlights a critical limitation of intensive curing methods: while they enhance early-stage strength (see Figure 6), their microstructures are more susceptible to chloride damage over time. For applications in chloride-rich environments, NC may offer a more balanced compromise between initial performance and sustained durability, prompting reconsideration of curing strategies for long-term structural resilience.

3.2.6. Relationship Among Mechanical Properties

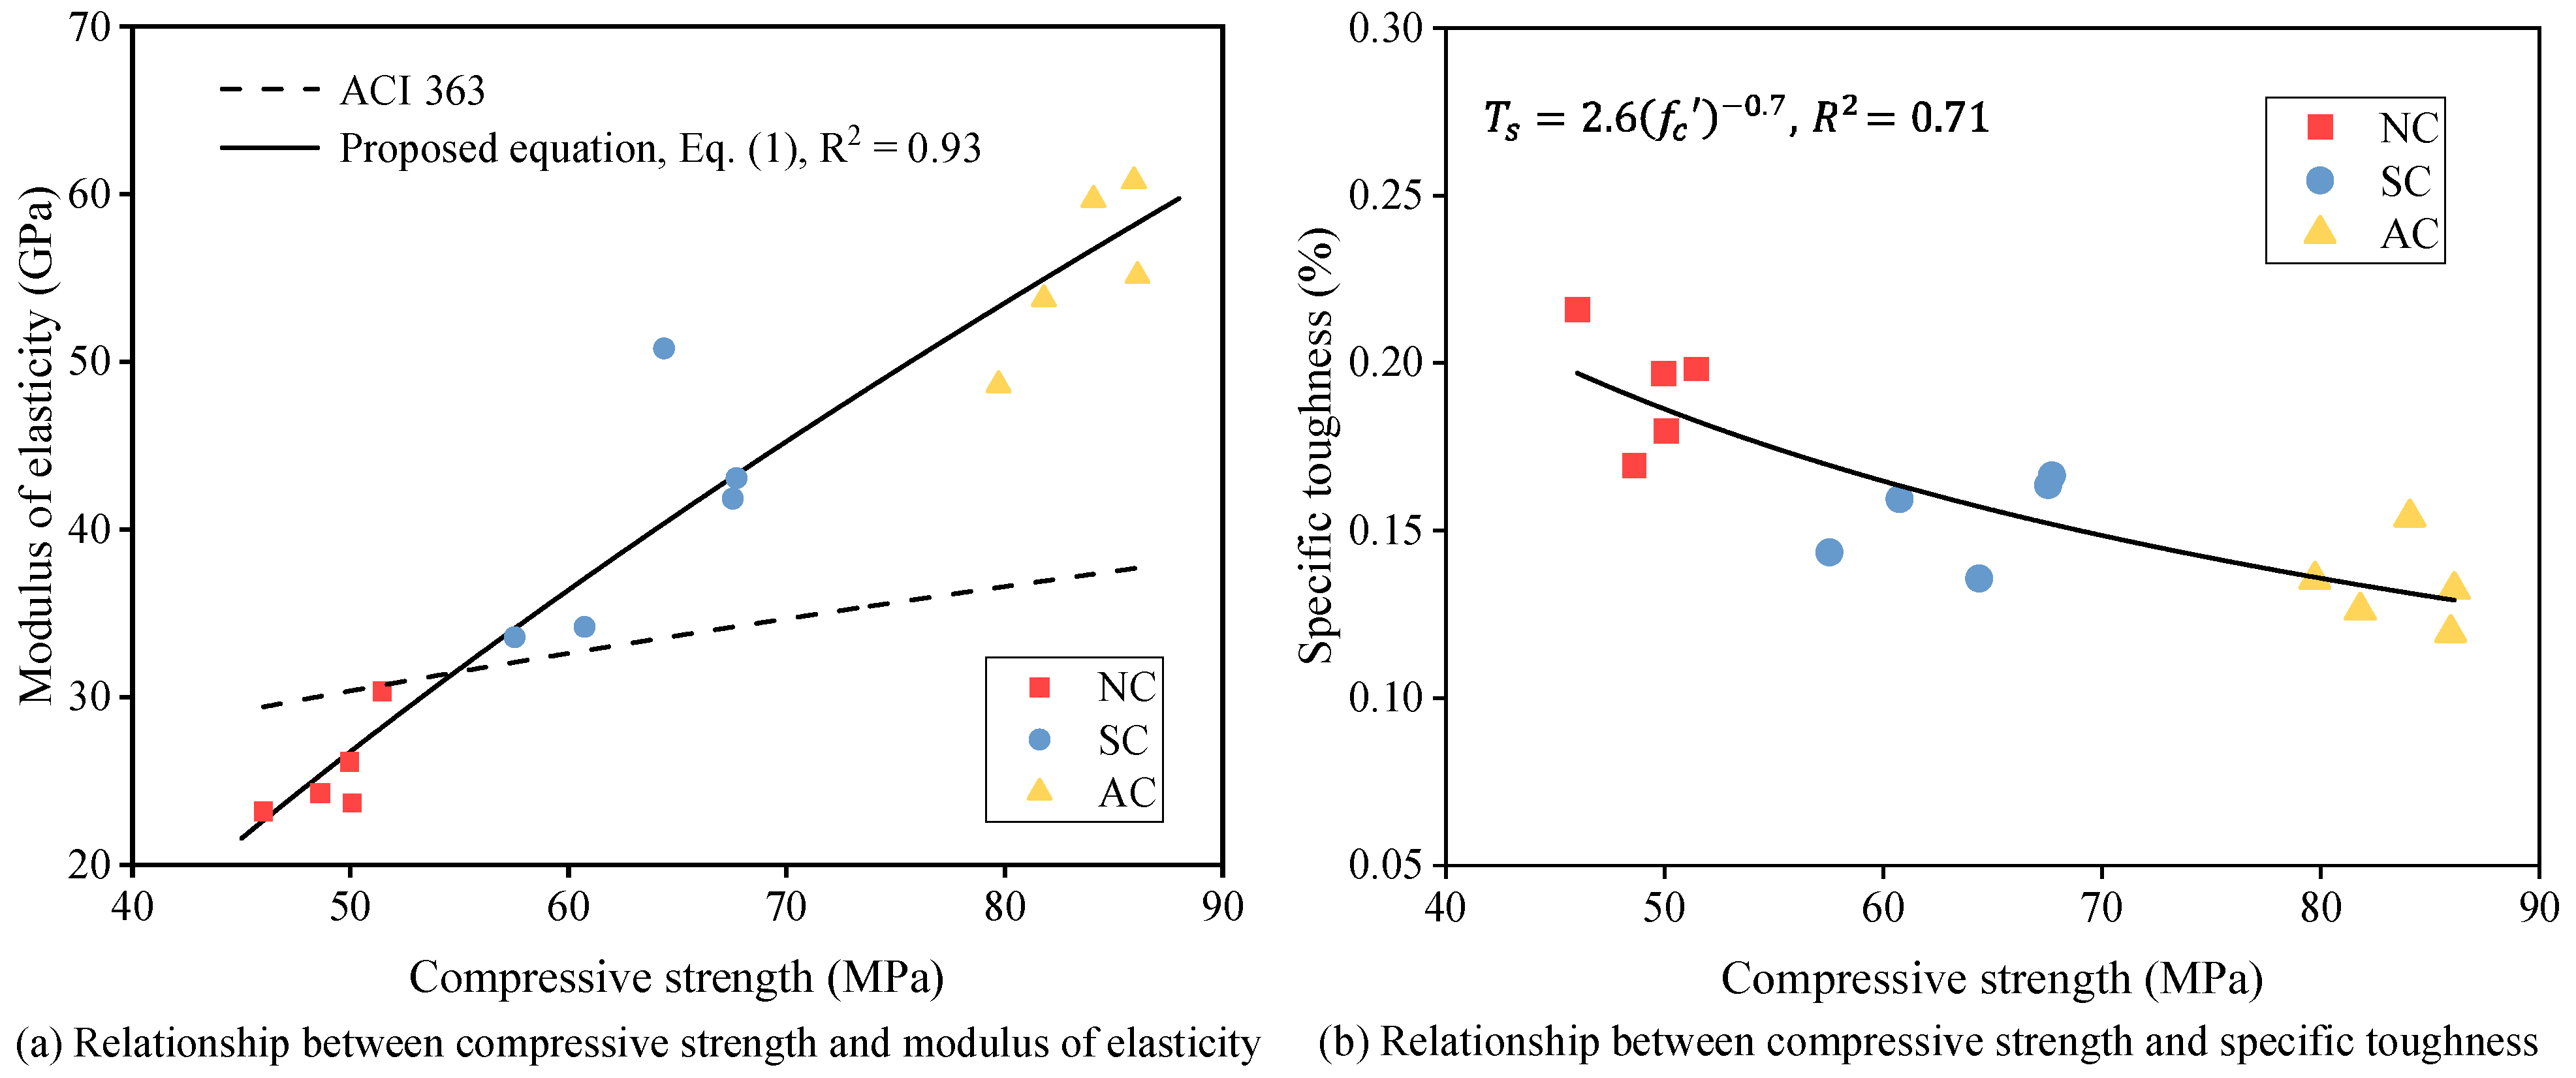
The mechanical behavior of concrete is inherently interdependent, with parameters such as compressive strength, modulus of elasticity, and toughness, exhibiting correlated trends that are frequently leveraged in structural engineering analyses and design methodologies []. The relationships between the compressive strength of HSC and its modulus of elasticity and specific toughness are presented in Figure 10a and Figure 10b, respectively. It should be noted that the HSC used in this study had identical materials and mix proportions, while the curing conditions and durations of chloride exposure varied.
Figure 10. Relationships between compressive strength and (a) modulus of elasticity and (b) specific toughness of HSC.
As shown in Figure 10a, the modulus of elasticity of the HSC under chloride exposure follows the general form of the empirical equation proposed by ACI Committee 363 [], but with different parameter values. Based on the experimental data, the following equation is proposed for HSC with compressive strengths in the range of 45 MPa < fc’ < 90 MPa after up to 7 d of chloride exposure:
E c = 14.28 f c 74.2
It should be noted that the modulus of elasticity (Ec) in this equation is expressed in GPa, while the compressive strength (fc’) is given in MPa.
From Figure 10a, it can also be seen that the ACI 363 equation, E c = 3.32 f c 6.9 , valid for compressive strength of HSC in the range of 21 MPa < fc’ < 83 MPa, overestimated the modulus of elasticity for NC, but underestimated it for SC and AC. Noteworthy, the compressive strength of NC before chloride exposure falls in curve of ACI 363 equation. The reduction in the modulus of elasticity of NC after chloride exposure may be attributed to microstructural damage caused by chloride ingress, which appears to affect stiffness more severely than compressive strength. However, steam and autoclave curing can significantly increase the modulus of elasticity of concrete, often to a greater extent than compressive strength, particularly at early ages. Therefore, the underestimated modulus of elasticity for SC and AC observed in this study aligns with previous findings []. These thermal curing methods accelerate the hydration of cementitious phases, leading to rapid formation of C–S–H, which enhance stiffness by improving the connectivity of load-bearing phases [].
As illustrated in Figure 10b, the specific toughness (Ts) is negatively correlated with the compressive strength of HSC. The highest specific toughness (0.20–0.25%) was reached by NC with the lowest compressive strength (45–55 MPa). In contrast, AC displays the highest compressive strength (80–90 MPa) but the lowest specific toughness (0.10–0.13%). SC occupies an intermediate position in both strength and toughness. This trend highlights the increased strength of concrete due to steam and autoclaved curing but leads to decreased ductility and energy absorption capacity.

3.3. X-Ray Diffraction Analysis

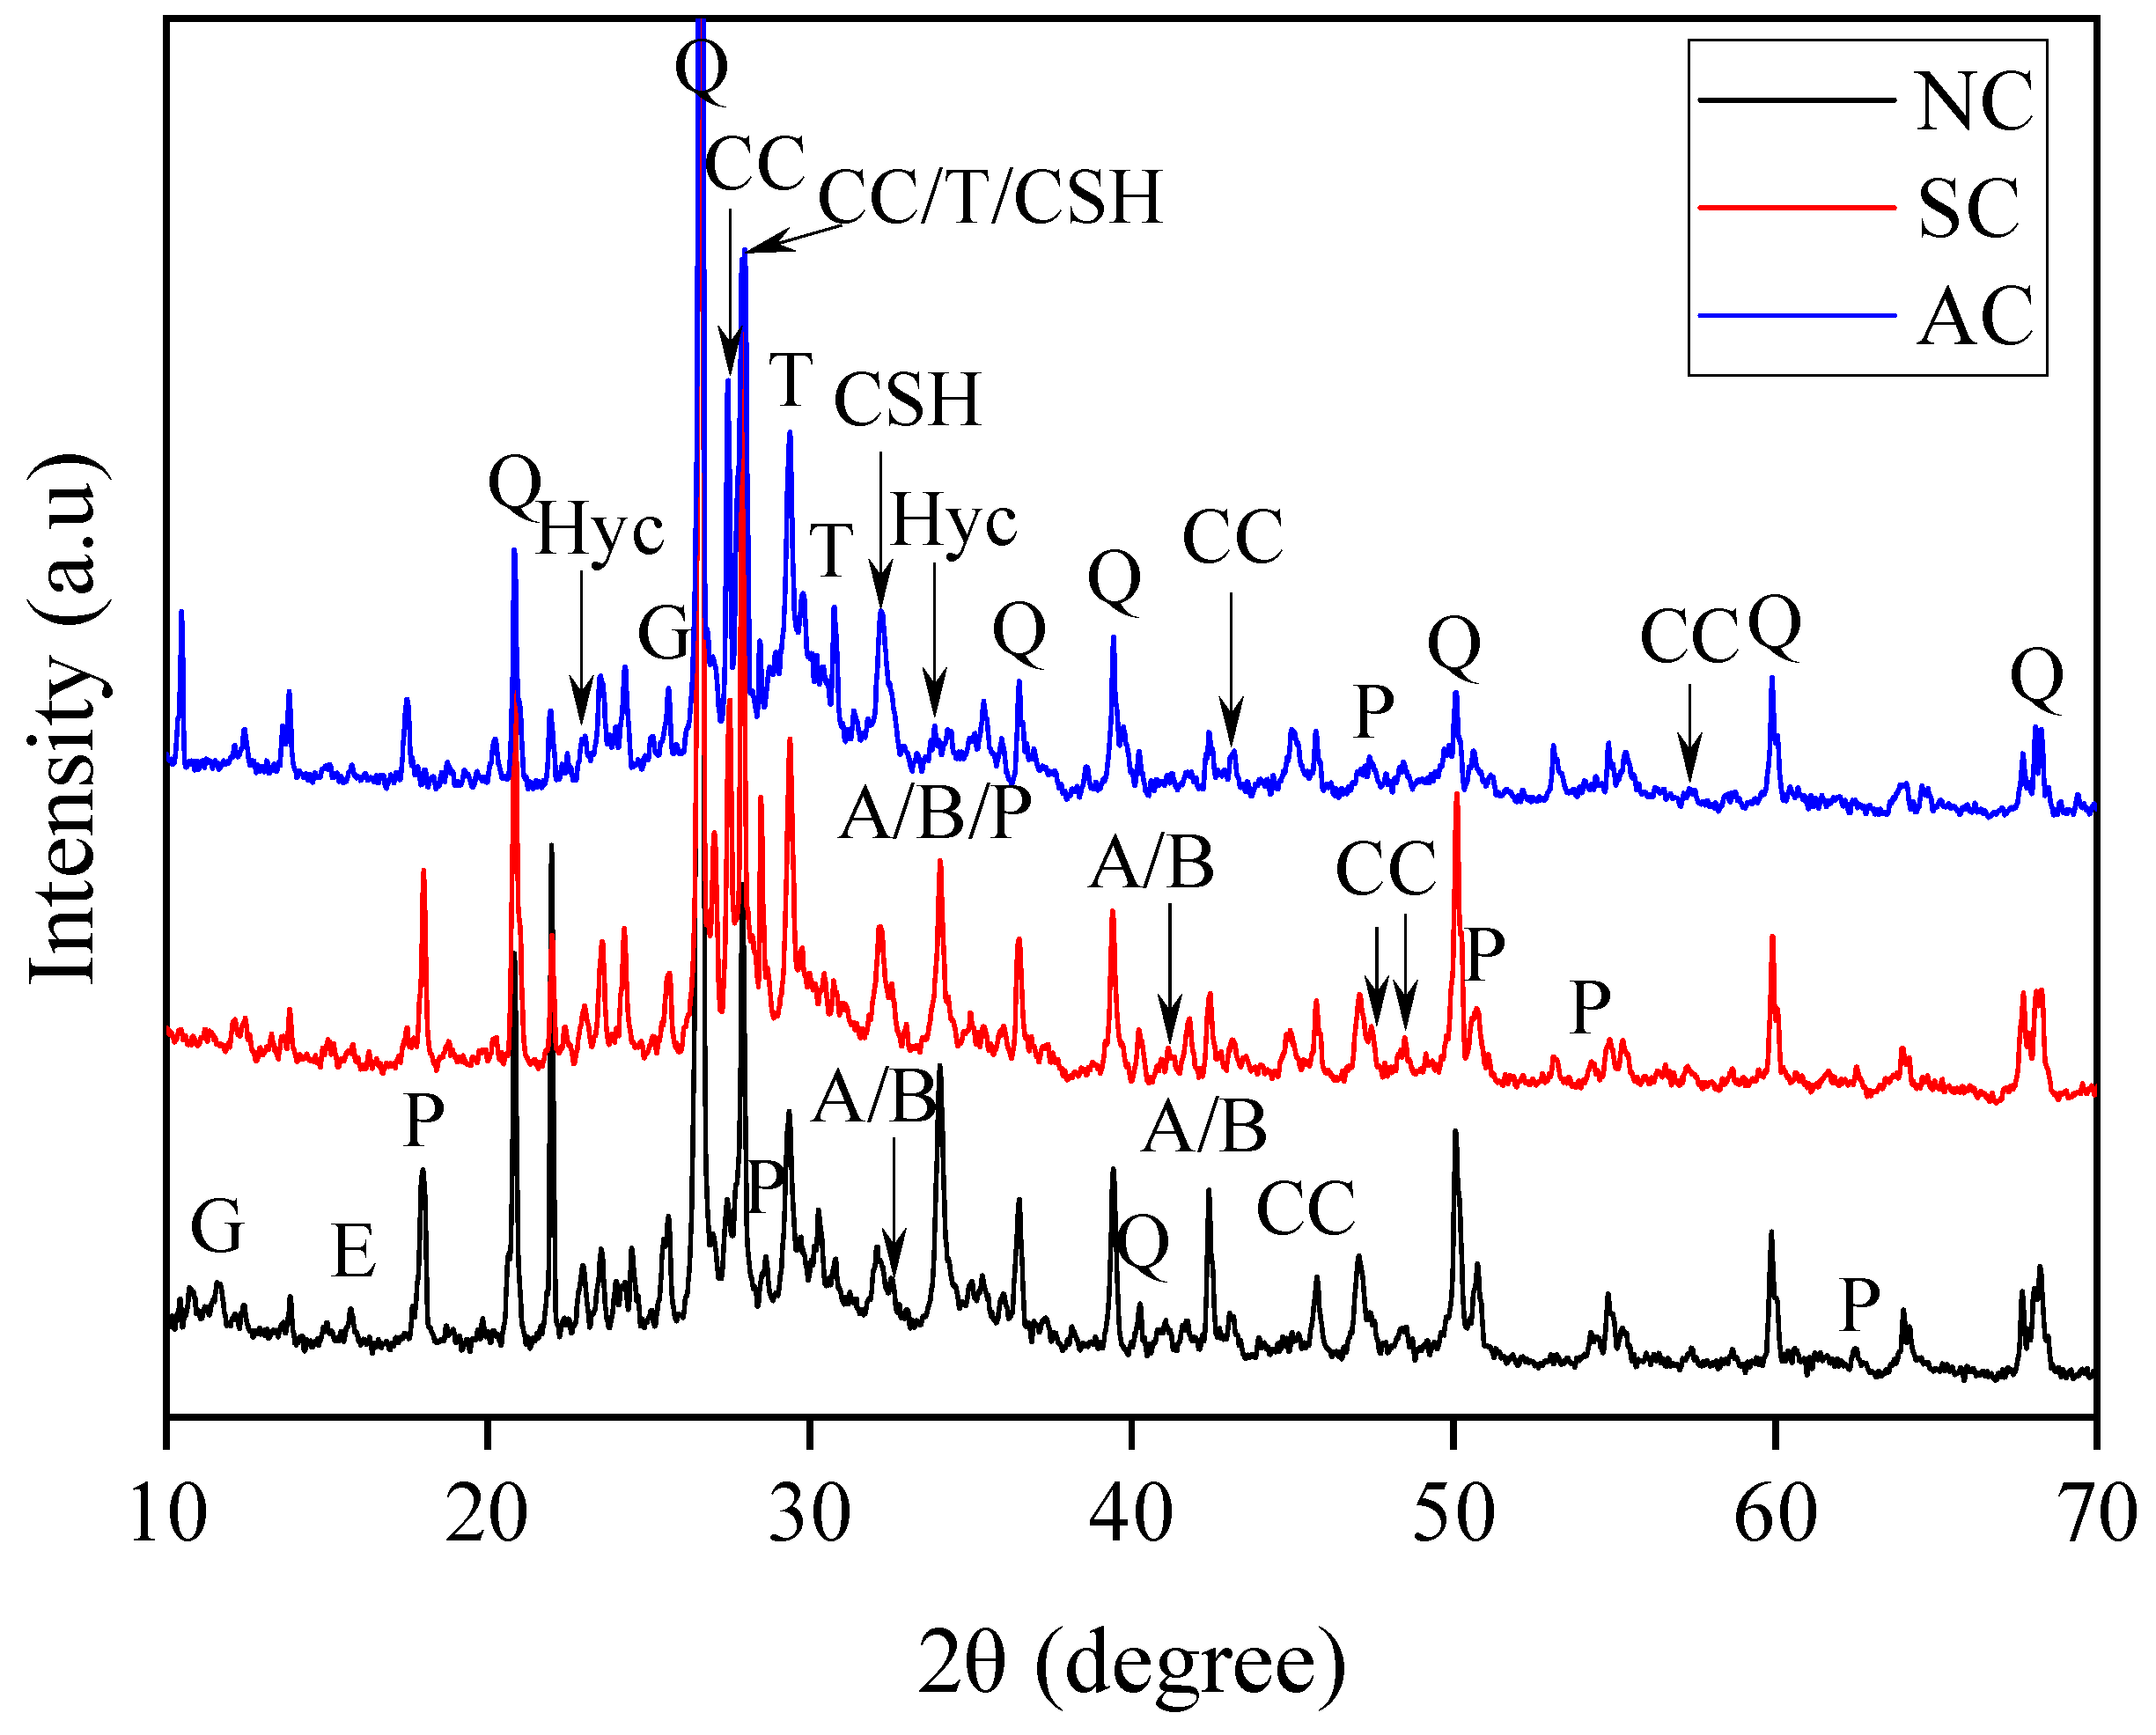
Figure 11 shows the XRD patterns of HSC after 28 d of curing under various conditions. Although the diffraction peaks are dominated by quartz, observed at 2θ values of 20.8°, 26.6°, 36.5°, 39.5°, 40.3°, 50.1°, 59.9°, and 68.1° [], due to the presence of aggregates and silica sand powder, the main hydration products are still identifiable and allow assessment of the effects of curing conditions. Compared to NC, SC exhibited lower intensities of unhydrated clinker phases, such as alite and belite (at 32.6°, 34.0°, 41.2°, and 42.5° 2θ []), a more pronounced hump between 20° and 40° 2θ corresponding to amorphous and semi-crystalline CSH gels [], and a stronger peak at 32.2° 2θ for crystalline CSH [], indicating enhanced cement hydration under steam curing. As expected, autoclave curing promoted the formation of tobermorite, which was confirmed by the peaks observed at 29.3° and 30° 2θ in the AC sample [,]. The characteristic peak centered around 28° 2θ, generally attributed to the superposition of CC, tobermorite, and C-S-H gels [], was further intensified in the SC and AC samples compared with the NC sample. This observation confirms the accelerated formation of hydration products under the intensive curing regimes. On the contrary, the electric flux of NC is lower than SC specimens. This suggests that while steam curing accelerates hydration, it can also produce coarser pores or microcracks, increasing ionic transport, whereas the slower hydration in NC results in a denser pore structure and lower electric flux.
Figure 11. XRD patterns of HSC after 28 d of curing under various conditions (G: gypsum, E: ettringite, P: portlandite, Q: quartz, CC: calcium carbonate, A: alite, B: belite, CSH: calcium silicate hydrates, T: tobermorite, Hyc: hydrotalcite).
The peaks at 18°, 28.5°, 34°, 47°, 50.66°, 54°, and 64.2° 2θ are attributed to calcium hydroxide (CH) [,]. However, their intensities decreased under steam curing compared to NC sample. This may be attributed to the reaction between amorphous silica in the silica sand powder and CH at elevated temperatures []. More notably, AC exhibited further reductions in the peaks of unhydrated clinker phases and CH, along with increased CSH peak intensity compared to NC and SC. This further confirms that the elevated temperature and high-pressure conditions of autoclave curing significantly enhanced cement hydration and promoted the reaction between CH and the silica sand powder. These findings align with the higher compressive strength observed in AC compared to SC, with NC exhibiting the lowest strength, as discussed in Section 3.2.2.
Additionally, the peak at 15.7° 2θ, attributed to ettringite [], showed a decrease in intensity from NC to SC, with a further reduction observed in AC. Ettringite has also been reported to decompose into monosulfate under steam curing, as evidenced by both XRD analysis and thermodynamic modeling []. This is also consistent with the reduced gypsum peaks at 11.6 and 25.7° 2θ [] observed in SC and AC compared to NC, suggesting the conversion of ettringite to monosulfate under elevated temperature and limited gypsum availability []. Moreover, multiple peaks corresponding to calcium carbonate (CC) were observed, as shown in Figure 11, particularly in SC and AC, indicating carbonation of the cement matrix under elevated temperature and high-pressure curing conditions.

3.4. Microstructure Analysis

Figure 12a–c present SEM images of the NC, SC, and AC samples, respectively, after 28 d of curing at a magnification of 10,000×. In Figure 12a, the NC sample exhibits typical hexagonal CH, needle-like ettringite, and semi-crystalline, layered CSH structures. Consistent with the XRD results presented in Section 3.3, the SC sample (Figure 12b) qualitatively shows reduced amounts of CH and ettringite, accompanied by increased formation of CSH gel and CC, the latter identifiable by its characteristic cubic morphology. In the AC sample (Figure 12c), crystalline, layered C-S-H structures are observed, along with a higher presence of CC and the absence of CH and ettringite. These microstructural observations provide qualitative support for the XRD findings discussed earlier.
Figure 12. SEM images of UPC after 28 d of curing under various curing conditions.
Moreover, compared to NC, both SC and AC exhibited more cracks and higher pore density. These observations further support the assumption discussed in Section 3.1.1 that steam curing introduces additional pores into the cement matrix due to the rapid and inhomogeneous hydration of cement. However, despite the larger cracks, SC and AC showed higher compressive strength than NC, indicating that the enhanced hydration and formation of dense C-S-H and tobermorite phases under accelerated curing dominate the strength development. On the contrary, the more cracsks formed in SC may contribute to the higher decrease in strength after chloride attack as shown in Figure 6. The greater number of cracks in SC may contribute to the higher strength reduction observed after chloride exposure, as shown in Figure 6. In contrast, the cracks in AC were smaller, likely due to secondary reactions of silica sand powder that help fill pores and refine the microstructure. This interpretation is consistent with the lower electric flux values observed in AC compared to NC and suggests that the microcracks primarily affect short-term strength fluctuations rather than the overall compressive strength.

4. Conclusions

This study evaluated the effects of different curing regimes (normal curing, steam curing, and autoclave curing) and chloride exposure on the chloride penetration, mechanical behavior, and microstructural characteristics of prestressed high-strength concrete (HSC) pipe piles. The following conclusions are drawn:
  • Steam and autoclave curing significantly increased the electrical flux values, with SC specimens reaching over 1500 C, indicating high chloride permeability. In contrast, NC specimens maintained electrical flux values below 370 C, classifying them as having moderate permeability. The elevated permeability in SC is attributed to non-uniform and accelerated hydration, which promotes increased capillary porosity. While AC also raises permeability, it initiates pozzolanic reactions in silica sand, resulting in partial microstructural refinement and a slightly reduced permeability compared to SC.
  • Chloride ingress exhibited a non-linear trend with respect to external chloride concentration. Maximum electrical flux was observed at a chloride concentration of 4.5 wt.%, beyond which flux values plateaued or slightly decreased. This trend suggests that optimal pore connectivity and ionic mobility occur at intermediate chloride levels, while higher concentrations potentially lead to reduced ion mobility due to thermal effects during prolonged electrical testing.
  • SC and AC improved early-age mechanical properties. Compressive strength at 28 d increased from 68 MPa (NC) to 75 MPa (SC) and 80 MPa (AC). Similarly, the modulus of elasticity and flexural toughness were enhanced. However, under long-term chloride exposure, SC and AC specimens showed faster reductions in stiffness and toughness compared to NC. For instance, toughness degradation in SC specimens exceeded 30% after 60 d of chloride immersion, whereas NC specimens retained over 85% of their initial toughness.
  • Microstructural and mineralogical analyses confirm that SC and AC accelerate cement hydration, reducing unhydrated clinker phases and portlandite content while promoting the formation of CSH and carbonation products. Despite these benefits, SC and AC also induce increased microcracking and porosity. Notably, microcracks formed under AC are smaller and less severe due to the secondary silica reactions, which partially refine and strengthen the microstructure.
Overall, the study underscores the complex impact of the interplay between curing conditions and chloride exposure on HSC durability. While SC and AC offer early mechanical advantages, they compromise long-term resistance to chloride ingress. Thus, optimal curing strategies must balance the trade-offs between early-age strength development and long-term durability in aggressive chloride environments. It should be noted that the accelerated corrosion test was conducted for only 7 d, which primarily represents early-stage chloride-induced degradation. Therefore, the results should be interpreted with caution, as this short exposure duration may not fully capture the long-term corrosion behavior of concrete.

Author Contributions

Conceptualization, D.L. and Z.W.; Methodology, Z.W. and Z.L.; Validation, D.L.; Formal Analysis, Z.W.; Investigation, Z.W., S.L. and Z.L.; Resources, Z.W.; Data Curation, D.L.; Writing—Original Draft Preparation, Z.W. and D.L.; Writing—Review & Editing, D.L.; Visualization, D.L.; Supervision, D.L.; Project Administration, Z.W.; Funding Acquisition, Z.W. All authors have read and agreed to the published version of the manuscript.

Funding

This research was funded by the National Natural Science Foundation of China (52104122), the Natural fund project of Fujian Province Science and Technology Department (2024J01964), and the Open Project of Engineering Research Center of Phosphorus Resources Development and Utilization of Ministry of Education: LKF2021007.

Data Availability Statement

The data that supports the findings of this study are available from the corresponding author, D.L., upon reasonable request.

Conflicts of Interest

Author Zhengyu Wu was employed by the company Blooms Union Group Co., Ltd. The remaining authors declare that the research was conducted in the absence of any commercial or financial relationships that could be construed as a potential conflict of interest.

References

  1. Li, L.; Gong, W.; Li, J. Service life of prestressed high-strength concrete pile in marine environment considering effects of concrete stratification and temperature. Constr. Build. Mater. 2020, 253, 119233. [Google Scholar] [CrossRef]
  2. Akhnoukh, A.K.; Elia, H. Developing high performance concrete for precast/prestressed concrete industry. Case Stud. Constr. Mater. 2019, 11, e00290. [Google Scholar] [CrossRef]
  3. Yi, C.-Y.; Park, J.-Y.; Park, C.-Y.; Lee, J.-C.; Park, Y.-J. Eco-Economic Performance Estimation Method for Pretensioned Spun High-Strength Concrete Pile Installation. Sustainability 2022, 14, 11990. [Google Scholar] [CrossRef]
  4. Hu, S.; Liang, F. Settlement Analysis of Pre-stressed Concrete Pipe-Pile Foundations in Soft Ground: A Case Study. J. Civ. Eng. Urban Plan. 2023, 5, 21–30. [Google Scholar]
  5. Arockiasamy, M.; Arvan, P.A. Behavior, performance, and evaluation of prestressed concrete/steel pipe/steel H-pile to pile cap connections. Pract. Period. Struct. Des. Constr. 2022, 27, 03122001. [Google Scholar] [CrossRef]
  6. Kumar, D.R.; Kumar, P.; Thangavel, P.; Wipulanusat, W.; Thongchom, C.; Samui, P. Optimized machine learning models for predicting the tensile strength of high-performance concrete. J. Struct. Integr. Maint. 2025, 10, 2471682. [Google Scholar] [CrossRef]
  7. Wang, B.; Qi, L.; Yang, Y. Experimental study on bending resistance of new type joint of prestressed concrete pipe pile. Symmetry 2022, 14, 1920. [Google Scholar] [CrossRef]
  8. Cho, S.K.; Koo, T.H.; Cho, W.C. Structural performance at the joint of precast pile-supported pier structure. Mar. Struct. 2025, 99, 103722. [Google Scholar] [CrossRef]
  9. Wang, R.; Li, Y.; Liu, X.; Zhang, S.; Zhang, C.; Li, Z.; Wang, P. Research on advantages and disadvantages of prestressed concrete hollow square pile and pipe pile in pile foundation selection. IOP Conf. Ser. Earth Environ. Sci. IOP Publ. 2021, 787, 012022. [Google Scholar] [CrossRef]
  10. Qu, F.; Li, W.; Dong, W.; Tam, V.W.; Yu, T. Durability deterioration of concrete under marine environment from material to structure: A critical review. J. Build. Eng. 2021, 35, 102074. [Google Scholar] [CrossRef]
  11. Wu, L.; Jiang, H.; Ju, X.; Liu, M.; Di, Y.; Zhao, Y.; Xiang, Z. Service life evaluation of marine reinforced concrete structures in coastal soda residue soil subjected to chloride attack. Constr. Build. Mater. 2024, 455, 139222. [Google Scholar] [CrossRef]
  12. Pawar, Y.; Kate, S. Curing of concrete: A review. Int. Res. J. Eng. Technol. 2020, 7, 1820–1824. [Google Scholar]
  13. Safiuddin, M.; Kaish, A.A.; Woon, C.-O.; Raman, S.N. Early-age cracking in concrete: Causes, consequences, remedial measures, and recommendations. Appl. Sci. 2018, 8, 1730. [Google Scholar] [CrossRef]
  14. Xu, X.; Jin, Z.; Yu, Y.; Li, N. Impact properties of Ultra High Performance Concrete (UHPC) cured by steam curing and standard curing. Case Stud. Constr. Mater. 2022, 17, e01321. [Google Scholar] [CrossRef]
  15. Shen, P.; Lu, L.; He, Y.; Wang, F.; Hu, S. The effect of curing regimes on the mechanical properties, nano-mechanical properties and microstructure of ultra-high performance concrete. Cem. Concr. Res. 2019, 118, 1–13. [Google Scholar] [CrossRef]
  16. Amorim, P.; De Brito, J.; Evangelista, L. Concrete made with coarse concrete aggregate: Influence of curing on durability. ACI Mater. J. 2012, 109, 195–204. [Google Scholar] [CrossRef]
  17. Wang, J.; Long, G.; Xiang, Y.; Dong, R.; Tang, Z.; Xiao, Q.; Yang, Z.; Ma, K. Influence of rapid curing methods on concrete microstructure and properties: A review. Case Stud. Constr. Mater. 2022, 17, e01600. [Google Scholar] [CrossRef]
  18. Khomwan, N.; Mungsantisuk, P. Durability of precast prestressed concrete pile in exposure severe environment. J. Met. Mater. Miner. 2025, 35, e1917. [Google Scholar] [CrossRef]
  19. Moser, R.; Holland, R.B.; Kahn, L.; Singh, P.; Kurtis, K. Durability of Precast Prestressed Concrete Piles in Marine Environment: Reinforcement Corrosion and Mitigation–Part 1; ROSA P: Washington, DC, USA, 2011.
  20. Luo, D.; Wang, K.; Wang, D.; Sharma, A.; Li, W.; Choi, I.H. Artificial intelligence in the design, optimization, and performance prediction of concrete materials: A comprehensive review. npj Mater. Sustain. 2025, 3, 14. [Google Scholar] [CrossRef]
  21. Kareem, R.; Assi, L.N.; Alsalman, A.; Al-Manea, A. Effect of supplementary cementitious materials on RC concrete piles. AIP Conf. Proc. AIP Publ. 2021, 2404, 080036. [Google Scholar]
  22. Tan, K.; Zhu, J. Influences of steam and autoclave curing on the strength and chloride permeability of high strength concrete. Mater. Struct. 2017, 50, 56. [Google Scholar] [CrossRef]
  23. Wang, Y.; Deng, M.; Zhang, R.; Yu, X.; Xue, J.; Zhang, J. Durability of Prestressed Piles in a Leachate Environment. Materials 2024, 17, 2497. [Google Scholar] [CrossRef] [PubMed]
  24. Zhang, Z.; Wei, J.; Xing, X.; Ma, F.; Wang, B.; Xu, N.; Li, M.; Geng, J.; Chen, L.; Zhu, W. Studying the interfacial transition zone microstructure of pre-stressed high-strength concrete pipe piles. Constr. Build. Mater. 2024, 448, 138045. [Google Scholar] [CrossRef]
  25. Güneyisi, E.; Özturan, T.; Gesoglu, M. Effect of initial curing on chloride ingress and corrosion resistance characteristics of concretes made with plain and blended cements. Build. Environ. 2007, 42, 2676–2685. [Google Scholar] [CrossRef]
  26. Chen, X.; He, Y.; Lu, L.; Wang, F.; Hu, S. Effects of curing regimes on the chloride binding capacity of cementitious materials. Constr. Build. Mater. 2022, 342, 127929. [Google Scholar] [CrossRef]
  27. Bahmani, H.; Mostafaei, H.; Santos, P.; Fallah Chamasemani, N. Enhancing the mechanical properties of Ultra-High-Performance Concrete (UHPC) through silica sand replacement with steel slag. Buildings 2024, 14, 3520. [Google Scholar] [CrossRef]
  28. Pachipala, S. A study on mechanical properties of concrete using silica sand as partial replacement of cement. Int. J. Civ. Eng. 2017, 4, 34–39. [Google Scholar] [CrossRef]
  29. Ramjan, S.; Tangchirapat, W.; Jaturapitakkul, C.; Chee Ban, C.; Jitsangiam, P.; Suwan, T. Influence of cement replacement with fly ash and ground sand with different fineness on alkali-silica reaction of mortar. Materials 2021, 14, 1528. [Google Scholar] [CrossRef]
  30. Ma, J.; Yang, Q.; Wang, X.; Peng, X.; Qin, F. Review of Prediction Models for Chloride Ion Concentration in Concrete Structures. Buildings 2025, 15, 149. [Google Scholar] [CrossRef]
  31. Shi, X.; Xie, N.; Fortune, K.; Gong, J. Durability of steel reinforced concrete in chloride environments: An overview. Constr. Build. Mater. 2012, 30, 125–138. [Google Scholar] [CrossRef]
  32. Poupard, O.; Aït-Mokhtar, A.; Dumargue, P. Corrosion by chlorides in reinforced concrete: Determination of chloride concentration threshold by impedance spectroscopy. Cem. Concr. Res. 2004, 34, 991–1000. [Google Scholar] [CrossRef]
  33. Niu, D.; Huang, D.; Fu, Q. Experimental investigation on compressive strength and chloride permeability of fiber-reinforced concrete with basalt-polypropylene fibers. Adv. Struct. Eng. 2019, 22, 2278–2288. [Google Scholar] [CrossRef]
  34. GB/T 50082-2024; Standard for Test Methods of Long-Term Performance and Durability of Ordinary Concrete. Ministry of Housing and Urban-Rural Development of the People’s Republic of China: Beijing, China, 2024.
  35. Qu, L.; Song, W.; Wang, Q.; Xu, S.; Hou, C. Effects of hydrophobic modified fly ash on resistance of chloride corrosion and water penetration of cement mortar in the early hydration stage. J. Build. Eng. 2023, 64, 105573. [Google Scholar] [CrossRef]
  36. GB/T 50081-2019; Standard for Test Methods of Concrete Physical and Mechanical Properties. China Standard Press: Beijing, China, 2019.
  37. Wang, T.; Gao, X.; Li, Y.; Liu, Y. An orthogonal experimental study on the influence of steam-curing on mechanical properties of foam concrete with fly ash. Case Stud. Constr. Mater. 2024, 20, e02665. [Google Scholar] [CrossRef]
  38. Xiong, X.; Wu, M.; Shen, W.; Li, J.; Zhao, D.; Li, P.; Wu, J. Performance and microstructure of ultra-high-performance concrete (UHPC) with silica fume replaced by inert mineral powders. Constr. Build. Mater. 2022, 327, 126996. [Google Scholar] [CrossRef]
  39. Gao, Y.; Cai, J.; Xu, G.; Tian, Q.; Shen, W.; Liu, R.; Zhang, J. Effect of waste glass powder on quartz sand autoclaved material: Strength, hydration products and microstructure. Mater. Struct. 2024, 57, 161. [Google Scholar] [CrossRef]
  40. Rong, G.; He, T.; Zhang, G.; Li, Y.; Wang, Y.; Xie, W. A review on chloride transport model and research method in concrete. Mater. Res. Express 2023, 10, 042002. [Google Scholar] [CrossRef]
  41. Ju, X.; Wu, L.; Liu, M.; Jiang, H.; Zhang, W. Modelling of chloride concentration profiles in concrete by the consideration of concrete material factors under marine tidal environment. J. Mar. Sci. Eng. 2022, 10, 917. [Google Scholar] [CrossRef]
  42. Dong, W.; Sun, A.; Zhou, M. Microstructure and chloride transport of aeolian sand concrete under long-term natural immersion. Sci. Eng. Compos. Mater. 2024, 31, 20220242. [Google Scholar] [CrossRef]
  43. Karbala, M.M.; Iranfar, S.; Shahsavari, M.H.; Shakiba, M. Impact of dissolved salt type and content on mechanical and physical properties of porous cementitious materials. Int. J. Geo-Eng. 2025, 16, 18. [Google Scholar] [CrossRef]
  44. Weiss, J.; Snyder, K.; Bullard, J.; Bentz, D. Using a saturation function to interpret the electrical properties of partially saturated concrete. J. Mater. Civ. Eng. 2013, 25, 1097–1106. [Google Scholar] [CrossRef]
  45. Liang, K.; Zeng, X.; Zhou, X.; Qu, F.; Wang, P. A new model for the electrical conductivity of cement-based material by considering pore size distribution. Mag. Concr. Res. 2017, 69, 1067–1078. [Google Scholar] [CrossRef]
  46. Cho, C.; Ann, K.; Kim, H.; Hwang, W.; Kim, J.; Cho, W.; Jung, H. Mobility of chloride in concrete subjected to electrochemical treatment. ACI Mater. J. 2021, 118, 189–198. [Google Scholar] [CrossRef]
  47. Lee, N.; Jeong, Y.; Kang, H.; Moon, J. Heat-induced acceleration of pozzolanic reaction under restrained conditions and consequent structural modification. Materials 2020, 13, 2950. [Google Scholar] [CrossRef] [PubMed]
  48. Zeyad, A.M.; Johari, M.A.M.; Abutaleb, A.; Tayeh, B.A. The effect of steam curing regimes on the chloride resistance and pore size of high–strength green concrete. Constr. Build. Mater. 2021, 280, 122409. [Google Scholar] [CrossRef]
  49. Haigh, R.; Ameri Sianaki, O. Traditional and Advanced Curing Strategies for Concrete Materials: A Systematic Review of Mechanical Performance, Sustainability, and Future Directions. Appl. Sci. 2025, 15, 11055. [Google Scholar] [CrossRef]
  50. Gao, Y.; Wang, B.; Liu, C.; Hui, D.; Xu, Q.; Zhao, Q.; Qin, Y.; Dong, W. Experimental investigation on static compressive toughness of steel fiber rubber concrete. Rev. Adv. Mater. Sci. 2022, 61, 576–586. [Google Scholar] [CrossRef]
  51. Yu, W.; Jin, L.; Du, X. Experimental study on compression failure characteristics of basalt fiber-reinforced lightweight aggregate concrete: Influences of strain rate and structural size. Cem. Concr. Compos. 2023, 138, 104985. [Google Scholar] [CrossRef]
  52. Wu, Y.-F.; Kazmi, S.M.S.; Munir, M.J.; Zhou, Y.; Xing, F. Effect of compression casting method on the compressive strength, elastic modulus and microstructure of rubber concrete. J. Clean. Prod. 2020, 264, 121746. [Google Scholar] [CrossRef]
  53. ACI Committee 363. Report on High-Strength Concrete (ACI 363R-10); ACI: Farmington Hills, MI, USA, 2010; 27p. [Google Scholar]
  54. Gonzalez-Corominas, A.; Etxeberria, M.; Poon, C.S. Influence of steam curing on the pore structures and mechanical properties of fly-ash high performance concrete prepared with recycled aggregates. Cem. Concr. Compos. 2016, 71, 77–84. [Google Scholar] [CrossRef]
  55. Pyo, S.; Tafesse, M.; Kim, H.; Kim, H.-K. Effect of chloride content on mechanical properties of ultra high performance concrete. Cem. Concr. Compos. 2017, 84, 175–187. [Google Scholar] [CrossRef]
  56. Luo, D.; Wei, J. Hydration and phase evolution of blended cement composites containing lithium and saturated metakaolin. Cem. Concr. Compos. 2023, 144, 105268. [Google Scholar] [CrossRef]
  57. Wei, T.; Wei, F.; Zhou, J.; Wu, Z.; Zhang, C.; Zhuang, J.; Cheng, X. Formation and strengthening mechanisms of xonotlite in C3S-silica and C2S-silica powder systems under high temperature and pressure. Cem. Concr. Res. 2022, 157, 106812. [Google Scholar] [CrossRef]
  58. Ai, Y.; Wang, M.; Huang, R.; Cui, M.; Qi, W.; Su, R. Synergy between cellulose nanocrystals and calcium silicate hydrate-polycarboxylate ether enhances the strength and carbonation resistance of cement pastes. Constr. Build. Mater. 2024, 435, 136914. [Google Scholar] [CrossRef]
  59. Corro-Escorcia, I.A.; Hernández-Ávila, J.; Cerecedo-Sáenz, E.; Barrientos-Hernández, F.; Cruz-Hernández, M.; Toro, N.; Gálvez, E.; Gutiérrez-Amador, M.; Salinas-Rodríguez, E. Synthesis of tobermorite 11 Å during the formation of autoclaved aerated concrete with the addition of diatomite. Results Mater. 2025, 26, 100725. [Google Scholar] [CrossRef]
  60. Chen, M.; Lu, L.; Wang, S.; Zhao, P.; Zhang, W.; Zhang, S. Investigation on the formation of tobermorite in calcium silicate board and its influence factors under autoclaved curing. Constr. Build. Mater. 2017, 143, 280–288. [Google Scholar] [CrossRef]
  61. Wu, R.; Gu, Q.; Gao, X.; Huang, J.; Guo, Y.; Zhang, H. Effect of curing conditions on the alkali-activated blends: Microstructure, performance and economic assessment. J. Clean. Prod. 2024, 445, 141344. [Google Scholar] [CrossRef]
  62. Luo, D.; Wei, J. Hydration kinetics and phase evolution of Portland cement composites containing sodium-montmorillonite functionalized with a Non-Ionic surfactant. Constr. Build. Mater. 2022, 333, 127386. [Google Scholar] [CrossRef]
  63. Luo, D.; Wei, J. Understanding the role of a novel internal conditioning technique with functionalized montmorillonite in cement hydration kinetics. Constr. Build. Mater. 2023, 385, 131223. [Google Scholar] [CrossRef]
  64. Zdeb, T. An analysis of the steam curing and autoclaving process parameters for reactive powder concretes. Constr. Build. Mater. 2017, 131, 758–766. [Google Scholar] [CrossRef]
  65. Pushpan, S.; Ziga-Carbarín, J.; Rodríguez-Barboza, L.I.; Sanal, K.; Acevedo-Dávila, J.L.; Balonis, M.; Gómez-Zamorano, L.Y. Strength and microstructure assessment of partially replaced ordinary portland cement and calcium sulfoaluminate cement with pozzolans and spent coffee grounds. Materials 2023, 16, 5006. [Google Scholar] [CrossRef] [PubMed]
  66. Kaufmann, J.; Winnefeld, F.; Lothenbach, B. Stability of ettringite in CSA cement at elevated temperatures. Adv. Cem. Res. 2016, 28, 251–261. [Google Scholar] [CrossRef]
  67. El Bitouri, Y.; Azéma, N.; Le Saoût, G.; Lauten, R.A.; De Weerdt, K. Effect of plasticizer on hydration and rheological behavior of cement pastes. CivilEng 2022, 3, 748–759. [Google Scholar] [CrossRef]
  68. Szudek, W.; Szydłowski, J.; Buchała, I.; Kapeluszna, E. Synthesis and Characterization of Calcium Sulfoaluminate Hydrates—Ettringite (AFt) and Monosulfate (AFm). Materials 2024, 17, 5216. [Google Scholar] [CrossRef] [PubMed]
Disclaimer/Publisher’s Note: The statements, opinions and data contained in all publications are solely those of the individual author(s) and contributor(s) and not of MDPI and/or the editor(s). MDPI and/or the editor(s) disclaim responsibility for any injury to people or property resulting from any ideas, methods, instructions or products referred to in the content.

Article Metrics

Citations

Article Access Statistics

Multiple requests from the same IP address are counted as one view.