
Design of an Autonomous, Sustainable Sharing Mobility Solution Aimed to Mobility-Disabled Individuals


Abstract
:1. Introduction
2. Materials and Methods
2.1. Environment Analysis
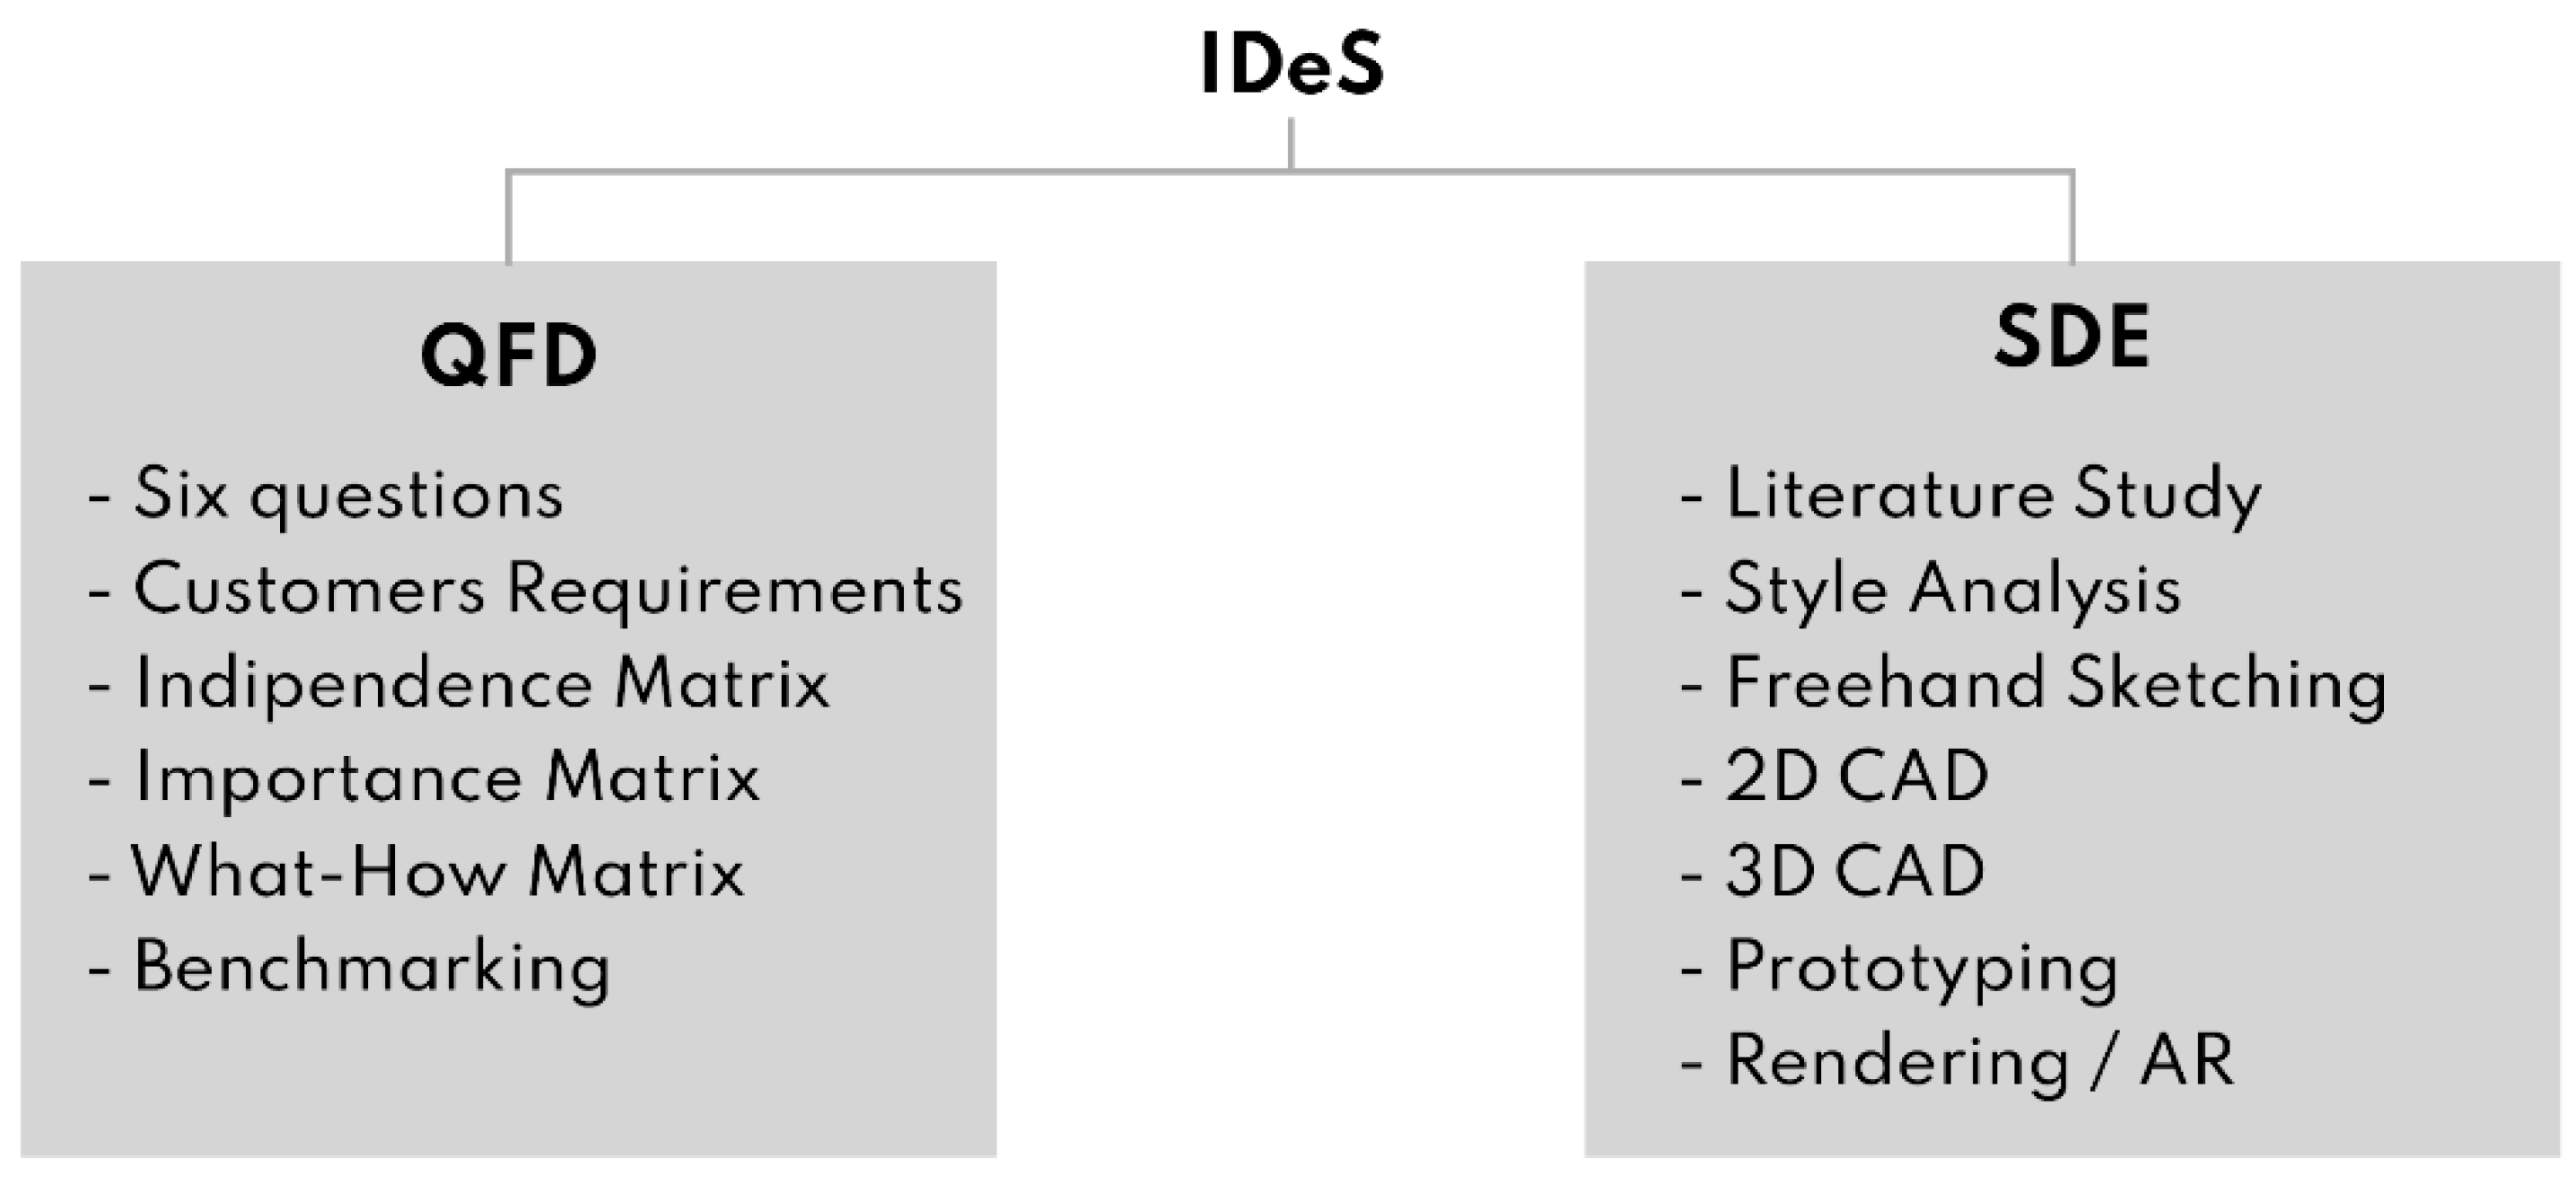
2.1.1. Quality Function Deployment (QFD)
2.1.2. Benchmarking and Top-Flop Analysis
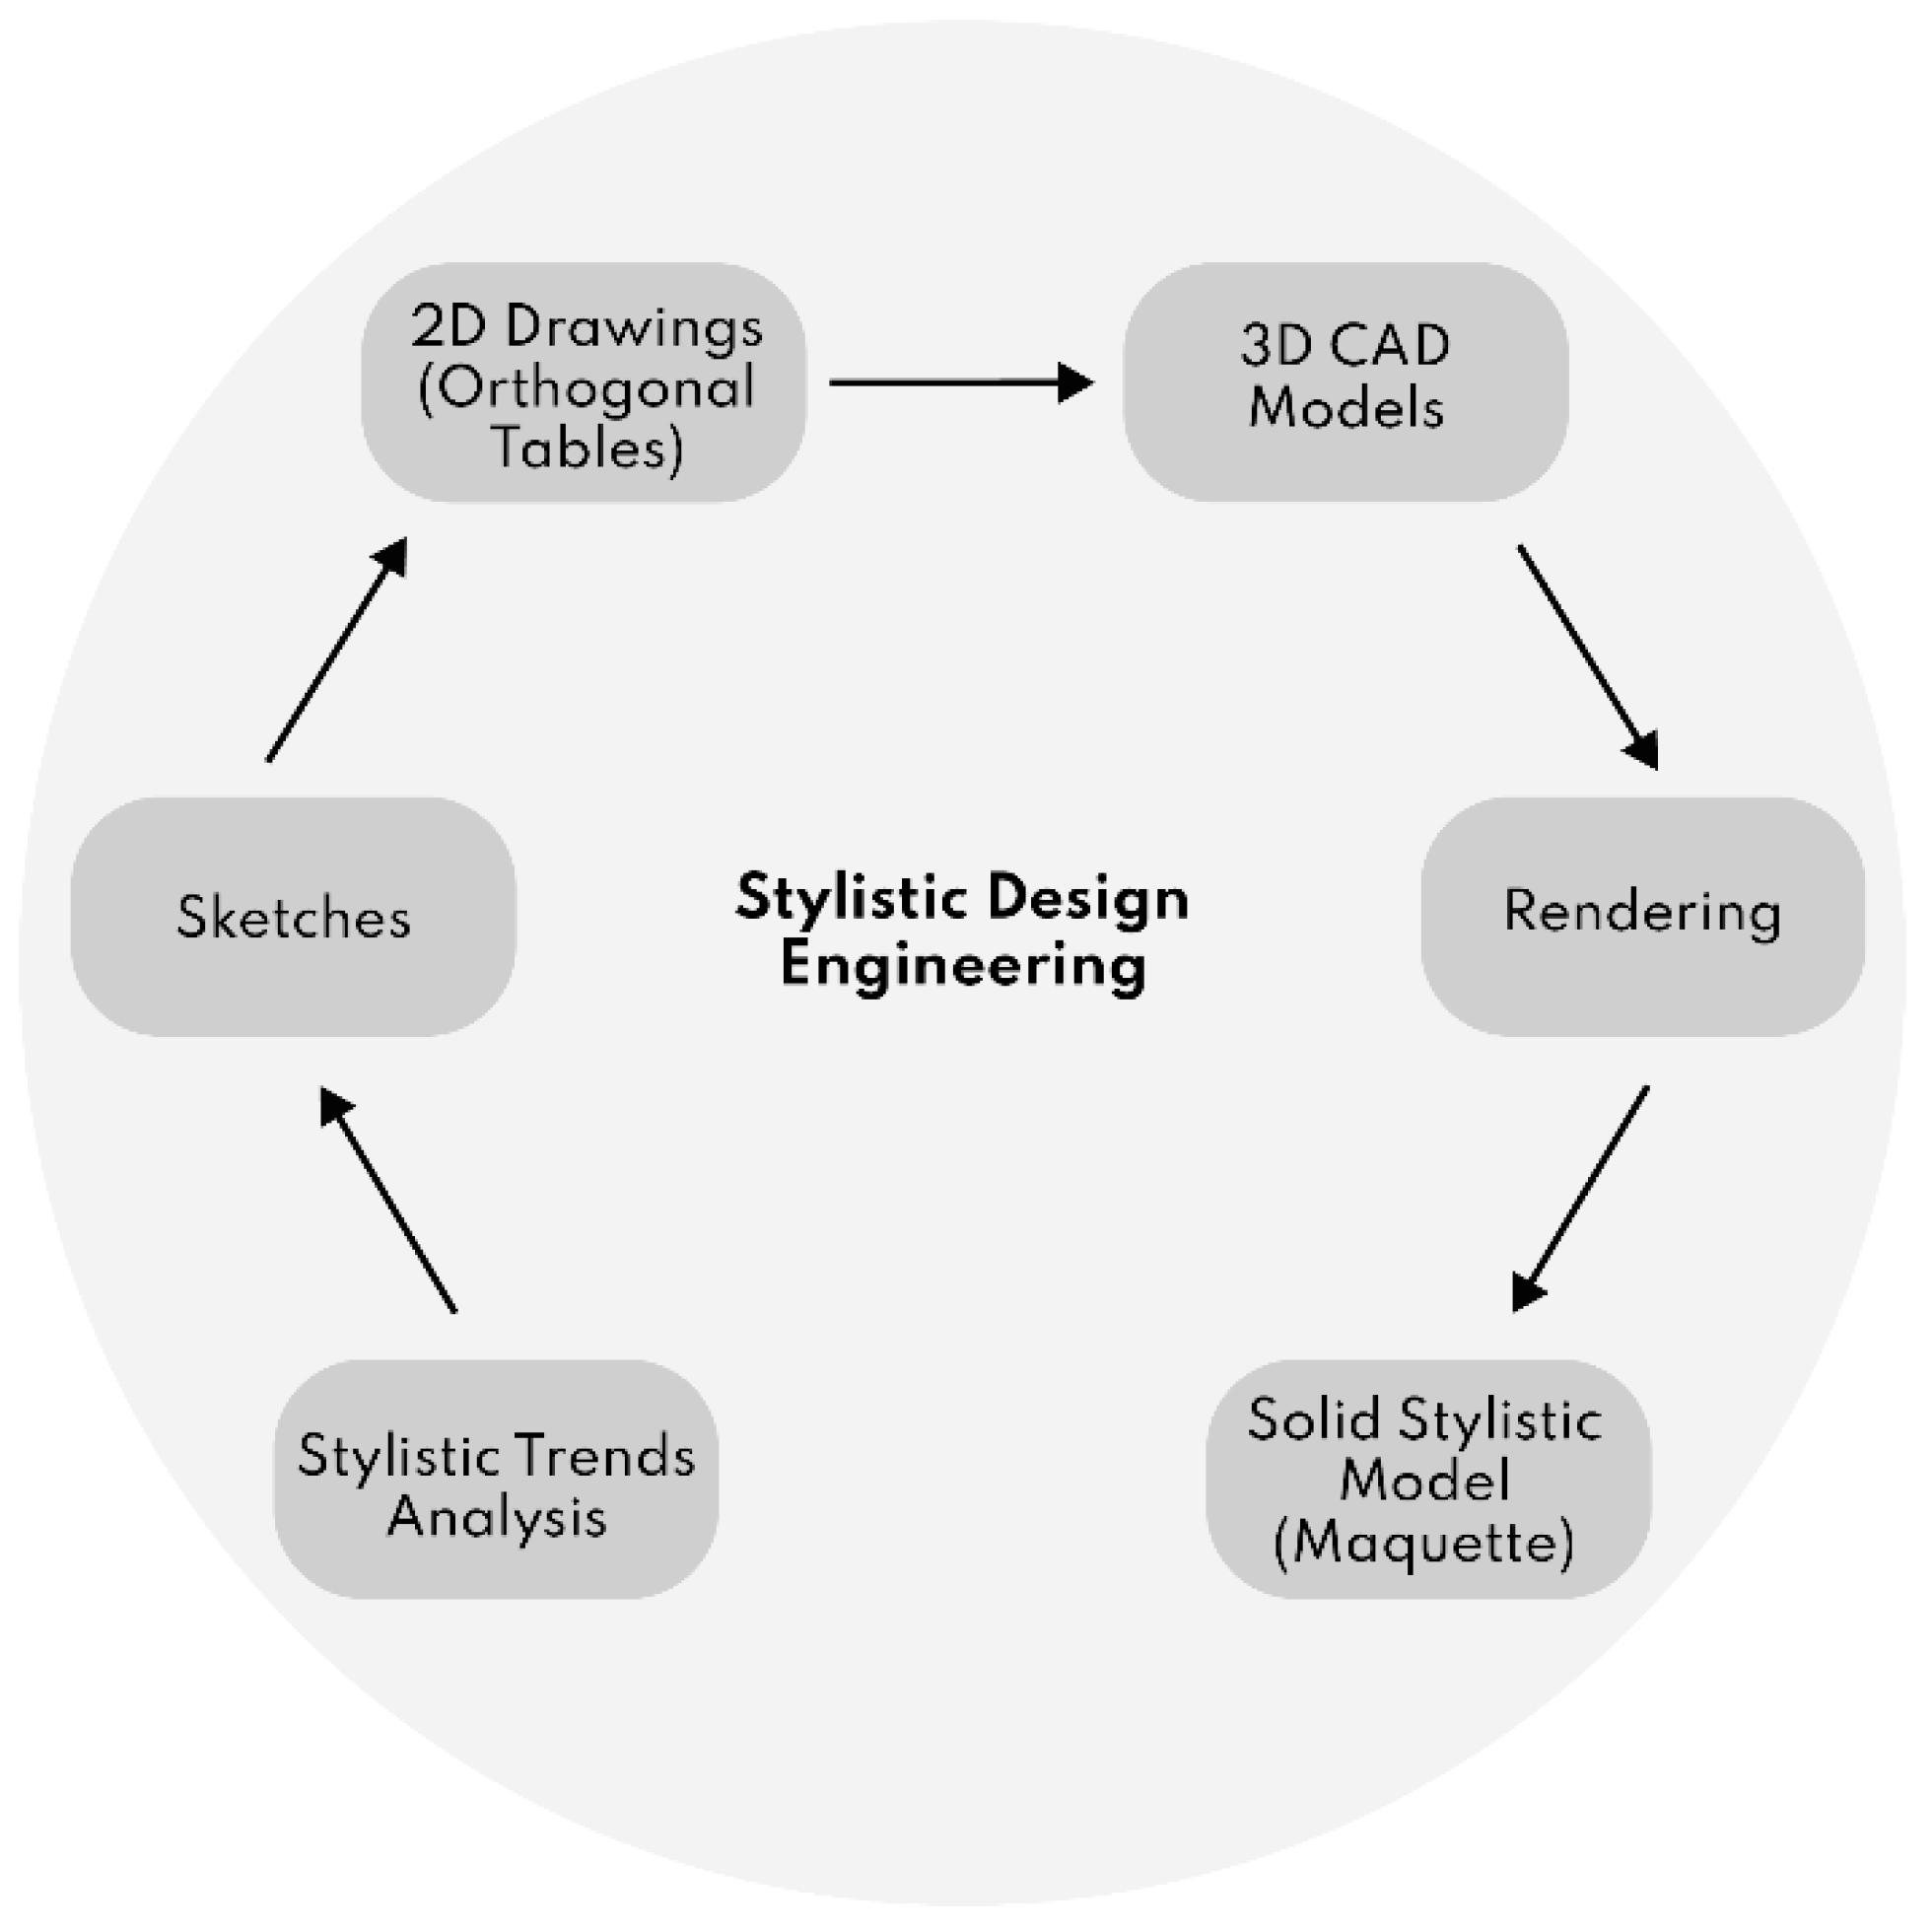
2.2. Stylistic Design Engineering (SDE)
2.3. Design Phase
2.3.1. Design Engineering
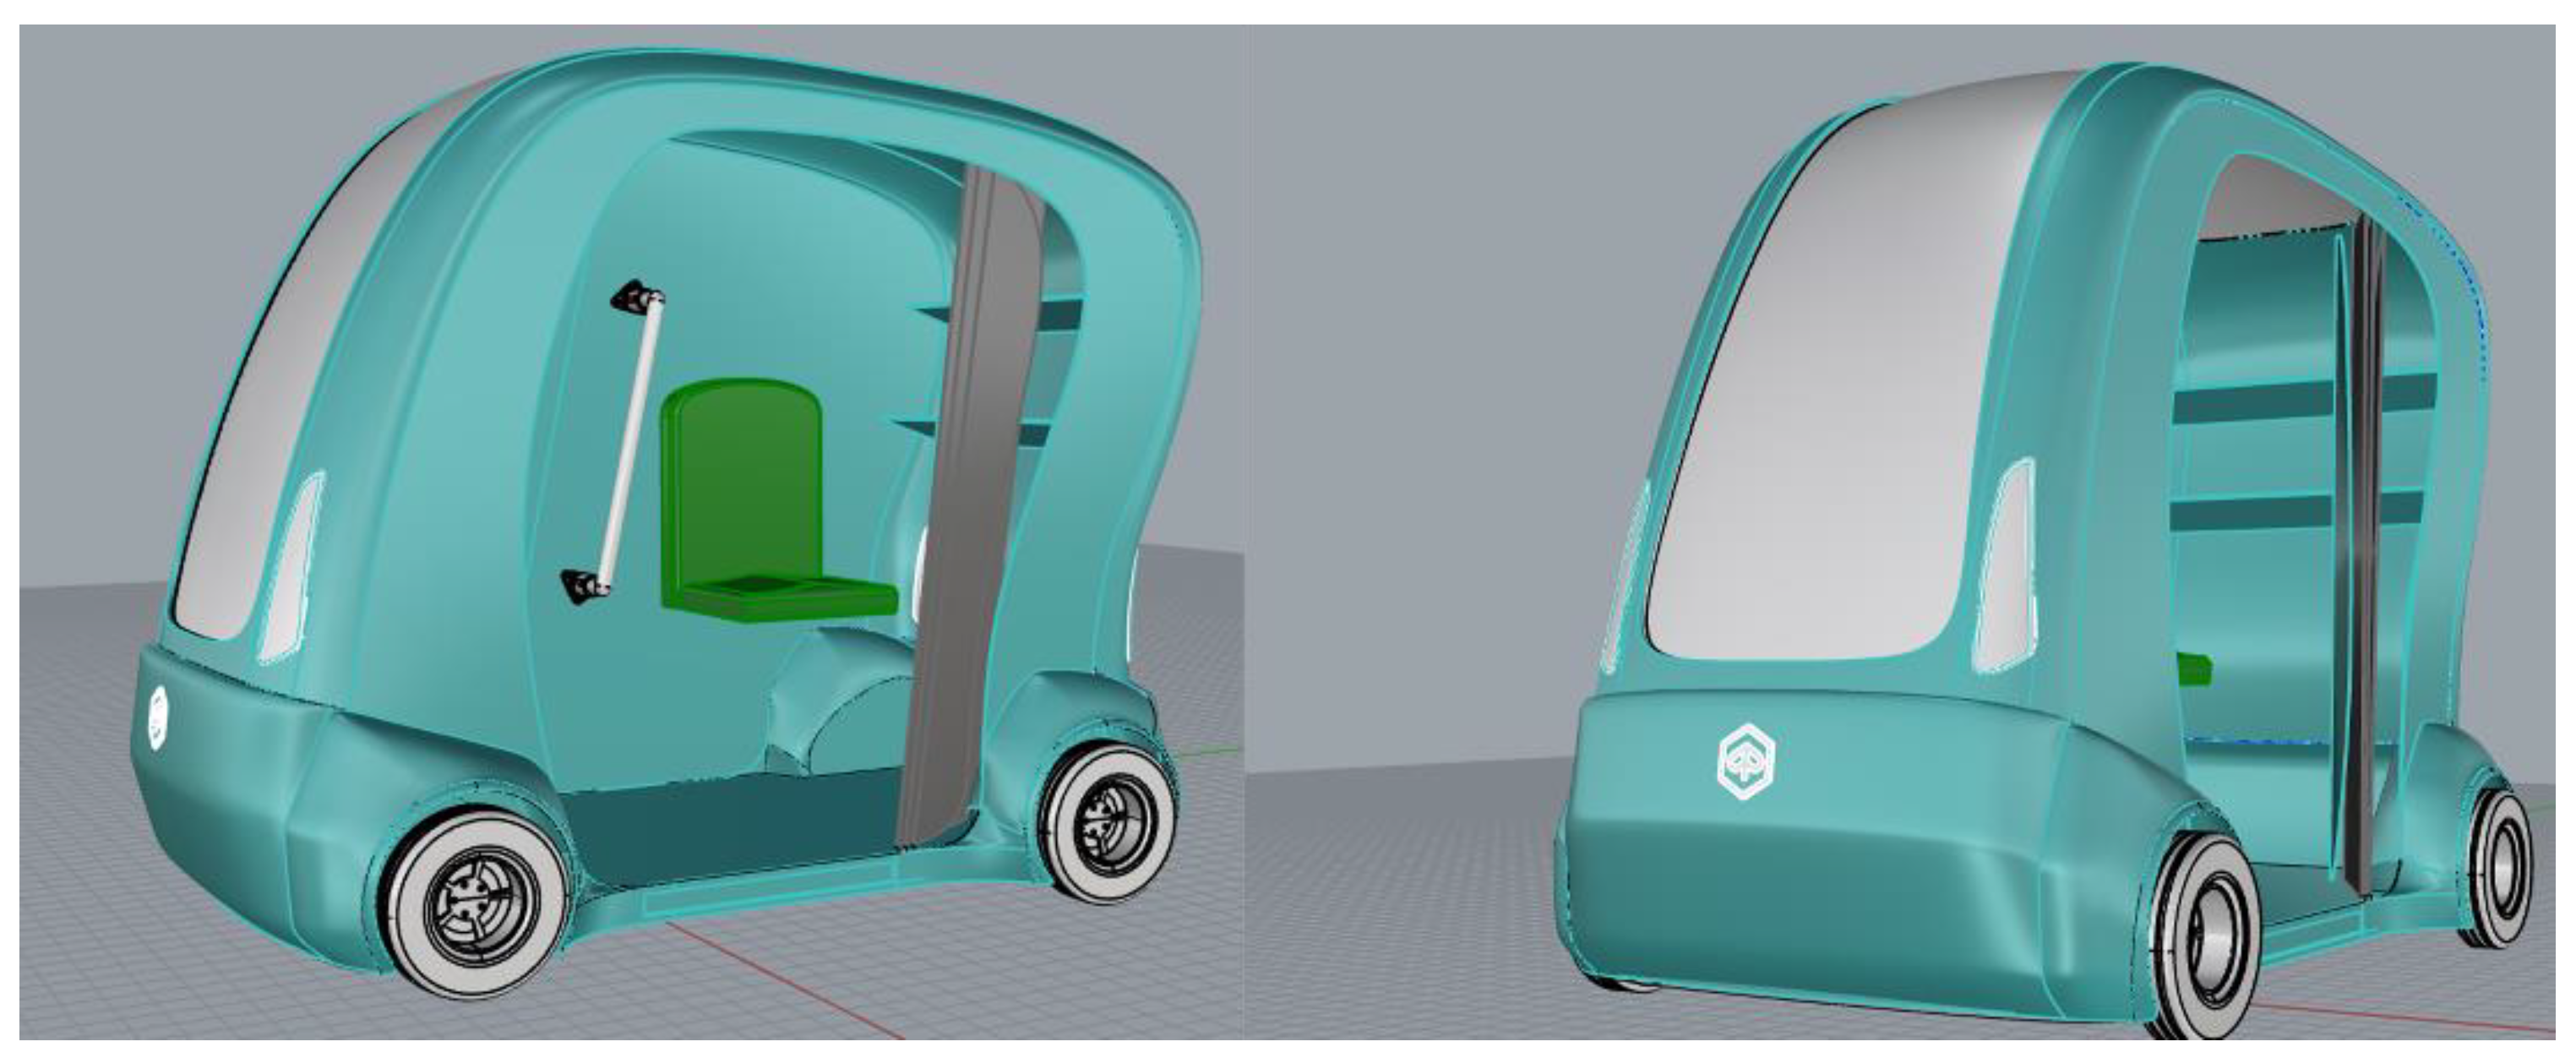
2.3.2. Virtual Prototyping
2.3.3. Testing
2.3.4. Redesign
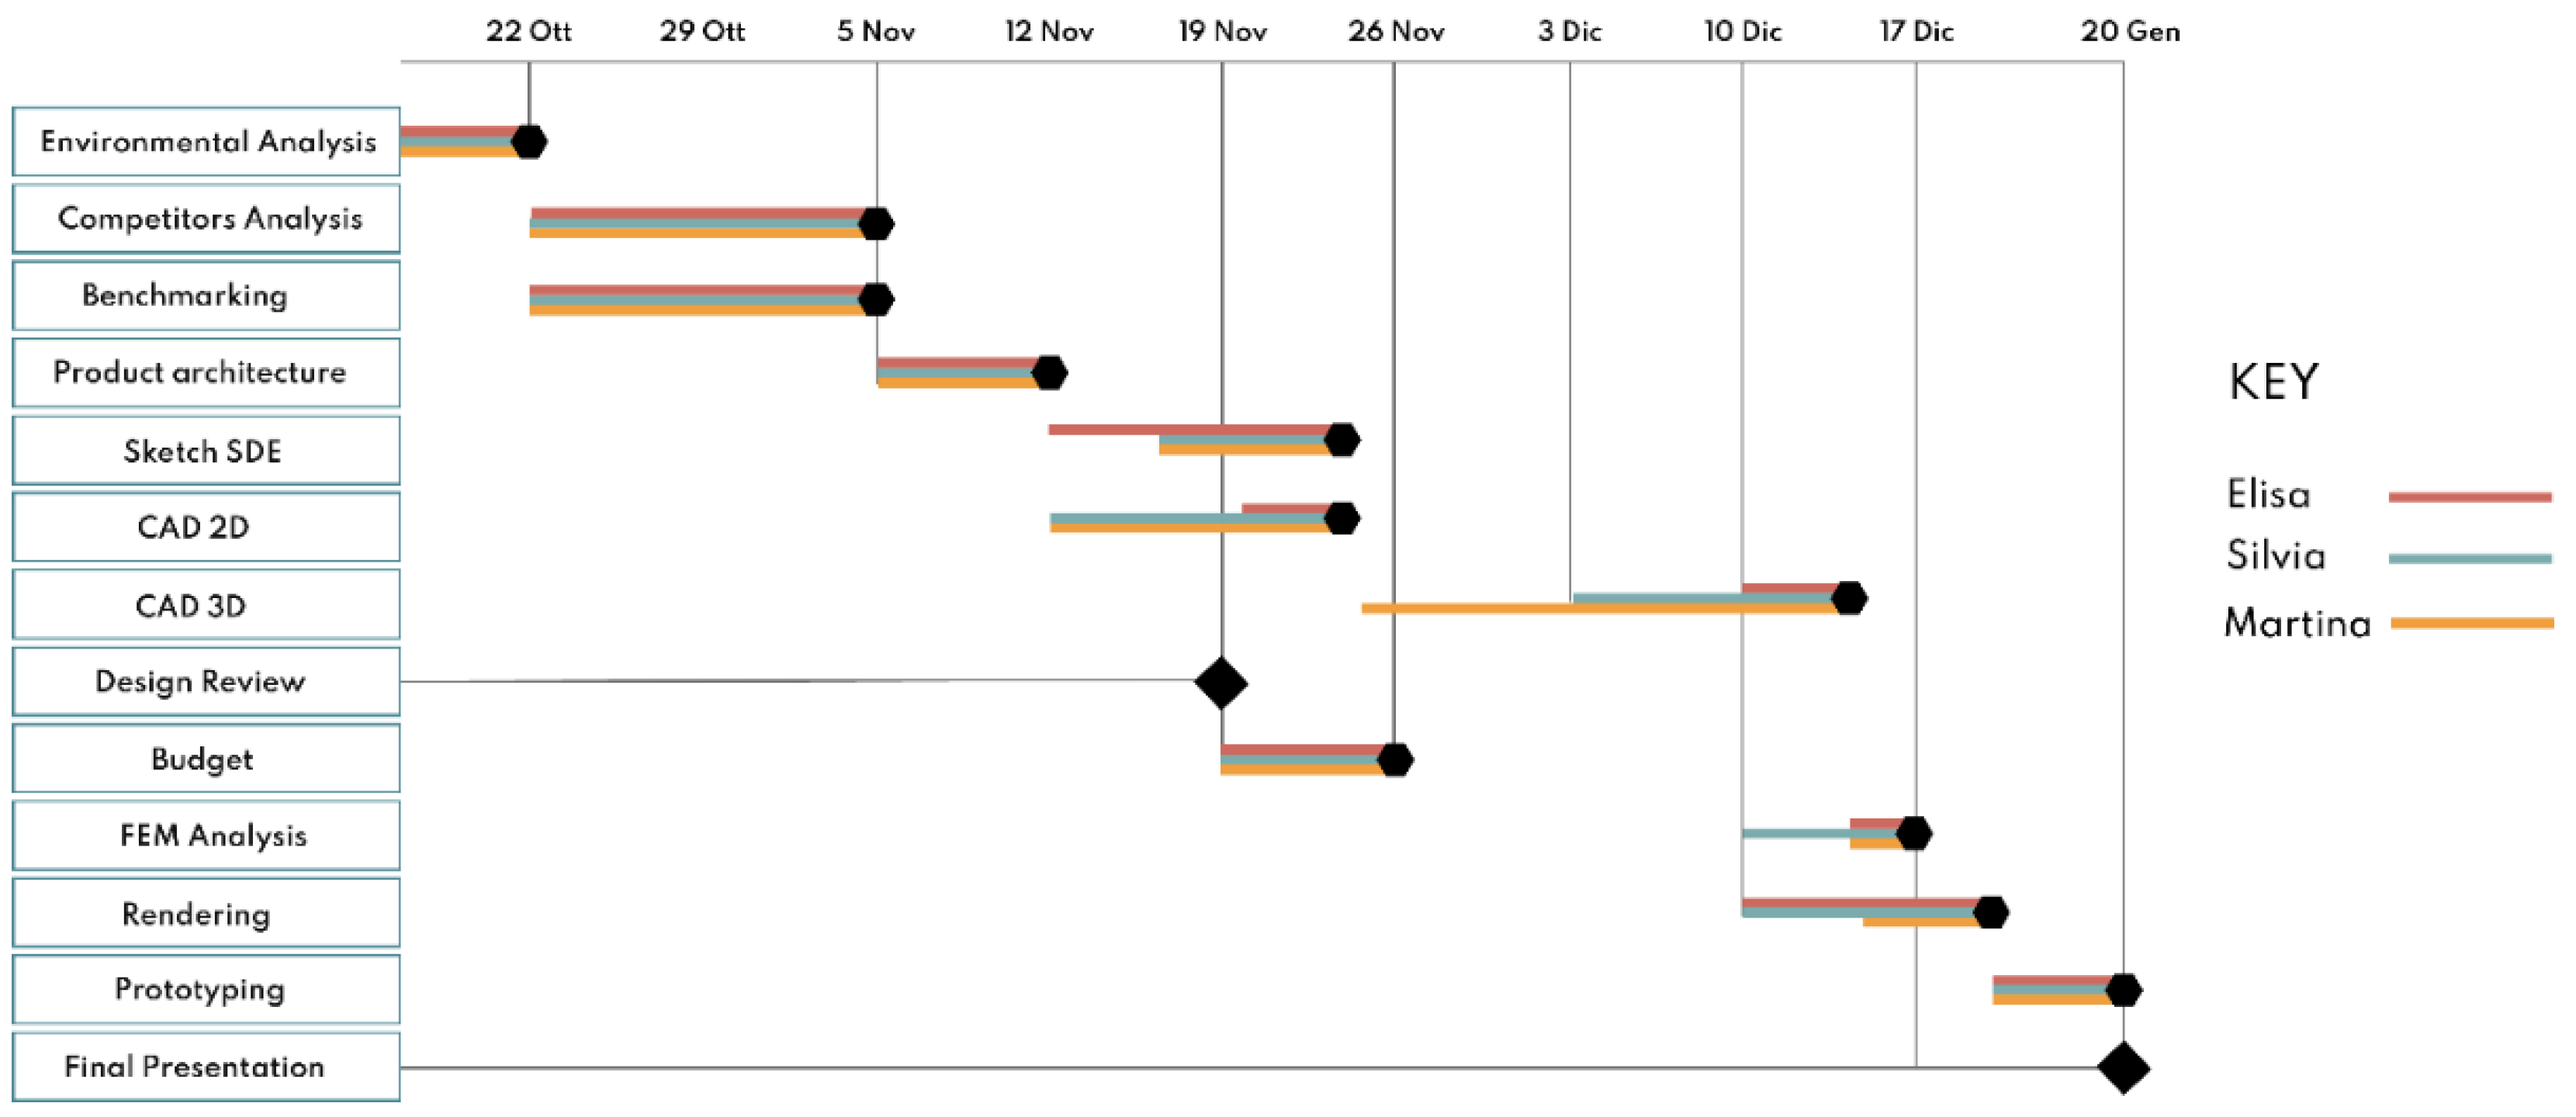
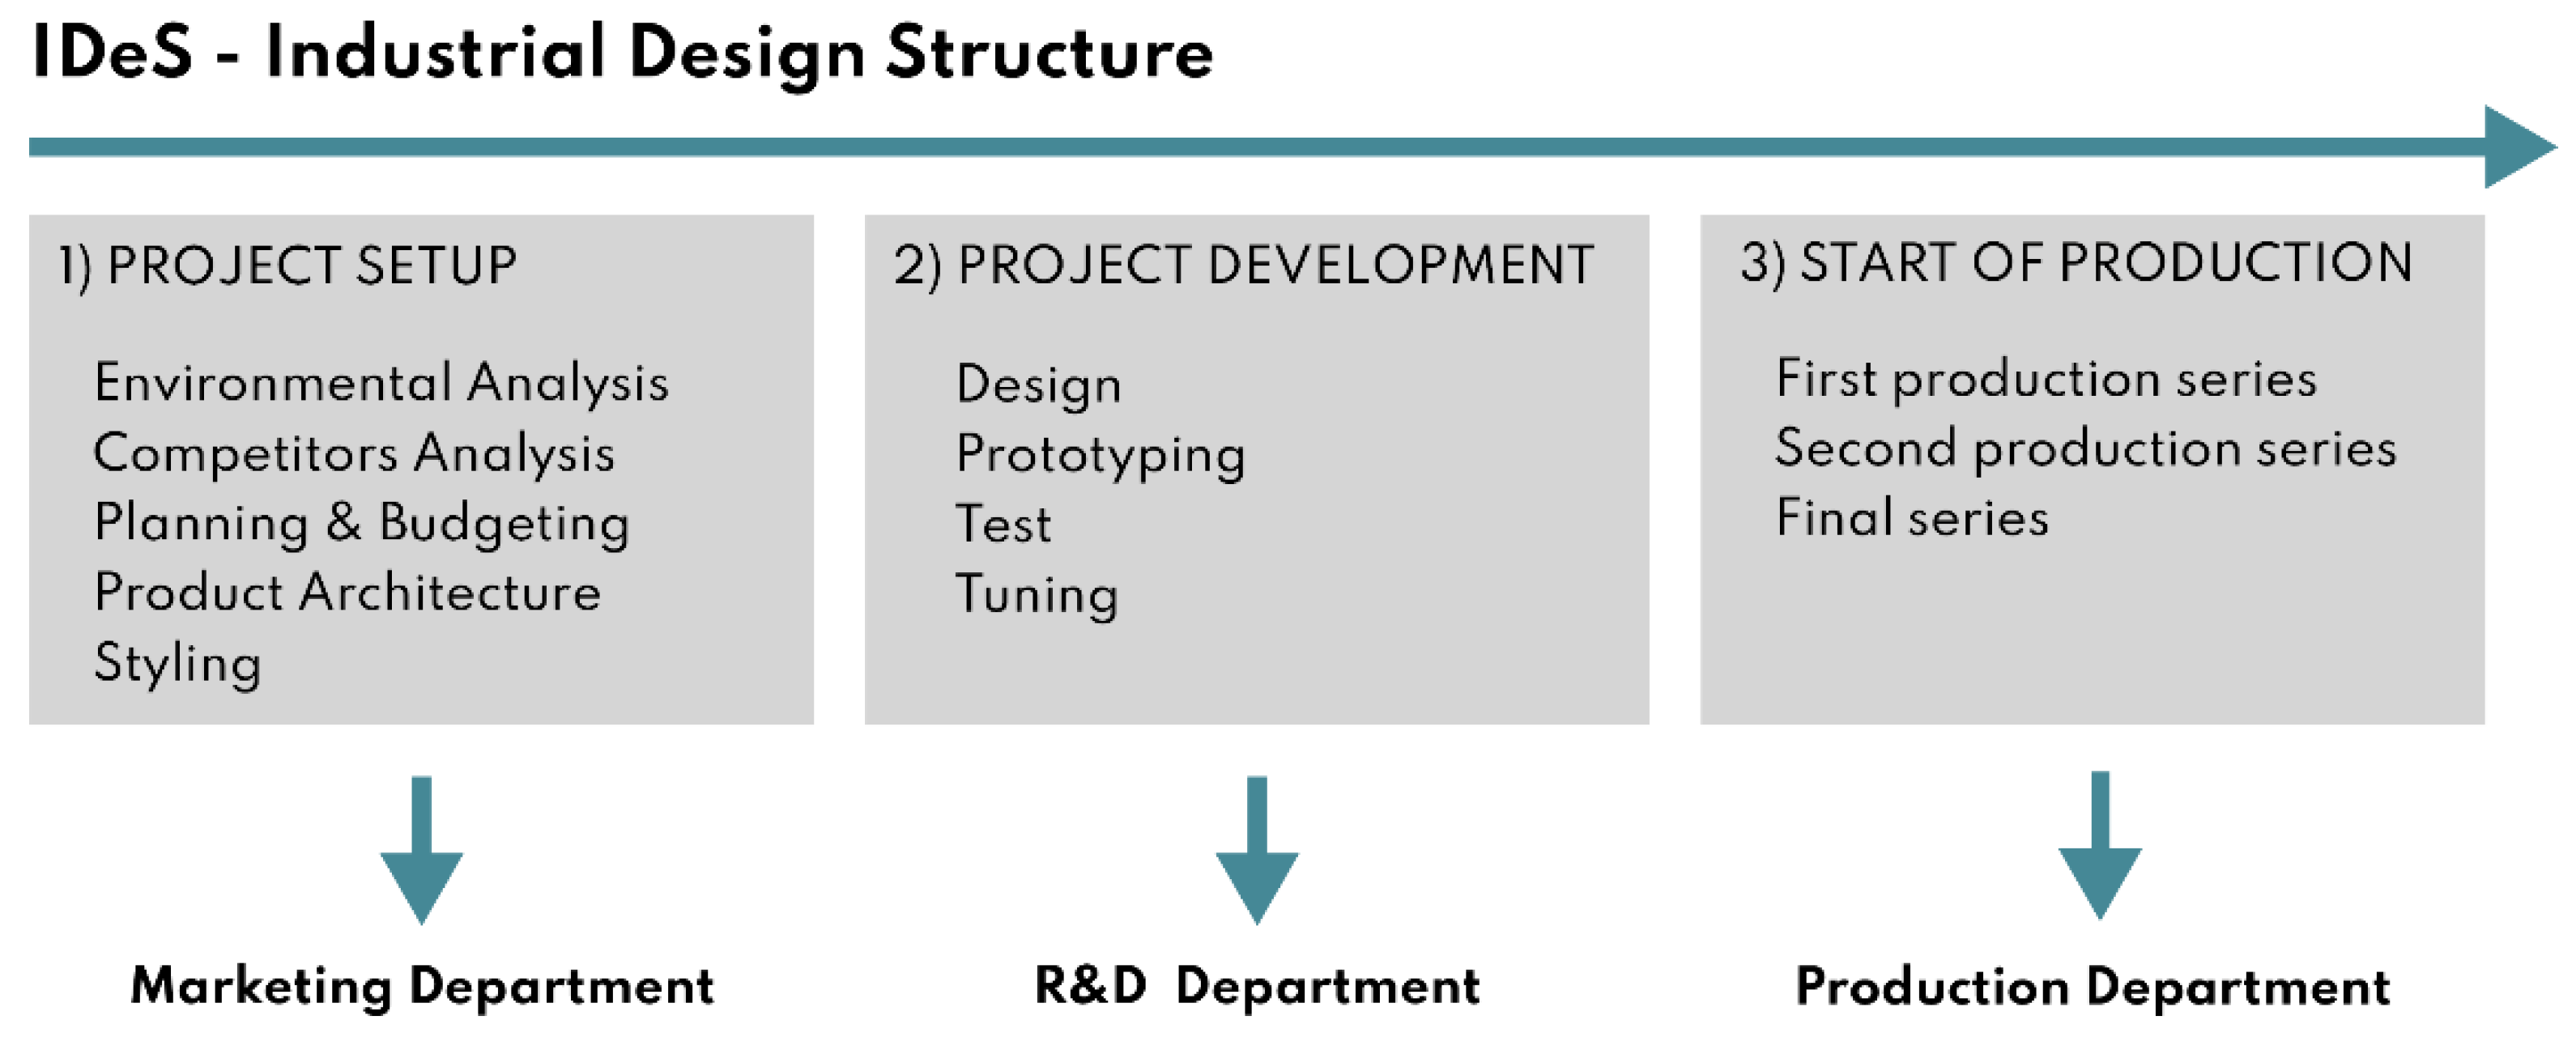
2.4. Planning
- Environmental analysis
- Competitors analysis
- Benchmarking
- Product architecture
- Sketch SDE
- 2D CAD
- 3D CAD
- Budget
- FEM analysis
- Rendering
- Prototyping
2.5. Budget
2.6. Environment Analysis
2.7. Quality Function Deployment (Q.F.D)
2.8. Benchmarking and Top-Flop Analysis
2.9. Product Architecture
2.10. Stylistic Design Engineering (SDE)
3. Results
3.1. Design Outlines
3.2. Validation
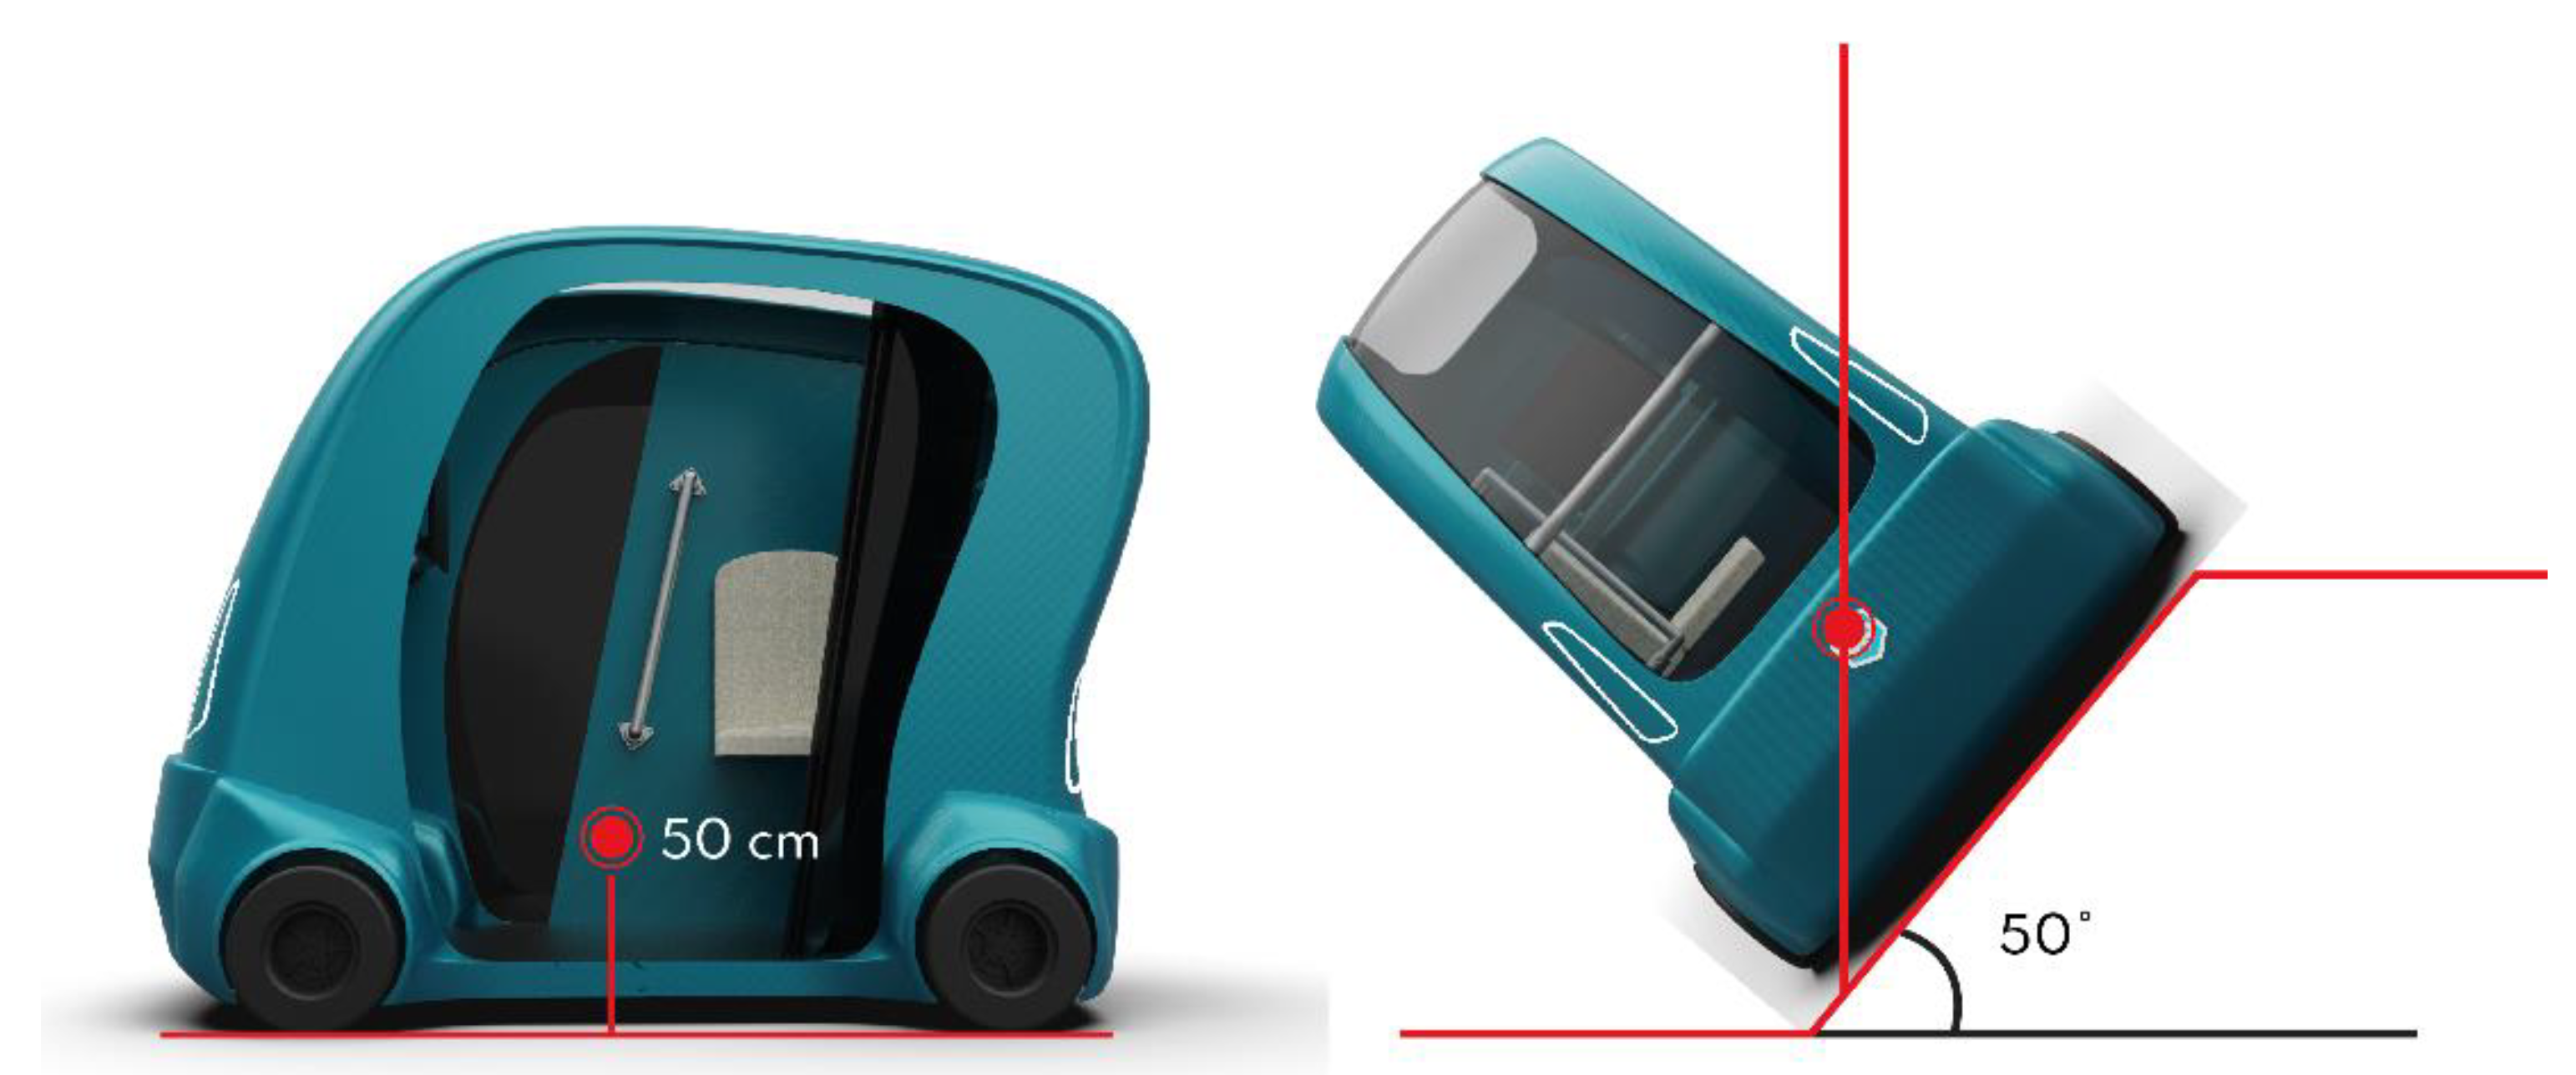
3.2.1. Testing
3.2.2. Modeling
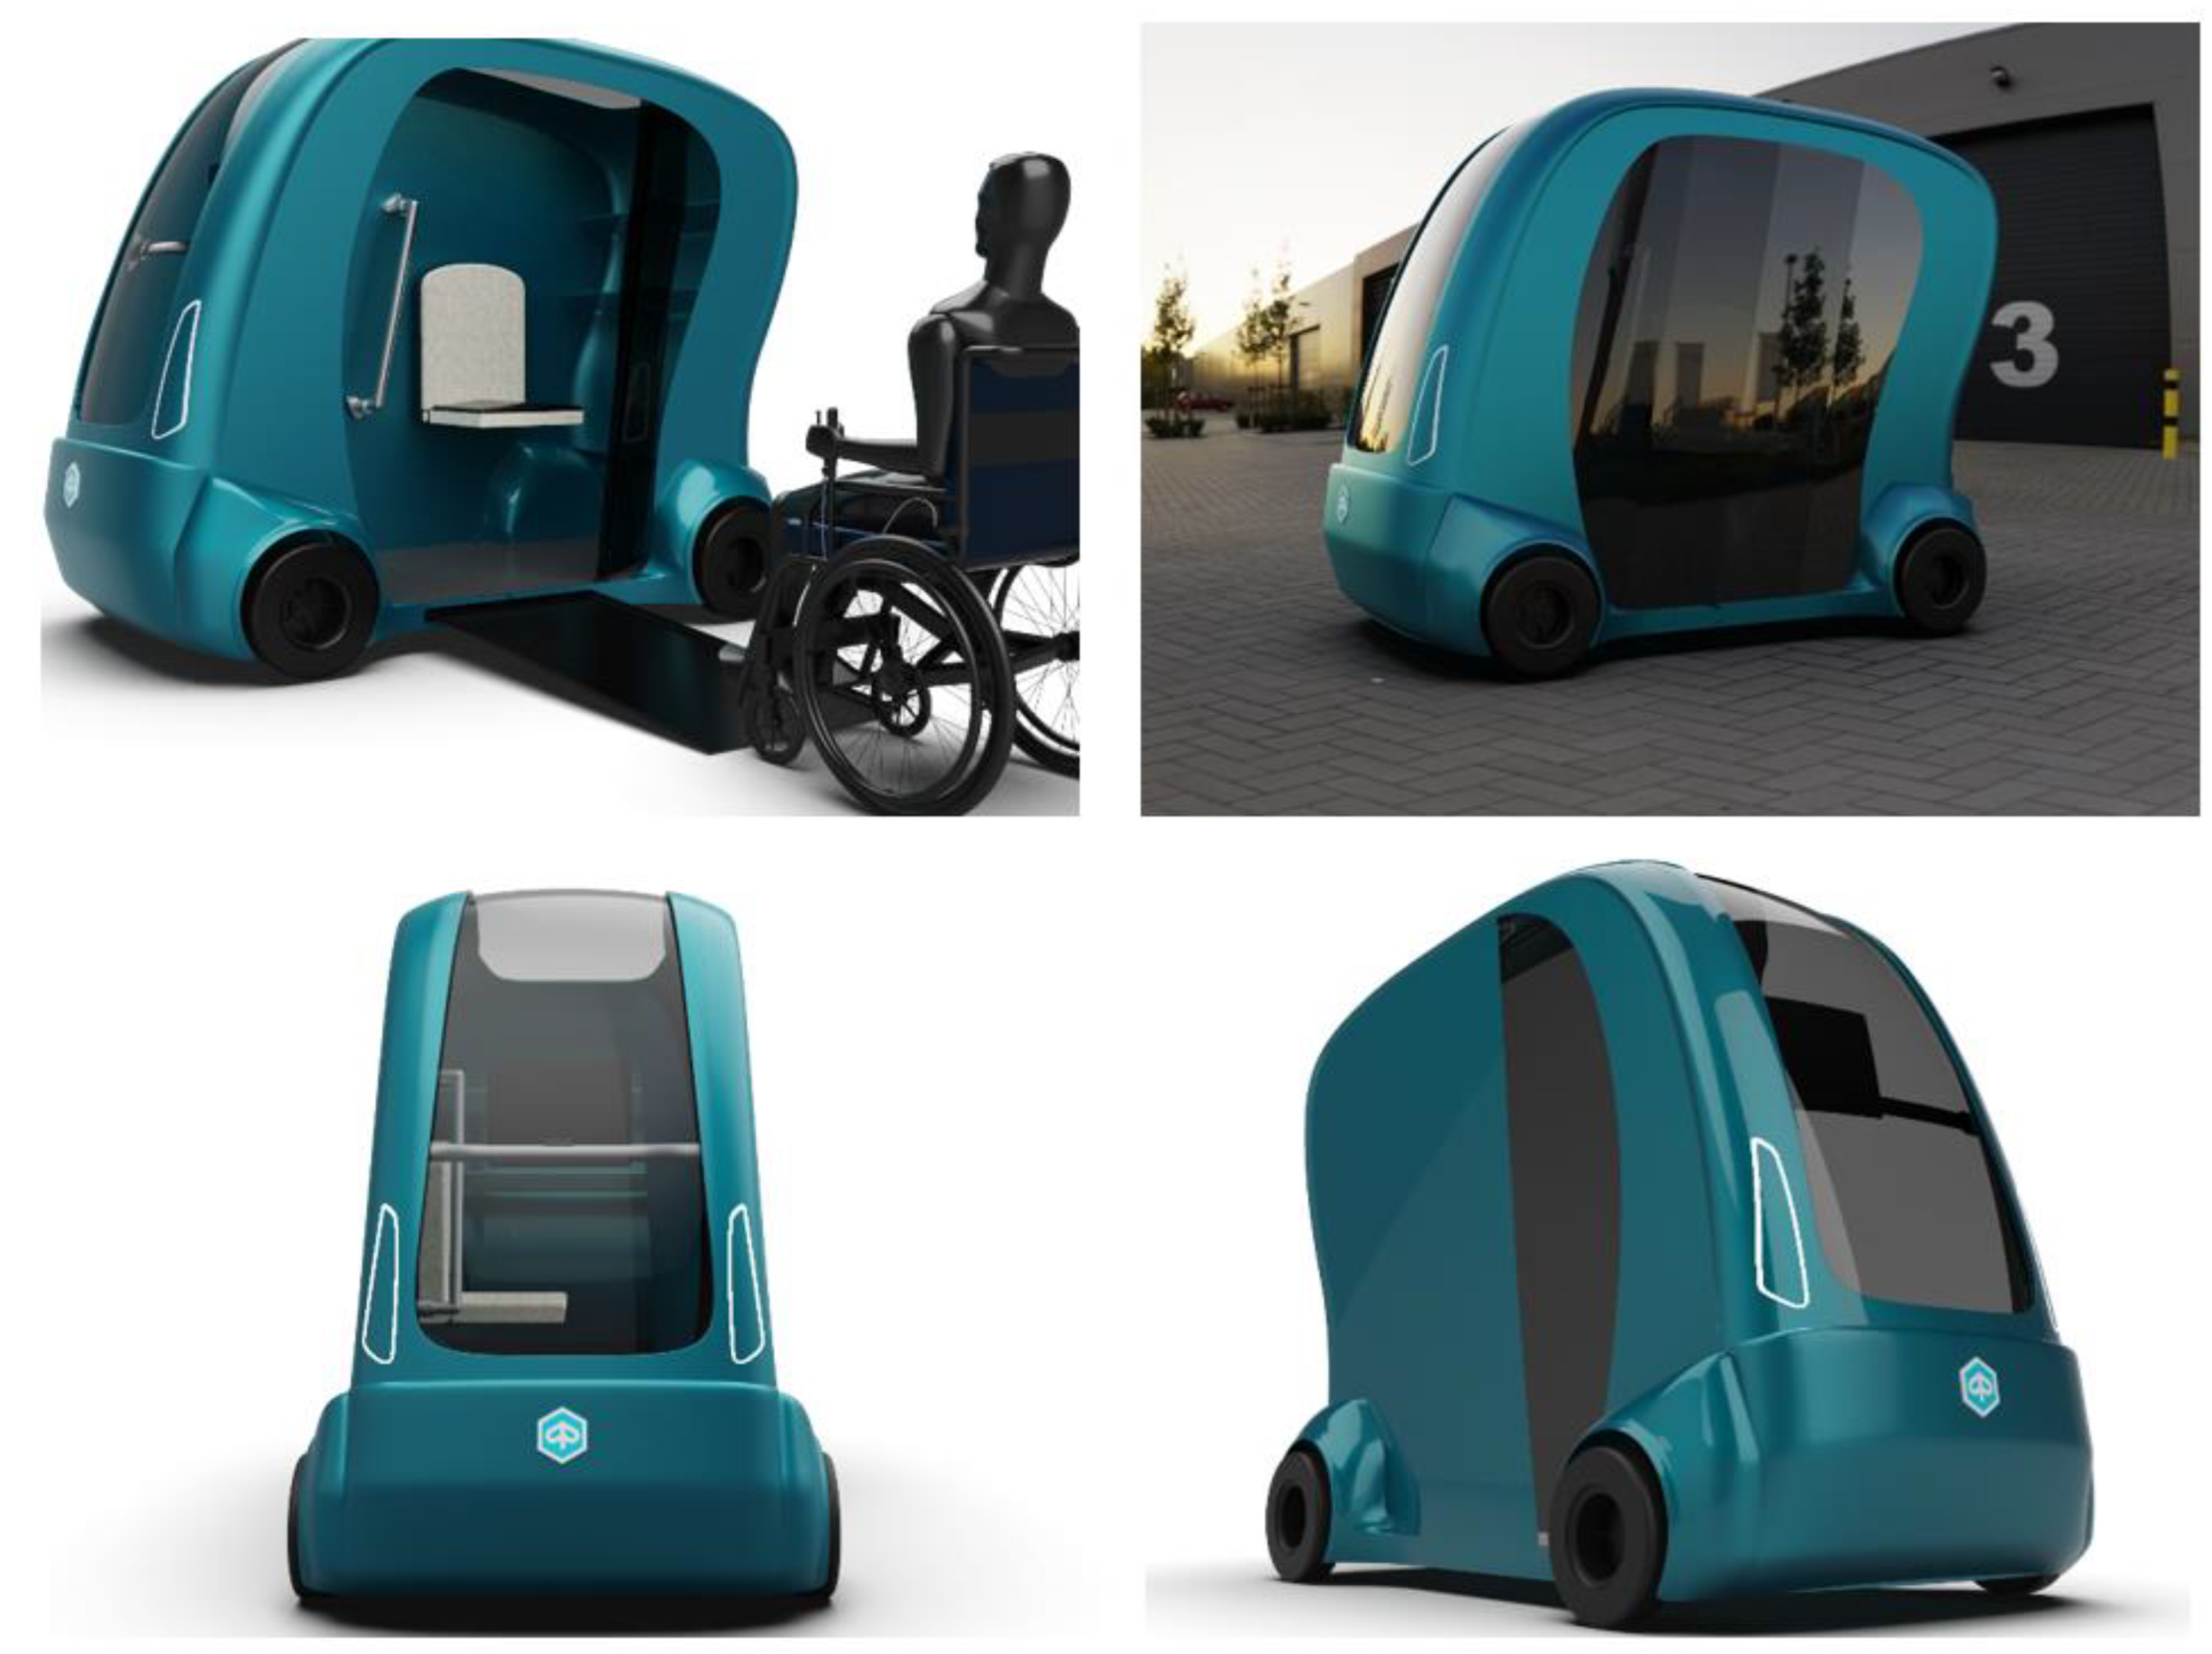
3.2.3. Rendering
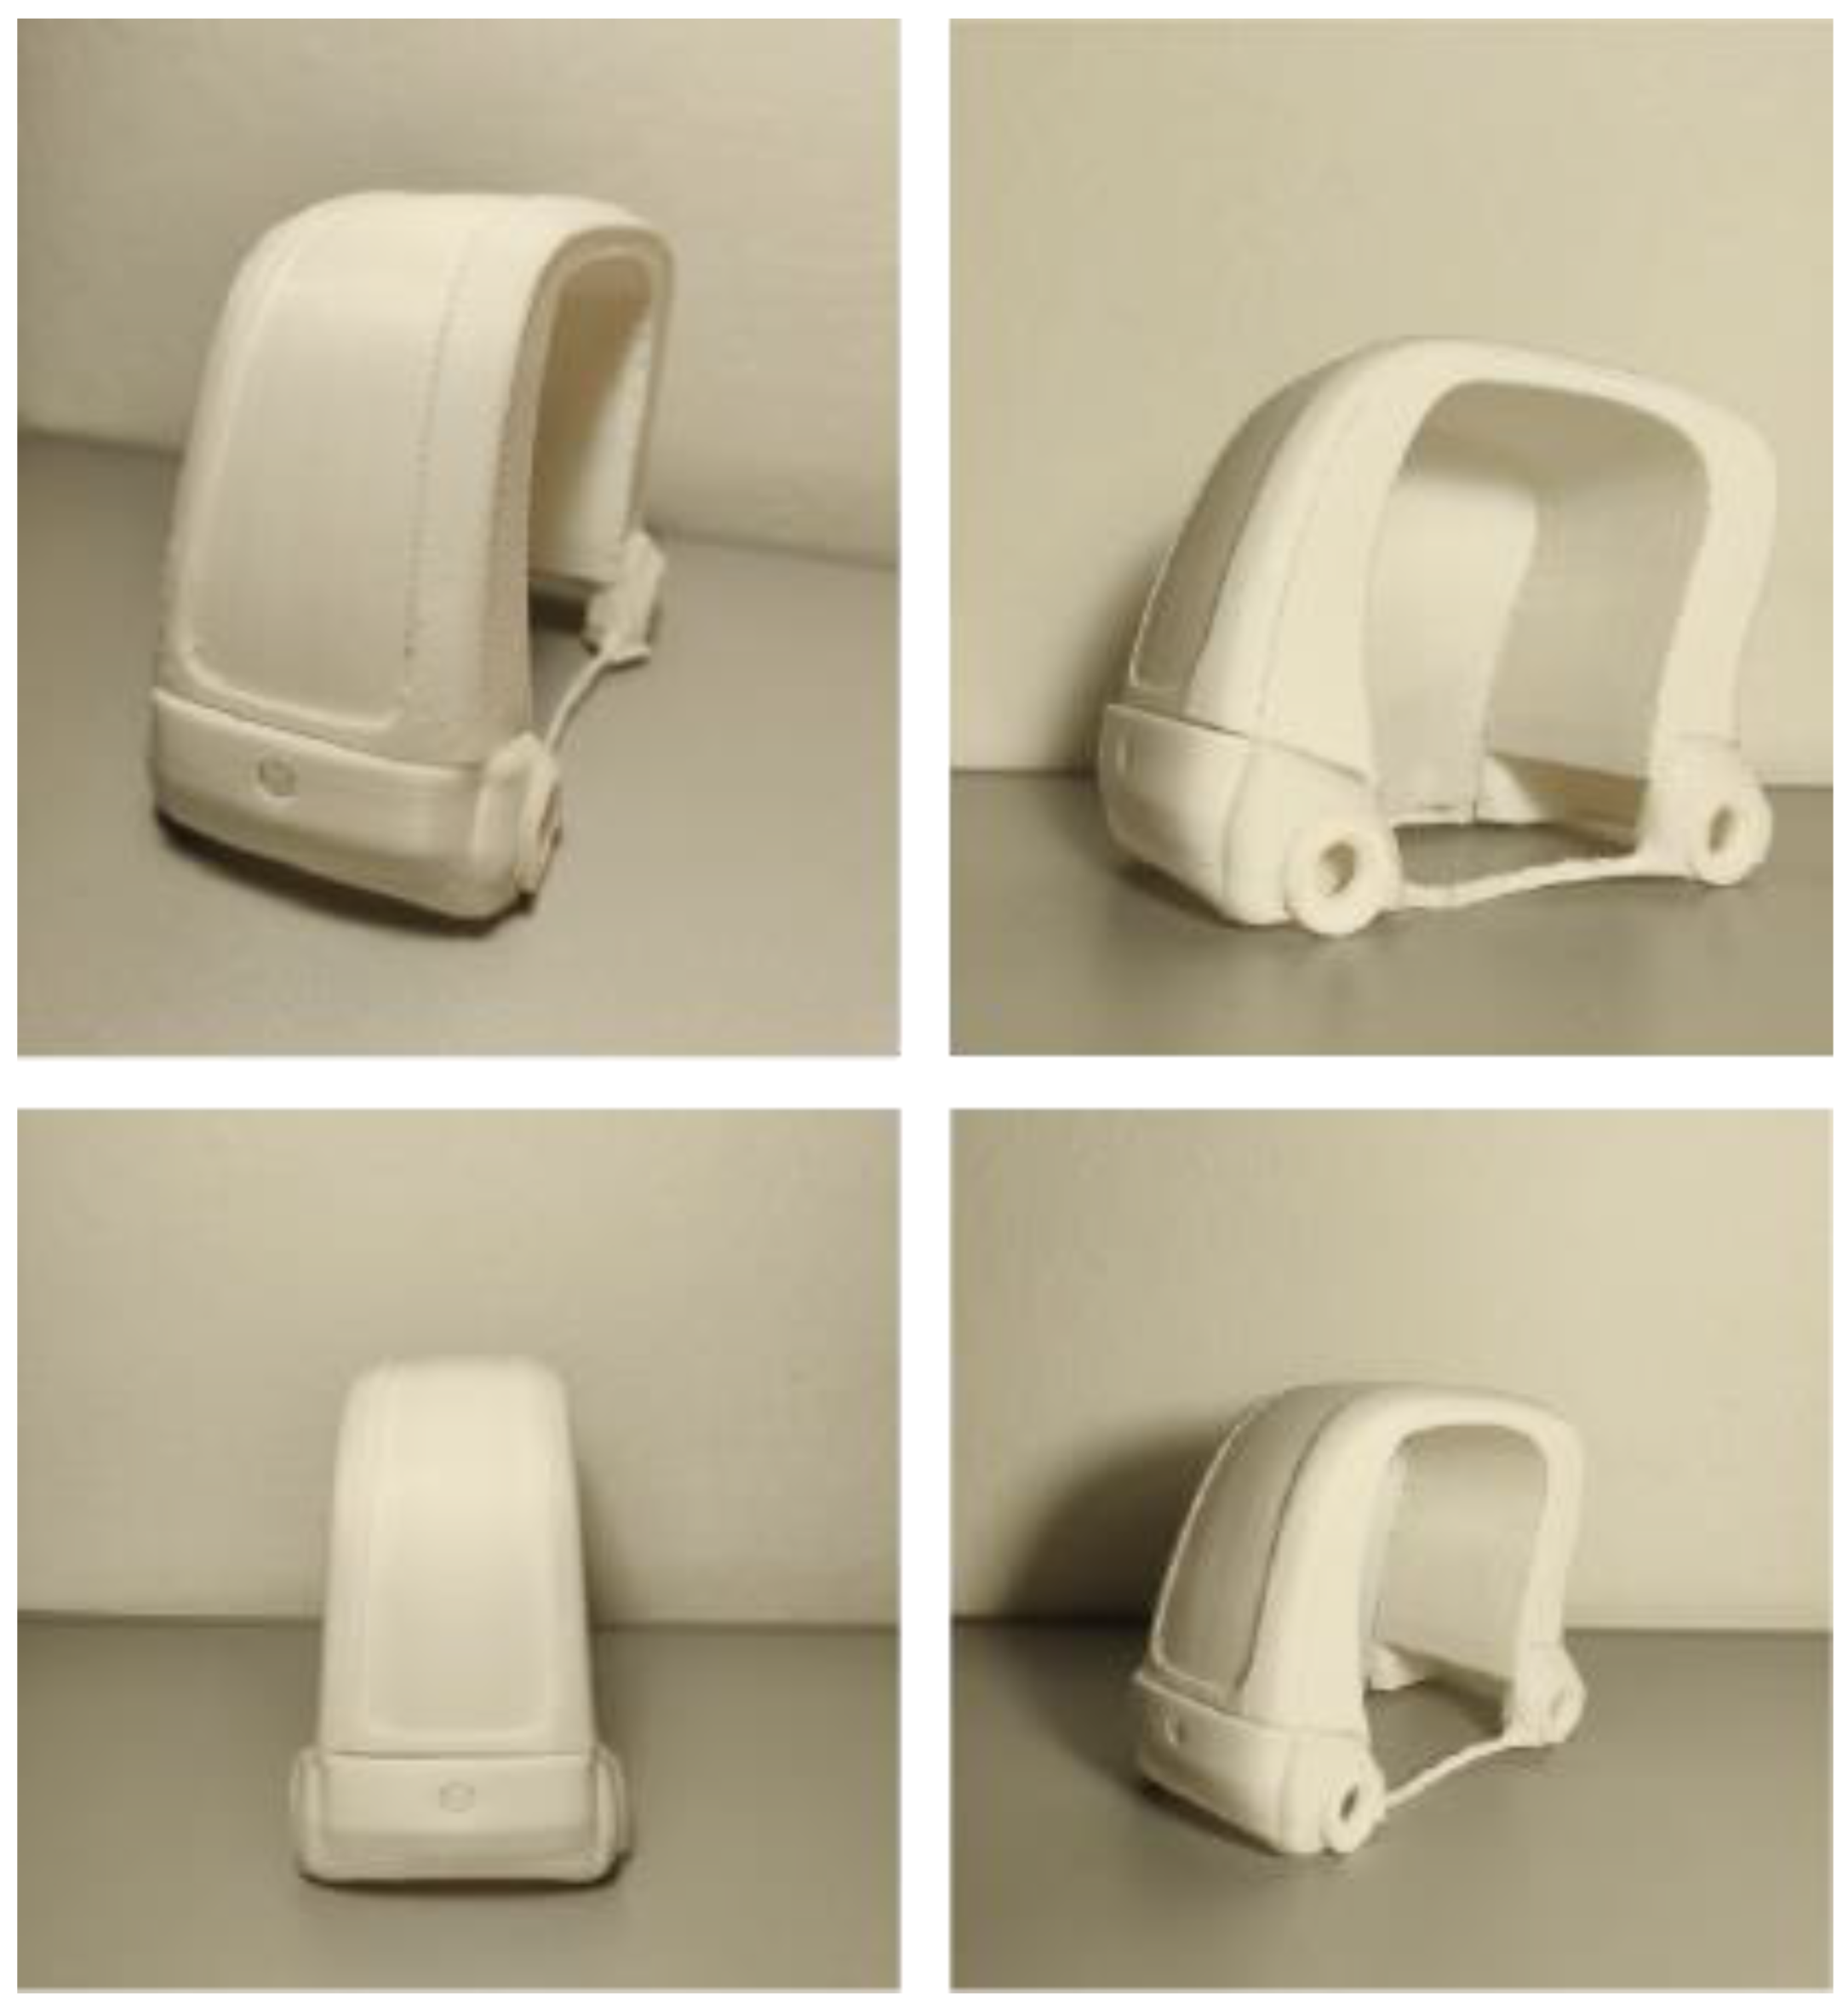
3.2.4. Prototyping
4. Discussion
Proposed Improvements
5. Conclusions
Author Contributions
Funding
Data Availability Statement
Acknowledgments
Conflicts of Interest
References
- Ciuffini, M.; Asperti, S.; Gentili, V.; Orsini, R.; Refrigeri, L. 4 Rapporto nazionale sulla sharing mobility. Oss. Naz. Shar. Mobil. 2020, 1–139. Available online: https://www.fondazionesvilupposostenibile.org/wp-content/uploads/dlm_uploads/IV-Rapporto-Sharing-Mobility.pdf (accessed on 7 June 2022).
- Carminucci, C.; Chindemi, A.; Procopio, M.; Saccà, V. 18° Rapporto sulla mobilità degli italiani. Gov. Transizioni Ripresa Sostenibile 2021, 1–139. Available online: https://www.isfort.it/wp-content/uploads/2021/11/211130_RapportoMobilita2021.pdf (accessed on 5 June 2022).
- Miskolczi, M.; Földes, D.; Munkácsy, A.; Jászberényi, M. Urban mobility scenarios until the 2030s. Sustain. Cities Soc. 2021, 72, 103029. [Google Scholar] [CrossRef]
- Sun, L.; Zhang, T.; Liu, S.; Wang, K.; Rogers, T.; Yao, L.; Zhao, P. Reducing energy consumption and pollution in the urban transportation sector: A review of policies and regulations in Beijing. J. Clean. Prod. 2021, 285, 125339. [Google Scholar] [CrossRef]
- Dill, J.; McNeil, N. Are Shared Vehicles Shared by All? A Review of Equity and Vehicle Sharing. J. Plan. Lit. 2021, 36, 5–30. [Google Scholar] [CrossRef]
- Frizziero, L.; Liverani, A.; Donnici, G.; Conti, E.; Dello Preite, B.; Lamanna, U.; Leon-Cardenas, C.; Garulli, M. GD (Generative Design) Applied to a Plastics Recovery Drone (PRD) Using IDeS (Industrial Design Structure). Inventions 2021, 6, 82. [Google Scholar] [CrossRef]
- Butt, J. A Strategic Roadmap for the Manufacturing Industry to Implement Industry 4.0. Designs 2020, 4, 11. [Google Scholar] [CrossRef]
- Bossert, J.L. Quality Function Deployment: The Practitioner’s Approach. Stati Uniti; CRC Press: Boca Raton, FL, USA, 2021. [Google Scholar]
- Panneerselvam, S. Quality concepts in Industrial systems using QFD (Quality Function Deployment)—Survey. Int. J. Ind. Eng. 2021, 8, 7–13. [Google Scholar] [CrossRef]
- Lankford, W.M. Benchmarking: Understanding the Basics. Coast. Bus. J. 2002, 1, 8. [Google Scholar]
- Kakan, D.; Deogratias, E.; Na, C.; Ting, Z.; Wei, H.; Tawhidur, R.M. Shared Sustainable Mobility. In Disruptive Emerging Transportation Technologies; American Society of Civil Engineers: Reston, VA, USA, 2022; pp. 185–222. [Google Scholar] [CrossRef]
- Doldi, M.L. La mobilità sostenibile e i veicoli elettrici, V rapporto 2021. Repower 2021. Available online: https://www.repower.com/media/682023/wp_v_edizione_2021.pdf (accessed on 5 June 2022).
- Asperti, S. Osservatorio Nazionale Sharing Mobility. Snap Charging, I Servizi di Sharing Mobility in 6 Città Italiane, 1° Rapporto Intermedio del 2021; Ministero della transizione Ecologica: Rome, Italy, 2021.
- Donati, A.; Petracchini, F.; Gasparini, C.; Tomassetti, L.; Cozza, V.; Scarpinella, M.S. 3° rapporto mobilitaria 2020. In Politiche Di Mobilità e Qualità dell’aria Nelle Città Italiane 2020 Analisi e Proposte Al Tempo del COVID-19; CNR-IIA: Roma, Italy, 2020; pp. 71–75. Available online: https://hdl.handle.net/11311/1171838 (accessed on 13 November 2022).
- Sacchelli, F. Fondazione Unipolis, Divisione Mobilità, Il Paradosso della Mobilità, 2020. Unipolis, 21 September 2019. [Google Scholar]
- I Servizi di Trasporto per i Disabili. I Numeri, le Regole, le Risorse: Un Inquadramento. Federmobilità, 9 July 2020.
- König, A.; Seiler, A.; Alčiauskaitė, L.; Hatzakis, T. A participatory qualitative analysis of barriers of public transport by persons with disabilities from seven European cities. J. Access. Des. All 2021, 11, 295–321. [Google Scholar]
- Chen, F.; Taylor, N. Nicole Kringos, Electrification of roads: Opportunities and challenges. Appl. Energy 2015, 150, 109–119. [Google Scholar] [CrossRef]
- Daze Technology, New Technologies for EV Charging. Available online: https://www.dazetechnology.com/technologies-charging-for-electric-vehicles/ (accessed on 23 May 2022).
- Schneider, J.; Carlson, R.; Sirota, J.; Sutton, R.; Taha, E.; Kesler, M.; Kamichi, K.; Teerlinck, I.; Abeta, H.; Minagawa, Y.; et al. Validation of Wireless Power Transfer up to 11kW Based on SAE J2954 with Bench and Vehicle Testing. In Proceedings of the WCX SAE World Congress Experience, Detroit, MI, USA, 9–11 April 2019. SAE Technical Paper 2019-01-0868. [Google Scholar]
- Self-Driving Cars Take the Wheel. Advanced Technologies Come Together to Get Autonomous Vehicles Driving Safely and Efficiently. Available online: https://www.technologyreview.com/2019/02/15/137381/self-driving-cars-take-the-wheel/ (accessed on 13 November 2022).
- Marketa Pape, EU Strategy on Cooperative Intelligent Transport Systems. 2017. Available online: https://epthinktank.eu/2017/09/01/eu-strategy-on-cooperative-intelligent-transport-systems/ (accessed on 23 May 2022).
- Smart Model Area—How to use the Smart Model Area. Available online: https://www.automotivesmartarea.it/servizi/come-usare-la-smart-area/ (accessed on 4 June 2022).
- Atakishiyev, S.; Salameh, M.; Yao, H.; Goebel, R. Explainable Artificial Intelligence for Autonomous Driving: A Comprehensive Overview and Field Guide for Future Research Directions. arXiv 2021, arXiv:2112.11561. [Google Scholar]
- Naz, N.; Ehsan, M.K.; Amirzada, M.R.; Ali, M.Y.; Qureshi, M.A. Intelligence of Autonomous Vehicles: A Concise Revisit. J. Sens. 2022, 2022, 2690164. [Google Scholar] [CrossRef]
- Bilal, L.; Seyhan, G.; Karaca, M.; Topaç, M.M. Body Design in Electric Microcars: A Review. In Proceedings of the 2th International Symposium on Innovative Approach in Scientific Studies, Samsun, Turkey, 30 November 2018. [Google Scholar]
- Tyagi, A.K.; Aswathy, S.U. Autonomous Intelligent Vehicles (AIV): Research statements, open issues, challenges and road for future. Int. J. Intell. Netw. 2021, 2, 83–102. [Google Scholar] [CrossRef]


| PERFORMANCE COSTS | MATERIAL COSTS | EQUIPMENT COSTS | ||||||||||
|---|---|---|---|---|---|---|---|---|---|---|---|---|
| Engineer (50 €/h) | Designer (40 €/h) | Worker (30 €/h) | ||||||||||
| Task | No. of Employee | Cost | No. of Employees | Cost | No. of Employees | Cost | N° Hour | Total Cost | Number of Pieces | Cost per Piece | Piece | Cost |
| Environmental analysis | 3 | 150 | 480 | 72,000 | Body | 500,000 | ||||||
| Competitors analysis | 3 | 150 | 480 | 72,000 | Frame | 450,000 | ||||||
| Product architecture | 5 | 250 | 3 | 120 | 960 | 355,200 | Windows | 590,000 | ||||
| Styling | 1 | 50 | 4 | 160 | 7 | 210 | 960 | 403,200 | External accessories | 100,000 | ||
| Lighting | 98,000 | |||||||||||
| Design | 60 | 3000 | 1440 | 4,320,000 | Interiors | 450,000 | ||||||
| Prototyping | 10 | 500 | 1 | 40 | 50 | 1500 | 1440 | 2,937,600 | 5 | 450,000 | Interface and software | 200,000 |
| Test | 1 | 50 | 30 | 900 | 1440 | 1,368,000 | _ | 230,000 | Electrical Component | 142,000 | ||
| Re-design | 60 | 3000 | 5 | 200 | 960 | 3,072,000 | _ | Engine and mechanic | 120,000 | |||
| Prototyping | 10 | 500 | 5 | 200 | 50 | 1500 | 960 | 2,112,000 | 10 | 480,000 | ||
| Test | 1 | 50 | 30 | 900 | 960 | 912,000 | _ | 230,000 | ||||
| Deliberation | 2 | 100 | 1 | 40 | 15 | 450 | 960 | 566,400 | ||||
| TOTAL | 16,190,400 € | TOTAL | 7,510,000 € | TOTAL | 2,650,000 € | |||||||
| TOTAL | 26,350,400 € | |||||||||||
| Pros | Cons | |
|---|---|---|
 E-BIKE | No driving license required Easy to use Widespread Avoid the traffic Not much cost Access to restricted traffic areas | Single seat Limited travel distance Low load capacity Does not have coverage Not for all |
 ELECTRIC KICK SCOOTER | Compact and quick No driving license required Easy parking Avoid the traffic Widespread Access to restricted traffic areas | Not usable by all Single seat Absence of luggage rack Large number of accidents Does not have coverage |
 HOVERBOARD | Compactness Avoid the traffic Low cost Transportability when not used No driving license required | Not usable by all Poor stability Does not have coverage You must learn to use it Absence of luggage rack Usable for short distances |
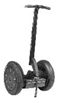 SEGWAY | Quick Avoid the traffic Sturdy wheels No driving license required No physical effort required Access to restricted traffic areas | Poor stability Not usable by all You must learn to use it Usable for short distances Absence of luggage rack Does not have coverage |
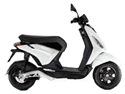 SCOOTER | Quick Avoid the traffic Traveling long distances Can have 2 seats Access to restricted traffic areas It has a luggage rack | Driving license required Not usable by all Large number of accidents Not all have coverage Limited luggage rack capacity |
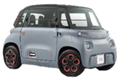 MICROCAR | Traveling long distances Two seats Protection in case of rain Access to restricted traffic areas Requires little parking space | Does not avoid traffic Need at least the license AM High cost Small luggage compartment Low safety |
 CITY CAR | Traveling long distances It has the trunk It has more than two seats Safety Protection in case of rain | Driving license required Does not avoid traffic Cannot go everywhere Not accessible to all High cost Needs space for parking |
| 1 | 2 | 3 | 4 | 5 | 6 | 7 | 8 | 9 | 10 | 11 | 12 | 13 | 14 | 15 | 16 | 17 | 18 | 19 | 20 | 21 | |
| 1. Travel time | 1 | 1 | 1 | 0 | 0 | 0 | 2 | 1 | 2 | 1 | 1 | 1 | 0 | 1 | 0 | 1 | 0 | 1 | 2 | 2 | 1 |
| 2. Safe | 1 | 1 | 1 | 0 | 0 | 0 | 2 | 1 | 2 | 1 | 1 | 1 | 0 | 1 | 0 | 1 | 0 | 1 | 2 | 2 | 1 |
| 3. Adaptable | 1 | 1 | 1 | 0 | 0 | 1 | 1 | 1 | 1 | 0 | 0 | 1 | 1 | 1 | 0 | 1 | 0 | 1 | 1 | 2 | 0 |
| 4. Compact | 2 | 2 | 2 | 1 | 1 | 2 | 2 | 2 | 2 | 1 | 1 | 2 | 2 | 2 | 1 | 2 | 0 | 2 | 2 | 2 | 1 |
| 5. Noisy | 2 | 2 | 2 | 1 | 1 | 2 | 2 | 1 | 2 | 1 | 1 | 1 | 2 | 2 | 1 | 2 | 1 | 2 | 2 | 2 | 2 |
| 6. Sustainable | 2 | 2 | 1 | 0 | 0 | 1 | 1 | 1 | 1 | 0 | 0 | 0 | 1 | 1 | 0 | 1 | 0 | 1 | 1 | 1 | 1 |
| 7. Economical | 0 | 0 | 1 | 0 | 0 | 1 | 1 | 1 | 1 | 0 | 0 | 1 | 1 | 1 | 0 | 1 | 0 | 1 | 1 | 1 | 0 |
| 8. Inclusive | 1 | 1 | 1 | 0 | 1 | 1 | 1 | 1 | 1 | 0 | 0 | 1 | 1 | 1 | 0 | 1 | 0 | 1 | 1 | 1 | 0 |
| 9. Autonomous | 0 | 0 | 1 | 0 | 0 | 1 | 1 | 1 | 1 | 0 | 0 | 1 | 0 | 1 | 0 | 1 | 0 | 1 | 1 | 1 | 1 |
| 10. Modular | 1 | 1 | 2 | 1 | 1 | 2 | 2 | 2 | 2 | 1 | 1 | 1 | 2 | 2 | 1 | 2 | 2 | 2 | 2 | 2 | 1 |
| 11. Spacious | 1 | 1 | 2 | 1 | 1 | 2 | 2 | 2 | 2 | 1 | 1 | 2 | 2 | 2 | 1 | 2 | 0 | 1 | 2 | 2 | 2 |
| 12. Comfortable | 1 | 1 | 1 | 0 | 1 | 2 | 1 | 1 | 1 | 1 | 0 | 1 | 1 | 1 | 0 | 2 | 1 | 2 | 2 | 2 | 1 |
| 13. Power source | 2 | 2 | 1 | 0 | 0 | 1 | 1 | 1 | 2 | 0 | 0 | 1 | 1 | 1 | 0 | 1 | 0 | 1 | 1 | 1 | 1 |
| 14. Waiting time | 1 | 1 | 1 | 0 | 0 | 1 | 1 | 1 | 1 | 0 | 0 | 1 | 1 | 1 | 0 | 1 | 0 | 1 | 1 | 1 | 0 |
| 15. Ergonomic | 2 | 2 | 2 | 1 | 1 | 2 | 2 | 2 | 2 | 1 | 1 | 2 | 2 | 2 | 1 | 2 | 1 | 2 | 2 | 2 | 1 |
| 16. Practical | 1 | 1 | 1 | 0 | 0 | 1 | 1 | 1 | 1 | 0 | 0 | 0 | 1 | 1 | 0 | 1 | 0 | 1 | 1 | 1 | 1 |
| 17. Appearance | 2 | 2 | 2 | 2 | 1 | 2 | 2 | 2 | 2 | 2 | 2 | 1 | 2 | 2 | 1 | 2 | 1 | 2 | 2 | 2 | 2 |
| 18. Resistant | 1 | 1 | 1 | 0 | 0 | 1 | 1 | 1 | 1 | 0 | 1 | 0 | 1 | 1 | 0 | 1 | 0 | 1 | 1 | 1 | 1 |
| 19. Available | 0 | 0 | 1 | 0 | 0 | 1 | 1 | 1 | 1 | 0 | 0 | 0 | 1 | 1 | 0 | 1 | 0 | 1 | 1 | 1 | 0 |
| 20. Widespread | 0 | 0 | 0 | 0 | 0 | 1 | 1 | 1 | 1 | 0 | 0 | 0 | 1 | 1 | 0 | 1 | 0 | 1 | 1 | 1 | 1 |
| 21. Can be integrated | 1 | 1 | 2 | 1 | 0 | 1 | 2 | 2 | 1 | 1 | 0 | 1 | 1 | 2 | 1 | 1 | 0 | 1 | 2 | 1 | 1 |
| TOTAL | 23 | 23 | 27 | 8 | 8 | 26 | 30 | 27 | 30 | 11 | 10 | 19 | 24 | 28 | 7 | 28 | 6 | 27 | 31 | 31 | 19 |
| 1 | 2 | 3 | 4 | 5 | 6 | 7 | 8 | 9 | 10 | 11 | 12 | 13 | 14 | 15 | 16 | 17 | 18 | 19 | 20 | 21 | DEPENDENCE | |
| 1. Travel time | x | 1 | 0 | 0 | 0 | 0 | 3 | 0 | 9 | 0 | 3 | 0 | 9 | 9 | 0 | 0 | 0 | 0 | 9 | 3 | 3 | 49 |
| 2. Safe | 1 | x | 3 | 9 | 1 | 3 | 9 | 3 | 0 | 0 | 9 | 3 | 1 | 0 | 3 | 0 | 0 | 9 | 0 | 1 | 1 | 56 |
| 3. Adaptable | 0 | 1 | x | 3 | 0 | 1 | 9 | 9 | 3 | 9 | 9 | 3 | 3 | 0 | 3 | 9 | 0 | 1 | 9 | 9 | 9 | 90 |
| 4. Compact | 1 | 9 | 3 | x | 0 | 1 | 3 | 0 | 3 | 9 | 9 | 3 | 3 | 0 | 3 | 1 | 0 | 1 | 1 | 0 | 3 | 53 |
| 5. Noisy | 0 | 0 | 0 | 1 | x | 0 | 1 | 0 | 0 | 0 | 3 | 1 | 9 | 0 | 0 | 0 | 0 | 0 | 0 | 0 | 0 | 15 |
| 6. Sustainable | 9 | 0 | 3 | 1 | 0 | x | 9 | 0 | 9 | 1 | 3 | 0 | 9 | 0 | 0 | 0 | 0 | 3 | 3 | 1 | 0 | 51 |
| 7. Economical | 9 | 9 | 9 | 3 | 3 | 9 | x | 1 | 3 | 9 | 3 | 9 | 9 | 0 | 3 | 1 | 9 | 9 | 0 | 1 | 3 | 102 |
| 8. Inclusive | 0 | 0 | 9 | 3 | 0 | 0 | 3 | x | 0 | 9 | 9 | 3 | 0 | 3 | 1 | 3 | 0 | 0 | 9 | 3 | 3 | 58 |
| 9. Autonomous | 9 | 0 | 0 | 3 | 0 | 9 | 9 | 0 | x | 0 | 1 | 0 | 9 | 0 | 0 | 0 | 0 | 0 | 3 | 3 | 1 | 47 |
| 10. Modular | 0 | 0 | 9 | 9 | 0 | 0 | 9 | 9 | 0 | x | 9 | 1 | 1 | 1 | 1 | 9 | 3 | 1 | 3 | 0 | 3 | 68 |
| 11. Spacious | 1 | 3 | 3 | 9 | 0 | 0 | 3 | 3 | 0 | 0 | x | 0 | 0 | 3 | 0 | 0 | 0 | 0 | 3 | 3 | 1 | 32 |
| 12. Comfortable | 1 | 1 | 1 | 3 | 9 | 0 | 9 | 3 | 0 | 9 | 9 | x | 1 | 9 | 9 | 9 | 3 | 3 | 3 | 3 | 3 | 88 |
| 13. Power source | 3 | 1 | 0 | 1 | 0 | 9 | 9 | 0 | 9 | 0 | 0 | 0 | x | 0 | 0 | 0 | 0 | 3 | 9 | 9 | 0 | 53 |
| 14. Waiting time | 9 | 0 | 0 | 1 | 0 | 0 | 0 | 0 | 3 | 0 | 3 | 0 | 3 | x | 0 | 0 | 0 | 0 | 9 | 3 | 1 | 32 |
| 15. Ergonomic | 0 | 0 | 0 | 3 | 0 | 0 | 3 | 3 | 0 | 9 | 3 | 1 | 0 | 0 | x | 3 | 1 | 3 | 0 | 0 | 1 | 30 |
| 16. Practical | 1 | 0 | 9 | 9 | 0 | 0 | 1 | 9 | 3 | 9 | 9 | 1 | 3 | 9 | 3 | x | 0 | 0 | 3 | 9 | 9 | 87 |
| 17. Appearance | 0 | 0 | 9 | 9 | 0 | 3 | 9 | 0 | 0 | 1 | 0 | 0 | 0 | 0 | 3 | 1 | x | 1 | 0 | 0 | 0 | 36 |
| 18. Resistant | 3 | 9 | 3 | 9 | 0 | 1 | 9 | 0 | 0 | 0 | 0 | 0 | 1 | 0 | 0 | 0 | 1 | x | 0 | 0 | 0 | 36 |
| 19. Available | 9 | 0 | 9 | 0 | 0 | 1 | 1 | 3 | 9 | 0 | 9 | 0 | 3 | 9 | 0 | 0 | 0 | 0 | x | 9 | 3 | 65 |
| 20. Widespread | 3 | 0 | 3 | 9 | 0 | 1 | 1 | 0 | 9 | 1 | 3 | 0 | 3 | 3 | 0 | 0 | 0 | 0 | 9 | x | 3 | 48 |
| 21. Can be integrated | 1 | 3 | 9 | 3 | 0 | 0 | 1 | 1 | 0 | 9 | 3 | 0 | 1 | 0 | 3 | 9 | 3 | 0 | 3 | 1 | x | 50 |
| INDEPENDENCE | 60 | 37 | 82 | 88 | 13 | 38 | 101 | 44 | 60 | 75 | 97 | 25 | 68 | 46 | 32 | 45 | 20 | 34 | 76 | 58 | 47 |
| CITROËN AMI | RENAULT TWIZY E-TECH ELECTRIC | TAZZARI ZERO CITY | XEV YOYO | MICROLINO | INNOVATION | |
|---|---|---|---|---|---|---|
| Length | 2410 mm | 2338 mm | 2795 mm | 2530 mm | 2519 mm | <2410 mm |
| Height | 1520 mm | 1 454 mm | 1450 mm | 1560 mm | 1501 mm | <1450 mm |
| Width | 1390 mm | 1381 mm | 1500 mm | 1500 mm | 1473 mm | <1381 mm |
| Weight | 490 kg | 446 kg | 650 kg | 850 kg | 513 kg | <446 kg |
| Battery | Lithium 5.5 Wh | Lithium 14 kWh | Lithium 14.2 kWh | Lithium 10.3 kWh | Lithium 14 kWh | >14.2 kWh |
| Engine | 6 kW | 13 kW | 15 kW | 7.5 kW | 12.5kW | >15 kW |
| Recharge | 3 h | 3.5 h | 3 h | 4 h | 4 h | <3h |
| Maximum speed | 45 km/h | 80 km/h | 90 km/h | 80 km/h | 90 km/h | ≤45 km/h |
| Battery life | 75 km | 100 km | 140 km | 150 km | 230 km | >230 km |
| Number of seats | 2 | 2 | 2 | 2 | 2 | 2 |
| Price | 5731 € | 12,000 € | 17,490 € | 14,900 € | 12,500 € | <5731 € |
| Doors | 2 | 2 | 3 | 3 | 2 | 3 |
| Trunk capacity | 0 L | 0 L | 445 L | 180 L | 230 L | >445 L |
| Supply voltage | 220 V | 220 V | 220 V | 220 V | 220 V | 220 V |
| Replaceable battery | No | No | No | Yes | No | Yes |
| Safety devices against accidents | Seat belts, ABS | Seat belts, airbag, lateral reinforcements | Seat belts, airbag, ABS | Seat belts, ABS, Airbag, lateral and frontal reinforcements | Seat belts | Seat belts, ABS, airbag, lateral and frontal reinforcements |
| Energy recovery system | Yes | Yes | Yes | No | Yes | Yes |
| Steering diameter | 7.20 m | 6.8 m | 7 m | 8 m | 7.5 m | <6.8 m |
| Need driving license | ≥AM | ≥B1 | ≥B1 | ≥B1 | ≥B1 | ≥AM |
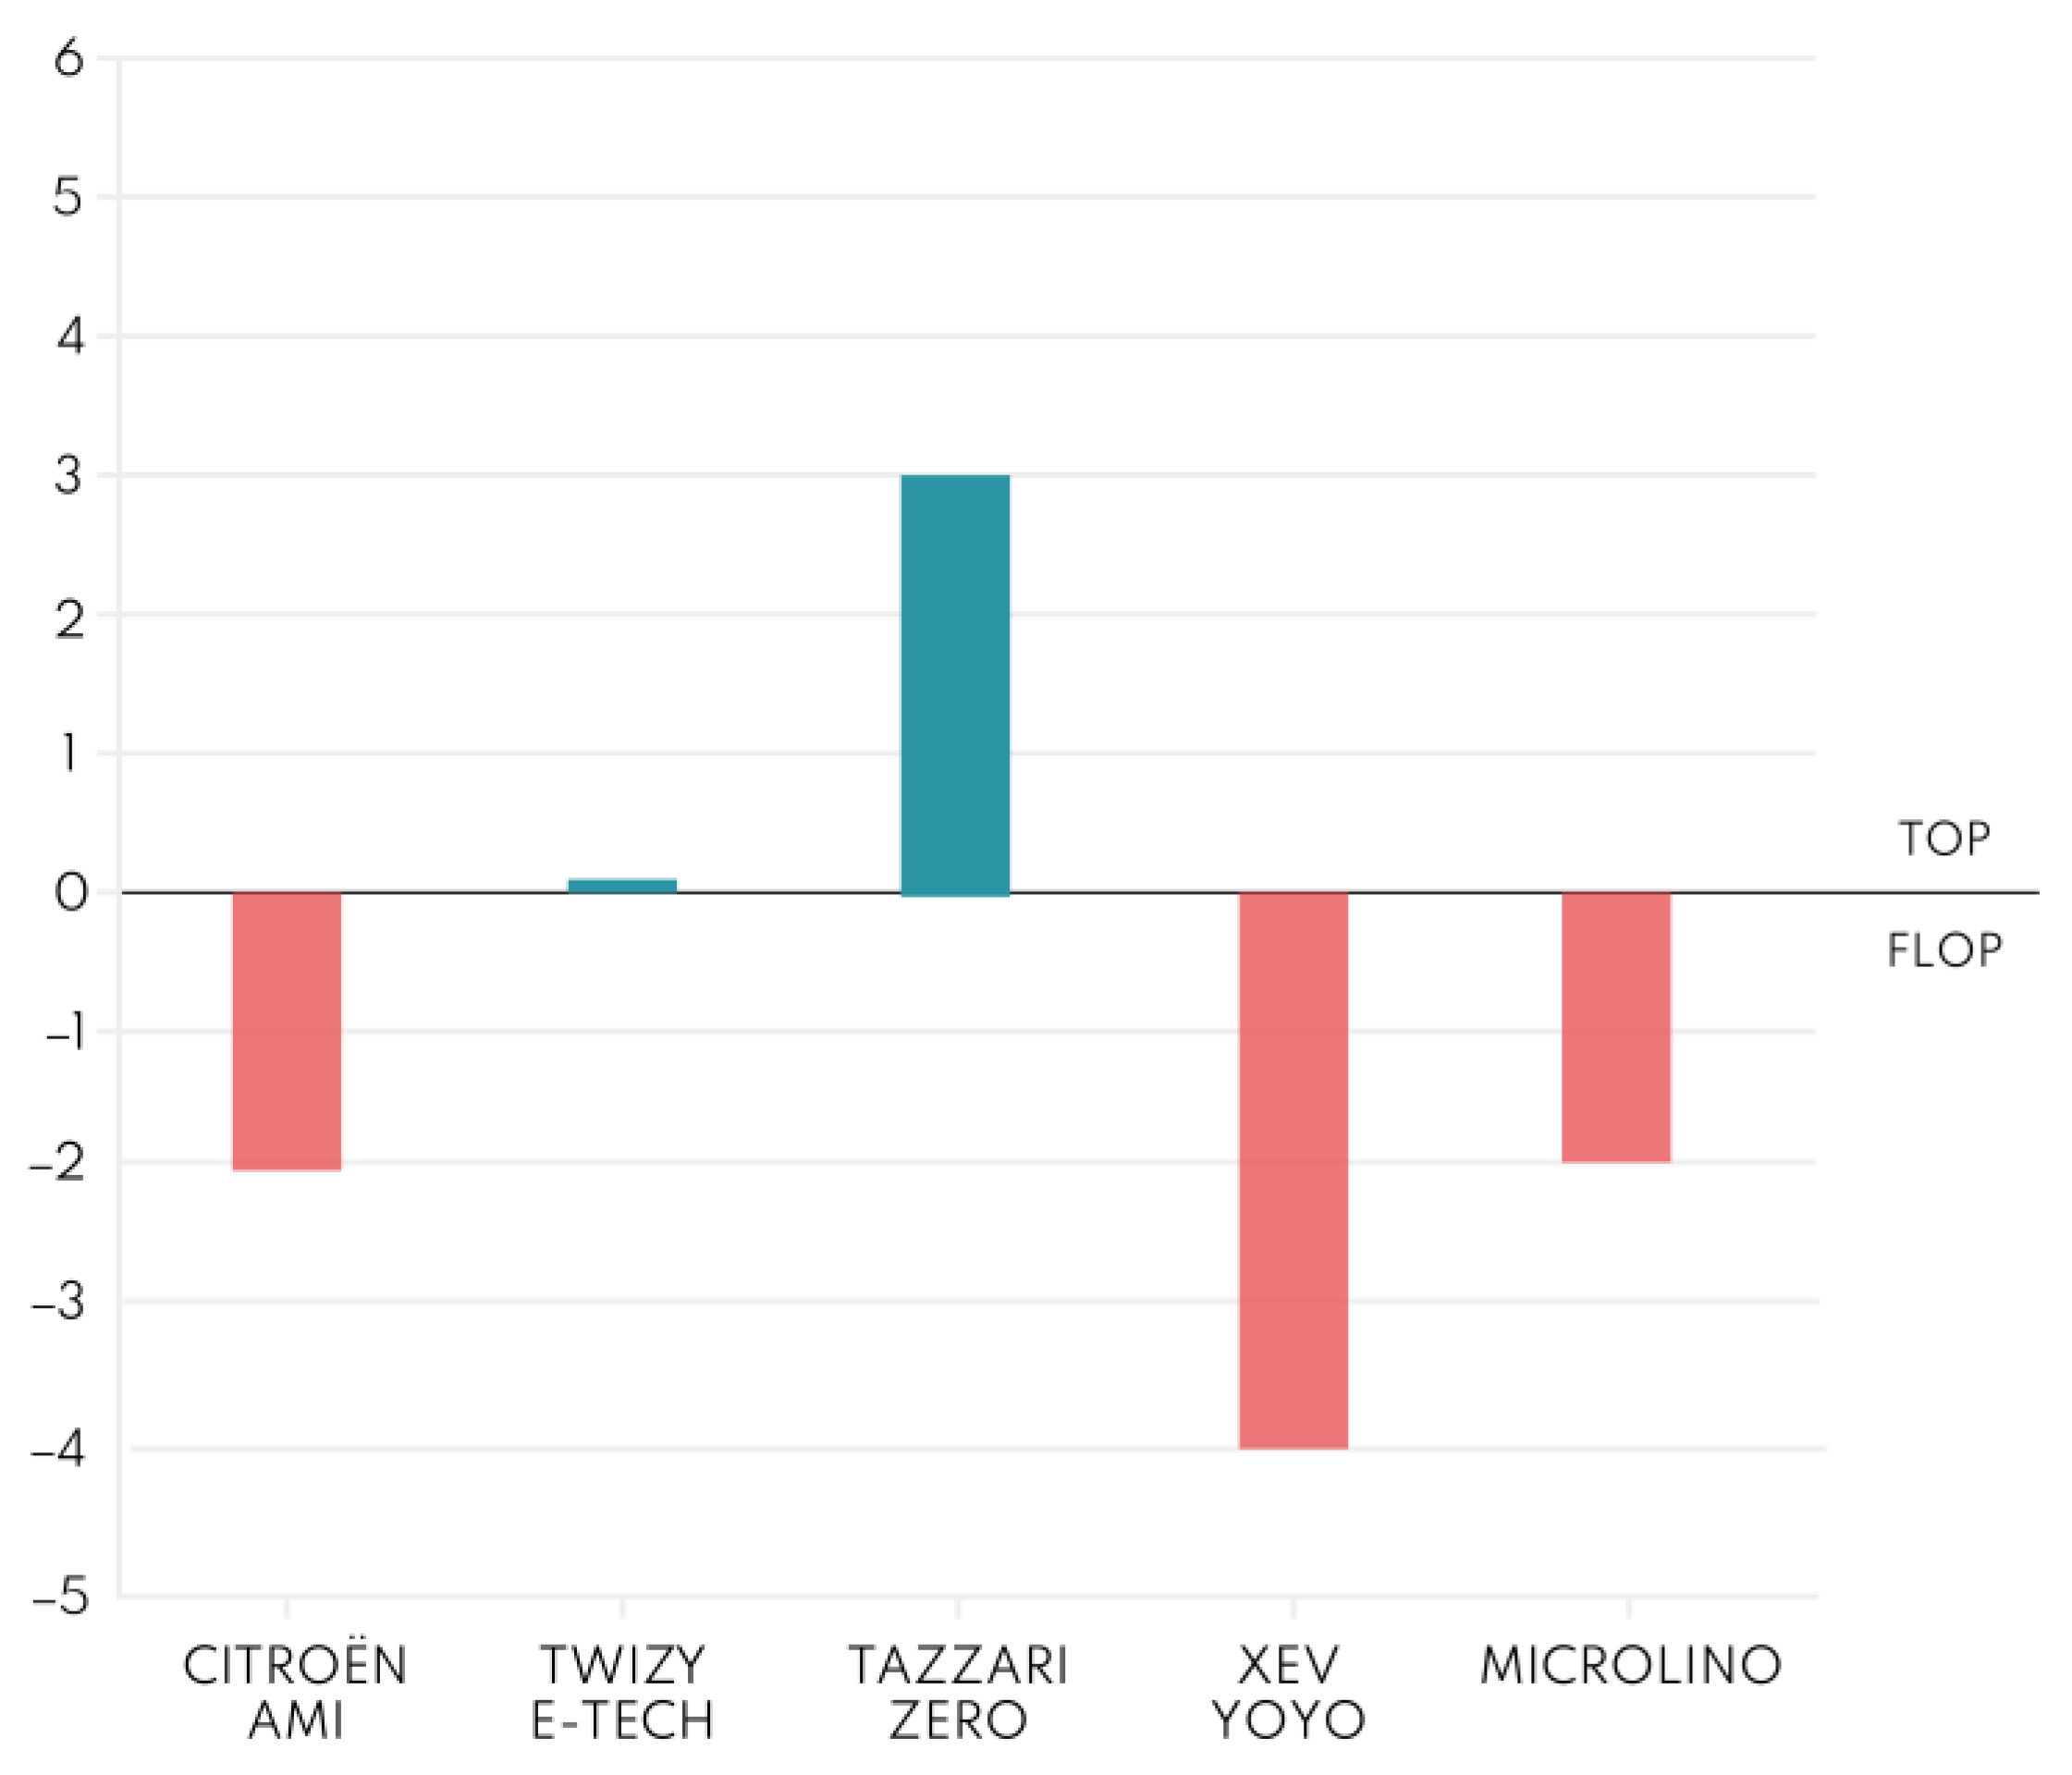
| TOP | 5 | 4 | 8 | 3 | 3 | |
| FLOP | 7 | 4 | 5 | 7 | 5 | |
| ∆ | −2 | 0 | 3 | −4 | −2 | ≥4 |
| COWBOY 4 ST | VANMOOF X3 | TOWNIE 10D EQ | RALEIGH | CENTROS TOUR | COLEEN modern DB | ANGELL | INNOVATION | |
|---|---|---|---|---|---|---|---|---|
| Weight | 19 kg | 20.8 kg | 25 kg | 30 kg | 26 kg | 24.5 kg | 15.9 kg | <15.9 kg |
| Battery | 35 V | 36 V | 36 V | 36 V | 36 V | 48 V | 36 V | >48 V |
| Replaceable battery | Yes | No | Yes | Yes | Yes | No | Yes | Yes |
| Brake | Hydraulic discs | Hydraulic discs | Hydraulic discs | Discs | Discs | Hydraulic discs | Discs | Hydraulic discs |
| Engine | 250 W | 250 W | 250 W | 250 W | 250 W | 750 W | 250 W | >750 W |
| Charge time | 3 h 20 min | 4 h | 4–5 h | 4–6 h | 4–5 h | 2 h 30 min | 2 h | <2 h |
| Maximum speed | 25 km/h | 25 km/h | 25 km/h | 20 km/h | 25 km/h | 45 km/h | 25 km/h | <25 km/h |
| Battery life | 70 km | 150 km | 100 km | 60 km | 206 km | 70 km | 90 km | >206 km |
| Rider height | 170–195 cm | 155–200 cm | 160–190 cm | 160–200 cm | 160–200 cm | 165–195 cm | 165–195 cm | ≥155–200 |
| Payload | 140 kg | 120 kg | 136 kg | 180 kg | 120 kg | 140 kg | 125 kg | > kg |
| Wheel type | Anti-drilling | Inner tube | Anti-drilling | Anti-drilling | Anti-drilling | Inner tube | Anti-drilling | Anti-drilling |
| Wheel | 27.5” | 24“ | 27.5” | 20”–21” | 26 “ | 27.5” | 28” | 24 < x > 25 |
| Chassis | Aluminium | Aluminium | Aluminium | Aluminium | Aluminium | Aluminium | Aluminium | Aluminium |
| Price | 2.490 € | 2.198 € | 3.799 € | 5.863 € | 3.195 € | 9.990 € | 2.860 € | <2.198 € |
| Luggage rack | Yes | Yes | Yes | Yes | Yes | Yes | Yes | Yes |
| Embedded gps | Yes | Yes | No | No | No | Yes | Yes | Yes |
| Bluetooth | Yes | Yes | Yes | No | No | Yes | Yes | Yes |
| Dedicated App | Yes | Yes | Yes | No | No | Yes | Yes | Yes |
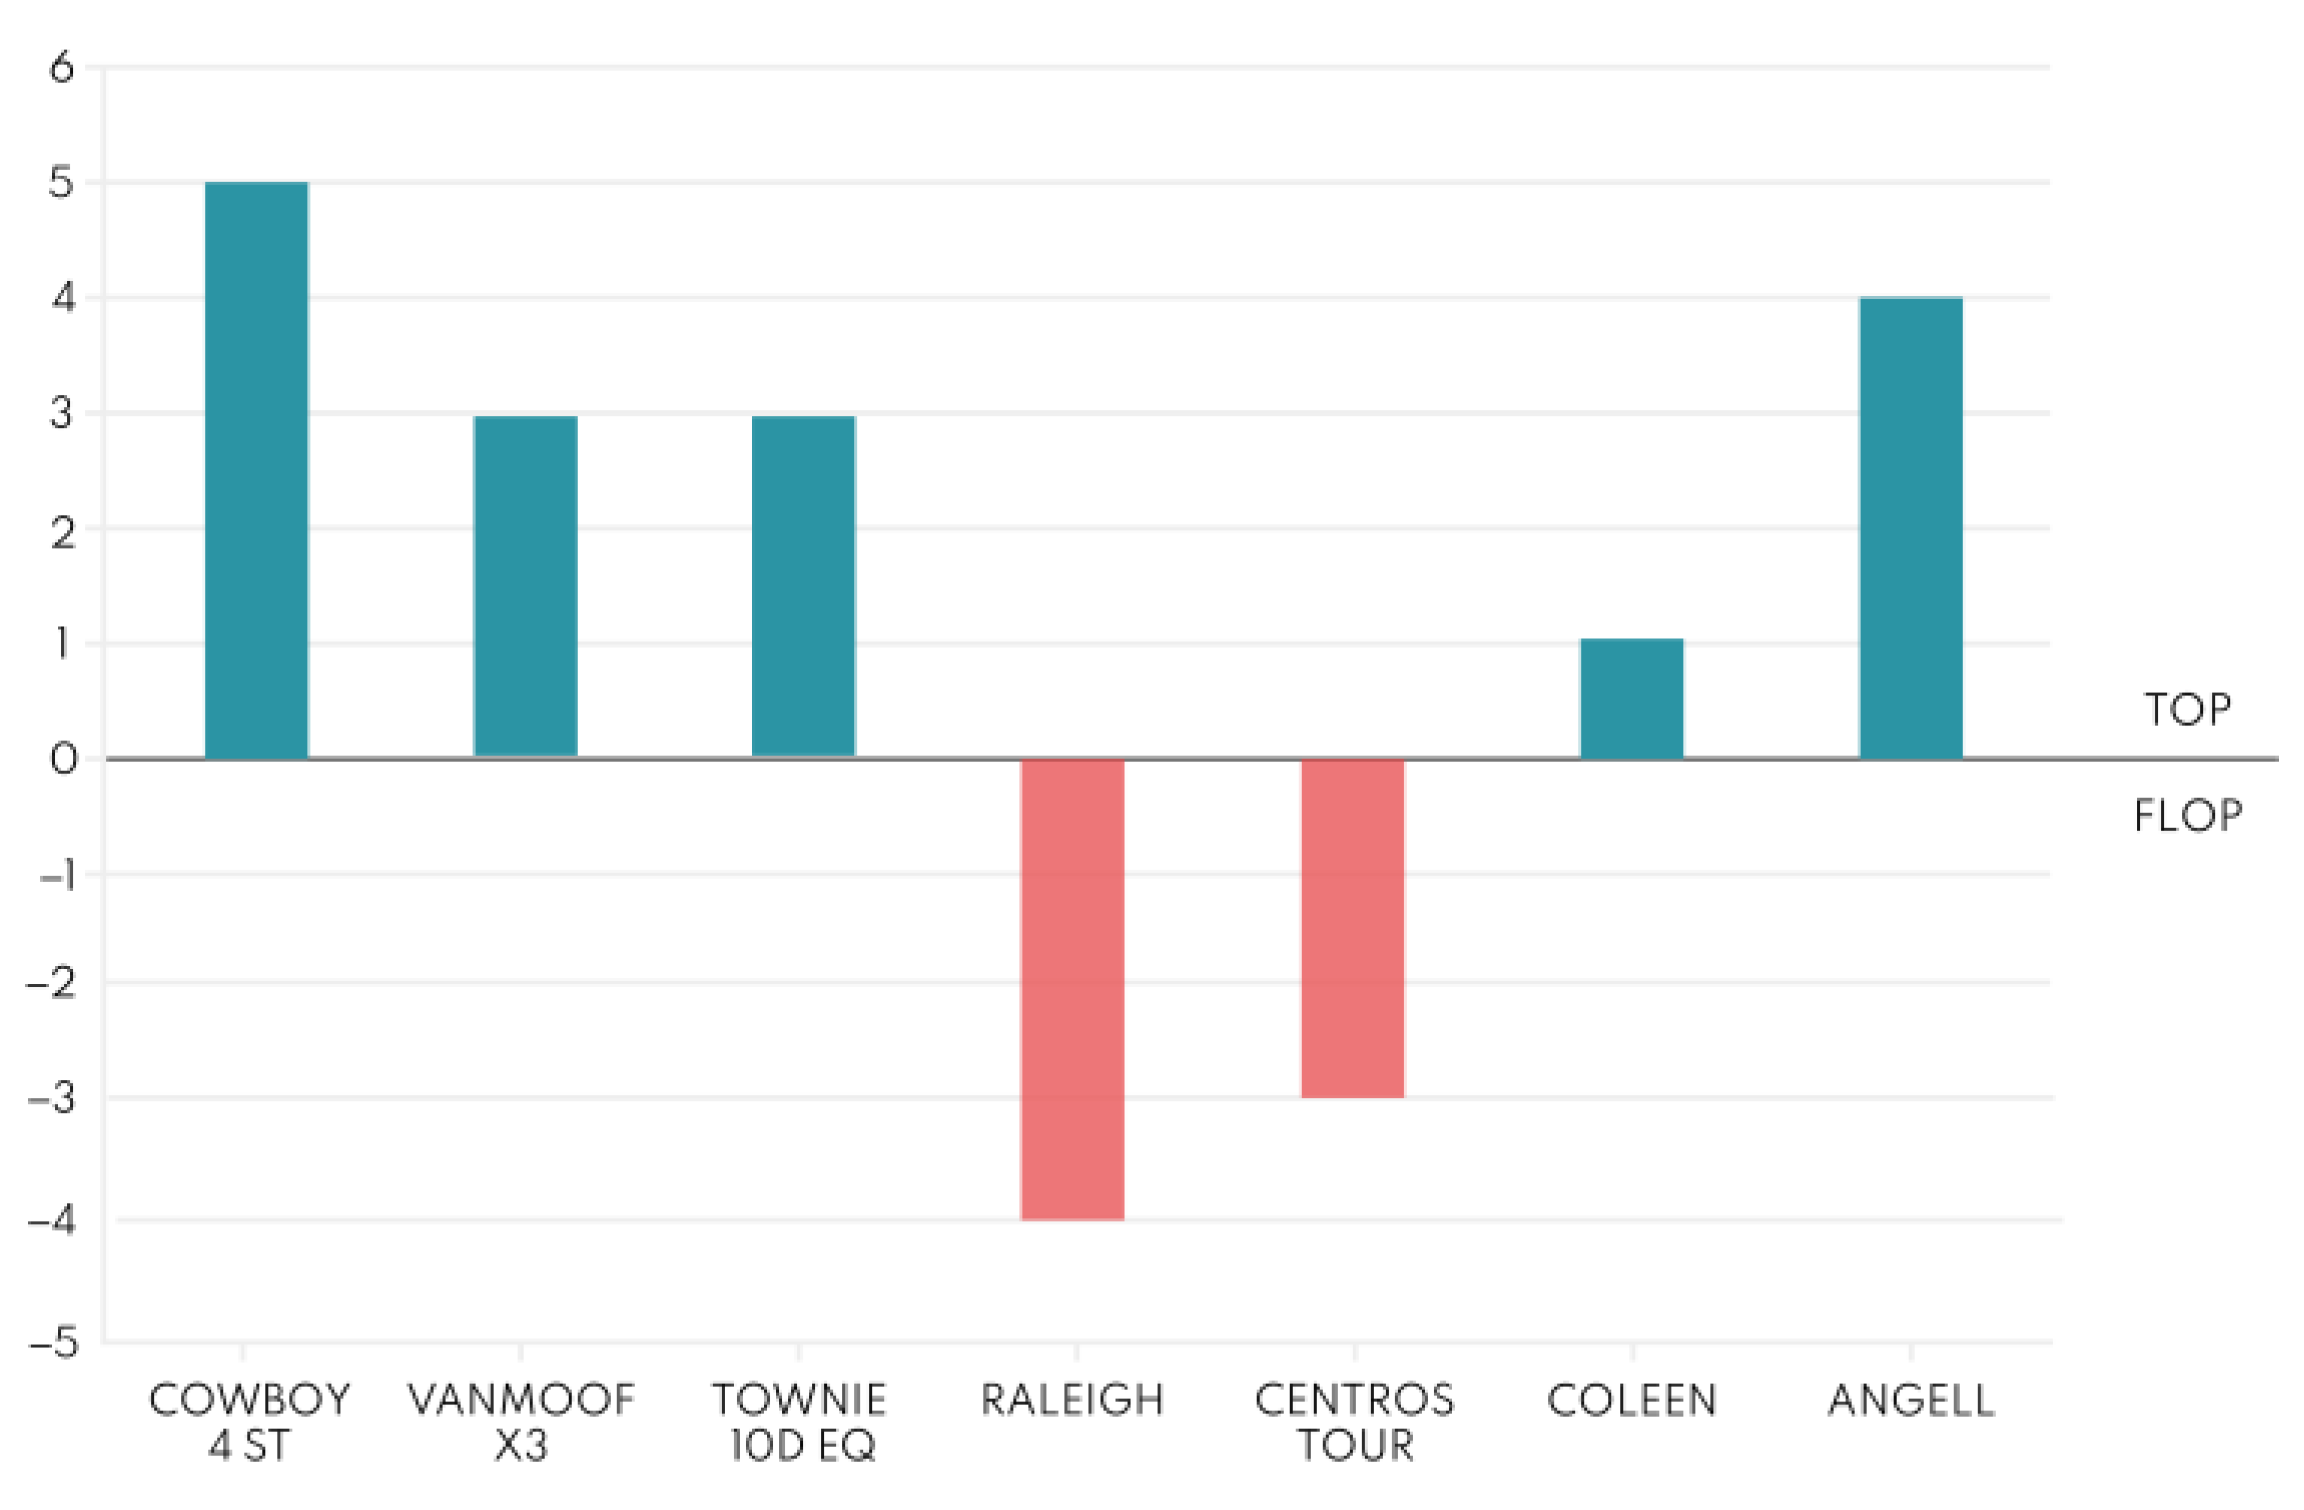
| TOP | 7 | 8 | 6 | 3 | 4 | 6 | 8 | |
| FLOP | 3 | 4 | 2 | 8 | 6 | 4 | 3 | |
| ∆ | 4 | 4 | 4 | −5 | −2 | 2 | 5 | >6 |
| Eswing ES | My Happy M2 | Ninebot KickScooter MAX G30E | Mi Electric Scooter Pro 2 | Urbetter S1 PRO | Ninebot KickScooter F40E | PRO-II EVO | INNOVATION | |
|---|---|---|---|---|---|---|---|---|
| Length | 1045 mm | 1150 mm | 1167 mm | 1130 mm | 1050 mm | 1143 mm | 1195 mm | <1045 mm |
| Height | 1170 mm | 1160 mm | 1203 mm | 1180 mm | 1160 mm | 1160 mm | 1169 mm | <1160 mm |
| Width | 465 mm | 470 mm | 472 mm | 430 mm | 450 mm | 480 mm | 480 mm | <430 mm |
| Height when closed | 497 mm | 480 mm | 534 mm | 490 mm | 330 mm | 495 mm | 510 mm | <330 mm |
| Adjustable | Yes | No | No | No | Yes | No | No | Yes |
| Weight | 21.7 kg | 18 kg | 19.1 kg | 14.2 kg | 11 kg | 17.1 kg | 16.7 kg | <11 kg |
| Wheel | 8.5“ | 10“ | 10“ | 8.5“ | 8“ | 10“ | 10″ | >10“ |
| Wheel type | Tubeless | Tubeless | Tubeless | Honeycomb | Honeycomb | Tubeless | Tubeless | Honeycomb |
| Battery | Lithium 48V | Lithium 48V | Lithium 36 V | Lithium 36 V | Lithium 36 V | Lithium 36 V | Lithium 36 V | >48 V |
| Replaceable battery | No | No | No | No | No | No | No | Yes |
| Brake | Discs | Double disk | Electronic and drum | Electronic and disk | Discs | Electronic and disk | Electronic and disk | Electronic and disk |
| Engine | 450 W | 500 W | 350 W | 300 W | 350 W | 350 W | 350 W | ≥500 W |
| Charge time | 6 h | 4.5 h | 6 h | 8.5 h | 4 h | 6.5 h | 7 h | <4 h |
| Maximum speed | 35 km/h | 40 km/h | 25 km/h | 25 km/h | 30 km/h | 25 km/h | 25 km/h | <25 km/h |
| Battery life | 30 km | 50 km | 65 km | 45 km | 30 km | 40 km | 40 km | >65 km |
| Payload | 110 kg | 125 kg | 100 kg | 100 kg | 120 kg | 120 Kg | 100 kg | >125 kg |
| Price | 850 € | 785 € | 879 € | 550 € | 300 € | 600 € | 679 € | <300 € |
| Chassis | Aluminium | Aluminium | Steel and Carbon | Aluminium | Aluminium | Steel and Carbon | Magnesium alloy | Aluminium |
| Suspension | / | Front and rear | / | / | Front and rear | / | Front and rear | Front and rear |
| Bluetooth | No | Yes | Yes | Yes | No | Yes | Yes | Yes |
| Dedicated app | No | No | No | Yes | No | No | Yes | Yes |
| Maximum slope | 20° | 18° | 20° | 20° | 15° | 20° | 18° | ≥20° |
| Display | LED | LED | LED | LED | LCD | LED | LED | LED |
| Resistance to water | IPX5 | IPX4 | IPX5 | IP54 | IP54 | IPX5 | IPX4 | ≥IP54 |
| Cruise control | No | Yes | No | Yes | Yes | No | Yes | Yes |
| TOP | 6 | 10 | 6 | 11 | 11 | 7 | 8 | |
| FLOP | 8 | 5 | 11 | 6 | 8 | 7 | 5 | |
| Δ | −2 | 5 | −5 | 5 | 3 | 0 | 3 | ≥6 |
| Dimensions | Battery Life | Weight | Number of Seats | Maximum Speed | Luggage Rack/Trunk | Charge Time | Replaceable Battery | Driving License Needed | Price | |
|---|---|---|---|---|---|---|---|---|---|---|
| Economical | 6 | 4 | 2 | 2 | 2 | 0 | 6 | 4 | 0 | 10 |
| Autonomous | 6 | 10 | 6 | 0 | 8 | 0 | 0 | 6 | 0 | 4 |
| Waiting time | 8 | 6 | 0 | 4 | 8 | 0 | 10 | 10 | 0 | 0 |
| Available | 0 | 6 | 0 | 4 | 4 | 0 | 6 | 4 | 0 | 0 |
| Widespread | 10 | 8 | 0 | 0 | 0 | 0 | 6 | 0 | 2 | 0 |
| Practical | 10 | 8 | 8 | 6 | 4 | 8 | 10 | 10 | 6 | 0 |
| Inclusive | 6 | 0 | 0 | 2 | 0 | 6 | 0 | 0 | 10 | 6 |
| Compact | 10 | 6 | 0 | 8 | 2 | 6 | 6 | 4 | 0 | 4 |
| Spacious | 10 | 0 | 0 | 10 | 0 | 10 | 0 | 0 | 0 | 2 |
| Sustainable | 4 | 0 | 0 | 0 | 0 | 0 | 4 | 6 | 0 | 8 |
| Total | 70 | 48 | 16 | 36 | 28 | 30 | 48 | 44 | 18 | 34 |
| CITROËN AMI | RENAULT TWIZY E-TECH ELECTRIC | TAZZARI ZERO CITY | XEV YOYO | MICROLINO | AVERAGE MASS | |
|---|---|---|---|---|---|---|
| Weight [kg] | 490 | 446 | 650 | 850 | 513 | 589.8 |
| Mass [Kg] | Centre of Gravity [m] | |
|---|---|---|
| Frame | 138.6 | 0.15 |
| Propulsion | 198.8 | 0.18 |
| Electrical | 23.0 | 0.2 |
| Trim | 98.5 | 0.6 |
| Car body | 128.6 | 1.05 |
| Fluids | 2.9 | 0.18 |
| One person | 80 | 1 |
| Two people | 160 | 1 |
| Wheelchair user | 260 | 0.5 |
| One Person | Two People | Wheelchair User | |
|---|---|---|---|
| Total mass of the vehicle [kg] | 590 | 590 | 590 |
| Wheel track [m] | 1.6 | 1.6 | 1.6 |
| Total centre of gravity [m] | 0.50 | 0.55 | 0.45 |
| Total mass [kg] | 670.4 | 750.4 | 850.4 |
| Maximum faceable side slope [°] | 58 | 55 | 60 |
Disclaimer/Publisher’s Note: The statements, opinions and data contained in all publications are solely those of the individual author(s) and contributor(s) and not of MDPI and/or the editor(s). MDPI and/or the editor(s) disclaim responsibility for any injury to people or property resulting from any ideas, methods, instructions or products referred to in the content. |
© 2023 by the authors. Licensee MDPI, Basel, Switzerland. This article is an open access article distributed under the terms and conditions of the Creative Commons Attribution (CC BY) license (https://creativecommons.org/licenses/by/4.0/).
Share and Cite
Frizziero, L.; Galiè, G.; Aldrovandi, M.; Franco, S.; Rana, E. Design of an Autonomous, Sustainable Sharing Mobility Solution Aimed to Mobility-Disabled Individuals. Inventions 2023, 8, 44. https://doi.org/10.3390/inventions8010044
Frizziero L, Galiè G, Aldrovandi M, Franco S, Rana E. Design of an Autonomous, Sustainable Sharing Mobility Solution Aimed to Mobility-Disabled Individuals. Inventions. 2023; 8(1):44. https://doi.org/10.3390/inventions8010044
Chicago/Turabian StyleFrizziero, Leonardo, Giulio Galiè, Martina Aldrovandi, Silvia Franco, and Elisa Rana. 2023. "Design of an Autonomous, Sustainable Sharing Mobility Solution Aimed to Mobility-Disabled Individuals" Inventions 8, no. 1: 44. https://doi.org/10.3390/inventions8010044
APA StyleFrizziero, L., Galiè, G., Aldrovandi, M., Franco, S., & Rana, E. (2023). Design of an Autonomous, Sustainable Sharing Mobility Solution Aimed to Mobility-Disabled Individuals. Inventions, 8(1), 44. https://doi.org/10.3390/inventions8010044