Abstract
In this article, experimental results from the testing of four representative scale models of hydro-reactor profiled channels, which create a net head to promote the extraction of hydroelectric power from currents, are presented. The tested scale models include a narrower intermediate channel section of 300 mm diameter. The different profile models studied include an inlet compression chamber and an outlet depression chamber. A net head is created by the difference in pressure, with the head being higher the narrower channel’s zone than in the kinetic head of the outside stream velocity. Because there were no laboratory premises to test the constructed duct model sizes and to easily change the imposed steady current velocity, the experimental tests were performed by dragging the immersed models, attached to a raft in motion, in a place of steady water (the bay of a port). With this methodology, the same effect was obtained, making it possible to perform the testing for several current velocities (velocity of the raft relative to the steady water). Tests on free-flow to compare the difference in kinetic heads were performed. Furthermore, three loads obstructing different percentages of the channel’s narrower section were inserted to analyze the duct channel obstruction limits. The experimental results are validated by numerical results from finite element analysis.
1. Introduction
Several technologies using duct-free hydro-kinetic turbines for the extraction of hydroelectric power from currents have been conceived. An underwater apparatus containing two hydrodynamically shaped stabilizer wings with hydrokinetic impellers driven by pumped flow transmission creates two electrical generators which extract hydroelectric power from steady ocean currents [1]. A system with several submerged hydrokinetic impellers driven by ocean currents, suspended by cables connecting buoys to anchors at the bottom, can produce hydrogen through water electrolysis [2]. A system with a couple of submerged hydrokinetic marine turbines mounted on a mono-piled support structure can use a hydraulic speed-increasing transmission system to drive electrical generators [3]. A floating system with a submerged tower frame comprising multiple towers with hydrokinetic turbines anchored to the ocean floor can be used for reverse osmosis and freshwater production from steady or tidal currents [4]. A floating buoy sustaining a spar current/tidal turbine with yaw anchored to the seabed may also be used [5]. The hydrodynamic characterization of a Garman-type hydrokinetic turbine determining the rotation speed and torque depending on shaft angle was performed in [6].
In the last 20 years, the interest in technologies using hydrokinetic turbines inside ducts to augment the flow head has increased, and several apparatuses using current turbines inside ducts were conceived. These include the following: a power plant with a submerged platform fixed to the ocean floor by four tension legs supporting several housed turbines, with their housing presenting concentration, narrower, and diffusing zones [7]; a suction-augmented hydrokinetic turbine in an immersed multi-stage ducted rotary hydro-craft suspended by a buoy for converting the kinetic energy of canal or river flow into electrical power [8]; an ocean current turbine inside an augmented compression duct with two segment concentration zones [9]; a flow enhancement duct with a central inner hydrofoil ring hub for enhancing the flow through the current turbine [10]; an ocean current power generating apparatus using dual ducts with the boundary layer control effect [11]; a unidirectional hydro turbine comprising a duct with an oblong elevation, intake hoods and vents, aft diffuser cutouts, and an oblique face to optimize flow [12]; a sub-sea apparatus with a turbine having a plurality of hydrofoil blades in a cylindrical housing with guide vanes driven by currents [13]. An optimization model applied to hydrokinetic blades shrouded by a diffuser was also developed and studied [14].
Several conceptual duct-shape designs were analyzed in [15]. The numerical investigation of the augmentation effects for a Savonius hydrokinetic turbine inside a duct was studied in [16]. The performance of a helical Savonius hydrokinetic turbine with a new deflector system design was studied in [17]. Experimental and numerical studies on the performance of modified Savonius hydrokinetic turbines with varying duct angles were carried out in [18]. The performance of a straight-blade Darrieus hydrokinetic turbine inside a ducted augmentation system was investigated in [19]. Results from tests on ducted and bare helical and straight-blade Darrieus hydrokinetic turbines were presented in [20].
The author applied and obtained the granting of the patents [21,22,23,24], mentioned and detailed in Section 6, for technologies using cylindrical and planar hydro-reactor profiled ducts to promote the extraction of hydroelectric power from tidal and run-of-river currents. These ducts with a specific claimed profile create a notable net head, generating a flow with a significantly higher charge (energy per volume of fluid) than the stream. They present non-linear contours and are defined by an inlet zone of concentration and an outlet zone of augmented depression by diffusion of the inside flow and depletion of the outside flow. The flow head in the duct narrower zone is notably higher than the outside stream kinetic head. The adoption of this type of duct will increase the number of potential places where it would be possible to exploit hydroelectric power from currents. Planar shape ducts can be applied in shallow places, increasing the number of possible places where hydroelectric power could be extracted from currents [25]. Figure 1a,b presents the designs of a cylindrical duct with an axial flow impeller and a planar duct with a low-head water wheel.
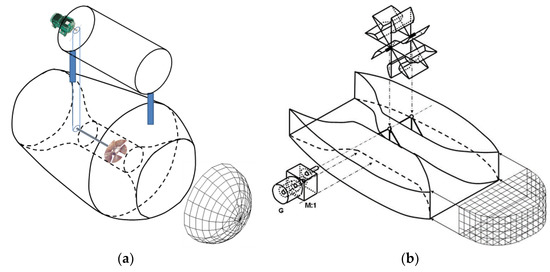
Figure 1.
Designs of a cylindrical duct with an axial flow impeller in (a) and a planar duct with a low-head water wheel in (b).
This document presents experimental and numerical results concerning the analysis of the net head that it is possible to create with hydro-reactor profiled ducts immersed in the streams, in addition to the kinetic head of the streams. The purpose of this study is to determine the net head that it is possible to create with the claimed hydro-reactor profiled ducts, and to compare the results with the ones obtained using simpler ducts with linear contours. Different duct scale models with a narrower channel diameter of 300 mm were experimentally tested. Figure 2a–d show dimensioned profiles of the four representative duct scale models analyzed and tested, named, respectively, as models D1, D2, D3, and D4. The two first models with linear contours imply higher charge losses by cavitation. The two last ones present non-linear contours to reduce cavitation and loss of charge. In model D1 there is no chamber in the outlet zone. Model D2 presents inlet and intermediate zones equal to model D1, but also contains a chamber at the outlet zone. Models D3 and D4 correspond, respectively, to the lower and higher concentration and diffusion limits of the claimed hydro-reactor profile. Points P1, P2, and P3 are located at the center, respectively, of the initial, middle, and ending sections of the channel’s narrower zone.
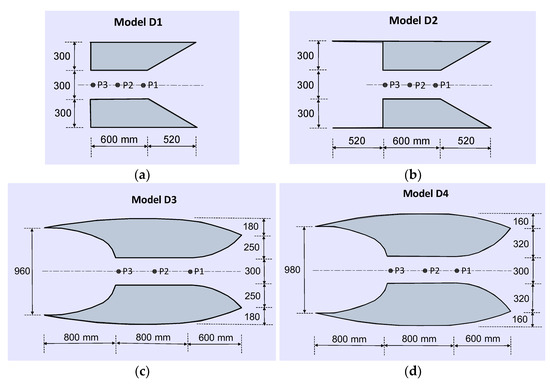
Figure 2.
Dimensioned profiles of the four representative duct scale models analyzed, as follows: D1 (a), D2 (b), D3 (c), and D4 (d).
The results from this study show the net head that it is possible to create with four different duct models and prove that the claimed hydro-reactor profile creates a significant net head. Section 2 describes the fluid dynamic models considered in numerical finite element simulations and the methodology used in the experimental testing of duct scale models. Results from the experimental testing and numerical simulation of the four studied duct scale models are presented in Section 3 and discussed in Section 4. Finally, the main conclusions are stated in Section 5.
2. Materials and Methods
2.1. Fluid Dynamics Modelling
The flow of Newtonian incompressible fluids [26,27] is traduced by the Navier-Stokes momentum equation in (1), as follows:
In the case of continuity of mass, the following Equation (2) is verified:
where is the fluid velocity, g the gravity acceleration, the fluid volumetric density, the dynamic fluid viscosity, and the pressure. In the case of incompressible fluids, there is no variation in the fluid density with time results, as in the following Equation (3):
For boundaries between fluids and solid domains, is applied the Dirichlet condition in that the fluid velocity normal component is zero. Equation (4) is as follows:
For boundaries between fluids, the continuity of the pressure normal component is expressed by the following Neumann boundary condition (5), where is the unit length vector normal to those boundaries:
The evaluation of laminar or turbulent regime is performed by estimating the Reynolds number given by the following Equation (6):
where is the average value of the flow velocity relative to an object, and a linear dimension defined by the relation between the volume of that object and the effective object section normal to . Turbulent regimes occur for values greater than [26,27]. The water has a density of about and a dynamic viscosity of about at 20 °C [28,29].
On a turbulent regime, the fluid velocity results from the sum of a mean velocity and a turbulent velocity term u′, as follows:
Furthermore, the fluid pressure results from the sum of a mean pressure and a turbulent pressure , as follows:
The standard - turbulence model, which is derived from Reynolds-averaged Navier–Stokes (RANS) equations [30], was adopted to simulate turbulent regimes.
According to [30], the two governing equations of the standard RANS k- model are (9) and (10), as follows:
In this model, is the turbulent kinetic energy and the rate of dissipation of turbulent energy, which are, respectively, calculated according to the following Equations (11) and (12):
where is, according to Einstein’s notation, the intensity of the fluid’s turbulent velocity according to the space dimension , and is the fluid kinetic viscosity given by (13), as follows.
The water kinetic viscosity is then approximately equal to at 20 °C.
Variable is the fluid mean velocity and is the turbulent or Eddy viscosity calculated by (14), as follows:
Variable is the rate of production of turbulent kinetic energy, calculated by (15), as follows:
where is the intensity of fluid mean velocity according to the space dimension .
Typical values of equal to , equal to , equal to , equal to , and equal to 1.3, were adopted for the five parameters of the standard RANS - model [30].
2.2. Methodology Used to Test Scale Models
Duct scale models with a narrower channel diameter of were built to be tested. Figure 2a–d states all the dimensions of the four ducts built and tested. The model presenting a higher volume was model D4, with a maximum external diameter of and a length of . There were no laboratory premises to properly test such duct model sizes. Because of this reason and to easily change the imposed current velocity, the duct models of this size were tested by dragging them immersed, attached to a raft in motion, in a place of steady water (the bay of Peniche’s port in Portugal).
Several test sessions were carried out during the 18 months between February 2003 and August 2004 [31]. Between the test sessions, the testing platform integrating the raft and models stayed parked on a ramp at Peniche’s naval dockyards. During each testing session, there was an initial stage when the raft entered the water with the model attached at a higher-level (half-immersed). Then, the whole platform was approximated and tied to a quayside. With the platform tied, the duct descended and was attached to the raft at a lower level; it was immersed into water with the highest part about 0.5 m below the water’s surface. Then, after releasing the platform, tests were performed with the raft in motion at a velocity relative to the water, dragging the immersed models. Experimental measurements at several steady velocities were performed to obtain the characteristics of dependence from the outside current velocity. After performing tests, the platform was approximated and tied again to the quayside by moving it up and tying again the duct at a higher-level (half-immersed). Then, the platform returned and was parked again at the ramp at the naval dockyard, where the replacement of duct models and preparation of equipment for the next testing session was carried out.
Figure 3a,b show, respectively, the front and backward views of the raft with the duct scale model at a higher level at the naval dockyard ramp. Figure 4a shows the lateral view of the platform with the raft and the duct scale model at the naval dockyard ramp. Figure 4b shows the platform entering the water or arriving at the naval dockyard ramp.
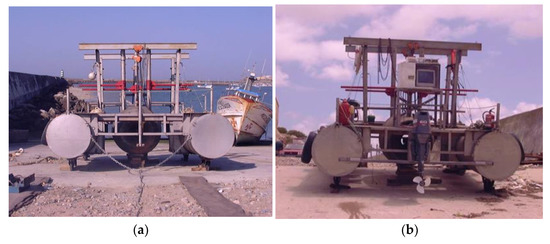
Figure 3.
Front (a) and backward (b) views of the raft with the duct scale model D3 at a higher level at the naval dockyard ramp.
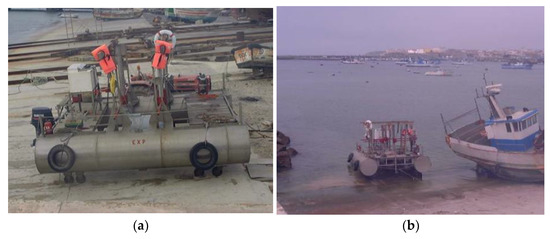
Figure 4.
(a) Lateral view of the platform with the raft and the duct scale model D2 at the naval dockyard ramp and (b) image of the platform entering water or arriving at the dockyard ramp.
Figure 5a,b show duct scale models D2 and D4 at the higher level partially immersed in the water when the platform was tied to the quayside. Figure 6a,b show duct scale models D2 and D4 at the lower level immersed in water with the highest part about below the water surface when the platform was tied to the quayside. Figure 7a,b show when duct scale models D3 and D4 were fixed at the lower level with the highest part at about below the water surface.
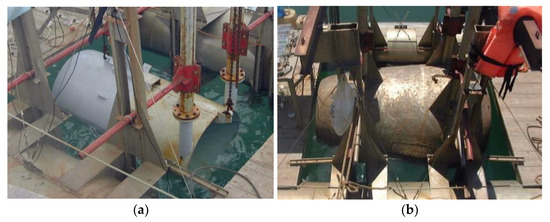
Figure 5.
The duct scale models D2 (a) and D4 (b) at the higher level (partially immersed in the water) when the platform was tied to the quayside.

Figure 6.
The duct scale models D2 (a) and D4 (b) at the lower level (totally immersed in the water) with the highest part about 0.5 m below the water surface, when the platform was tied to the quayside.

Figure 7.
The duct scale models D3 (a) and D4 (b) fixation at the lower level with the highest part about below the water surface.
Figure 8a,b show the raft in motion during the testing, respectively, of models D3 and D4. Figure 9a shows duct scale model D3 dragged immersed by the raft in motion. Figure 9b shows the scaled planar profile of duct model D3 dragged immersed by the raft in motion. As one may verify from this last figure, the creation of a net head is notable, with the water height at the duct inlet higher than at the outlet.

Figure 8.
The raft in motion during the testing of scale models D3 (a) and D4 (b).

Figure 9.
Duct scale model D3 dragged immersed by the raft in motion (a); the scaled planar profile of duct model D3 dragged immersed by the raft in motion (b).
Experimental tests on the free-flow condition, i.e., with no obstruction in the channel’s narrower zone, were performed. In this case, the flow velocity in point P1 was measured to calculate the kinetic head in this location and to compare it with the outside stream kinetic head. The outside current velocity (raft velocity with relation to water) was measured at the middle of the raft’s front edge, about before the duct scale model entrance section.
Tests with mechanical resistances located at point P2, at half the distance between points P1 and P3, were also performed. Three mechanical resistances, namely R1, R2, and R3, were used, and obstructed, respectively, , and of the channel’s narrower section. Figure 10a–c show, respectively, the mechanical resistances R1, R2, and R3. In this second case, experimental measurements of flow velocity and the transversal pressure at point P1 were performed.
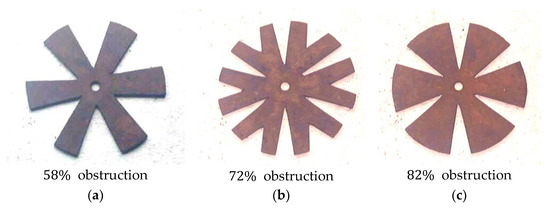
Figure 10.
Mechanical resistances R1 (a), R2 (b), and R3 (c) were used in the tests with obstruction.
For flow and stream velocity measurements, two NAVICO-CORUS TXD300 paddlewheel water velocity transducers, as shown in Figure 11a, were used. These were connected via NMEA600 interfaces to CORUS multi-data digital displays C400M. Figure 11b shows the OMEGA PX212-030GV pressure transducer used for pressure measurements mounted on a holding rod. This pressure transducer with output signal voltages ranging from to can read pressures up to (). It was connected to the PAXI-1/8 six-digit digital counter display from RED LION controls. Figure 11c shows the hanger H that holds the water velocity transducer at point P1. This hanger H includes a sleeve S with a screw to hold and fix the rod of the pressure transducer for measuring the transversal pressure in the radial direction at point P1.
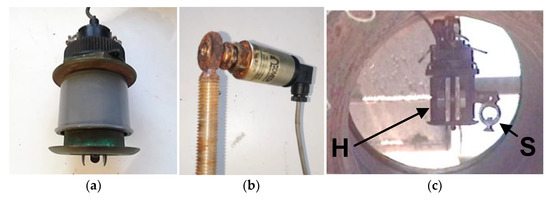
Figure 11.
The NAVICO-CORUS TXD300 paddlewheel water velocity transducer used in this study (a); the OMEGA PX212-030GV pressure transducer used in this study mounted on the holding rod (b); detail of the hanger H holding the water velocity transducer including a sleeve S with a screw to hold and fix the pressure transducer rod, at point P1 (c).
Figure 12a indicates the position of the water velocity transducer to measure the velocity of the raft relative to the water (equivalent to the outside current velocity). This transducer was positioned about 30 cm below the water’s surface. In this figure, the duct scale model D4 is at the highest level (partially immersed in water). Figure 12b shows a photo of the two water velocity transducers, taken when the system was on the ramp outside of the water, with the duct scale model D4 also at the highest level. One velocity transducer was used to measure the outside current velocity (raft velocity with relation to water), and the other was used to measure the flow velocity at point P1 at the initial section of the narrower channel’s zone.
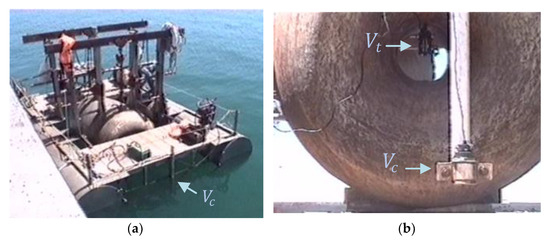
Figure 12.
Detail of the water velocity transducer position to measure the raft velocity in relation to the water (a); photo of the two water velocity transducers, with the duct scale model D4 the outside water at the higher level (b).
During the measurements with models D3 and D4 completely immersed in water, the sensors at point P1 ran, respectively, about and below the water, while the velocity transducer located at the middle of the raft front edge was immersed at about below the water level. This is because with the models completely immersed, the less deep point of the model’s top surface was about below the water surface, and according to Figure 2a,b, the highest radius of D3 and D4 is, respectively, 580 mm and 630 mm.
3. Results
Experimental measurements are validated by numerical results from the finite element analysis (FEA) in Section 3.1 for the free-flow condition case. In Section 3.2, the results from measurements with partial obstruction of the channel’s narrower zone are presented.
3.1. Results in the Free-Flow Condition
The flow velocity distribution obtained by 2D FEA for duct scale models D1, D2, D3, and D4 is represented, respectively, in Figure 13a,b and Figure 14a,b.

Figure 13.
Flow velocity distribution by 2D FEA for duct scale models D1 (a), and D2 (b).

Figure 14.
Flow velocity distribution by 2D FEA for duct scale models D3 (a) and D4 (b).
The presented distributions refer to a Dirichlet boundary condition, with a flow velocity normal to the right (inlet) and left (outlet) limit side boundaries of .
In Figure 15a–d, the ratio between the flow velocity in point P1 at the initial section of the channel’s narrower zone and the outside current velocity (raft velocity relatively to the water), obtained from experimental measurements and by 2D FEA, are compared, respectively, for all four duct models. Furthermore, the created net head calculated by (16) from experimental measurements and 2D FEA predictions of current and flow velocities are compared. The relative pressure to the outside reference of , is close to zero in point P1 for the free-flow condition. Equation (16) is as follows:

Figure 15.
Ratio and from experimental and FEA results for models D1 (a), D2 (b), D3 (c), and D4 (d).
The calculated net head corresponds to the difference in the available head at point P1 in the initial section of the channel’s narrower zone and the kinetic head of the outside current velocity at the water surface where the pressure is near .
The monotony of the experimental characteristics follows the ones obtained from 2D FEA results. The values of the ratio and of the created net head , increase from duct models D1 to D4, with model D4 creating a higher net head.
In model D1, the channel ends with an abrupt cut where there is a zone of discontinuity between the inside flow and outside current charges, and turbulence is created, causing energy losses. In model D2, there is an outlet zone of diffusion where the inside flow streamlines end in vortexes, because the kinetic head of the inside flow in the channel’s narrower zone is augmented. In models D1 and D2, turbulence is also created outside the duct, due to a sharp cut of the flow at the inlet section. In this zone, the outside surrounding stream loses charge. Models D3 and D4 also present an outlet zone of diffusion. In these two models, the duct external surface is curvilinear to avoid loss of charge in the outside surrounding stream and promote depletion of the outside stream at the duct outlet section, thus, promoting the creation of a suction effect with augmentation of vortexes in the outlet diffusion zone. In model D4, this effect is higher than in model D3.
Model D4 presents a higher ratio and creates a higher net head . From experimental measurements, the ratio obtained with model D4 is about , generating a net head of about 0.19 m for a current of (). From 2D FEA analysis, the obtained ratio with this model is about , generating a net head of about for a current of (). The main reason that the numerical results are better than the experimental results is because the paddlewheel flow velocity transducer obstructed about of the narrower channel’s section.
Figure 16a–d show, respectively, for the duct models D1 to D4, the characteristic ) obtained at points P1, P2, and P3. These figures also show the characteristics from experimental measurements at point P1. As one may verify, the flow velocity in P2 and P3 is higher than in P1, with an increase of about .
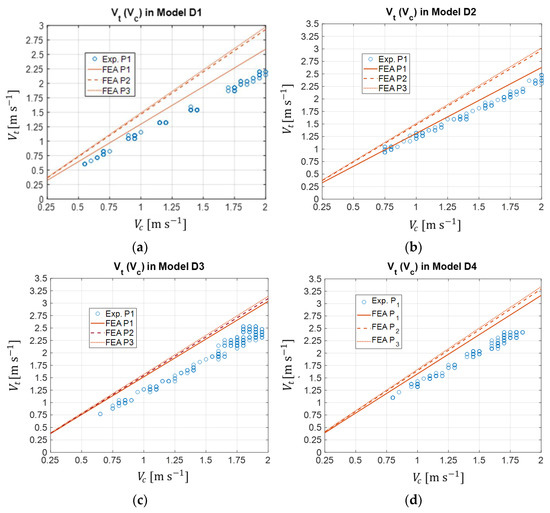
Figure 16.
Characteristic ) in points P1, P2, and P3 for duct models D1 (a), D2 (b), D3 (c), and D4 (d).
Figure 17 compares the four duct models in terms of the characteristic ) at point P1, as obtained by 2D FEA. As one may verify, models D3 and D4 present higher ratios than models D1 and D2. This is because the loss of charge with models D3 and D4 is less than with models D1 and D2. Model D4 presents a higher ratio, thus, creating higher net head .
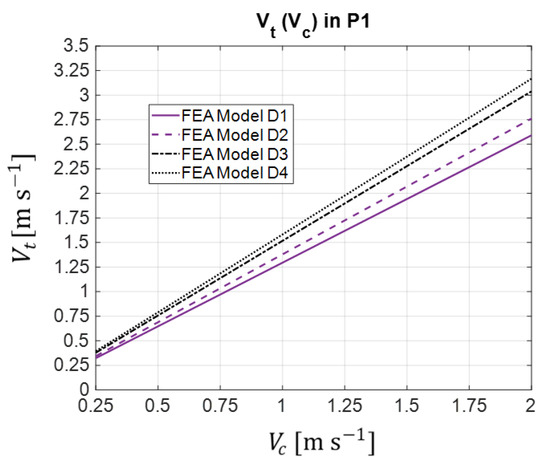
Figure 17.
Characteristic in P1, obtained by 2D FEA for models D1, D2, D3, and D4.
Figure 18a,b show, respectively, for models D3 and D4, the distribution of the relative pressure to the outside reference , in the free-flow condition, obtained by 2D FEA. The red and blue zones represent values higher and lower than the outside reference of , respectively. As one may observe, in the free-flow condition, the pressure at point P1 in the initial section of the channel’s narrower zone is almost . With model D4, the red is darker at the inlet and the blue is lighter at the outlet, proving that this model creates a higher net head.
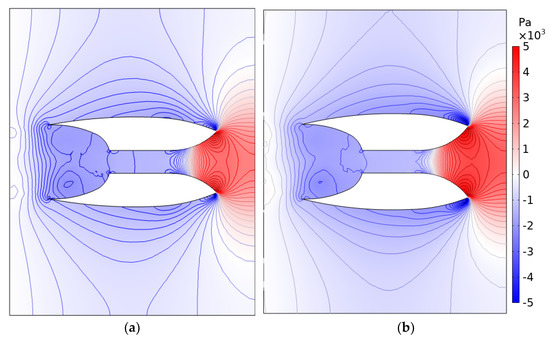
Figure 18.
Distribution of relative pressure to the outside reference , in the free-flow condition for models D3 (a), and D4 (b).
3.2. Results with Mechanical Resistances
Experimental tests were also performed with mechanical resistances obstructing a percentage of the channel’s narrower section, located at point P2 at half the distance between points P1 and P3. Three different mechanical resistances, namely R1, R2, and R3, obstructing, respectively, 58%, 72%, and 82% of the channel’s narrower section, were used. Measurements of the flow velocity and the transversal pressure at point P1 were performed.
Figure 19a,b show, respectively, for duct models D3 and D4, the characteristics of transversal relative pressure and obtained from measurements at point P1 with resistance R1 located at P2. Figure 20a,b refer to the measurements with resistance R2, and Figure 21a,b refer to the measurements with resistance R3. As expected, the transversal relative pressure increases, and the ratio decreases with the increase in the percentage of the narrower channel’s section obstruction. Furthermore, the ratio is not constant as in the free-flow condition.

Figure 19.
Characteristics and with resistance R1, for models D3 (a) and D4 (b).
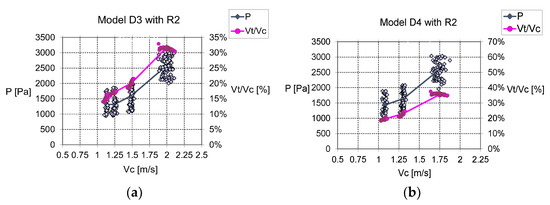
Figure 20.
Characteristics and with resistance R2, for models D3 (a) and D4 (b).
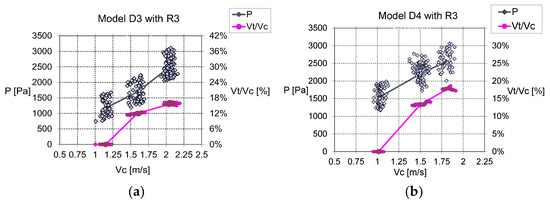
Figure 21.
Characteristics and with resistance R3, for models D3 (a) and D4 (b).
Table 1 reuses the values of and , and net head in the free-flow condition and with the three mechanical resistances in duct models D3 and D4 for the data sets corresponding to an outside current velocity of The resulting mechanical power calculated by the following Equation (17) is also stated:
where is the water density, is the gravity acceleration, and is the flow through the channel’s narrower zone, as calculated by the following Equation (18):
where is the velocity of the flow through the channel’s narrower zone, and is the channel’s narrower section. In the tested duct models, the channel’s narrower zone is cylindrical, with a constant diameter of assuming .

Table 1.
The effects of , , , and on free-flow and partial obstruction for Models D3 and D4, with .
For each raft velocity data set, the flow velocity measured at P1 remained almost the same. Otherwise, the pressure measured at point P1 before the mechanical resistances presented a notable standard deviation around the mean value . This variation is caused by the pressure variation in the diffusion zone and by the partial obstruction of the channel’s narrower section. From the standard deviation in pressure, was calculated as the deviation in the net head from the pressure contribution term in (16). Furthermore, the resulting deviation in mechanical power was determined by considering the calculated net head deviation using (17). From this equation, the mechanical power results from a product between the flow and the net head. Because for each raft velocity the verified flow was almost constant, the obtained error given by the relation between the deviations in the net head or mechanical power with relation to their mean values was the same. From the results, one verifies that the error associated with the variability in net head and available mechanical power decreases as the created net head increases, meaning that it is lower with duct model D4 than with model D3.
Although with such resistances, the flow velocity is less than the outside current velocity , there is a slight increase in transversal relative pressure, and the resultant net head calculated by (16) decreases slightly. Net head values close to and are verified with resistance R1 in duct models D3 and D4, respectively, for an outside current velocity of . These values are according to the ones resulting from experimental measurements in the free-flow condition, stated in Figure 15c,d. When a channel’s narrower section experiences an obstruction of about 58%, the verified net head is almost the same as in the free-flow condition. For higher channel obstruction percentages, a decrease in the verified net head is notable, because the tendency is to pass less flow through the channel. This results in a decrease in the available mechanical power with an increase in the channel obstruction percentage, as may be verified by the obtained results.
4. Discussion
This study aimed to determine the net head that it is possible to create with two duct scale models corresponding to the lower and higher compression/diffusion limit dimensions of the hydro-reactor profiled ducts claimed by the authors in the patents [21,22,23,24]. These are duct models D3 and D4, corresponding, respectively, to the lower and upper limit dimensions. These two models are compared in terms of the net head created in the free-flow condition with two simpler linear shape duct models that imply higher cavitation losses. These simple models are model D1, including only a compression zone, and model D2, including both a compression and diffusion zone.
The methodology used for testing these four models consisted of dragging them immersed in the water while attached to a platform in motion. With this method, it was possible to easily impose desired steady current velocities without the need for complex laboratory machinery. These correspond to the relative velocity of the platform to the water. The measurement of this velocity was carried out at a point ahead of the platform’s front edge middle, where the streamlines are not affected by the platform and duct hydrodynamics. During tests, the less deep point of the duct’s surface was about below the water surface. The same methodology can be used for the testing of other submerged duct types.
First, tests in the free-flow condition were performed to verify the ratio between the flow velocity in the channel’s narrower zone and the outside current velocity . Experimental results have shown that in the free-flow condition, the ratio between these two velocities is constant. This constancy was further verified by FEA simulation results. The ratio / obtained from FEA predictions was higher than the one from experimental measurements. One reason was that the flow velocity transducer obstructed about 10% of the narrower channel’s area. In the case of model D4, the ratio / obtained from FEA predictions was 158% and, from the experimental results, on average it was 140%. With model D3, the ratio obtained from the FEA was 152% and, from experimental results, it was, on average, 130%. These ratios are notably higher than the ones verified for models D1 and D2. From the FEA results, it was verified that in the free-flow condition, the predicted transversal pressure at the initial section of the channel’s narrower zone is about .
Tests with mechanical resistances obstructing the channel’s narrower zone were also performed. These were placed at an intermediate section in the middle of this zone. In this case, the transversal pressure, and the flow velocity at the initial section before the mechanical resistances were measured. The created net head was in this case calculated considering not only the flow velocity relatively to the current velocity , but also the relative transversal pressure to the verified at the water surface. Experimental results have shown that in the case of partial channel obstruction, the ratio / is not constant as in the free-flow condition. The created net head and available mechanical power tend to decrease with the increase in the channel obstruction percentage. This is because of the tendency to pass less flow through the channel.
With partial obstruction of the channel’s narrower zone, the available mechanical power presents oscillations even under steady current velocities. This is because, although the flow velocity is almost the same, there is a notable variation in the transversal pressure. This could result in variations in the torque and velocity of a low-head axial flow turbine placed in the middle of the channel’s narrower zone. The standard deviation of pressure and associated mechanical power error tend to decrease with the increase in the created net head, which is lower with model D4 than with model D3. Hence, the higher the system net head, the more regular the available mechanical power for steady current velocities would be.
5. Conclusions
In this study, four duct scale models with different profiles to create a net head and promote hydroelectric power from currents were experimentally tested and numerically analyzed by finite element analysis. Models D1 and D2 with rectilinear profiles and sharp edges presented higher charge losses than models D3 and D4 with a curvilinear profile. The existence of an outlet diffusion zone, where inside flow streamlines end in vortexes, generates the augmentation of the kinetic head of the flow in the narrower channel zone. The curvilinear profile of models D3 and D4 promotes a reduction in charge losses in the outside surrounding stream. Furthermore, the depletion of the outside streamlines at the duct outlet section creates a suction effect with augmentation of the vortexes in the outlet diffusion zone. This effect is higher in model D4 than in model D3. There is a limit in the outlet diffusion zone volume to avoid the creation of hydrostatic zones decreasing the suction effect.
Results have shown that in the free-flow condition, the ratio between the flow velocity through the channel’s narrower zone and the outside current velocity is almost constant for the typical current velocities. Duct model D4 is the one creating a higher net head. According to numerical finite element results, with duct model D4 in the free-flow condition, the ratio between the flow velocity in the channel’s narrower section and the outside current velocity is about 158%. This corresponds to the creation of a net head of about for a current of (). The average ratio obtained from the experimental measurements with model D4 was about . The results from experimental measurements were worst, mainly because the paddlewheel used to measure the flow speed obstructed about of the channel’s narrower section. For the free-flow condition, the relative pressure to the outside reference of is close to zero near the initial section of the narrower channel zone. Numerical results have shown that in the free-flow condition, the flow velocity from the middle to the end of this zone is about 15% higher than in the initial section.
When a channel’s narrower section experiences an obstruction of about , the verified net head keeps almost the same as in the free-flow condition. For higher channel obstruction percentages, there is a notable decrease in the verified net head, because the tendency is to pass less flow through the channel.
The results have also shown that with partial obstruction of the channel’s narrower zone, the flow velocity remains almost constant under steady current velocities, but there is a notable variation in the transversal pressure. This results in variations in the available power under steady current velocities. Furthermore, there is a decrease in the available mechanical power with the increase in channel obstruction percentage. Despite the verified power variability, such ducts create a significant net head, increasing the number of potential sites and promoting the extraction of hydropower from currents.
6. Patents
This study was performed to support the author’s priority patent in Portugal [21], patent in the United States [22], and European patent [23] concerning the use of cylindrical shape ducts ultra with a low-head axial flow turbine for places of deep water. Furthermore, it also supports European Patent [24] concerning the use of planar shape ducts with an ultra-low-head water wheel that could be used in places of shallow water. The inventions were recognized with gold medals at the international invention exhibitions in Nuremberg, Germany, in 2004, and Geneva, Switzerland, in 2005.
Author Contributions
A.J.A.d.S.C. contributed to the conceptualization; methodology, software, validation, formal analysis, investigation, experimental testing, writing—original draft preparation, writing—review and editing, project administration, and funding acquisition. L.A.d.S.C. contributed to the resources, visualization, supervision, and experimental testing. All authors have read and agreed to the published version of the manuscript.
Funding
Project No 40/00664 was approved in 2002, for intellectual property funds in the financing program POE-SIUPI, to support the construction and testing of prototype scale models. Projects No 109 approved in 1998, and No 146 approved in 2000, for intellectual property funds in the financing program PEDIP II, to support patent application, publication, examination, and maintenance fees.
Data Availability Statement
Not applicable.
Acknowledgments
Our thanks to the naval dockyards of Peniche (Estaleiros Navais de Peniche, SA), for their availability and support, offering a place on a ramp to park and keep the testing platform including the raft and duct scale models. Furthermore, our thanks to the maritime and town hall authorities of Peniche, for their permission to perform the experimental tests in the local town port.
Conflicts of Interest
The authors declare no conflict of interest.
References
- Bowley, W.W. Underwater Power Generator. U.S. Patent 4,383,182A, 10 May 1983. [Google Scholar]
- Pitts, T.H. Submerged Ocean Current Electrical Generator and Method for Hydrogen Production. U.S. Patent 4,850,190A, 25 July 1989. [Google Scholar]
- Fraenkel, P.L. Hydraulic Speed-Increasing Transmission for Water Current Powered Turbine. U.S. Patent 7,530,224B2, 12 May 2009. [Google Scholar]
- Dehlsen, J.G.P. Floating Tower Frame for Ocean Current Turbine System. U.S. Patent 9,334,849B2, 10 May 2016. [Google Scholar]
- Dehlsen, J.G.P. Floating, Yawing Spar Current/Tidal Turbine. U.S. Patent 9,506,451B2, 29 November 2016. [Google Scholar]
- Laín, S.; Contreras, L.T.; López, O.D. Hydrodynamic Characterisation of a Garman-Type Hydrokinetic Turbine. Fluids 2021, 6, 186. [Google Scholar] [CrossRef]
- Haining, M.L. Ocean Current Power Generator. U.S. Patent 5,440,176A, 8 August 1995. [Google Scholar]
- Ramsey, D.A. Suction-Augmented Hydropower Turbine. U.S. Patent 9,097,233B1, 4 August 2005. [Google Scholar]
- Guinard, P. Turbine Device for Generating Electricity from Ocean Currents. U.S. Patent D748,576S1, 2 February 2016. [Google Scholar]
- Stothers, R.; Grillos, E. Flow Enhancement for Underwater Turbine. U.S. Patent 7,874,788 B2, 25 January 2011. [Google Scholar]
- Kehr, Y.-Z. Ocean Current Power Generating Apparatus Using Dual-Duct with Boundary Layer Control Effect. U.S. Patent 9,488,155 B2, 8 November 2016. [Google Scholar]
- Sireli, E.M.; Platon, M.C.; Raychev, M.A. Unidirectional Hydro Turbine with Enhanced Duct, Blades and Generator. U.S. Patent 9,000,604B2, 7 April 2015. [Google Scholar]
- Davis, B.V.; Grillos, E.; Allison, S. Underwater Ducted Turbine. U.S. Patent 2,009,0243,300A1, 1 October 2009. [Google Scholar]
- Picanço, H.P.; Kleber Ferreira de Lima, A.; Dias do Rio Vaz DA, T.; Lins, E.F.; Pinheiro Vaz, J.R. Cavitation Inception on Hydrokinetic Turbine Blades Shrouded by Diffuser. Sustainability 2022, 14, 7067. [Google Scholar] [CrossRef]
- Zahedi Nejad, A.; Rad, M.; Khayat, M. Conceptual duct shape design for horizontal-axis hydrokinetic turbines. Sci. Iran. Trans. B Mech. Eng. 2016, 23, 2113–2124. [Google Scholar] [CrossRef]
- Kumar, D.; Sarkar, S. Numerical investigation of hydraulic load and stress induced in Savonius hydrokinetic turbine with the effects of augmentation techniques through fluid-structure interaction analysis. Energy 2016, 116, 609–618. [Google Scholar] [CrossRef]
- Mosbahi, M.; Ayadi, A.; Chouaibi, Y.; Driss, Z.; Tucciarelli, T. Performance study of a Helical Savonius hydrokinetic turbine with a new deflector system design. Energy Convers. Manag. 2019, 194, 55–74. [Google Scholar] [CrossRef]
- Nag, A.K.; ·Sarkar, S. Experimental and numerical study on the performance and flow pattern of different Savonius hydrokinetic turbines with varying duct angle. J. Ocean. Eng. Mar. Energy 2019, 6, 31–53. [Google Scholar] [CrossRef]
- Tunio, I.A.; Shah, M.A.; Hussain, T.; Harijan, K.; Mirjat, N.H.; Memon, A.H. Investigation of duct augmented system effect on the overall performance of straight blade Darrieus hydrokinetic turbine. Renew. Energy 2020, 153, 143–154. [Google Scholar] [CrossRef]
- Kirke, B.K. Tests on ducted and bare helical and straight blade Darrieus hydrokinetic turbines. Renew. Energy 2011, 36, 3013–3022. [Google Scholar] [CrossRef]
- Arsénio, A.J. Hidroreactor Destinado ao Aproveitamento da Energia Cinética da Água em Locais onde as Correntes Sejam Significativas para Produção de Energia Elétrica. Portugal Patent No. 102,088, 12 December 1997. [Google Scholar]
- Arsénio, A.J. Run-of-River Submerged Water Turbine. European Patent No. 0924,426B1, 4 August 2004. [Google Scholar]
- Arsénio, A.J. Hydroreactor to Take Advantage of the Kinetic Energy from the Water in Places Where the Streams Are Meaningful for the Production Electric Power. U.S. Patent 6,013,955A, 11 January 2000. [Google Scholar]
- Arsénio, A.J. Catamaran with Profiled Floats Supporting a Low Head Water Wheel, Serving Also as Bridge. European Patent No. 1,731,757B1, 26 January 2011. [Google Scholar]
- Todeschini, G. Review of Tidal Lagoon Technology and Opportunities for Integration within the UK Energy System. Inventions 2017, 2, 14. [Google Scholar] [CrossRef]
- Spurk, J.H.; Aksel, N. Fluid Mechanics, 2nd ed.; Springer: Berlin/Heidelberg, Germany, 2008; ISBN 978-3-540-73536-6. [Google Scholar]
- Munson, B.R.; Young, D.F.; Okiishi, T.H.; Huebsch, W.W. Fundamentals of Fluid Mechanics, 6th ed.; Wiley: Hoboken, NJ, USA, 2009; ISBN 978-0470-26284-9. [Google Scholar]
- Available online: https://www.engineeringtoolbox.com/water-density-specific-weight-d_595.html (accessed on 12 December 2022).
- Available online: https://www.engineeringtoolbox.com/absolute-dynamic-viscosity-water-d_575.html (accessed on 12 December 2022).
- De Bertodano, M.L.; Lahey, R.T.; Jones, C., Jr. Development of a k-ε Model for Bubbly Two-Phase Flow. Trans. Am. Soc. Mech. Eng. 1994, 116, 128–134. [Google Scholar] [CrossRef]
- António, J.; dos Santos Costa, A. Testing Scale Models of Hydroreactor Stream Accelerators—Experimental Results. In Proceedings of the 10th International Conference, Energy & Society, Lisbon, Portugal, 3–6 May 2004; ISBN ISBN 97288930000. [Google Scholar]
Disclaimer/Publisher’s Note: The statements, opinions and data contained in all publications are solely those of the individual author(s) and contributor(s) and not of MDPI and/or the editor(s). MDPI and/or the editor(s) disclaim responsibility for any injury to people or property resulting from any ideas, methods, instructions or products referred to in the content. |
© 2023 by the authors. Licensee MDPI, Basel, Switzerland. This article is an open access article distributed under the terms and conditions of the Creative Commons Attribution (CC BY) license (https://creativecommons.org/licenses/by/4.0/).