Article

PAHs, Physicochemical and Microbiological Analyses of Trout Processed by Traditional Smoking, in Different Types of Packaging

1
Department of Fundamental Sciences, University of Agricultural Sciences and Veterinary Medicine Cluj-Napoca, 3-5 Mănăştur Street, RO-400372 Cluj-Napoca, Romania
2
Department of Technological Sciences, University of Agricultural Sciences and Veterinary Medicine Cluj-Napoca, 3-5 Mănăştur Street, RO-400372 Cluj-Napoca, Romania
3
National Institute for Research and Development of Optoelectronics INOE 2000, Research Institute for Analytical Instrumentation, 67 Donath Str., RO-400293 Cluj-Napoca, Romania
4
Sociobiology and Insect Ecology Laboratory, Department of Taxonomy and Ecology, Faculty of Biology and Geology, Babes-Bolyai University, 44 Gheorghe Bilaşcu Street, RO-400015 Cluj-Napoca, Romania
5
Department of Plant Culture, University of Agricultural Sciences and Veterinary Medicine Cluj-Napoca, 3-5 Mănăştur Street, RO-400372 Cluj-Napoca, Romania
*
Authors to whom correspondence should be addressed.
Fishes 2023, 8(8), 424; https://doi.org/10.3390/fishes8080424
Submission received: 17 July 2023 / Revised: 16 August 2023 / Accepted: 17 August 2023 / Published: 19 August 2023
(This article belongs to the Special Issue Recent Advances in Aquaculture Production Technology)

Abstract

:
Smoking represents one of the oldest thermic processing methods of fish, and it was originally used to preserve fish for later meals, delaying spoiling. The objective of this study was to analyze the physicochemical and microbiological safety and quality of two traditionally smoked trout species (Oncorhynchus mykiss and Salvelinus fontinalis). We analyzed the effect of trout processed by traditional smoking, characterizing the samples according to the relationships existing between classical microbial analysis, physicochemical parameters, and the content of polycyclic aromatic hydrocarbons (PAHs). The microbial activity of the smoked fish was very low. Although traditional smoking implies high temperatures and direct exposure to the smoke, Benzo[a]pyrene, Benzo[b]fluoranthene, Benzo[k]fluoranthene, Dibenzo[a,h]anthracene, Benzo[g,h,i]perylene, and Indeno [1,2,3-cd]pyrene compounds had undetectable levels in the samples. The products obtained in this study did not exceed the maximum values imposed by EU legislation regarding the TVB-N values during the 30 days of the experiment. We conclude that traditionally smoked trout has many advantages in terms of quality and safety of the products. Thus, the obtained products are safe for consumption for at least 30 days after processing.
Key Contribution: The paper presents the chemical and biological changes of rainbow trout and brook trout processed using a traditional hot smoking technique, stored in different types of packaging. The traditional method does preserve the quality of the products for at least 30 days, regardless of the packaging method.

Graphical Abstract

1. Introduction

As the world population recently reached 8 billion people, the demand for fish is continuously increasing. While production from fisheries has reached its peak, it cannot increase further without irreversible effects on the environment and marine and freshwater biota. The solution could be farmed fish. Of freshwater fish, rainbow trout, Oncorhynchus mykiss (Walbaum, 1792), is one of the most appreciated fish for its taste and nutritional properties. It is relatively easy to farm, and its production has seen a consistent increase in recent years [1]. According to the Food and Agriculture Organization of the United Nations [2], rainbow trout production reached 739,500 tons in 2020, representing 1.5% of the world’s inland aquaculture production. Consumers have easier access to information, and aspects such as fish origin, farming systems, method of processing, and feed used, are important when selecting fish products [3], with traditional and eco-friendly uses being preferred.
Fish smoking represents one of the oldest thermic processing methods of fish. It was originally used to preserve fish for later meals, delaying spoiling [4]. Today, in addition to its preservation properties, the smoking process is also preferred for the specific taste and flavor conveyed to the fish, appreciated by consumers around the world [5]. A traditional food in Northern and Eastern Europe, smoked fish has also gained recent popularity in Western Europe. Poland is the largest producer of smoked fish, followed by the UK and Germany. Protected Geographical Indications (PGIs) allow consumers to select premium quality, traditionally smoked fish. Smoked fish PGIs can be found in many regions in Europe, including the UK (arbroath smokies—smoked haddock) or Romania (novacul afumat din Ţara Bârsei—smoked bighead carp from Bârsei Country; scrumbie de Dunăre afumată—smoked pontic shad) [6].
Smoked fish not only has convenient organoleptic properties but is also a source of polyunsaturated fatty acids (PUFAs), essential amino acids, minerals, and vitamins [7]. Moreover, some beneficial compounds, such as eicosapentaenoic acid (EPA) and docosahexaenoic acid (DHA), are not so easily oxidized, as smoke components have antioxidant properties [8]. Fish smoking, although it brings great benefits, also has some disadvantages. A major problem is the appearance of polycyclic aromatic hydrocarbons (PAHs) in smoked fish, through wood combustion. PAHs are a group of compounds sometimes viewed as pollutants [9], some being highly toxic, with links to cancers in humans [10,11]. The PAHs concentration may reach dangerous concentrations for humans in smoked fish [12,13]. PAHs formation is highly dependent on the temperature of the smoke generation. Typical fish smoking is either carried out cold (28–32 °C) or hot (70–80 °C). A temperature between 30–40 °C will produce lower concentrations of PAHs [14,15]. Traditional smoking, with hardwood, splinters, and/or sawdust, may be expected to produce high concentrations of PAHs [16,17]. Benzo[a]pyrene (BaP) is an example of a highly carcinogenic and mutagenic PAHs, being a marker of carcinogenic PAHs. The European Commission determined the maximum threshold of BaP in smoked fish at 5 µg/kg [18].
Thus, this study approaches the effects of traditional smoking on rainbow trout and brook trout, Salvelinus fontinalis (Mitchill, 1814), under different types of packaging for 30 days. The aim was to determine the physicochemical and microbiological characteristics, but also the content of PAHs in the obtained product. To our knowledge, this is one of the first studies that present the aforementioned characteristics of smoked brook trout.

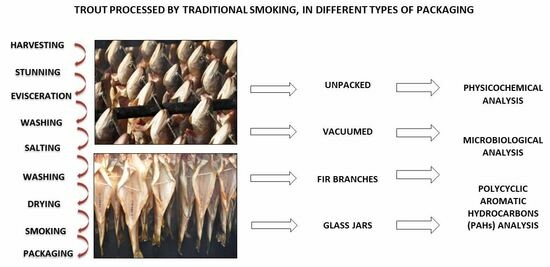
2. Materials and Methods

All procedures involving animals were conducted following Romanian [19] and European legislation [20]. The study was approved by the Animal Ethics Committee of the University of Agricultural Sciences and Veterinary Medicine Cluj-Napoca and followed all the bioethical rules and guidelines applicable to animal studies described by the Institutional Animal Ethics Committee (145/2019). The specimens used in the experiment were clinically healthy, to not interfere with the determination of the physicochemical, microbiological, and polycyclic aromatic hydrocarbon composition of the trout meat during the technical processes associated with traditional smoke preservation methods.

2.1. Fish and Experimental Protocol

The fish specimens used in this study were sampled from “Trecătoarea Ursului” trout farm, Râșnov City, Brașov County, Romania, and were represented by 100 specimens of traditionally whole smoked rainbow trout and 100 specimens of traditionally whole smoked brook trout, both being allochthonous species. The average weight of the smoked rainbow trout was 231.3 ± 0.73 g, and the average total length was 27.3 ± 0.58 cm. For smoked brook trout, the average weight was 216.77 ± 0.34, and the average total length was 26.88 ± 0.5 cm.
The technological flow used for traditional smoking of the trout specimens was conducted as follows: harvesting (using fishing nets), stunning (mechanical percussion stunning in the dorsal-aboral region of the head), evisceration (extraction of the organs and the peritoneum of the general cavity), washing (removal of mucositides and impurities adhering to the fish surface, elimination of viscera), salting (dry salting for 16 h, under refrigeration conditions, 2–4 °C) followed by another stage of washing (the amount of salt remaining on products is 3% maximum, determined by using the Mohr method [21]), drying (the washed fish is left to dry for up to 4 h). For the traditional smoking stage, the fuel used was made of a beech and cherry sawdust wood mixture, stifled, when necessary, with nettle and fir satin. Hot smoking at 70–85 °C (for a maximum of 2 h) was used. The smoked meat from specimens of each species was manually separated from fins, skin, and bones. Ten specimens were randomly selected from each species forming two lots of meat. The separated meat was homogenized per lot, macerated using a mortar and pestle, and used for further analyses. Each lot of meat was divided into four samples, followed by packaging in different types of packages and stored under refrigeration conditions at 2–4 °C. Whole smoked trout packaging consisted of unpacked, vacuumed, and in fir branches, while the trout packed in glass jars was cut into 2–3 large pieces.

2.2. Physicochemical Analysis

During the storage period, smoked samples of both fish species, differently packaged, were examined on day 0 (T0) immediately after smoking, day 10 (T10), day 20 (T20), and day 30 (T30).
The total nitrogen content was determined by the Kjeldahl method based on the standard method SR ISO 937:2007 [22], with the subsequent calculation of the protein content. Total lipids content was determined by the Soxhlet method based on the SR ISO 1444:2008 [23]. Moisture content was determined by the standard method SR ISO 1442:2010 [24]. The pH content was determined by the standard method SR ISO 2917:2007 [25]. Total volatile basic nitrogen (TVB-N) amounts from smoked samples were determined by the Lücke-Geidel method [26]. The quality classification of fish according to the TVB-N value was carried out according to the decision of the EU directive (95/149/EC) [27] establishing the limit values of TVB-N for certain categories of fishery products and the methods of analysis to be used.

2.3. Microbiological Analysis

The microbiological analyses consisted of bacterial counts, which are represented by Salmonella spp., Escherichia coli, Yersinia spp., Lysteria monocytogenes, and Total Aerobic Mesophilic Bacteria (TAMB). A sample of 25 g was aseptically taken from each sample, transferred to a stomacher bag, and 225 mL of sterilized peptone water was added. The mixture was homogenized for 2 min with a stomacher. Samples of 0.1 mL from smoked trout homogenates were spread on Plate Count Agar (BIOLAB Inc., Budapest, Hungary) and incubated at 37 °C for 48 h, for the TAMB count [28].
Salmonella spp. and L. monocytogenes were investigated according to ISO methods SR EN ISO 6579-1/2017 and SR EN ISO 11290-1:1997, respectively [29,30], and Yersinia spp. according to ISO method EN ISO 10273:2017 [31].
The E. coli count was made according to BS ISO 16649-2:2001 [32]. This technique involves the inoculation of a Petri dish and mixing of specified volumes of the sample or dilutions of the sample with a cooled molten selective culture medium containing 5-bromo-4-chloro-3-indolyl-ß-Dglucuronic acid (BCIG). Incubation was at 37 °C for 4 h followed by 44 °C for 21 h to allow for the selective growth of E. coli. The detection of E. coli colonies uses the chromogenic substrate BCIG to detect ß-glucuronidase activity through the generation of blue colonies. The number of colonies forming units (CFU) of β-glucuronidase-positive E. coli per gram (g) or per milliliter (mL) of the sample was calculated.

2.4. Polycyclic Aromatic Hydrocarbons (PAHs) Analysis

The content of 15 polycyclic aromatic hydrocarbons (PAHs) was determined: Naphthalene, Acenaphthene, Fluorene, Phenanthrene, Anthracene, Fluoranthene, Pyrene, Chrysene, Benzo[a]anthracene, Benzo[b]fluoranthene, Benzo[k]fluoranthene, Benzo[a]pyrene, Dibenzo[a,h]anthracene, Benzo[ghi]perylene, and Indeno[1,2,3-cd]pyrene.
To determine the content of PAHs in the traditionally smoked trout meat, the HPLC method was used according to ISO Method SR EN ISO 17993:2006 [33]. A Perkin Elmer 200 Series High-Performance Liquid Chromatograph (HPLC) with a FLD detector (PerkinElmer Inc., Waltham, MA, USA) with an Inertsil ODS-P 5 µm, 4.6 × 150 mm, kept at 24 °C was used. The mobile phase consisted of a gradient of water and acetonitrile and a time-programmed FLD detector used for the detection of the 15 PAHs. Ten grams of homogenized fish samples were saponified using a 50 mL KOH 0.4 M solution in ethanol and water (9:1) in an ultrasonic bath at 60 °C for 30 min. After filtration (on an ash-free cellulose filter), the samples were extracted twice using 15 mL hexane. The collected supernatant was then passed through a 1 g Florisil column (the column was washed with 15 mL hexane) and then concentrated in a stream of nitrogen. The sample was then redissolved in 1 mL of acetonitrile and injected into the HPLC system. All used solvents were HPLC grade from Merck (Merck KGaA, Darmstadt, Germany), the KOH (pellets), and Florisil (0.125–0.250 mm) from Supelco (Saint Louis, MO, USA) [33].

2.5. Statistical Analysis

Of all measured parameters, Benzo[b]fluoranthene, Benzo[k]fluoranthene, Benzo[a]pyrene, Dibenzo[a,h]anthracene, Benzo[g,h,i]perylene, Indeno[1,2,3-cd]pyrene, Yersinia spp., L. monocytogenes, and Salmonella spp. were not detected; therefore, all analyses were performed on the other parameters. Before performing all statistical analyses, we tested the normal distribution of all parameters with the help of an Shapiro-Test.
For each physicochemical parameter, we used an adequate statistical method for comparing samples between species and packaging types (unpacked, fir branches, vacuumed, and in glass jar). For protein, nitrogen, and TVB-N (which were normally distributed variables) content, we used an analysis of covariance (ANCOVA) with time as an independent variable and species as a factor, followed by a Tukey HSD post-hoc test, and a one-way ANOVA to test the effect of packaging type. For total lipids, moisture, and pH (which were not normally distributed variables), we used the Kruskal-Wallis test, followed by pairwise Wilcoxon tests to explain the effect of time and packaging type and a Wilcoxon test for the effect of species.
To identify whether some physicochemical parameters tend to be associated with the content of PAHs, and the number of microorganisms measured at the start of the experiment and after 30 days of storage, we performed a correlation analysis using the Spearman Rank method. All analyses were performed with the software RStudio Version 1.2.5042 [34]. Graphs were assembled with both RStudio and Microsoft Excel Version 18.2306.1061.0.

3. Results

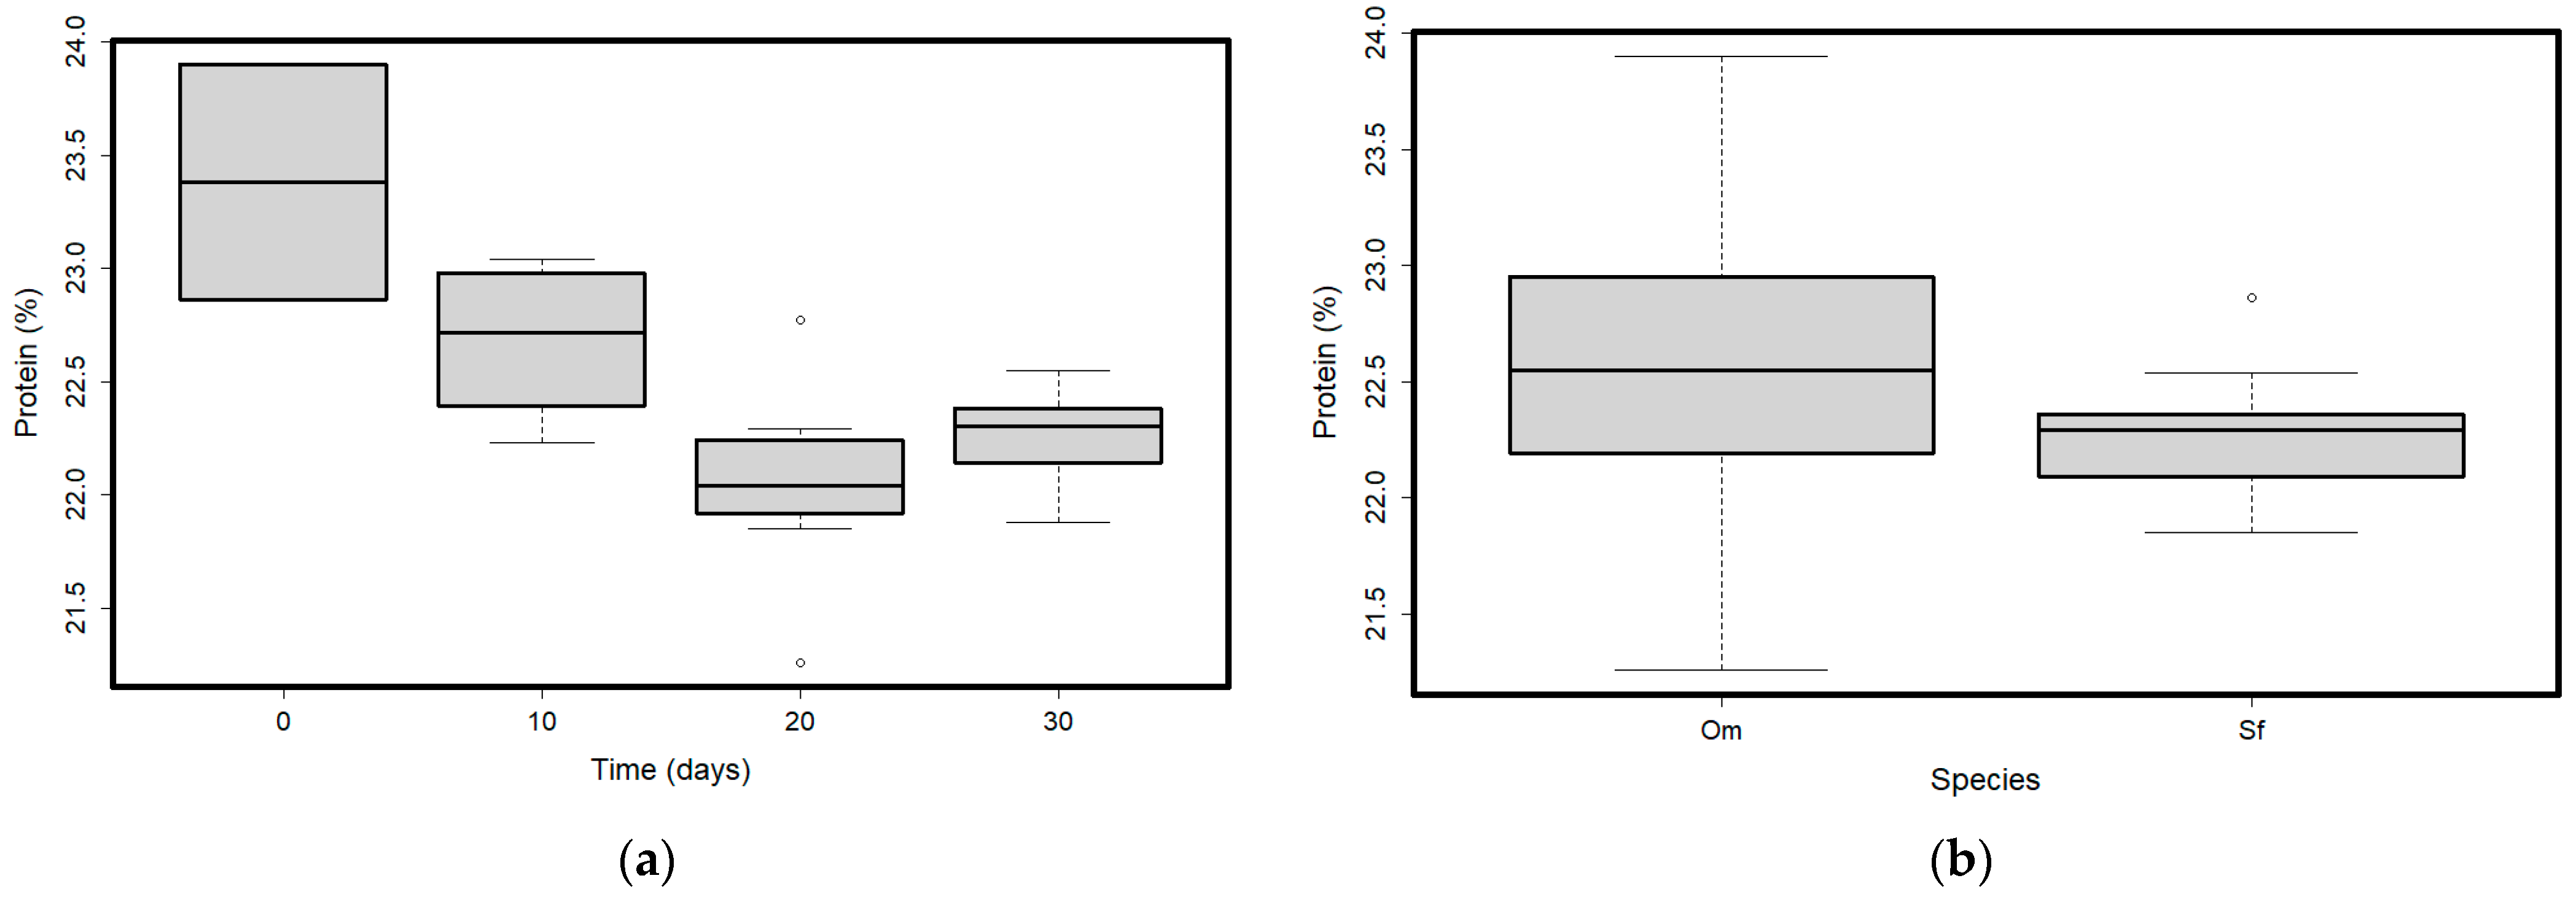
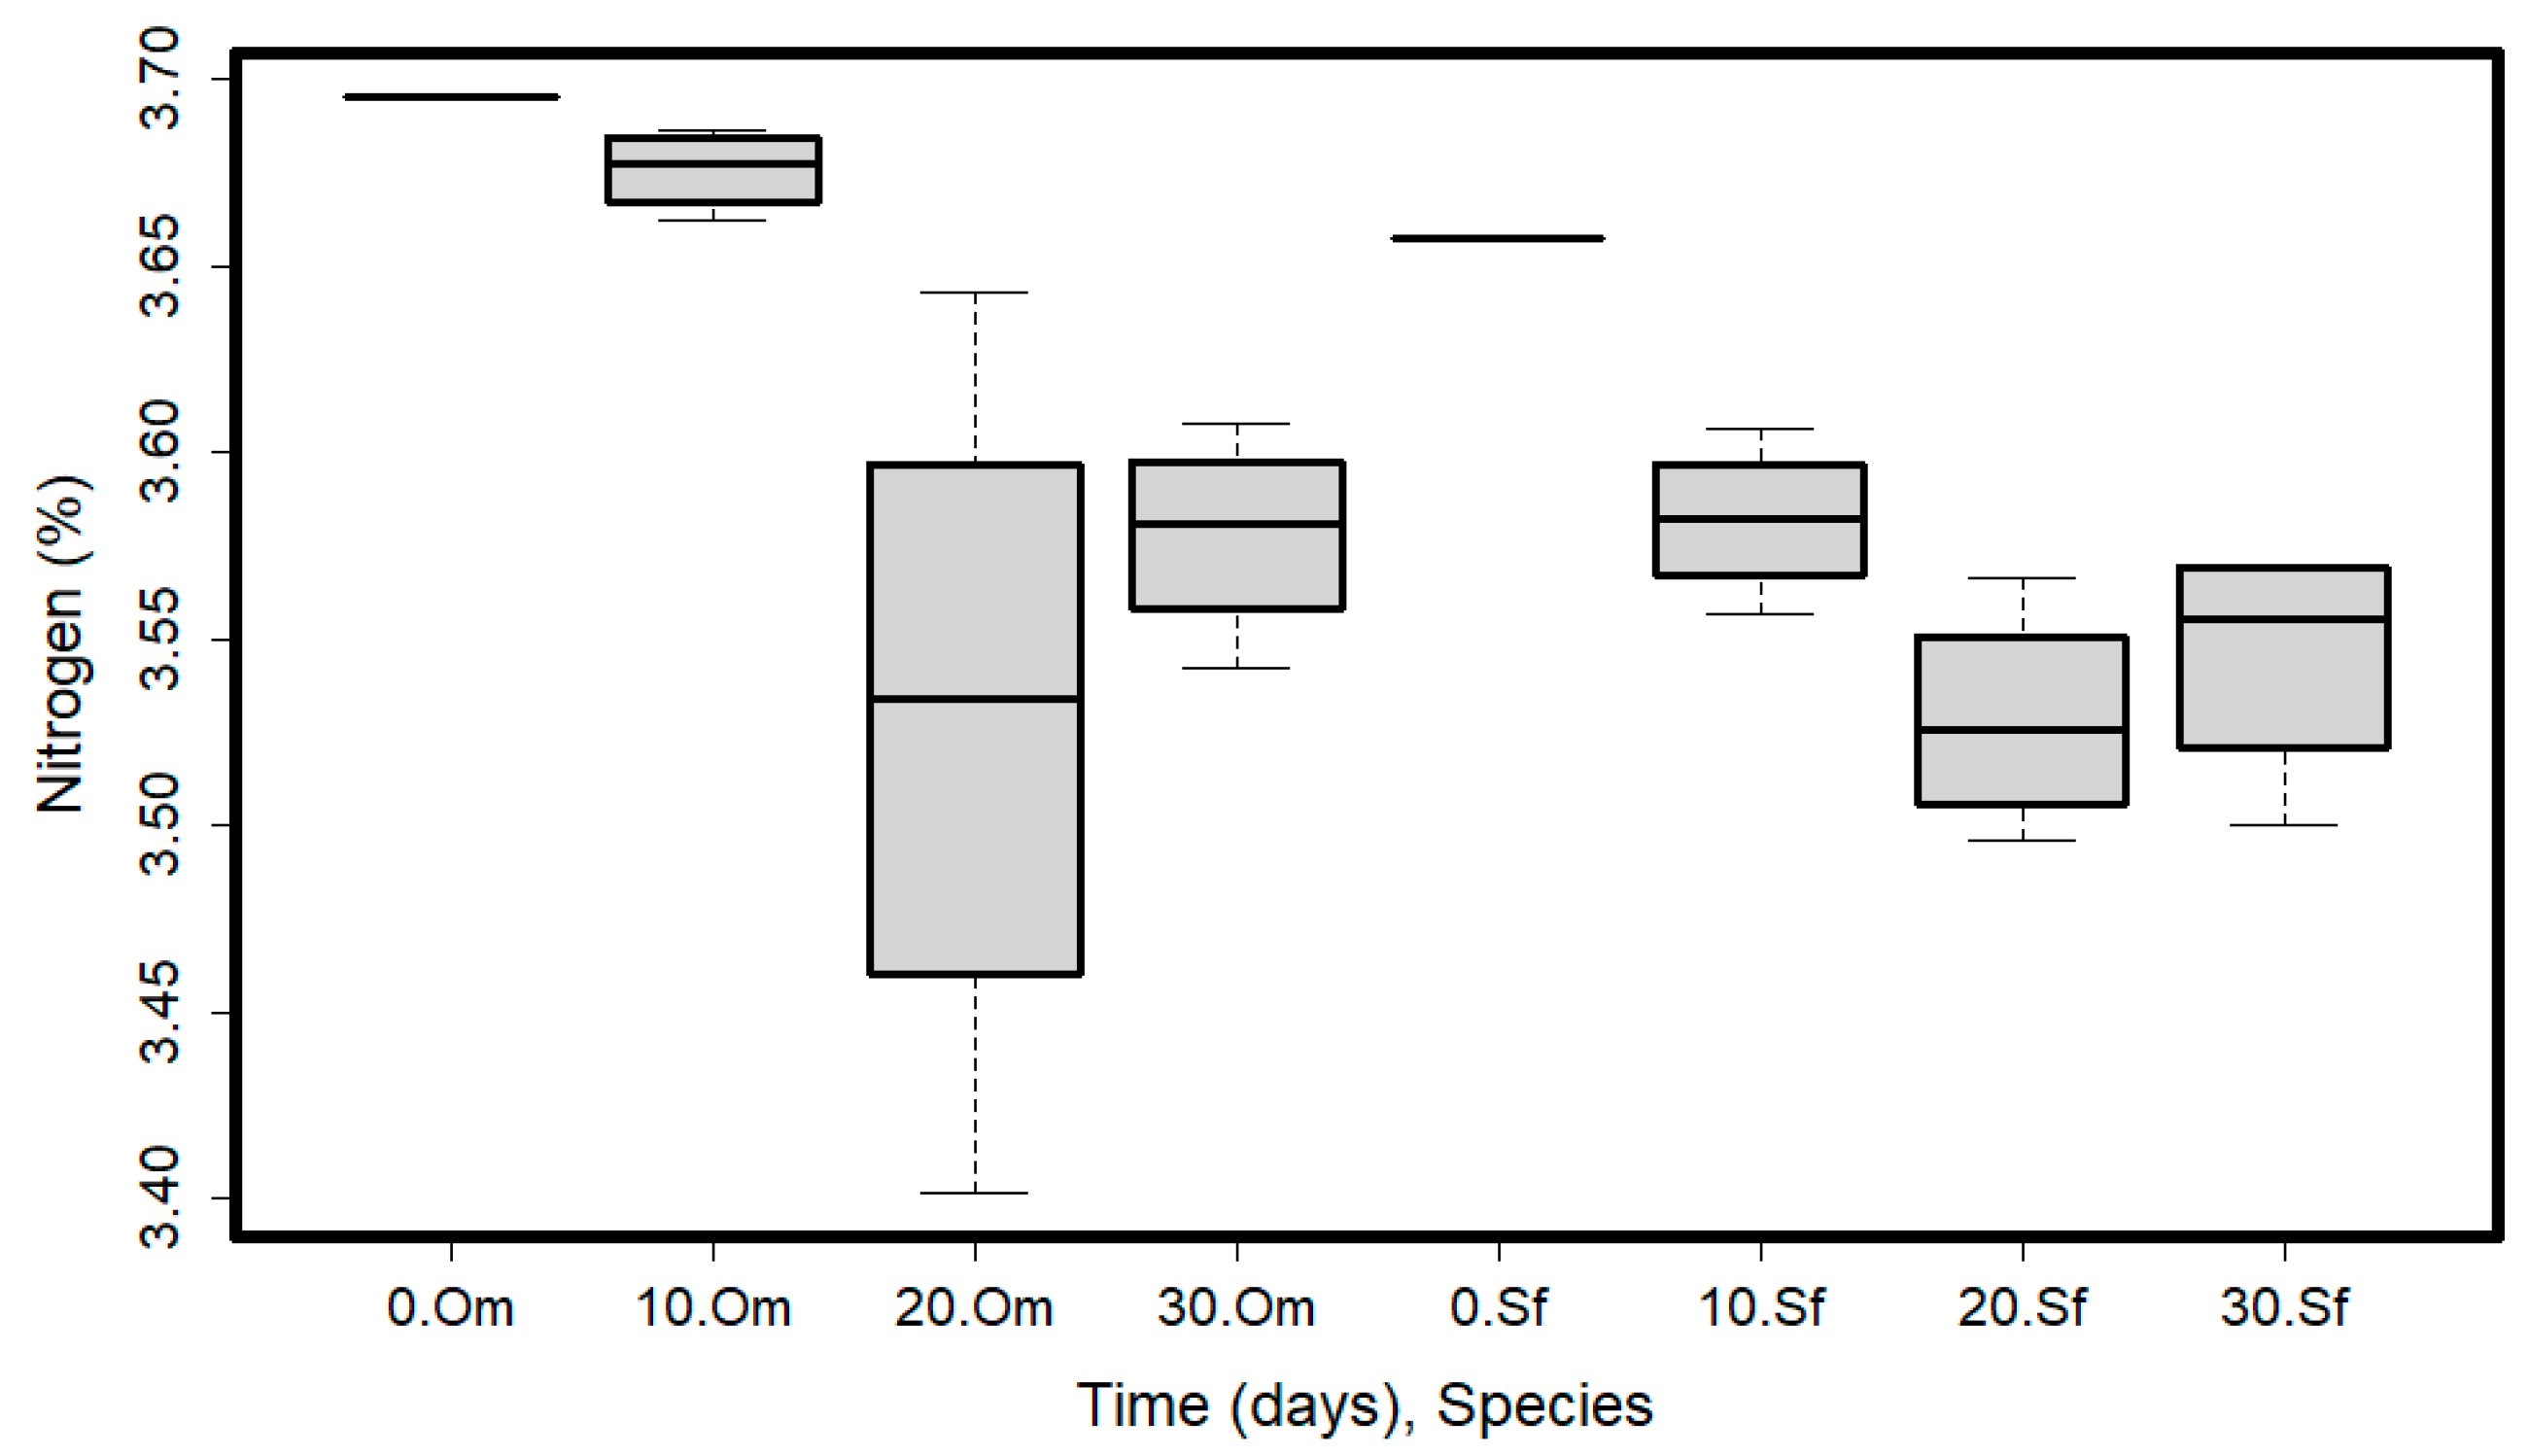
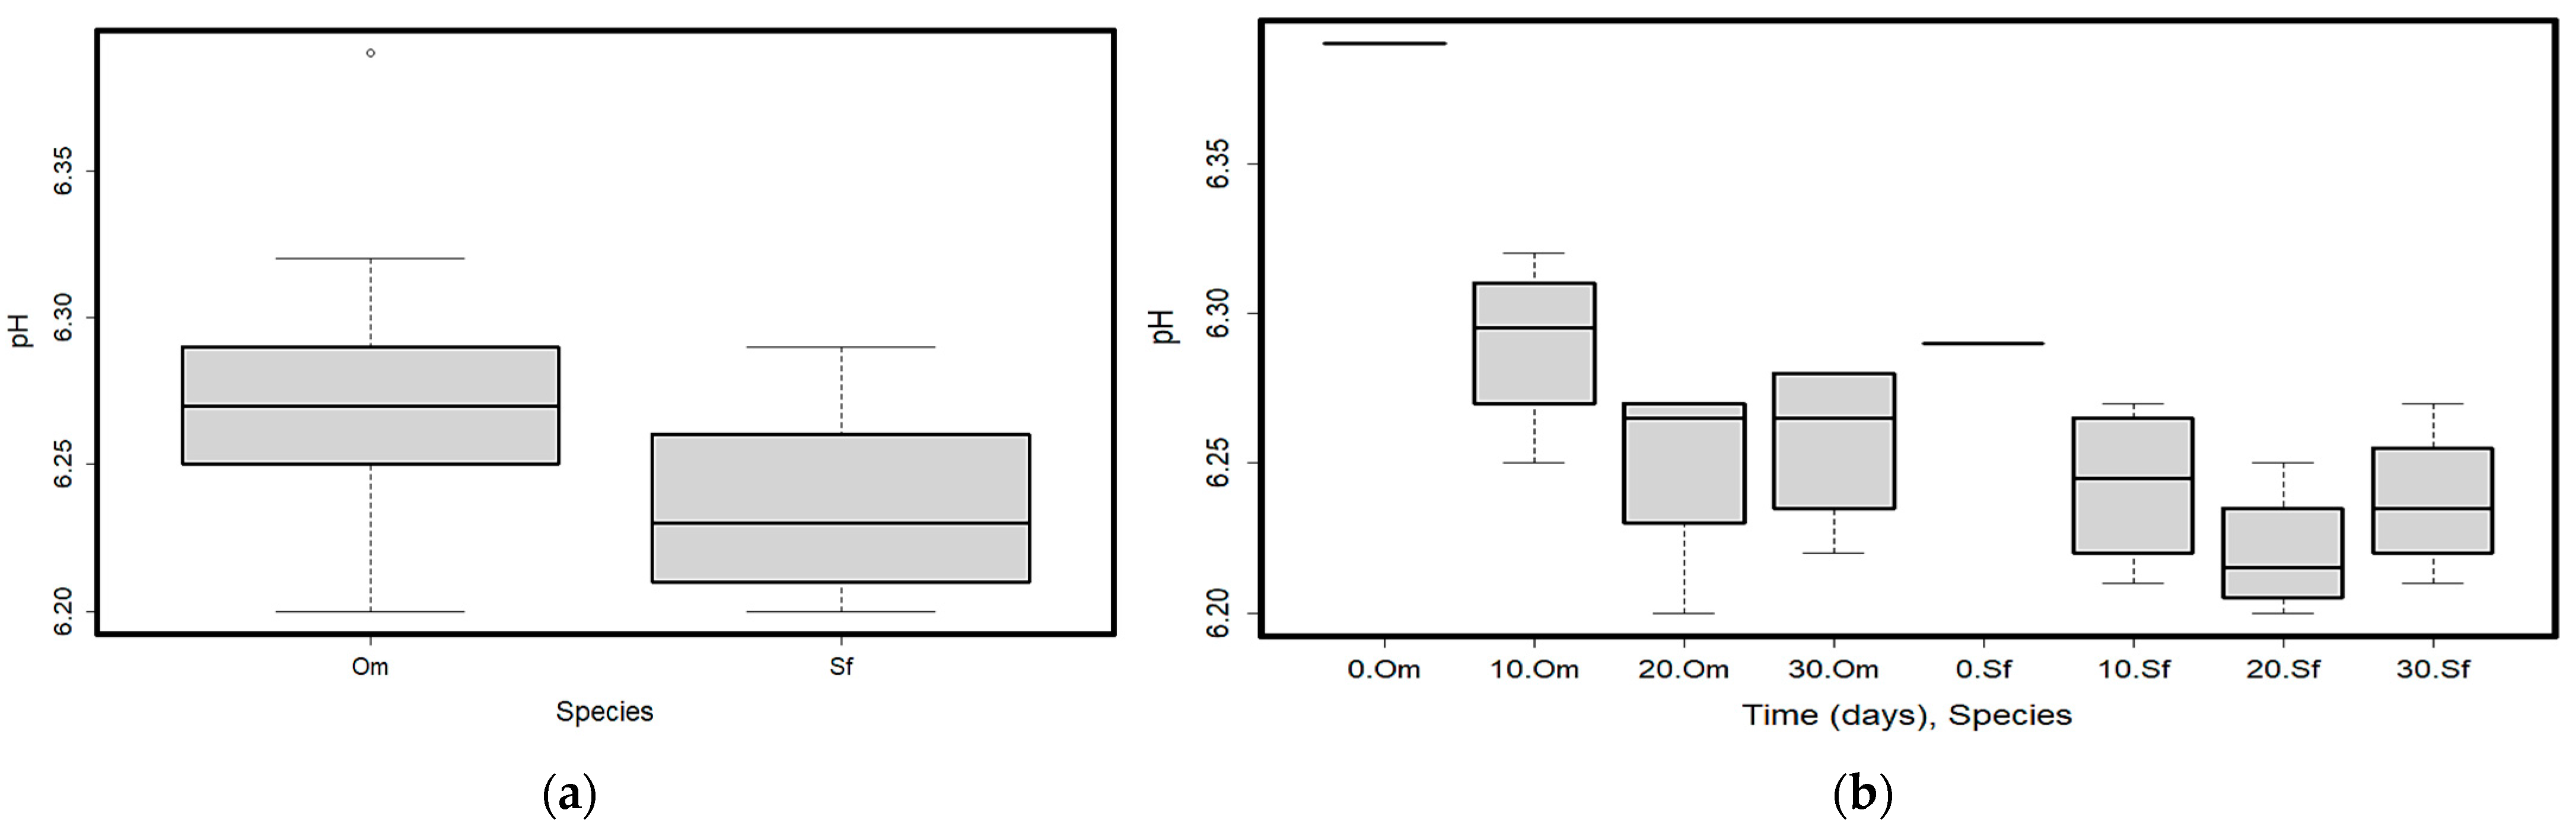
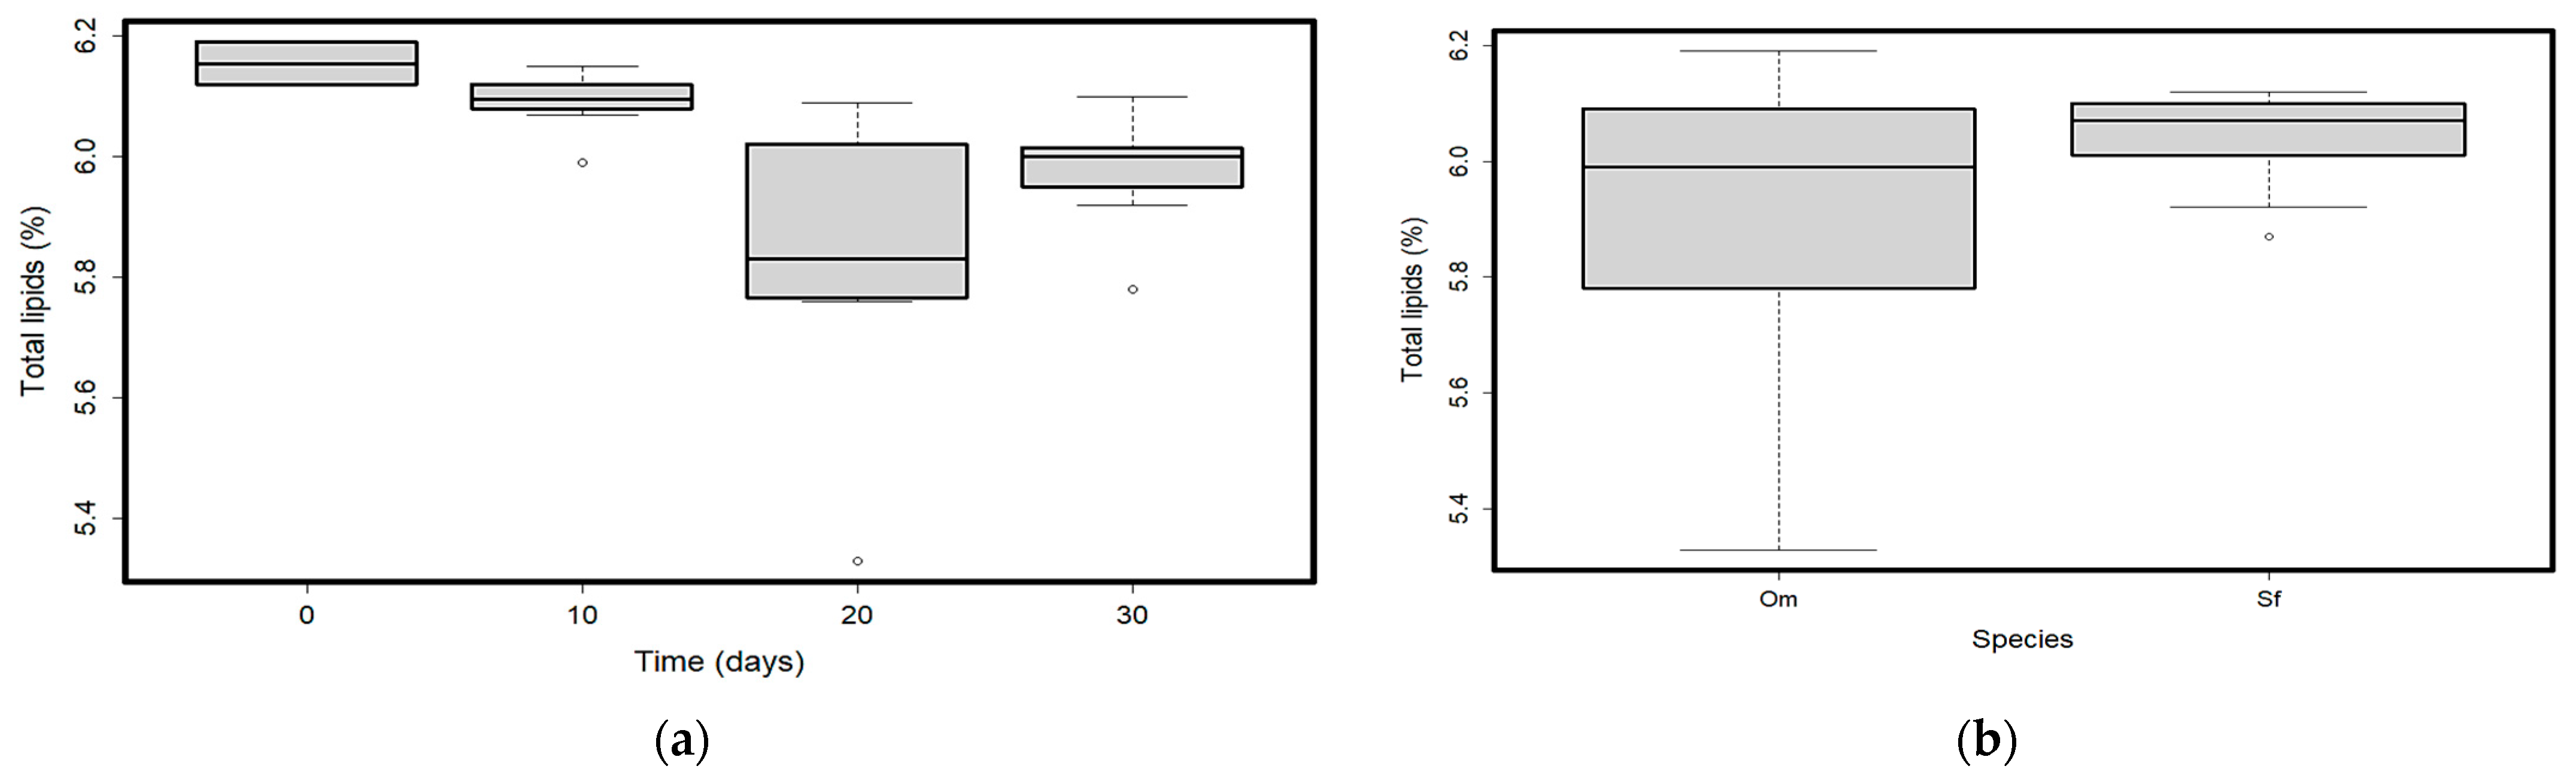
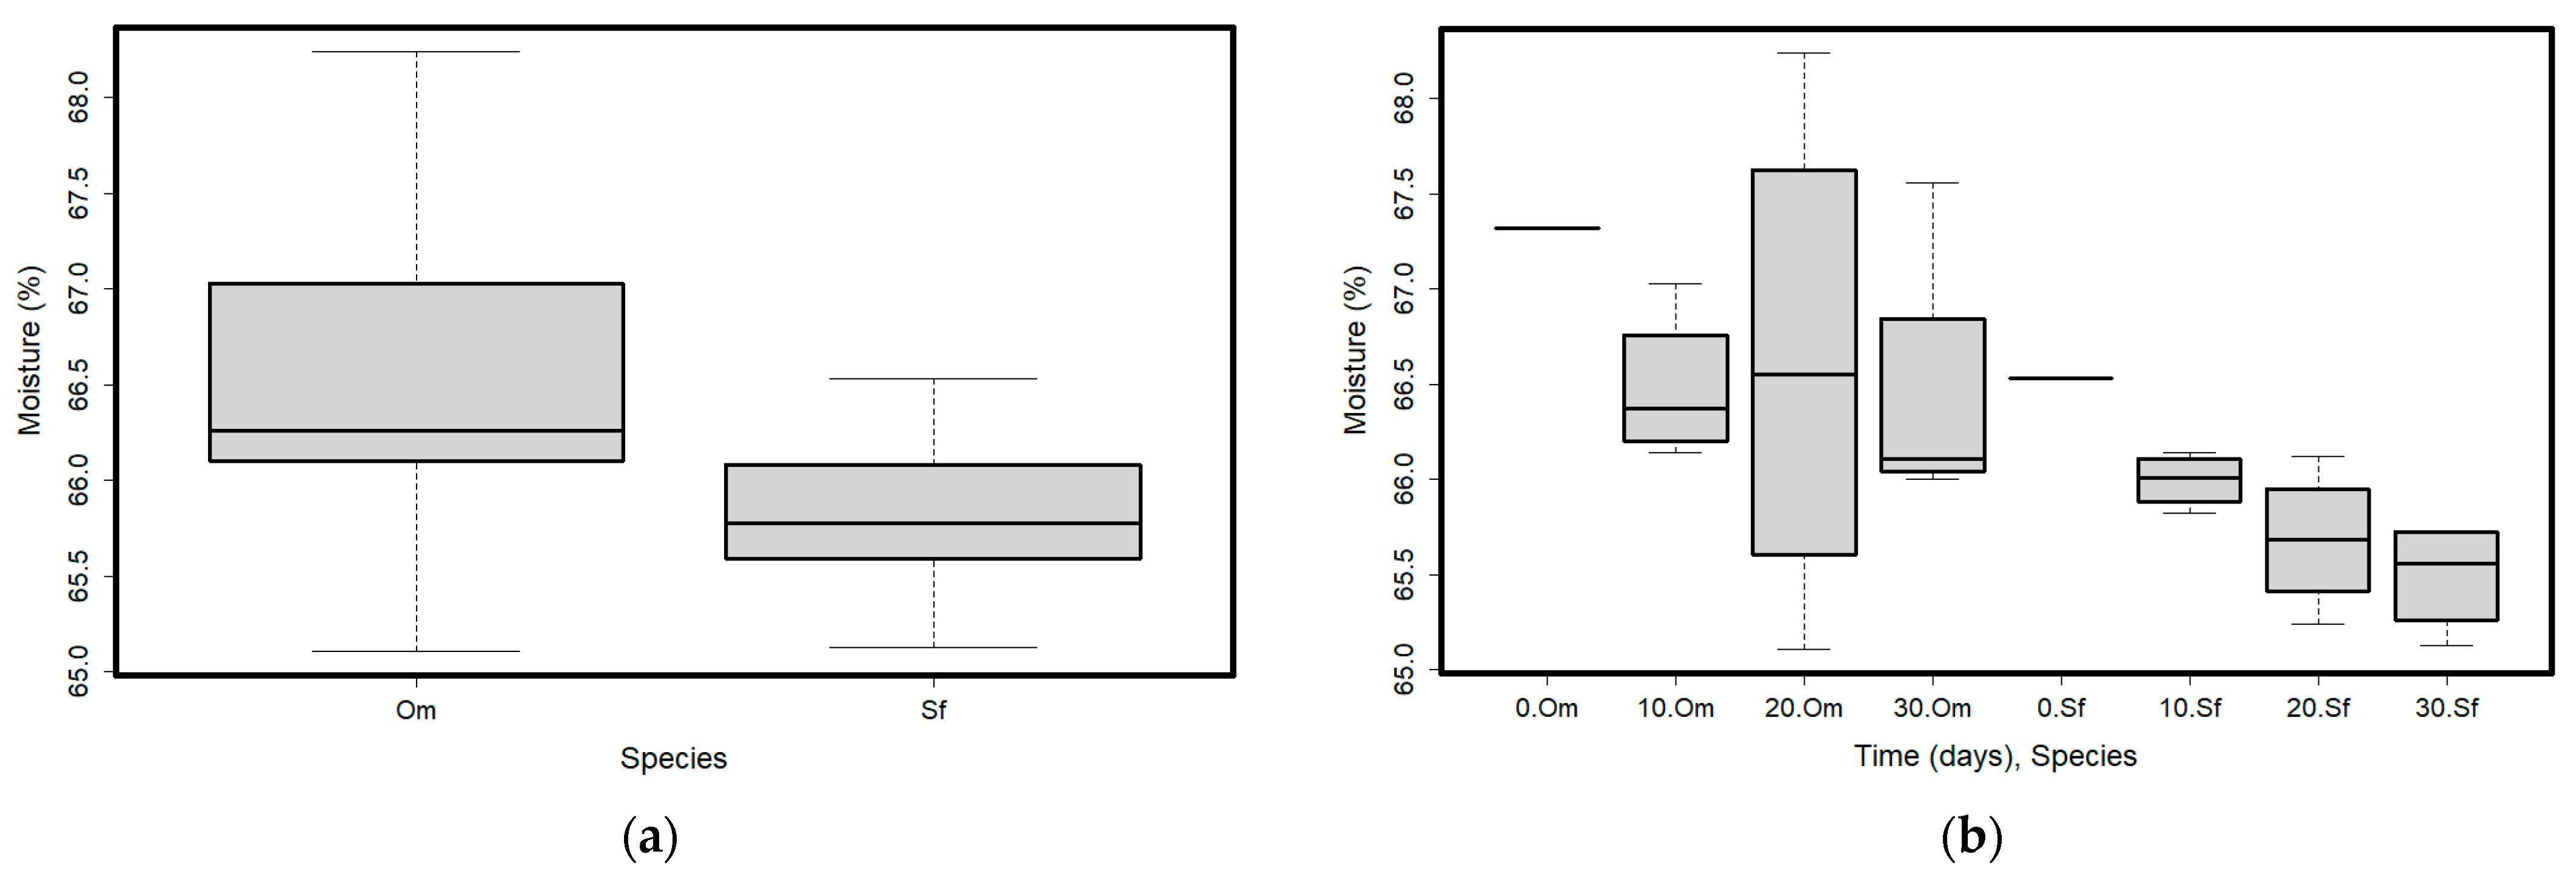
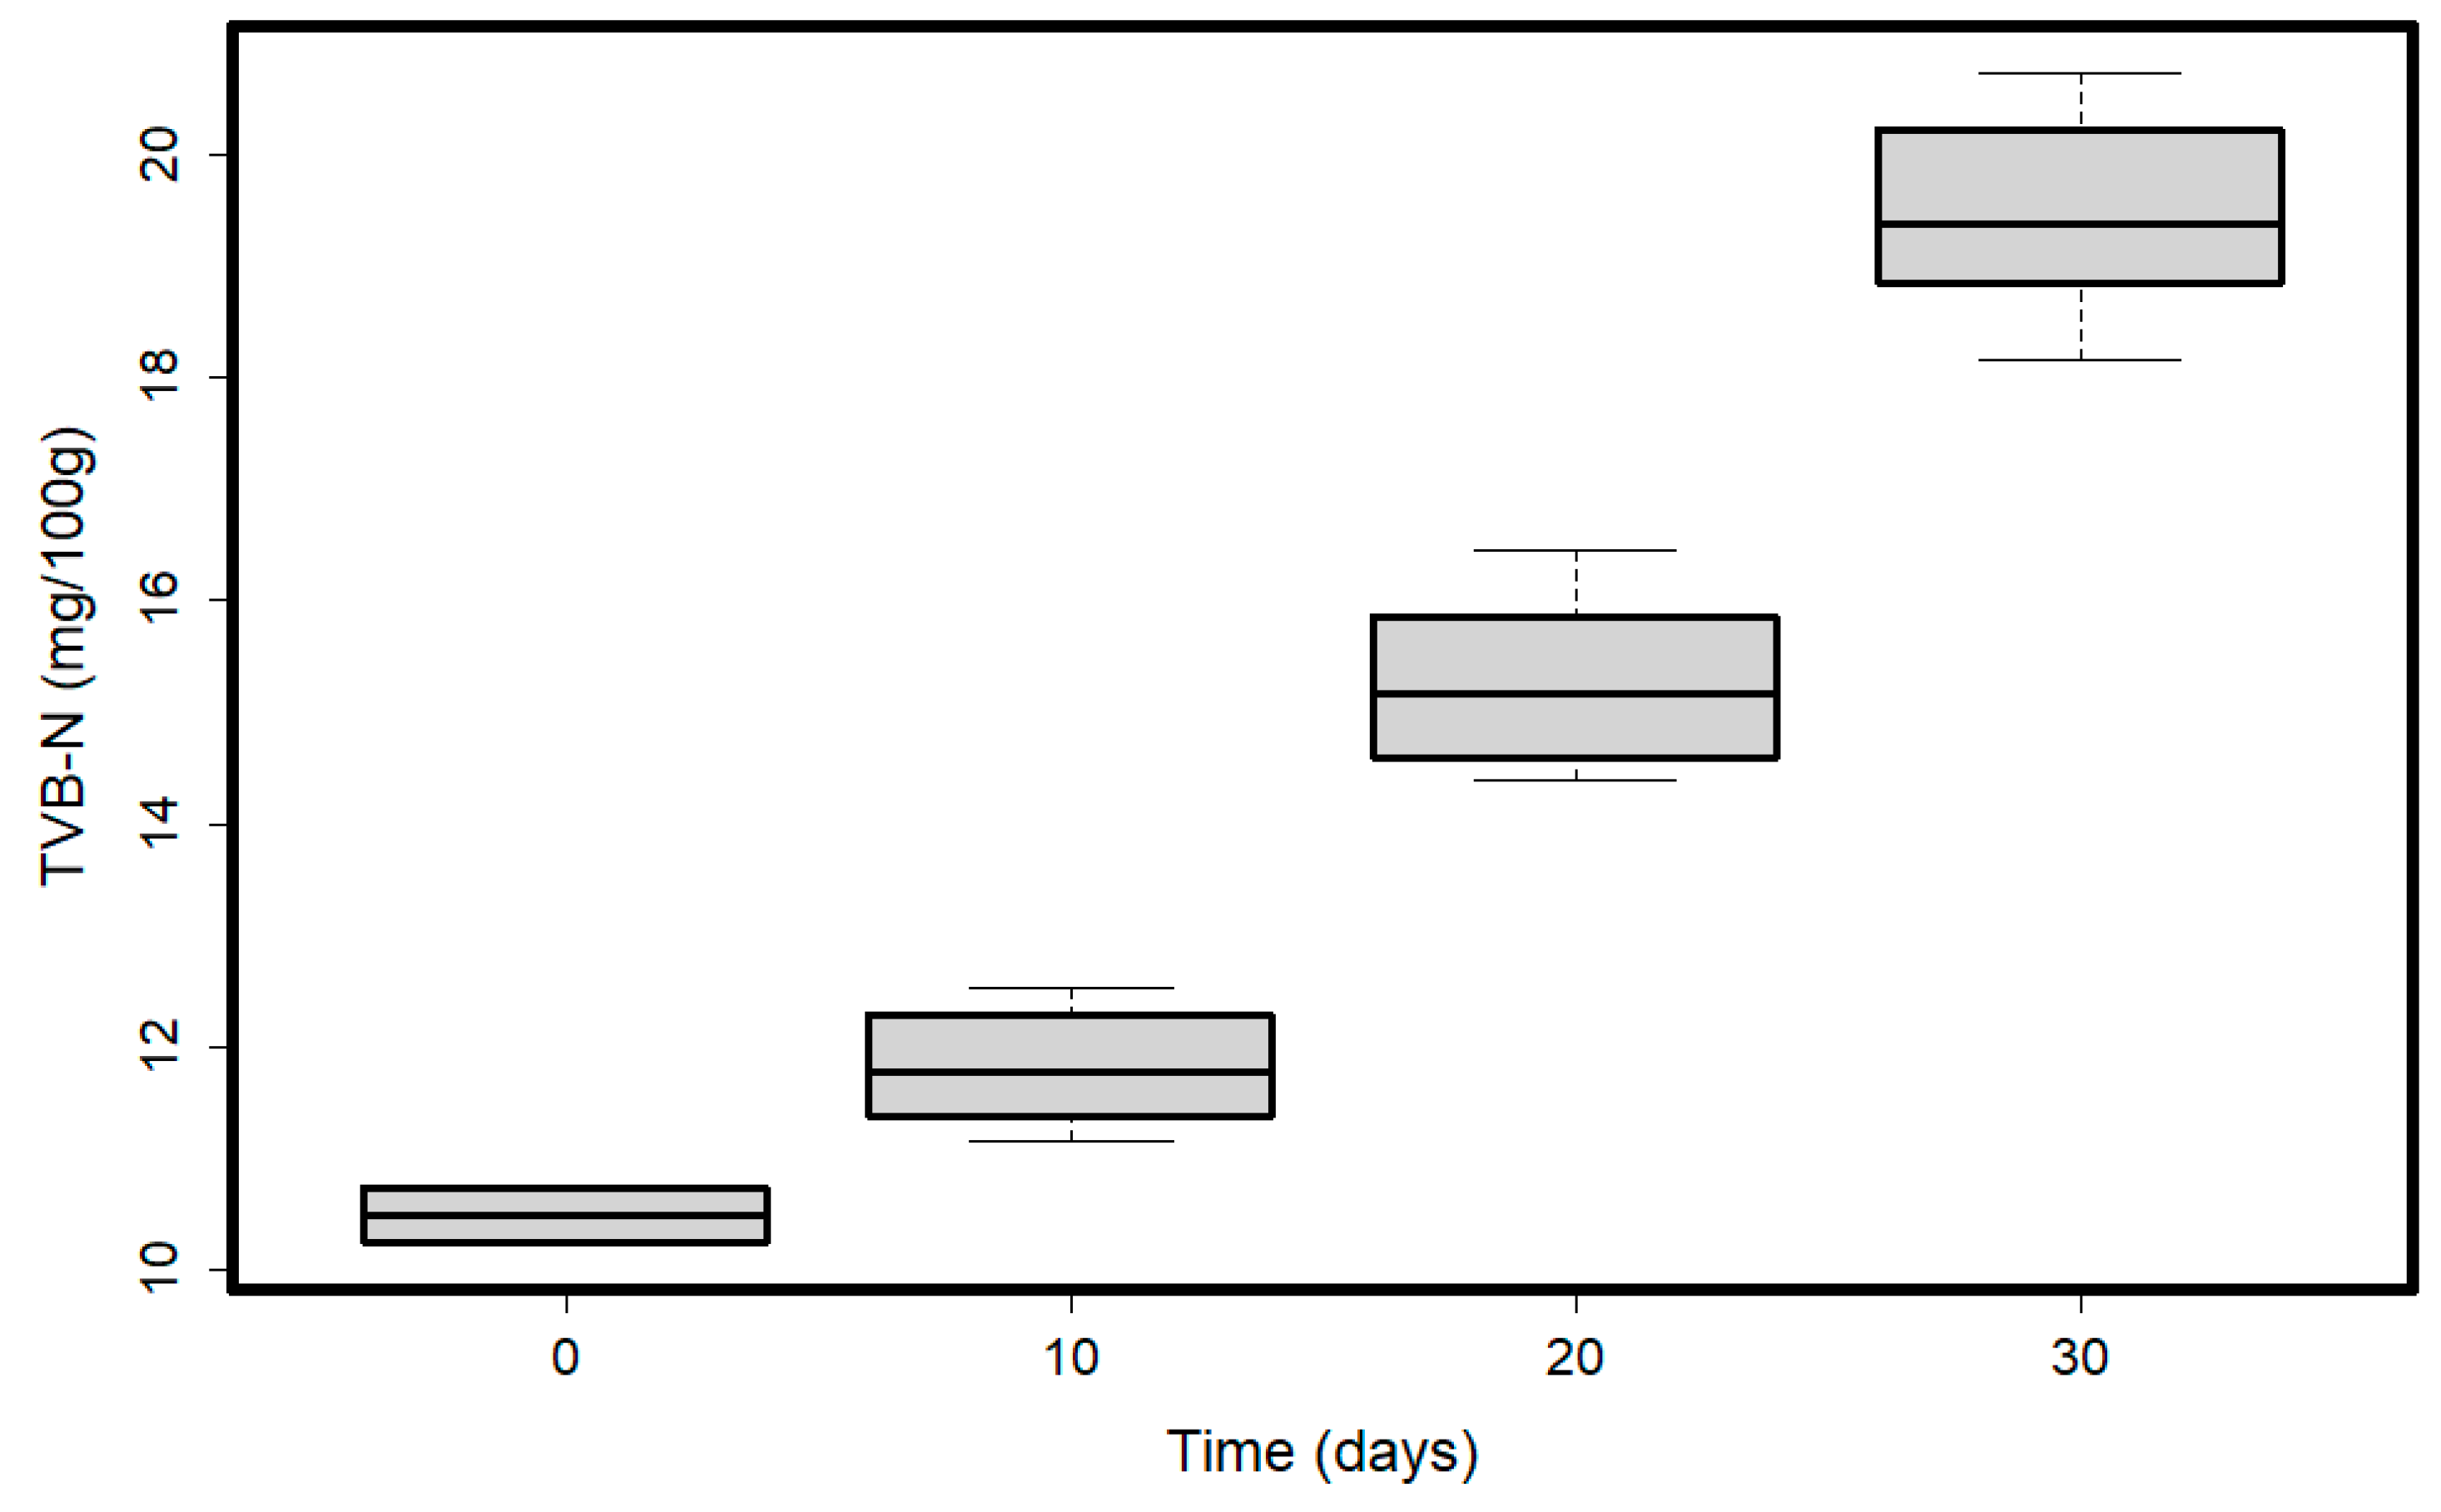
3.1. Physicochemical Parameters

Protein content varied with time (Table 1). We found significant differences (p < 0.05 in post-hoc comparisons) between values at starting time (mean = 23.38%, SD = 0.74 at T0) vs. values at day 10 (mean = 22.68%, SD = 0.33 at T10), 20 (mean = 22.05%, SD = 0.43 at T20), and 30 (mean = 22.26%, SD = 0.20 at T30), between T10 vs. T20 and T30 (Figure 1a). There were no differences in the protein content between T20 and T30. There were significant differences when considering species (Table 1). Species started with similar protein content (23.9% for Om and 22.86% for Sf), and then differences appeared from one time period to another only in the case of Om, resulting in the higher variability represented in Figure 1a. Brook trout (Sf) held a more constant protein content throughout the tested periods (Figure 1b).
Rainbow trout (Om) had a decreasing protein content throughout the testing periods; the correlation between time and protein content was strong and negative (Rho = −0.7, p = 0.025, Supplementary Table S1). The packaging did not affect the protein content (Table 1).
Nitrogen content varied with time (Table 1). There were significant differences between T0 (mean = 3.68, SD = 0.03) vs. T20 (mean = 3.53, SD = 0.07) and T30 (mean = 3.56, SD = 0.03) and between T10 (mean = 3.63, SD = 0.05) vs. T20 and T30. There were no differences in nitrogen content between T20 and T30 and between T0 and T10 (Figure 2).
Significant differences were found in the nitrogen content when considering species (Table 1). Species started with similar nitrogen content (3.70% for Om and 3.66% for Sf), and then differences appeared from one time period to another, but only in the case of Om, resulting in the higher variability represented in Figure 2. Brook trout (Sf) held a more constant nitrogen content throughout tested periods (Figure 2). A decreasing nitrogen content was found throughout testing periods; the correlation between time and nitrogen content was strong and negative (Rho = −0.7, p = 0.025, Supplementary Table S1). The packaging type did not affect the nitrogen content (Table 1). The nitrogen content of the two studied species varied during the experimental period. For rainbow trout, it ranged from 3.53% to 3.69%, with the highest value in T0. Brook trout presented a nitrogen content from 3.52% to 3.66%.
Total lipid content varied over time (Table 1). Significant differences were found between T0 (mean = 6.16%, SD = 0.05) vs. T20 (mean = 5.83%, SD = 0.24) and T30 (mean = 5.98%, SD = 0.09), and T10 (mean = 6.09%, SD = 0.05) vs. T20 and T30 (Figure 3). Lipid content was lower in T10 compared to T0, but not statistically different (p > 0.05), and it was different between T0 and T20, T30, and T10, and T20 and T30 (Figure 3a).
Lipid content was similar in both species, even though Sf tended to have a smaller variability than Om (Figure 3b). Overall, the lipid content of smoked rainbow trout and brook trout was 6 and 6.1%, respectively. The lipid content decreased in both species with time; the correlation between time and nitrogen content was strong and negative (Rho = −0.7, p = 0.025, Supplementary Table S1). The packaging did not influence the total lipid content (Table 1).
Regarding moisture content, significant differences were only found between species (Table 1). The moisture in the Om sample had higher variability than that of the Sf sample (Figure 4a). The Om sample (overall mean = 66.58%, SD = 0.82) had a higher moisture content than the Sf one (overall mean = 65.78%, SD = 0.39). The highest variability in the Om sample was recorded on day 20 (between 65.11% and 68.24%, Figure 4b).
Packaging would be expected to play an important role, if there were differences in time, but we only found a higher variability in moisture content at T20, while at other sampling times, there was a similar moisture content (Figure 4b). Overall, there was a moderate negative correlation between moisture content and time (Rho = −0.52, p = 0.122, Supplementary Table S1), showing that samples similarly lost moisture with time, regardless of packaging (Table 1).
Significant differences were only found in the pH values between the two species (Om mean = 6.28, SD = 0.05, and Sf mean = 6.24, SD = 0.03, Table 1, Figure 5a), while time did not show a significant effect on pH values (Table 1).
Time and pH had a strong negative correlation (Rho = −0.7, p = 0.025, Supplementary Table S1). The pH of the Om sample had higher values in the beginning (at T0, 6.39) than in T10 (mean = 6.29, SD = 0.03), T20 (mean = 6.25, SD = 0.03), and T30 (mean = 6.26, SD = 0.03), and also when compared to all of the samples of the Sf species. This induced the differences between species (Figure 5b). The packaging type did not affect the pH of the samples (Table 1).
We found a significant effect of time on the values of TVB-N (Table 1, Figure 6). The most significant differences were between T0 (mean = 10.51 mg/100 g, SD = 0.35) vs. T20 (mean = 15.26 mg/100 g, SD = 0.76) and T30 (mean = 19.47 mg/100 g, SD = 0.90), T10 (mean = 11.82 mg/100 g, SD = 0.52) vs. T20 and T30, and T20 vs. T30. Both species similarly accumulated TVB-N in time (Table 1). After the first 10 days, there were no significant differences, but after 20 and 30 days, the amount of TVB-N significantly increased.
The increase in TVB-N with time was also illustrated by the strong positive correlation found between these two parameters (Rho = 0.7, p = 0.025, Supplementary Table S1). The packaging did not influence the values of TVB-N (Table 1). None of the physicochemical parameters measured showed significant correlations with polycyclic aromatic hydrocarbons (Supplementary Table S1).

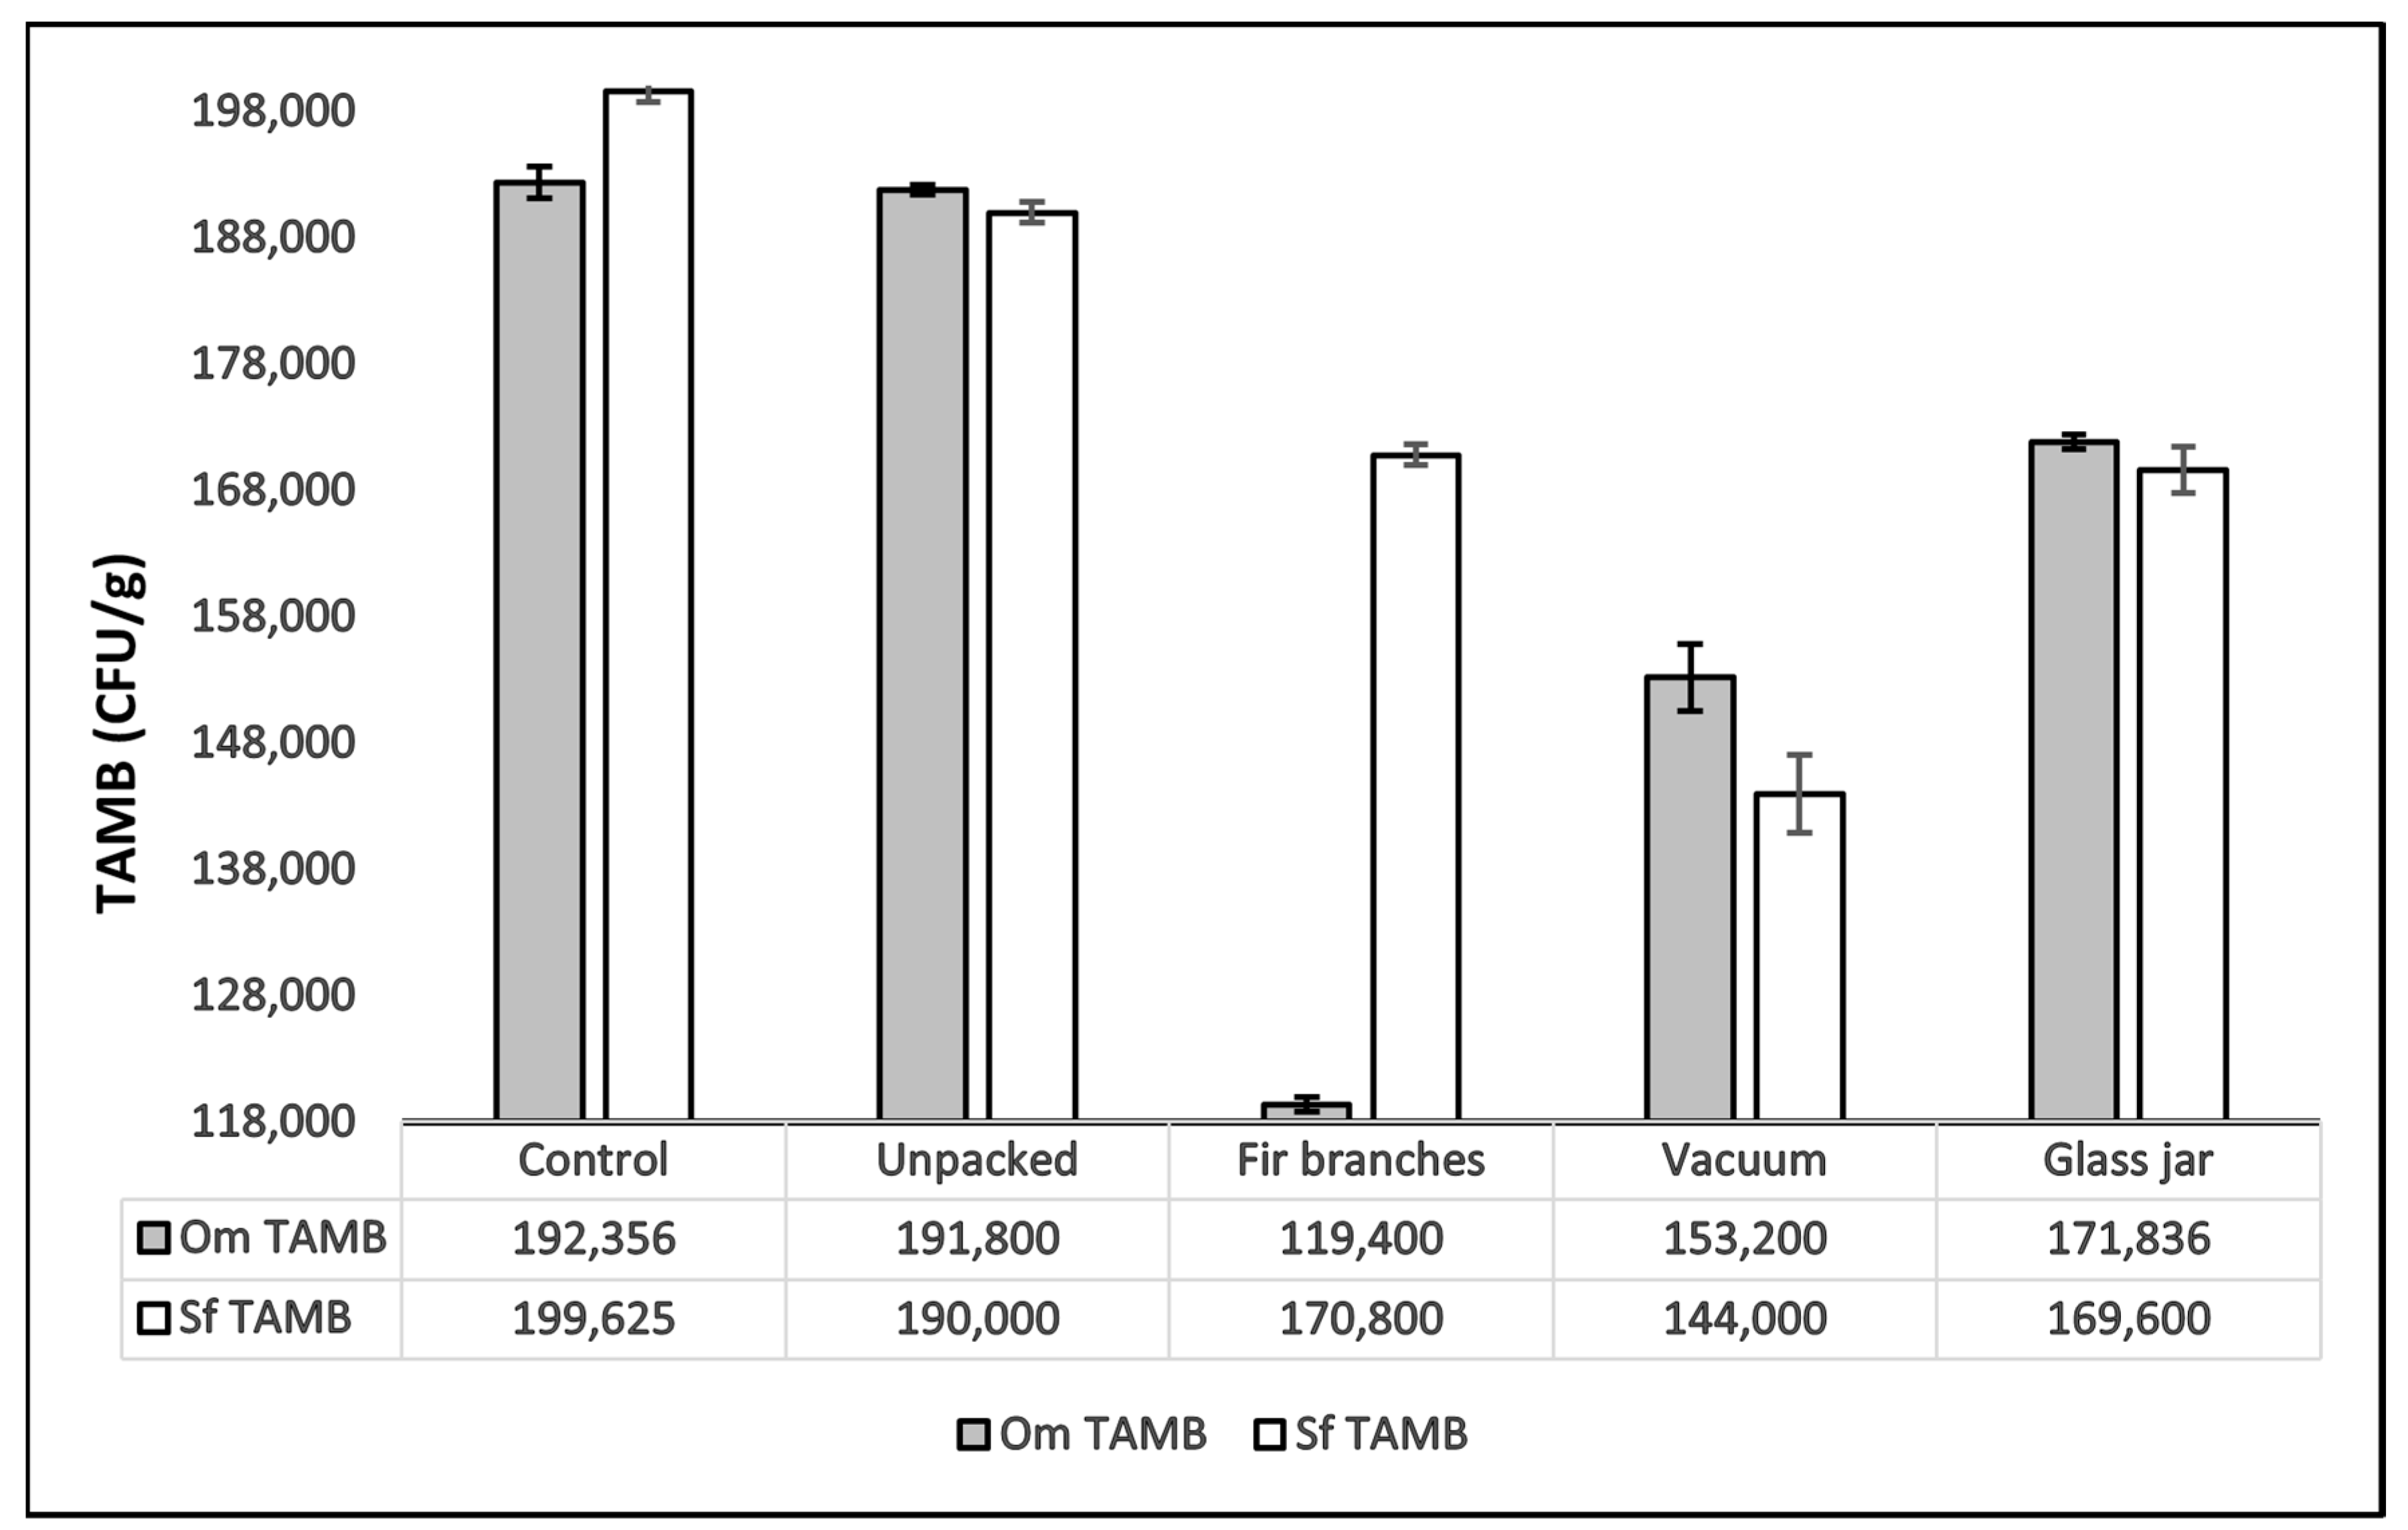
3.2. Microbiological Parameters

Of the five investigated microbiological parameters, we only found β-glucuronidase positive E. coli and total aerobic mesophilic bacteria (TAMB) to have detectable levels. E. coli had identical values at the beginning of the observation period (at T0, 9.99 CFU/g) with the ones in the test sample after 30 days of storage (T30), regardless of the packaging type used.
The TAMB mean values in T0 of both studied species from the present study were similar (smoked rainbow trout 1.92 × 10⁵ CFU/g; smoked brook trout 1.99 × 10⁵ CFU/g). TAMB had different values in different types of packaging after 30 days of storage (Figure 7). TAMB mean values for both species decreased from T0 to T30. This result was illustrated by the strong negative correlation found between time and TAMB values (Rho = −0.7, p = 0.025, Supplementary Table S1).

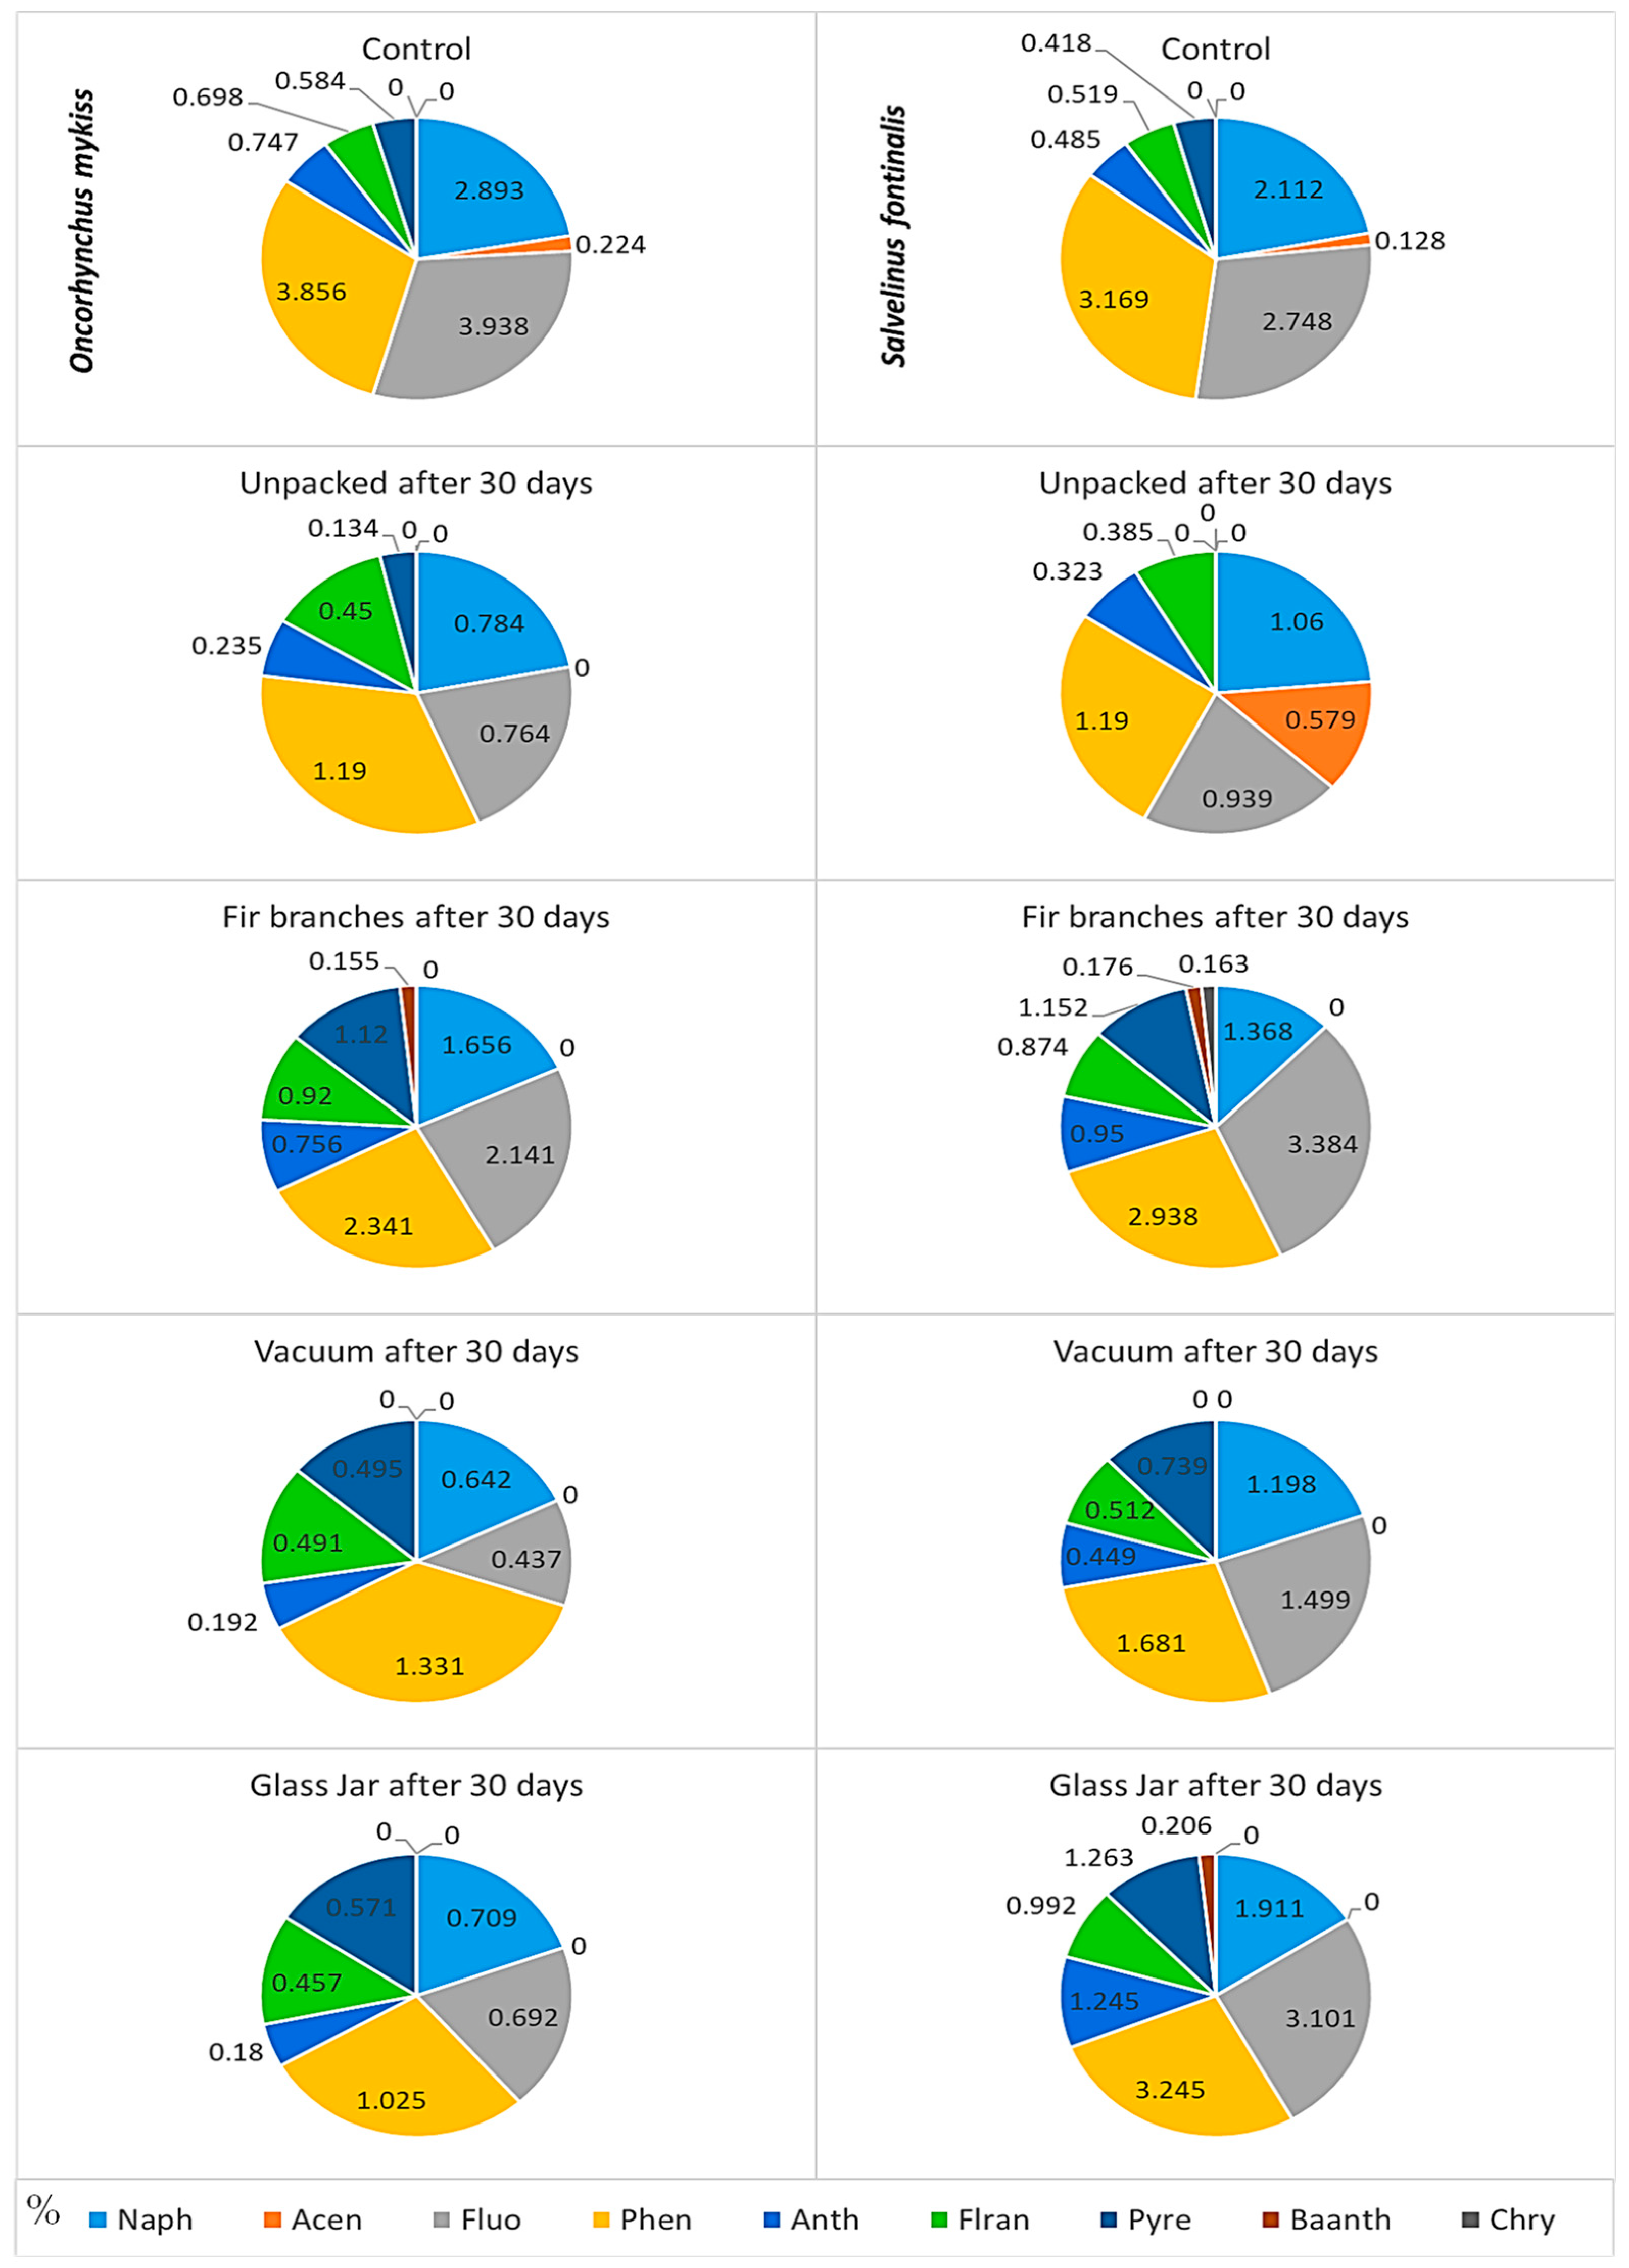
3.3. Polycyclic Aromatic Hydrocarbons (PAHs)

Of the fifteen analyzed PAHs, the following compounds had undetectable levels in the samples: Benzo[b]fluoranthene, Benzo[k]fluoranthene, Benzo[a]pyrene, Dibenzo[a,h]anthracene, Benzo[g,h,i]perylene, and Indeno[1,2,3-cd]pyrene. The rest of the nine PAHs showed variable proportions in different types of packaging after 30 days of storage, without significant differences (p > 0.05) (Figure 8). Strong or moderate positive correlations were found between Naphthalene, Fluorene, Phenanthrene, Anthracene, Fluoranthene, and total polycyclic aromatic hydrocarbons. Additional significant positive correlations were found between Fluoranthene, Pyrene, and Benzo[a]anthracene (Supplementary Table S1).

4. Discussion

The objective of this study was to gain deeper knowledge about the quality and safety of two traditionally smoked trout species (O. mykiss and S. fontinalis) and to compare the effect of the manufacturing process, characterizing the samples according to relationships existing between classical microbial analysis, physico-chemical parameters, and the content of PAHs. All specimens of the traditionally smoked trout samples were gifted to us by Trecătoarea Ursului trout farm, Brașov County, Romania, and were obtained from a traditional smokehouse that employed procedures that did not control temperature and time in a commercial manner [35]. The entire technological flow used for traditionally smoked trout meat lasts for an average of 2–3 days. Fish exposure to smoke action represents a special stage, determined by the characteristics of raw material. Smoking, as a traditional preservation method for trout, is one of the oldest methods used to increase the storage period and to improve the taste of fish meat. The smoke not only provides a special taste, color, and aroma to food, but also enhances preservation due to dehydration, bactericidal, and the antioxidant properties of smoke [8,36]. The total protein content of Om was slightly higher than that of Sf, while the lipid content of Om was lower than that of Sf. Om also had a higher moisture content. The two species presented similar TAMB values in time. The TAMB values were also similar between species in different types of packaging, except for fir branches, where Sf had a higher TAMB content than Om. The PAH content did not significantly vary between the fish species.

4.1. Physico-Chemical Parameters

The physicochemical parameters of the products are influenced by species, feed, age, processing method, and many other factors. The protein content decreased in smoked fish in the first 20 days (from 23.38% to 22.05%), with a slight increase in the following 10 days (to 22.26%). The nitrogen content of the two studied species varied during the experimental period. For rainbow trout, it ranged from 3.53 to 3.69%, with the highest value in T0. Brook trout presented a nitrogen content from 3.52 to 3.66%. Other authors have also observed a decrease in the protein content of smoked rainbow trout. Tümerkan [37] found a protein content of 23.7% in hot smoked rainbow trout, corresponding to 3.79% nitrogen content, a slightly higher value than that obtained in this study. Duman and Kuzgun [38] determined that smoked rainbow trout nuggets had a higher content of crude protein and total lipids than fresh nuggets. Sava et al. [39] found a protein content of 20.97% in traditionally smoked rainbow trout, corresponding to 3.36% nitrogen, while the nitrogen content in the fresh samples was 2.68%. The same authors determined a protein content for fresh brook trout of 16.16%, which increased to 21.86% in traditionally smoked samples, corresponding to 2.56 and 3.5% nitrogen, respectively. Other authors observed an increase in protein content when smoking rainbow trout [40,41].
The determined lipid content from smoked fish meat presented in this study showed a decreasing trend along the sampling periods. Lipids are important because most of them are involved in metabolic, cellular, and signaling pathways from membrane construction, selective permeability, lipids raft, and steroid hormones synthesis to signaling molecules [42]. Overall, the lipid content of smoked rainbow trout and brook trout was 6 and 6.1%, respectively. It was higher than the lipid content of traditionally smoked rainbow trout and brook trout obtained by Sava et al. [39], 4.1 and 5.66, respectively. Tosun and Özden [40] noticed an increase in total lipid content in hot smoked rainbow trout, from 3.2 to 7.02%. As expected, moisture content decreased with time, and during processing [43]. However, the differences were not significant. This was also observed by other authors [40,41].
The pH in the studied samples was slightly acidic, between 6.22 and 6.39. Çoban et al. [44] observed a pH of fresh rainbow trout samples of 6.48, which decreased after smoking to 5.75–5.91. Kiczorowska et al. [45] also observed a decrease in the pH of rainbow trout, from 5.9 in fresh samples to 5.7 in smoked samples. Tosun and Özden [40] found a pH of 6.2 in raw rainbow trout samples, which decreased to 6.13 after smoking. The decrease in pH after smoking is thought to occur because of CO2 absorption by the fish tissue [43]. Tosun and Özden [40] also noted an increase in pH after 28 days, which may be caused by the decrease in carbonic acid formation. The pH is a major influencer of microbial growth, and subsequently, of product spoilage. Maga [46] mentioned that smoking is also a mild preservative treatment, killing bacteria and preventing proliferation. Most bacteria thrive in a pH between 6.5–7.5, so a product with a pH outside of this interval has a longer shelf life.
TVB-N is a parameter used to determine the level of food spoilage, especially used for fish. Usually, the TVB-N value of freshwater species is between 10–20 mg/100 g [41]. According to EC 2074/2005 [47], depending on the fish species, the TVB-N content should not exceed 25–35 mg/100 g. TVB-N is highly dependent on storage time and temperature [48]. In the present study, the TVB-N increased from 10.4 mg/100 g to 19.6 mg/100 g after 30 days. The obtained results were under the established threshold. Bienkiewicz et al. [49] also observed an increase in TVB-N after hot-smoking rainbow trout, from 7 to 9 mg/100 g. Du et al. [48] noted a slower increase in TVB-N of rainbow trout, from 8.1 mg/100 g to 18.7 mg/100 g at 4 °C and to 14.5 mg/100 g at 0 °C, after 12 days of storage. When hot smoking rainbow trout, Fıcıcılar and Genccelep [41] determined a TVB-N of 19.74 mg/100 g after 21 days of storage, a value comparable to that obtained in the present study after 30 days. Smoking might increase the TVB-N content of fish through the production of volatile amine compounds [50].

4.2. Microbiological Analysis

The spoilage and safety of smoked fish are very important to consumers, therefore managing the multiple operations such as harvest, processing (smoking), transport, storage, and type of packaging in which the product is involved, should consider the various parameters to which the product may be exposed [36,51,52].
In the present study, the microbiological analyses were represented by Salmonella spp., E. coli, Yersinia spp., L. monocytogenes, and TAMB. Of the five investigated microbiological parameters, we only found E. coli and TAMB to have detectable levels. The microbiological load remained below the limit values in our study [53]. The suppression of bacterial growth was observed throughout the storage period regardless of the packaging type used in the storage conditions (2–4 °C), with the hot smoking treatment preventing bacterial proliferation. The E. coli found in our samples had identical values in the T0 with the ones in the T30, regardless of the packaging type used and the species. The recorded values were below <10 CFU/g, confirming that the studied samples meet the satisfactory limit of E. coli present in smoked trout meat [53]. Furthermore, according to Mendonca et al. [54], the values for E. coli expected just after obtaining the final product should be <10 CFU/g and the maximum acceptable value at any point in the shelf life of the food product is 103 CFU/g. There have been numerous studies that have indicated that hot smoking showed inhibitory effects against foodborne pathogens such as L. monocytogenes, Aeromonas hydrophila, Yersinia enterocolitica, E. coli, and in other smoked products [7,55,56,57,58,59].
TAMB is also known as the aerobic plate count (APC) or the standard plate count. The TAMB is used to estimate the bacterial population in a food sample, and it provides an estimate of the number of microorganisms that can aerobically grow at mesophilic temperatures. The TAMB levels can provide information on the quality of the finished product. Additionally, it can be used to determine the shelf-life of a food product [54]. The initial TAMB mean values of both studied species were similar. At the end of the observation period (T30), the TAMB mean values slightly differed according to the type of the used packaging, mainly in the traditional packaging type (fir branches), where we assume that the increase in moisture content was higher than in the other samples, therefore, the bacterial level increased [51]. According to Mendonca et al. [54], the expected values immediately after production (smoking) using good manufacturing practices for TAMB are <106 CFU/g, and the maximum value acceptable at any point in the shelf life of the food product is 107 CFU/g.

4.3. Polycyclic Aromatic Hydrocarbons (PAHs)

PAHs are aromatic compounds composed of carbon and hydrogen atoms in two or more fused benzene rings and are ubiquitous in the environment. PAHs are mainly formed by human activity and can be found in food exposed to the incomplete combustion of organic matter [60]. The contamination of PAHs in food occurs both via exposure to a polluted environment and during food processing, such as smoking, drying, or barbecuing [60,61].
Processing procedures, such as smoking and drying, are commonly thought to be the major source of contamination by PAH. There are several factors that may affect the PAH levels in smoked fish. These include the smoking or drying method, time of exposure, fuel and wood type, smoking duration, temperature, the distance from the heat source and drainage of fat, the lipid content of the product, design of the smoking chamber, airflow circulation, smoke density, and food pre-treatment and post-treatment technology [62].
The biological monitoring of exposure to PAHs is of primary interest, due to the widespread diffusion of these compounds and their toxicological relevance. Seventeen PAHs have been identified as being of greatest concern regarding potential exposure and having adverse health effects on humans [63]. Some of the PAHs are known as possibly or probably being carcinogenic to humans; among these are Benzo[a]pyrene, Naphthalene, Chrysene, Benzo[a]anthracene, Benzo[k]fluoranthene, and Benzo[b]fluoranthene [63].
European Commission Regulation No. 1881/2006 with the amendments of Commission Regulation (EU) 2020/1255 of 7 September 2020 set a maximum limit of PAHs, namely for Benzo[a]pyrene (5.0 μg/kg) and the sum of Benzo[a]pyrene, Benzo[a]anthracene, Benzo[b]fluoranthene, and Chrysene (30.0 μg/kg) in certain foods to ensure consumer protection [64,65].
In our study, despite the used method of traditional smoking, which implies high temperatures and direct exposure to the smoke, from the fifteen analyzed PAHs, the following compounds had undetectable levels in the samples: Benzo[a]pyrene, Benzo[b]fluoranthene, Benzo[k]fluoranthene, Dibenzo[a,h]anthracene, Benzo[g,h,i]perylene, and Indeno[1,2,3-cd]pyrene. The rest of the PAHs showed variable proportions in different types of packaging after 30 days of storage. However, all determinations did not exceed the values found in the specialty literature regarding the content of PAHs in smoked meat products [7,66,67], or the ones found in Regulation No. 1881/2006/EC and No. 1255/2020/EC [64,65].
A comparison of smoked fish species at local smokehouses as fillets and as whole fish illustrated that the level of PAHs was higher for smoked fillets in comparison to the same fish species smoked as whole fish. When the contact of the large edible surface is exposed to smoke, the results showed an increase in PAHs [68]. According to Duedahl-Olesen et al. [67], regarding the influence of smoking parameters, the concentration of PAHs in Danish traditional smoked fish showed that the penetration into the fish muscle was higher in the outer layers or surfaces exposed to the smoke than the rest. It can be assumed that the skin of the fish is a good barrier for PAHs, confirming the results of other researchers who found higher PAHs concentrations in fish skin rather than in muscle [12,68].

5. Conclusions

Traditionally smoked trout has many advantages in terms of the quality and safety of the product. The physicochemical properties suffered normal changes during the observation period, with the quality of the products remaining high. The products obtained in this study did not exceed the maximum values imposed by EU legislation regarding the TVB-N value during the 30 days of the experiment. Thus, the products are safe for consumption for at least 30 days after processing. The different packaging types used did not show any visible association with any of the physicochemical parameters during the observation period. The microbial activity of the smoked fish was present, but was very low, and hot smoking prevented bacterial proliferation. Indifferently of the used type of packaging, the PAHs content was under the maximum limit for both traditionally smoked fish species.
Using the traditional smoking method, hot and direct smoke is the only heat source used. Therefore, we recommend preheating the smoking chamber before fish exposure to smoke. Afterward, when the desired chamber temperature is reached, and the fire has burnt down to glowing embers, the fish should be placed into the smoking chamber. The temperature should be maintained by adding small pieces of beech wood if necessary, or fir branches to temper the fire, if the temperature is too high (the moisture engaged by fir branches lowers the temperature and therefore fewer PAHs should be produced).
This work improves the current database on PAHs, the physicochemical and microbiological parameters of traditional smoked rainbow and brook trout, providing a wide range of reference values. These parameters have a direct impact on the quality and safety of the smoked fish, this information being very useful for producers, consumers, and researchers.

Supplementary Materials

The following supporting information can be downloaded at: https://www.mdpi.com/article/10.3390/fishes8080424/s1, Table S1: Table of correlations.

Author Contributions

Conceptualization, A.S. and P.U.; methodology, P.U. and A.B.; validation, V.M., R.C. and D.C.; formal analysis, C.C. and C.L.; investigation, A.S. and P.U.; data curation, T.P., A.I., C.R. and C.M.; writing—original draft preparation, A.S., T.P. and P.U.; writing—review and editing, A.S., P.U., T.P., C.L. and G.-C.M.; supervision, R.C. and V.M. All authors have read and agreed to the published version of the manuscript.

Funding

This research received no external funding.

Institutional Review Board Statement

The study was approved by the Bioethics Commission of the University of Agricultural Sciences and Veterinary Medicine Cluj-Napoca (approval code: 145).

Data Availability Statement

Not applicable.

Conflicts of Interest

The authors declare no conflict of interest.

References

  1. D’Agaro, E.; Gibertoni, P.; Esposito, S. Recent trends and economic aspects in the rainbow trout (Oncorhynchus mykiss) sector. Appl. Sci. 2022, 12, 8773. [Google Scholar] [CrossRef]
  2. FAO. The State of World Fisheries and Aquaculture. Towards Blue Transformation. 2022. Available online: www.fao.org (accessed on 10 October 2022).
  3. Krešić, G.; Dujmić, E.; Lončarić, D.; Zrnčić, S.; Liović, N.; Pleadin, J. Fish Consumption: Influence of Knowledge, Product Information, and Satisfaction with Product Attributes. Nutrients 2022, 14, 2691. [Google Scholar] [CrossRef]
  4. Kitts, D.D.; Pratap-Singh, A.; Singh, A.; Chen, X.; Wang, S. A Risk–Benefit Analysis of First Nation’s Traditional Smoked Fish Processing. Foods 2023, 12, 111. [Google Scholar] [CrossRef] [PubMed]
  5. Arvanitoyannis, I.S.; Kotsanopoulos, K.V. Smoking of fish and seafood: History, methods and effects on physical, nutritional and microbiological properties. Food Bioprocess Technol. 2012, 5, 831–853. [Google Scholar] [CrossRef]
  6. European Commission. EUMOFA (European Market Observatory for Fisheries and Aquaculture Products). In Country Analyses; 2020 Edition; Publications Office of the European Union: Luxembourg, 2021; 59p, ISBN 978-92-76-28896-1. [Google Scholar] [CrossRef]
  7. Bilgin, Ş.; Ünlüsayın, M.; İzci, L.; Günlü, A. The determination of the shelf life and some nutritional components of gilthead sea bream (Sparus aurata L., 1758) after cold and hot smoking. Turk. J. Vet. Anim. Sci. 2008, 32, 49–56. [Google Scholar]
  8. Messina, C.M.; Arena, R.; Ficano, G.; La Barbera, L.; Morghese, M.; Santulli, A. Combination of freezing, low sodium brine, and cold smoking on the quality and shelf-life of sea bass (Dicentrarchus labrax L.) fillets as a strategy to innovate the market of aquaculture products. Animals 2021, 11, 185. [Google Scholar] [CrossRef] [PubMed]
  9. US Environmental Protection Agency (USEPA). Provisional Guidance for Quantitative Risk Assessment of Polycyclic Aromatic Hydrocarbons; EPA/600/R-93/089; Office of Research and Development, U.S. Environmental Protection Agency: Washington, DC, USA, 1993; 20p.
  10. Simko, P. Determination of polycyclic aromatic hydrocarbons in smoked meat products and smoke flavouring food additives. J. Chromatogr. B 2002, 770, 3–18. [Google Scholar] [CrossRef] [PubMed]
  11. Siskos, I.; Zotos, A.; Taylor, K.D.A. The effect of drying, pressure and processing time on the quality of liquid-smoked trout (Salmo gairdnerii) fillets. J. Sci. Food Agric. 2005, 85, 2054–2060. [Google Scholar] [CrossRef]
  12. Moret, S.; Conte, L.; Dean, D. Assessment of polycyclic aromatic hydrocarbon content of smoked fish by means of a fast HPLC/HPLC method. J. Agric. Food Chem. 1999, 47, 1367–1371. [Google Scholar] [CrossRef]
  13. Tongo, I.; Ogbeide, O.; Ezemonye, L. Human health risk assessment of polycyclic aromatic hydrocarbons (PAHs) in smoked fish species from markets in Southern Nigeria. Toxicol. Rep. 2017, 4, 55–61. [Google Scholar] [CrossRef]
  14. Tilgner, D.J.; Miler, K. The possibilities of eliminating carcinogens from curing smoke. Przemysł Spożywczy 1963, 17, 85–90. [Google Scholar]
  15. Stołyhwo, A.; Sikorski, Z.E. Polycyclic aromatic hydrocarbons in smoked fish—A critical review. Food Chem. 2005, 91, 303–311. [Google Scholar] [CrossRef]
  16. Mihalca, G.L.; Tita, O.; Tita, M.; Mihalca, A. Polycyclic aromatic hydrocarbons (PAHs) in smoked fish from three smoke-houses in Brasov County. J. Agroaliment. Process. Technol. 2011, 17, 392–397. [Google Scholar]
  17. Coroian, C.O.; Coroian, A.; Becze, A.; Longodor, A.; Mastan, O.; Radu-Rusu, R.-M. Polycyclic Aromatic Hydrocarbons (PAHs) Occurrence in Traditionally Smoked Chicken, Turkey and Duck Meat. Agriculture 2023, 13, 57. [Google Scholar] [CrossRef]
  18. European Commission (EC). Directive 2005/10/EC of 4 February 2005 laying down sampling methods and the methods of analysis for the official control of the levels of benzo(a)pyrene in foodstuffs. Off. J. Eur. Union 2005, L34, 15. [Google Scholar]
  19. The Romanian parliament. Legea nr. 43/2014 privind protecţia animalelor utilizate în scopuri ştiinţifice. Monitorul Oficial al României 2014, 326, 229. [Google Scholar]
  20. European Commission (EC). Directive 2010/63/EU of the European parliament and of the Council of 22 September 2010 on the protection of animals used for scientific purposes. Off. J. Eur. Union 2010, L276, 33–79. [Google Scholar]
  21. Kraemer, E.O.; Stamm, A.J. Mohr’s Method for the Determination of Silver and Halogens in other than Neutral Solutions. J. Am. Chem. Soc. 1924, 46, 2707–2709. [Google Scholar]
  22. SR ISO 937, 2007; PS-18, IL-18-07, Ed.3: Meat and Meat Products. Determination of Nitrogen Content (Reference Method). International Organization for Standardization (ISO): Geneva, Switzerland, 2007; 3p.
  23. SR ISO 1443, 2008; PS-20, IL-20-01, Ed.2: Meat and Meat Products. Determination of Total Lipids Content (Reference Method). International Organization for Standardization (ISO): Geneva, Switzerland, 2008; 2p.
  24. SR ISO 1442, 2010; PS-20, IL-20-06, Ed.2: Meat and Meat Products. Determination of Moisture Content (Reference Method). International Organization for Standardization (ISO): Geneva, Switzerland, 2010; 4p.
  25. SR ISO 2917, 2007; PS-19, IL-19-08, Ed.2: Meat and Meat Products. Determination of pH (Reference Method). International Organization for Standardization (ISO): Geneva, Switzerland, 2007; 6p.
  26. Ludorf, W.; Meyer, V. Fische und Fischerzeugnisse; Paul Parey Verlag: Berlin/Hamburg, Germany, 1973; 309p. [Google Scholar]
  27. European Commission (EC). Directive 95/149/EC: Commission Decision of 8 March 1995 fixing the total volatile basic nitrogen (TVB-N) limit values for certain categories of fishery products and specifying the analysis methods to be used. Off. J. Eur. Union 1995, L97, 84–87. [Google Scholar]
  28. Association of Official Analytical Chemist (AOAC). Official Methods of Analysis, 18th ed.; Association of Official Analytical Chemist (AOAC): Washington, DC, USA, 2000. [Google Scholar]
  29. EN ISO 11290-1; Microbiology of Food and Animal Feeding Stuffs—Horizontal Method for the Detection and Enumeration of Listeria monocytogenes—Part 1: Detection. International Organization for Standardization (ISO): Geneva, Switzerland, 1997.
  30. ISO 6579-1:2017; Microbiology of the Food Chain—Horizontal Method for the Detection, Enumeration and Serotyping of Salmonella—Part 1: Detection of Salmonella spp. International Organization for Standardization (ISO): Geneva, Switzerland, 2017.
  31. EN ISO 10273:2017; Microbiology of the Food Chain—Horizontal Method for the Detection of Pathogenic Yersinia enterocolitica. International Organization for Standardization (ISO): Geneva, Switzerland, 2017.
  32. BS ISO 16649-2:2001; Microbiology of Food and Animal Feeding Stuffs—Horizontal Method for the Enumeration of β-Glucuronidase-Positive Escherichia coli—Part 2: Colony-Count Technique at 44 °C Using 5-Bromo-4-chloro-3-indoyl β-D-glucuronide. International Organization for Standardization (ISO): Geneva, Switzerland, 2001.
  33. SR EN ISO 17993/2006; Water Quality. Determination of 15 Polycyclic Aromatic Hydrocarbons [PAH) in Water by HPLC with Fluorescence Detection after Liquid-Liquid Extraction. International Organization for Standardization (ISO): Geneva, Switzerland, 2006.
  34. RStudio Team. RStudio: Integrated Development for R; RStudio, Inc.: Boston, MA, USA, 2020; Available online: http://www.rstudio.com/ (accessed on 13 July 2022).
  35. Belichovska, D.; Belichovska, K.; Pejkovski, Z. Smoke and Smoked Fish Production. Sci. J. Meat Technol. 2019, 60, 37–43. [Google Scholar] [CrossRef]
  36. Wiernasz, N.; Gigout, F.; Cardinal, M.; Cornet, J.; Rohloff, J.; Courcoux, P.; Vigneau, E.; Skírnisdottír, S.; Passerini, D.; Pilet, M.-F.; et al. Effect of the Manufacturing Process on the Microbiota, Organoleptic Properties and Volatilome of Three Salmon-Based Products. Foods 2021, 10, 2517. [Google Scholar] [CrossRef] [PubMed]
  37. Tümerkan, A.E.T. Investigations of the Polycyclic Aromatic Hydrocarbon and Elemental Profile of Smoked Fish. Molecules 2022, 27, 7015. [Google Scholar] [CrossRef] [PubMed]
  38. Duman, M.; Kuzgun, N.K. Quality changes of nugget prepared from fresh and smoked rainbow trout during chilled storage. Br. Food J. 2018, 120, 2080–2087. [Google Scholar] [CrossRef]
  39. Sava, A.; Uiuiu, P.; Răducu, C.; Cocan, D.; Constantinescu, R.; Lațiu, C.; Coroian, A.; Ihuț, A.; Mireșan, V. Meat quality of traditionally smoked trout from Trecătoarea Ursului salmonid farm, Brașov County. Sci. Papers Ser. D Anim. Sci. 2020, 63, 427–432. [Google Scholar]
  40. Tosun, Ș.Y.; Özden, Ö. Survey of inhibition of Listeria monocytogenes in hot-smoked rainbow trout fillets for food safety. J. Food Process. Preserv. 2014, 38, 338–346. [Google Scholar] [CrossRef]
  41. Fıcıcılar, B.B.; Genccelep, H. A characterization study of hot smoked rainbow trout for each production stages. Int. J. Agric. Innov. Res. 2017, 6, 411–418. [Google Scholar]
  42. van Meer, G.; Voelker, D.R.; Feigenson, G.W. Membrane lipids: Where they are and how they behave. Nat. Rev. Mol. Cell Biol. 2008, 9, 112–124. [Google Scholar] [CrossRef]
  43. Erkan, N.; Tosun, S.Y.; Özden, Ö.; Ulusoy, S. Effects of modified atmosphere and vacuum packaging on inhibition of Listeria monocytogenes and quality in hot-smoked rainbow trout fillets. Arch. Lebensmittelhyg. 2009, 60, 23–29. [Google Scholar]
  44. Çoban, Ö.E.; Patir, B.; Yilmaz, Ö. Protective effect of essential oils on the shelf life of smoked and vacuum packed rainbow trout (Oncorhynchus mykiss W.1792) fillets. J. Food Sci. Technol. 2014, 51, 2741–2747. [Google Scholar] [CrossRef]
  45. Kiczorowska, B.; Samolińska, W.; Grela, E.R.; Bik-Małodzińska, M. Nutrient and mineral profile of chosen fresh and smoked fish. Nutrients 2019, 11, 1448. [Google Scholar] [CrossRef]
  46. Maga, J.A. Smoke in Food Processing; CRC Press: Boca Raton, FL, USA, 1988; 168p. [Google Scholar]
  47. Commission Regulation (EC). No 2074/2005 of 5 December 2005 laying down implementing measures for certain products under Regulation (EC) No 853/2004 of the European Parliament and of the Council and for the organization of official controls under Regulation (EC) No 854/2004 of the European Parliament and of the Council and Regulation (EC) No 882/2004 of the European Parliament and of the Council, derogating from Regulation (EC) No 852/2004 of the European Parliament and of the Council and amending Regulations (EC) No 853/2004 and (EC) No 854/2004. Off. J. Eur. Union 2005, L338, 27–59. [Google Scholar]
  48. Du, G.; Gai, Y.; Zhou, H.; Fu, S.; Zhang, D. Assessment of spoilage microbiota of rainbow trout (Oncorhynchus mykiss) during storage by 16S rDNA sequencing. J. Food Qual. 2022, 2022, 5367984. [Google Scholar] [CrossRef]
  49. Bienkiewicz, G.; Tokarczyk, G.; Czerniejewska-Surma, B.; Suryn, J. Changes in EPA and DHA content and lipids quality parameters of rainbow trout (Oncorhynchus mykiss, Walbaum) and carp (Cyprinus carpio, L.) at individual stages of hot smoking. Heliyon 2019, 5, e02964. [Google Scholar] [CrossRef] [PubMed]
  50. El-Lahamy, A.A.; Khalil, K.I.; El-Sherif, S.A.; Mahmud, A.A. Influence of smoking methods and refrigeration storage on physicochemical quality parameters of catfish (Clarias gariepinus) fillets. Oceanogr. Fish. 2019, 8, 155–159. [Google Scholar] [CrossRef]
  51. Mei, J.; Ma, X.; Xie, J. Review on natural preservatives for extending fish shelf life. Foods 2019, 8, 490. [Google Scholar] [CrossRef]
  52. Maillet, A.; Denojean, P.; Bouju-Albert, A.; Scaon, E.; Leuillet, S.; Dousset, X.; Jaffrès, E.; Combrisson, J.; Prévost, H. Characterization of Bacterial Communities of Cold-Smoked Salmon during Storage. Foods 2021, 10, 362. [Google Scholar] [CrossRef]
  53. Commission Regulation (EC). No 2073/2005 of 15 November 2005 on microbiological criteria for foodstuffs. Off. J. Eur. Union 2005, L338, 1–29. [Google Scholar]
  54. Mendonca, A.; Thomas-Popo, E.; Gordon, A. Microbiological considerations in food safety and quality systems implementation. In Food Safety and Quality Systems in Developing Countries; Academic Press: Cambridge, MA, USA, 2020; pp. 185–260. [Google Scholar] [CrossRef]
  55. Zaki, H.M.B.A.; Emara, M.M.T.; Abdallah, M.R.S. Effect of smoke duration on compositional analysis, deterioration criteria, microbial profile and sensory attributes of marine and freshwater fish: A comparative study. Adv. Anim. Vet. Sci. 2021, 9, 1259–1266. [Google Scholar]
  56. Jakhar, J.K.; Kumar, A.; Vardia, H.K. Hygienic and nutritional quality of Traditional dried and smoked fishes at Kawardha fish Market, Chhattisgarh, India. Bioscan 2015, 10, 1099–1102. [Google Scholar]
  57. Sulieman, A.M.E.; Mustafa, W.A.; Osman, O.A.; Shommo, S.A. Assessment of the Quality of Smoked Fish Obtained from White Nile River. Bull. Environ. Pharmacol. Life Sci. 2018, 7, 20–25. [Google Scholar]
  58. Abdul-Baten, M.D.; Won, N.E.; Mohibbullah, M.D.; Yoon, S.J.; Sohn, J.H.; Kim, J.S.; Choi, J.S. Effect of hot smoking Treatment in improving Sensory and Physicochemical Properties of processed Japanese Spanish Mackerel (Scomberomorus niphonius). Food Sci. Nutr. 2020, 8, 3957–3968. [Google Scholar] [CrossRef] [PubMed]
  59. Rana, M.M.; Mohibbullah, M.; Won, N.E.; Baten, M.A.; Sohn, J.H.; Kim, J.-S.; Choi, J.-S. Improved Hot Smoke Processing of Chub Mackerel (Scomber japonicus) Promotes Sensorial, Physicochemical and Microbiological Characteristics. Appl. Sci. 2021, 11, 2629. [Google Scholar] [CrossRef]
  60. Chen, B.H. Analysis, Formation and Inhibition of Polycyclic Aromatic Hydrocarbons in Foods. An Overview. J. Food Drug Anal. 1997, 5, 25–42. [Google Scholar] [CrossRef]
  61. Zelinkova, Z.; Wenzl, T. The occurrence of 16 EPA PAHs in food—A review. Polycycl. Aromat. Compd. 2015, 35, 248–284. [Google Scholar] [CrossRef]
  62. Jinadasa, B.K.K.K.; Monteau, F.; Fowler, S.W. Review of polycyclic aromatic hydrocarbons (PAHs) in fish and fisheries products; a Sri Lankan perspective. Environ. Sci. Pollut. Res. 2020, 27, 20663–20674. [Google Scholar] [CrossRef]
  63. Abdel-Shafy, H.I.; Mansour, M.S.M. A review on polycyclic aromatic hydrocarbons: Source, environmental impact, effect on human health and remediation. Egypt. J. Pet. 2016, 25, 107–123. [Google Scholar] [CrossRef]
  64. European Commission (EC). Regulation No. 1881/2006/EC of 19 December 2006 setting maximum levels for certain contaminants in foodstuffs with amendments. Off. J. Eur. Union. 2006, L364, 5–24. [Google Scholar]
  65. Commission Regulation (EU). 2020/1255 of 7 September 2020 amending Regulation (EC) No 1881/2006 as regards maximum levels of polycyclic aromatic hydrocarbons (PAHs) in traditionally smoked meat and smoked meat products and traditionally smoked fish and smoked fishery products and establishing a maximum level of PAHs in powders of food of plant origin used for the preparation of beverages. Off. J. Eur. Union. 2020, L293/1, 1–4. [Google Scholar]
  66. Bogdanović, T.; Pleadin, J.; Petričević, S.; Listeš, E.; Sokolić, D.; Marković, K.; Ozogul, F.; Šimat, V. The occurrence of polycyclic aromatic hydrocarbons in fish and meat products of Croatia and dietary exposure. J. Food Compos. Anal. 2019, 75, 49–60. [Google Scholar] [CrossRef]
  67. Duedahl-Olesen, L.; Christensen, J.H.; Højgård, A.; Granby, K.; Timm-Heinrich, M. Influence of smoking parameters on the concentration of polycyclic aromatic hydrocarbons (PAHs) in Danish smoked fish. Food Addit. Contam. Part A 2010, 27, 1294–1305. [Google Scholar] [CrossRef]
  68. Ova, G.; Onaran, S. Polycyclic aromatic hydrocarbons contamination in salmon-trout and eel smoked by two different methods. Adv. Food Sci. 1998, 20, 168–172. [Google Scholar]
Figure 1. (a) Protein content values variation over time; (b) Protein content values in the two analyzed species (O. mykiss—Om and S. fontinalis—Sf). Plots represent median (line inside the box) values, 25–75 percent quartiles (boxes), and minimal and maximal values, shown with short horizontal lines (“whiskers”). Outliers are represented with an open circle sign.
Fishes 08 00424 g001
Figure 2. Nitrogen content values variation in time, and for the two analyzed species (O. mykiss—Om and S. fontinalis—Sf). Plots represent median (line inside the box) values, 25–75 percent quartiles (boxes), and minimal and maximal values, shown with short horizontal lines (“whiskers”).
Fishes 08 00424 g002
Figure 3. (a) Total lipid content values variation over time; (b) Lipid content in the two analyzed species (O. mykiss—Om and S. fontinalis—Sf). Plots represent median (line inside the box) values, 25–75 percent quartiles (boxes), and minimal and maximal values, shown with short horizontal lines (“whiskers”). Outliers are represented with an open circle sign.
Fishes 08 00424 g003
Figure 4. (a) Moisture content in the two analyzed species (O. mykiss—Om and S. fontinalis—Sf); (b) Moisture content values variation in time and for the two analyzed species (O. mykiss—Om and S. fontinalis—Sf). Plots represent median (line inside the box) values, 25–75 percent quartiles (boxes), and minimal and maximal values, shown with short horizontal lines (“whiskers”).
Fishes 08 00424 g004
Figure 5. (a) The pH of the samples in the two analyzed species (O. mykiss—Om and S. fontinalis—Sf); (b) pH values of the samples in time and for the two analyzed species (O. mykiss—Om and S. fontinalis—Sf). Plots represent median (line inside the box) values, 25–75 percent quartiles (boxes), and minimal and maximal values, shown with short horizontal lines (“whiskers”). Outliers are represented with an open circle sign.
Fishes 08 00424 g005
Figure 6. TVB-N values variation in time. Plots represent median (line inside the box) values, 25–75 percent quartiles (boxes), and minimal and maximal values, shown with short horizontal lines (“whiskers”).
Fishes 08 00424 g006
Figure 7. Values of Mean Total Aerobic Mesophilic Bacteria (TAMB, CFU/g) in the two analyzed species (O. mykiss—Om and S. fontinalis—Sf) after 30 days of storage (T30) with different packaging types (bars represent mean values and error bars represent one standard deviation).
Fishes 08 00424 g007
Figure 8. Content of the nine PAHs (ng/g) detected in samples of O. mykiss and S. fontinalis in the control (at T0) and after 30 days (T30) with different types of packaging. Naph = Naphthalene, Acen = Acenaphtene, Fluo = Fluorene, Phen = Phenanthrene, Anth = Anthracene, Flran = Fluoranthene, Pyre = Pyrene, Baanth = Benzo(a)anthracene, and Chry = Chrysene. Different colors represent percentages of each PAH from all PAHs detected, and values inside or next-to pie-chart slices represent absolute values detected expressed in ng/g.
Fishes 08 00424 g008
Table 1. Results of the parametric and non-parametric comparisons of the physicochemical parameter variations in the two investigated fish species (Om and Sf) at different times and with different packaging methods.
VariableType of ComparisonEffectDF *χ2 Value/
F Value/W Value *
p Value *
ProteinANCOVATime314.27<0.001
Species17.920.012
Time + Species32.450.100
ANOVAPackaging type30.790.511
NitrogenANCOVATime39.37<0.001
Species15.200.035
Time + Species31.380.281
ANOVAPackaging type30.620.61
Total
Lipids
Kruskal-WallisTime313.770.003
Packaging type321.300.380
WilcoxonSpecies157.000.166
MoistureKruskal-WallisTime35.280.153
Packaging type36.1470.105
WilcoxonSpecies1140.500.004
pHKruskal-WallisTime37.350.062
Packaging type31.450.694
WilcoxonSpecies1129.000.023
TVB-N *ANCOVATime3148.29<0.001
Species10.070.793
Time + Species30.140.937
ANOVAPackaging type30.090.962
* TVB-N = total volatile basic nitrogen; DF = degrees of freedom; χ2 Value = test statistic value in the case of parametric tests; W Value—test statistic in the case of non-parametric tests; p value significance threshold was considered at 0.05.
Disclaimer/Publisher’s Note: The statements, opinions and data contained in all publications are solely those of the individual author(s) and contributor(s) and not of MDPI and/or the editor(s). MDPI and/or the editor(s) disclaim responsibility for any injury to people or property resulting from any ideas, methods, instructions or products referred to in the content.

