Article

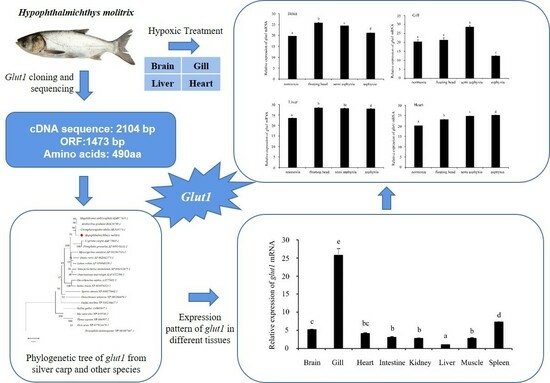
Molecular Characterization and Response of Silver Carp (Hypophthalmichthys molitrix) GLUT1 under Hypoxia Stress

1
Yangtze River Fisheries Research Institute, Chinese Academy of Fishery Sciences, Wuhan 430223, China
2
School of Life Sciences/Hebei Basic Science Center for Biotic Interaction, Institute of Life Science and Green Development, Hebei University, Baoding 071002, China
3
Hubei Hongshan Laboratory, Huazhong Agricultural University, Wuhan 430070, China
*
Authors to whom correspondence should be addressed.
Fishes 2023, 8(8), 425; https://doi.org/10.3390/fishes8080425
Submission received: 25 June 2023 / Revised: 16 August 2023 / Accepted: 18 August 2023 / Published: 20 August 2023
(This article belongs to the Special Issue Response of Aquatic Animals to Environmental Changes)

Abstract

:
As an important freshwater species with economic and ecological benefits, silver carp (Hypophthalmichthys molitrix) exhibits poor tolerance to hypoxia. Glucose transporters (GLUTs) are core membrane proteins that transport glucose to tissues and regulate essential life activities. Its expression is regulated by HIF-1α and cells in hypoxic conditions to maintain energy demand through GLUTs inducing enhanced glucose transport. We cloned H. molitrix glut1 (SLC2A1) and analyzed its sequence using bioinformatics tools. The glut1 cDNA was 2104 base pairs long and encoded a 490 amino acid protein. Phylogenetic analysis revealed that sliver carp glut1 is evolutionarily conserved and exhibited the highest sequence similarity with Ctenopharyngodon idella glut1. Glut1 expression was the highest and lowest in the gills and liver, respectively. Hypoxic stress significantly increased glut1 expression in the brain (p < 0.05); in the gills, it was the highest and lowest in the semi-asphyxia and asphyxia groups, respectively; in the liver, it was significantly higher under hypoxia than that of the normoxia group; and in the heart, it was significantly higher in the floating head, semi-asphyxia, and asphyxia groups than in the normoxia group (p < 0.05). The proposed mechanism may thus provide the basis for elucidating the molecular basis of silver carp’s hypoxia stress response mediated by glut1.
Key Contribution: Studying the expression patterns of the glut1 gene in eight different tissues and exploring the tissue response of liver, brain, heart, and gills under hypoxic stress are the objectives of this study. These results contribute to further studying the response mechanism of the glut1 gene to hypoxic stress.

Graphical Abstract

1. Introduction

Silver carp, Hypophthalmichthys molitrix, is one of the main freshwater fish in China, ranking second in terms of aquaculture yield in 2022, playing an important role in China’s freshwater aquaculture industry [1]. Silver carp have long been an important source of protein for the general public in China due to its excellent quality, low price, rich nutrition, and sufficient supply. With the development of industrialization, excessive nitrogen and phosphorus in the water can lead to the outbreak of algae. As a filter-feeding fish, silver carp mainly feed on phytoplankton, thereby inhibiting the outbreak of cyanobacteria and regulating water quality [2,3,4]. Silver carp have been introduced in over 88 countries to provide ecological benefits [5].
Dissolved oxygen (DO) is closely related to the survival and growth of fish. When the water dissolved oxygen is lower than 2 mg/L, the fish lack oxygen and their reproduction is adversely affected [6]. Silver carp have poor tolerance to low oxygen and are prone to death due to hypoxia during high-density breeding in summer. Therefore, the response mechanism of silver carp to hypoxia should be investigated.
Reactive oxygen species (ROS) are reactive oxygen radicals that are naturally produced by oxygen metabolism. During sustained hypoxia, ROS levels will sharply increase, leading to an increase in oxidative stress and cell apoptosis [7,8,9]. It has been reported that hypoxia can produce physiological and biochemical changes in the gills, liver, brain and heart of silver carp [10,11,12]. Under hypoxic stress, the blood indicators (red blood cells, white blood cells, hemoglobin) and antioxidant oxidative stress system (GSH-PX, CAT, SOD) of tissues are activated, indicating that the body improves oxygen delivery by increasing hemoglobin concentrations and responds to the damage caused by hypoxic stress by increasing the antioxidant capacity. Studies have shown that tissue sections indicate severe hypoxic stress may cause tissue and organ damage and even death [12]. The GO enrichment analysis of differential proteins in the liver and brain of silver carp under hypoxic stress shows that the glycolipid transporter is one of the most important components [10].
GLUT1, known as red blood cell glucose transporter protein, is a member of the GLUT family and was identified by Zhong et al. in crucian carp embryonic cells using suppression subtractive hybridization technology. It is encoded by the SLC2A1 (solute carrier family 2-facilitated glucose transporter member 1) gene, and its expression is regulated by transcription factors, such as HIF-1 α and c-Myc [13]. Under hypoxia, the DNA binding site of HIF-1α is activated by HIF-L, which increases glut1 expression, thus enhancing glucose uptake and cell metabolism, improving tolerance to hypoxia [14]. C-Myc promotes the transcription of glut1 and increases the glucose uptake of cells under hypoxic conditions [15]. After reoxygenation, c-Myc inhibits HIF-1 expression by regulating mitochondrial coding genes, thereby reducing the transcription of glut1. Previous studies have shown that GLUTs are induced to enhance glucose transport and maintain cellular energy requirements [16,17,18]. However, studies on the regulation or tissue-specific expression pattern of glut1 under hypoxic stress are still limited [19,20]. Therefore, it is economically and ecologically important to explore the response mechanism of silver carp to glut1 under hypoxic stress.
In this study, glut1 was cloned and identified, and the specific expression patterns of glut1 in different tissues of silver carp were analyzed. At the same time, the transcriptional response of glut1 in the brain, gill, liver and heart tissues of silver carp under different oxygen concentrations was studied.

2. Materials and Methods

2.1. Experimental Fish

The fish were cultured at the Silver Carp Genetics and Breeding Center of the Chinese Academy of Fisheries, Yangtze River Research Institute, Ministry of Agriculture and Rural Affairs (Jingzhou, Hubei, China). Before the experiment, in a recirculating freshwater system equipped with a water tank, the fish were temporarily housed for two weeks (water temperature 23.5 ± 0.5 °C, dissolved oxygen > 6 mg/L). The fish were fed with pellet feeds twice daily and stop feeding 24 h before the start of the experiment.

2.2. Experimental Design

After the adaption conditions, 120 silver carp with a body length of 22.1 ± 0.8 cm and a weight of 200 ± 12.4 g were selected and randomly divided into a normoxia group (normal oxygen group), floating head group, semi-asphyxia group, and asphyxia group (10 fish/tank, 3 tank/group).
The temperature of the water in the tanks was maintained at 23.0 ± 0.53 °C. The DO level (6.42 ± 0.3 mg/L) in the normoxia tanks was the same as that of the water used for the experiment, and the tanks were sealed with a plastic film. During the experiment, we used portable multi-parameter instruments (HACH, HQ40d, Loveland, CO, USA) every 20 min to monitor the DO values, and the values were adjusted as required to maintain the hypoxia status. In the floating head group (DO level: 0.76 ± 0.03 mg/L), five fish were randomly sampled after all fish exhibited the floating head phenomenon (after 1.5 h of hypoxic treatment). In the semi-asphyxia group (DO level: 0.58 ± 0.06 mg/L), after half of the fish had died (after 2 h of hypoxic treatment), the alive carp were collected as samples. In the asphyxia group (DO level: 0.53 ± 0.01 mg/L), after all fish had died (after 2.5 h of hypoxic treatment), five were randomly selected from each tank as the asphyxia group samples. Before sampling, the fish were anesthetized using 100 ppm tricaine methane sulfonate (MS-222, Sigma, Livonia, MI, USA), and the fish entered an anesthesia state for approximately two minutes. Liver, brain, heart and gill tissues of the silver carp were collected from the hypoxia experimental groups. Each processing group completed sampling within 15 min. The tissue samples were placed into separate cryopreservation tubes, quick-frozen in liquid nitrogen, and stored at −80 °C in an ultra-low-temperature refrigerator until use. All experimental protocols on silver carp for this study were in accordance with the guiding principles approved by the Chinese Academy of Fishery Sciences (Wuhan, China), Yangtze River Fisheries Research Institute Animal Care.

2.3. Total RNA Extraction and cDNA Synthesis

Eight different tissues (brain, gill, heart, intestine, liver, kidney, muscle, and spleen) collected at normal oxygen levels were used in the tissue expression experiments. Four different tissues (brain, gill, heart, liver) collected from three hypoxia treatment groups were used to analyze the response of tissue under hypoxia.
Trizol (Invitrogen, Waltham, MA, USA) was used to extract the total RNA. For quality, to determine the purity and concentration of RNA, an NanoPhotometer® NP80 (IMPLEN, Munchen, Germany) was used, and a 1% agarose gel electrophoresis was used to determine the integrity of the total RNA. A reverse transcription of the RNA was performed to generate cDNA using a HiScript cDNA Synthesis Kit (Nanjing Vazyme Biotechnology Co., Ltd., Nanjing, China), and the cDNA was stored at −20 °C until further experiments.

2.4. Glut1 Cloning and Sequencing

The cDNA and first strand of the rapid amplification of cDNA ends (RACE) cDNA were synthesized using high-quality RNA as the template and a Goldenstar TM RT6 cDNA Synthesis Kit (Beijing Qingke Biology Co., Ltd., Beijing, China) and SMARTer® RACE cDNA 5′/3′ Kit (Dalian, Takara), respectively, according to the manufacturer’s instructions, and the products were stored at −20 °C. Next, we designed the core segment primers using the primer Premier 5.0 according to the nucleotide sequence of glut1 in the silver carp transcriptome database (BioProject ID: PRJNA705843) (Table 1). PCR was performed using the cDNA reverse transcribed from the RNA extracted from the silver carp gill tissue and used as a template. The reaction volume was 25 μL, and the reaction conditions were as follows: pre-denaturation at 98 °C for 2 min; 35 cycles of 98 °C for 10 s, 65 °C for 10 s, and 72 °C for 20 s; final extension at 72 °C for 2 min; and incubation at 4 °C for 10 min. The amplicons were subjected to 1% agarose gel electrophoresis and sent to Tianyihuiyuan Biotech Company (Wuhan, Hube, China) for sequencing. The sequencing results were splintered and compared with the glut1 sequence present in the transcriptome library. Next, we designed 3ʹ-RACE-specific primers based on the sequenced target fragment. The 3′-RACE cDNA was used as the template to amplify the 3ʹ-end of the target fragment using a SMARTer® RACE kit (Takara Co., Ltd., Dalian, China) as per the manufacturer’s instructions. Primer GSP1 and connector primer UPM (Table 1) were used for the initial round of polymerase chain reaction (PCR), and the reaction conditions were as follows: an initial denaturation step at 94 °C for 3 min, followed by 25 cycles consisting of denaturation at 94 °C for 30 s, annealing at 62 °C for 30 s, and extension at 72 °C for 90 s. Subsequently, an additional 25 cycles were performed with denaturation at 94 °C for 30 s, annealing at 60 °C for 30 s, and extension at 72 °C for 90 s. The PCR reaction was concluded with a final extension step at 72 °C for 10 min. Next, the 5 μL first-round PCR product was diluted 50 times, and the 2 μL diluted product was used for nested PCR. GSP2 and UPM SHORT (RACE primer) primers were used for this step. The reaction conditions were as follows: 94 °C for 3 min; 35 cycles of 94 °C for 30 s, 60 °C for 30 s, and 72 °C for 90 s; and a final extension at 72 °C for 10 min. The amplicons were subjected to gel electrophoresis and purified using a DNA gel purification kit (Takara Co., Ltd., Dalian, China). The purified product was cloned into a pMD-18T vector (Takara Co., Ltd., Dalian, China) and transformed into Escherichia coli DH5α competent cells. The positive monoclonal strain was selected for sequence verification.

2.5. Bioinformatics Analysis of glut1

To obtain the glut1 cDNA sequences, positive colonies of TA clones were sequenced and assembled. The ORF finder (https://www.ncbi.nlm.nih.gov/orffinder, accessed on 2 September 2022) was used to deduce the glut1 open reading frame (ORF) and its coding sequence of amino acids. NCBI BLAST was used to analyze its homologous sequence (https://blast.ncbi.nlm.nih.gov/Blast.cgi, accessed on 8 September 2022). ProtParam (https://web.expasy.org/protparam/, accessed on 10 September 2022) was used to predict the physical and chemical properties of protein, and we identified the protein isoelectric point (pI) and relative molecular mass. NetPhos 3.1 was used to identify phosphorylation sites (http://www.cbs.dtu.dk/services/NetPhos/, accessed on 20 September 2022). Protein glycosylation sites were predicted using NGlyc 1.0 (http://www.cbs.dtu.dk/services/NetNGlyc/, accessed on 23 September 2022). A phylogenetic tree was constructed using the neighbor connection (NJ) method, and 1000 guided replicas were performed using MEGA 11 (MEGA Limited, Auckland, New Zealand).

2.6. Fluorescence Quantitative PCR (qPCR) Analysis

Specific primers (Table 1) were designed to investigate the expression of glut1 in these tissues (glut1-qPCR-F, glut1-qPCR-R); β-actin was used as the internal control. The reaction mixture was as follows: 10.0 μL of 2 × ChamQ Universal SYBR qPCR Master Mix, 0.4 μL of primer 1 (10 µmol/L), 0.4 μL of primer 2 (10 µmol/L), 0.8 μL of template cDNA, and 8.4 μL of ddH2O. The reaction mixture was centrifuged, added to a 96-well plate, and placed in a fluorescence quantitative PCR to determine the relative expression levels of the gene in different tissues. Each sample had three replicates. The reaction conditions were as follows: 95 °C for 5 min; 40 cycles of 95 °C for 15 s, 60 °C for 30 s, and 95 °C for 15 s; 60 °C for 1 min; and 95 °C for 15 s.

2.7. Statistical Analysis

Data were analyzed using a one-way analysis of variance (ANOVA), with p > 0.05 considered statistically significant. GraphPad Prism 9.0 was used for figure design.

3. Results

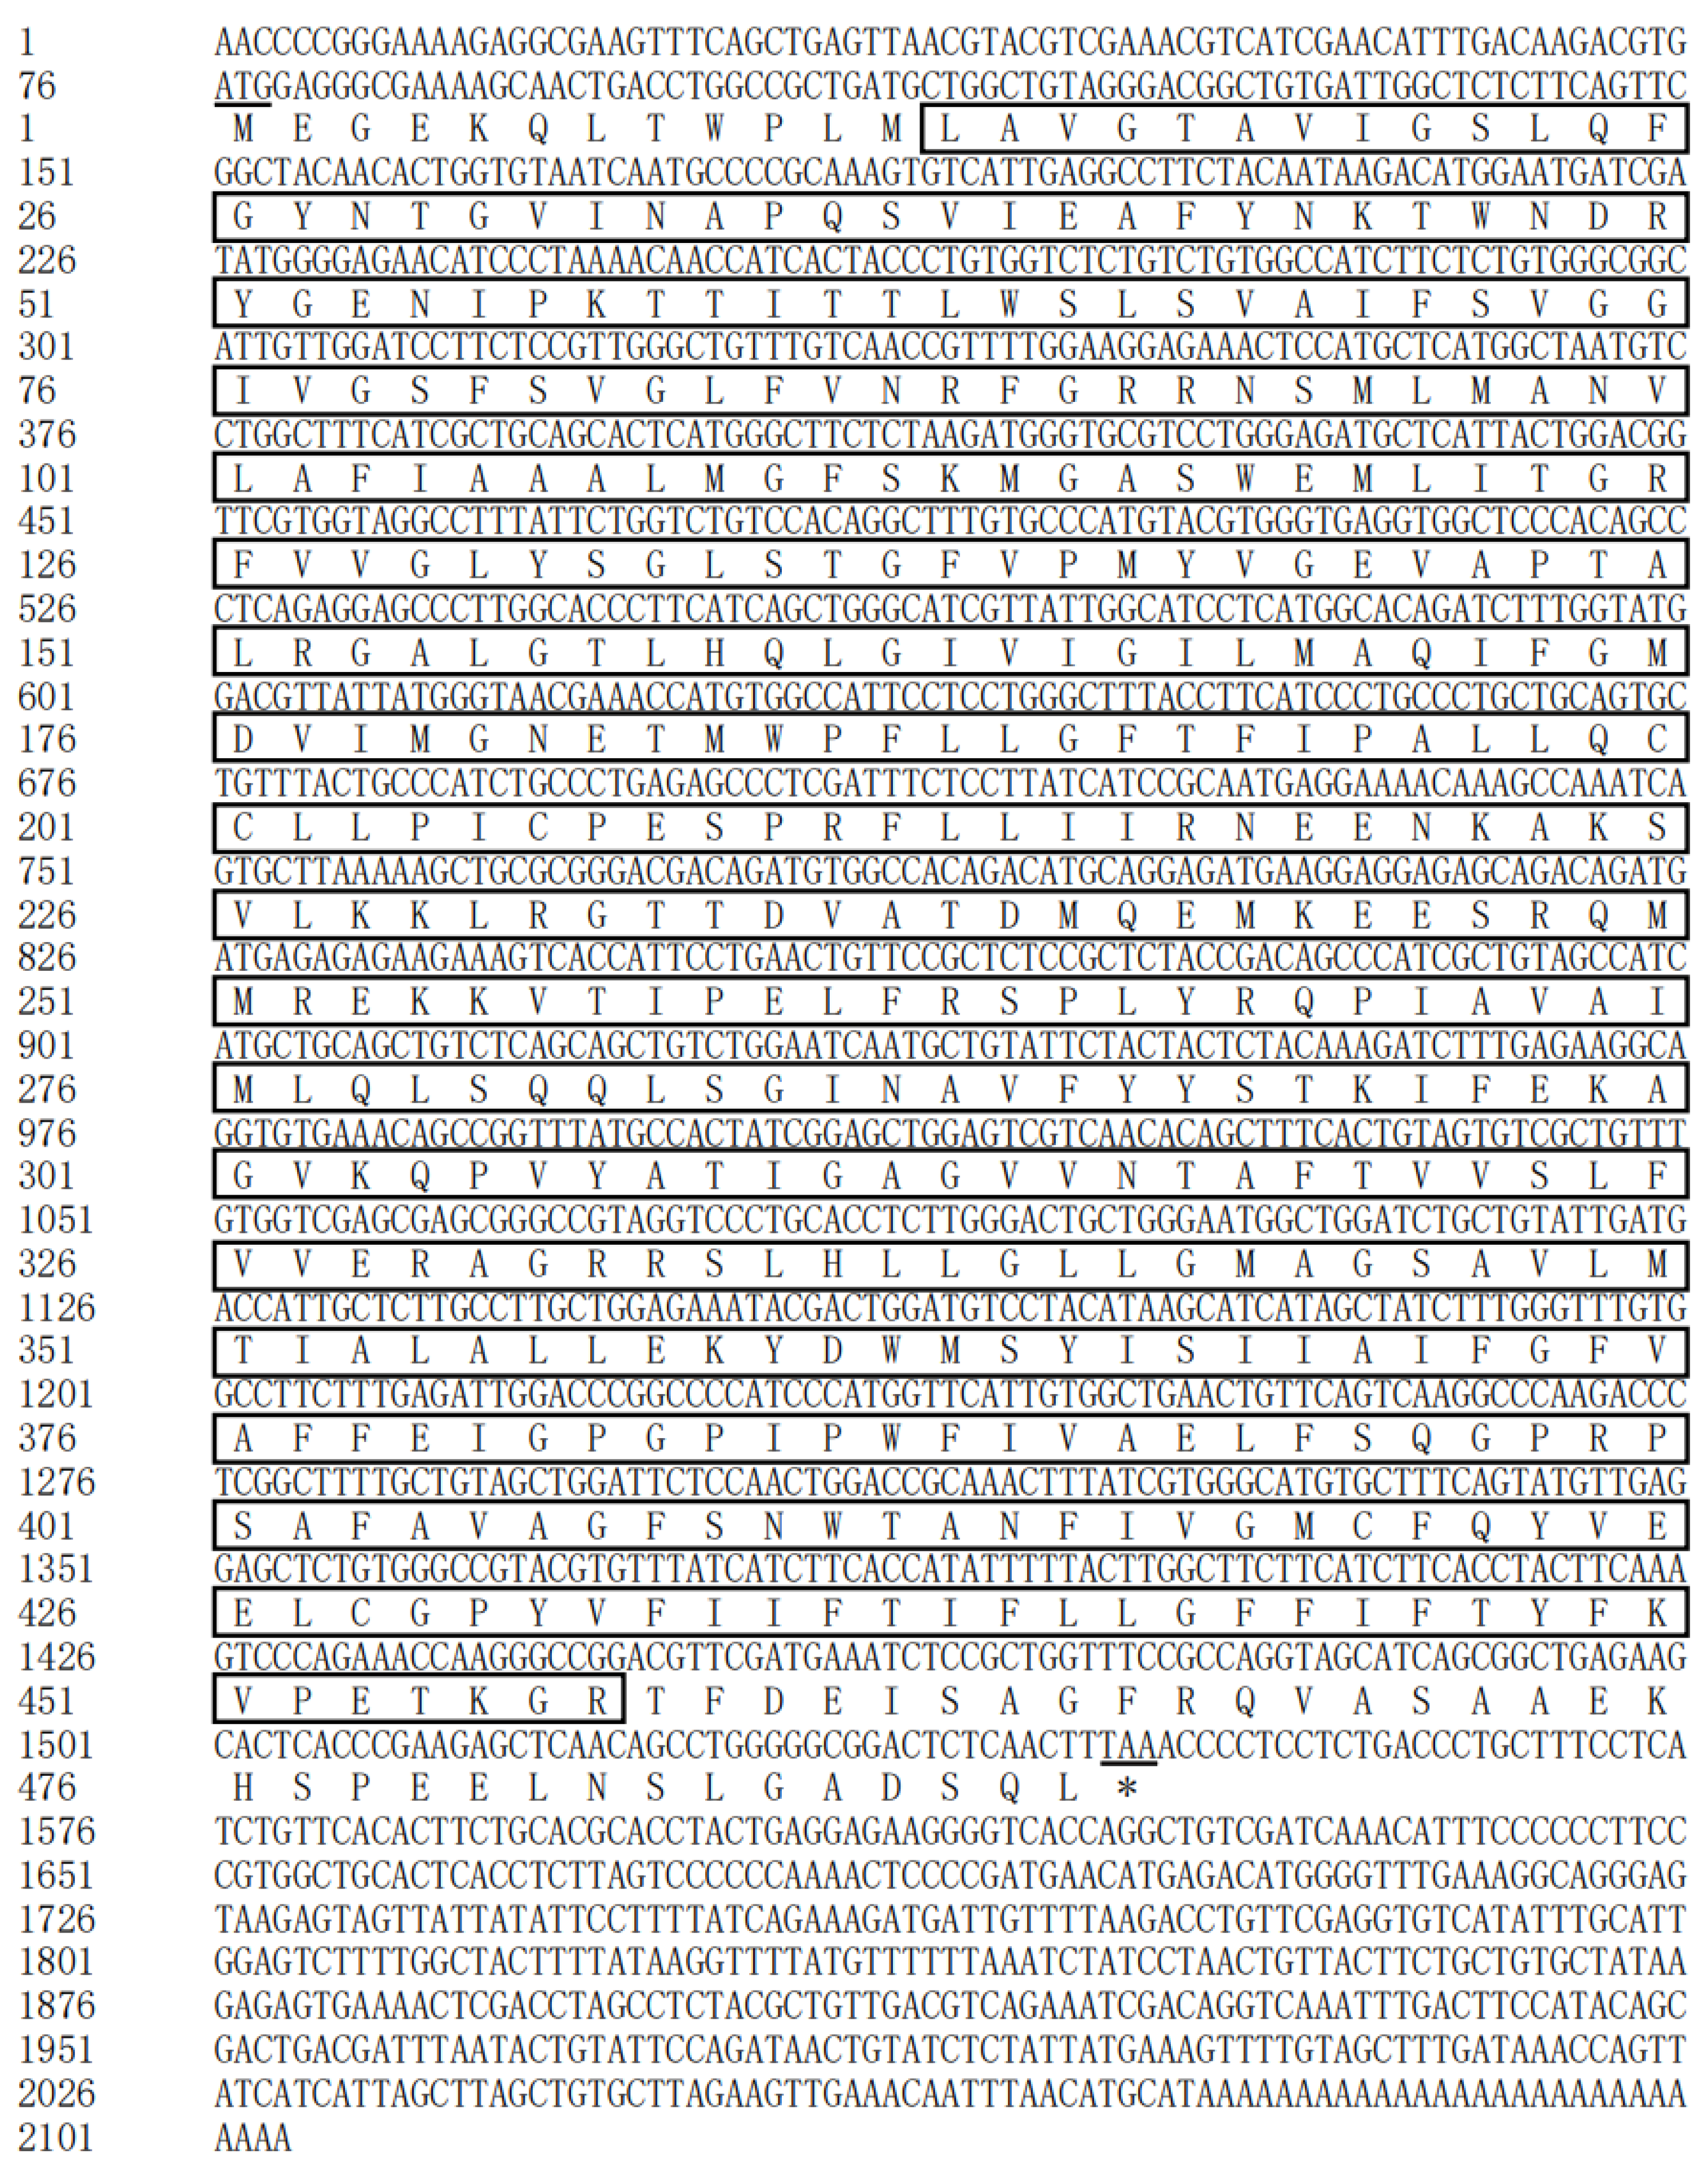
3.1. Glut1 Sequence Analysis

The glut1 cDNA sequence was 2104 base pairs (bp) in length, contained a 1473 bp ORF encoding 490 amino acids, a 75 bp 5′-untranslated region (UTR), and a 556 bp 3′-UTR (Figure 1, Table S1). The relative molecular weight of the glut1 protein was 53.92 kD, and the predicted pI was 8.47 as per the ProtParam software; the protein contained 34 and 37 strongly acidic (Asp + Glu) and basic amino acids (Arg + Lys), respectively. The amino acid sequence included 22 serine (Ser), 10 threonine (Thr), and 4 tyrosine (Tyr) phosphorylation sites. The instability index (II) of glut1 was 36.36, the average hydrophilic index (GRAVY) was 0.487, and the fat index was 101.69, which indicated that the protein was stable and hydrophobic.

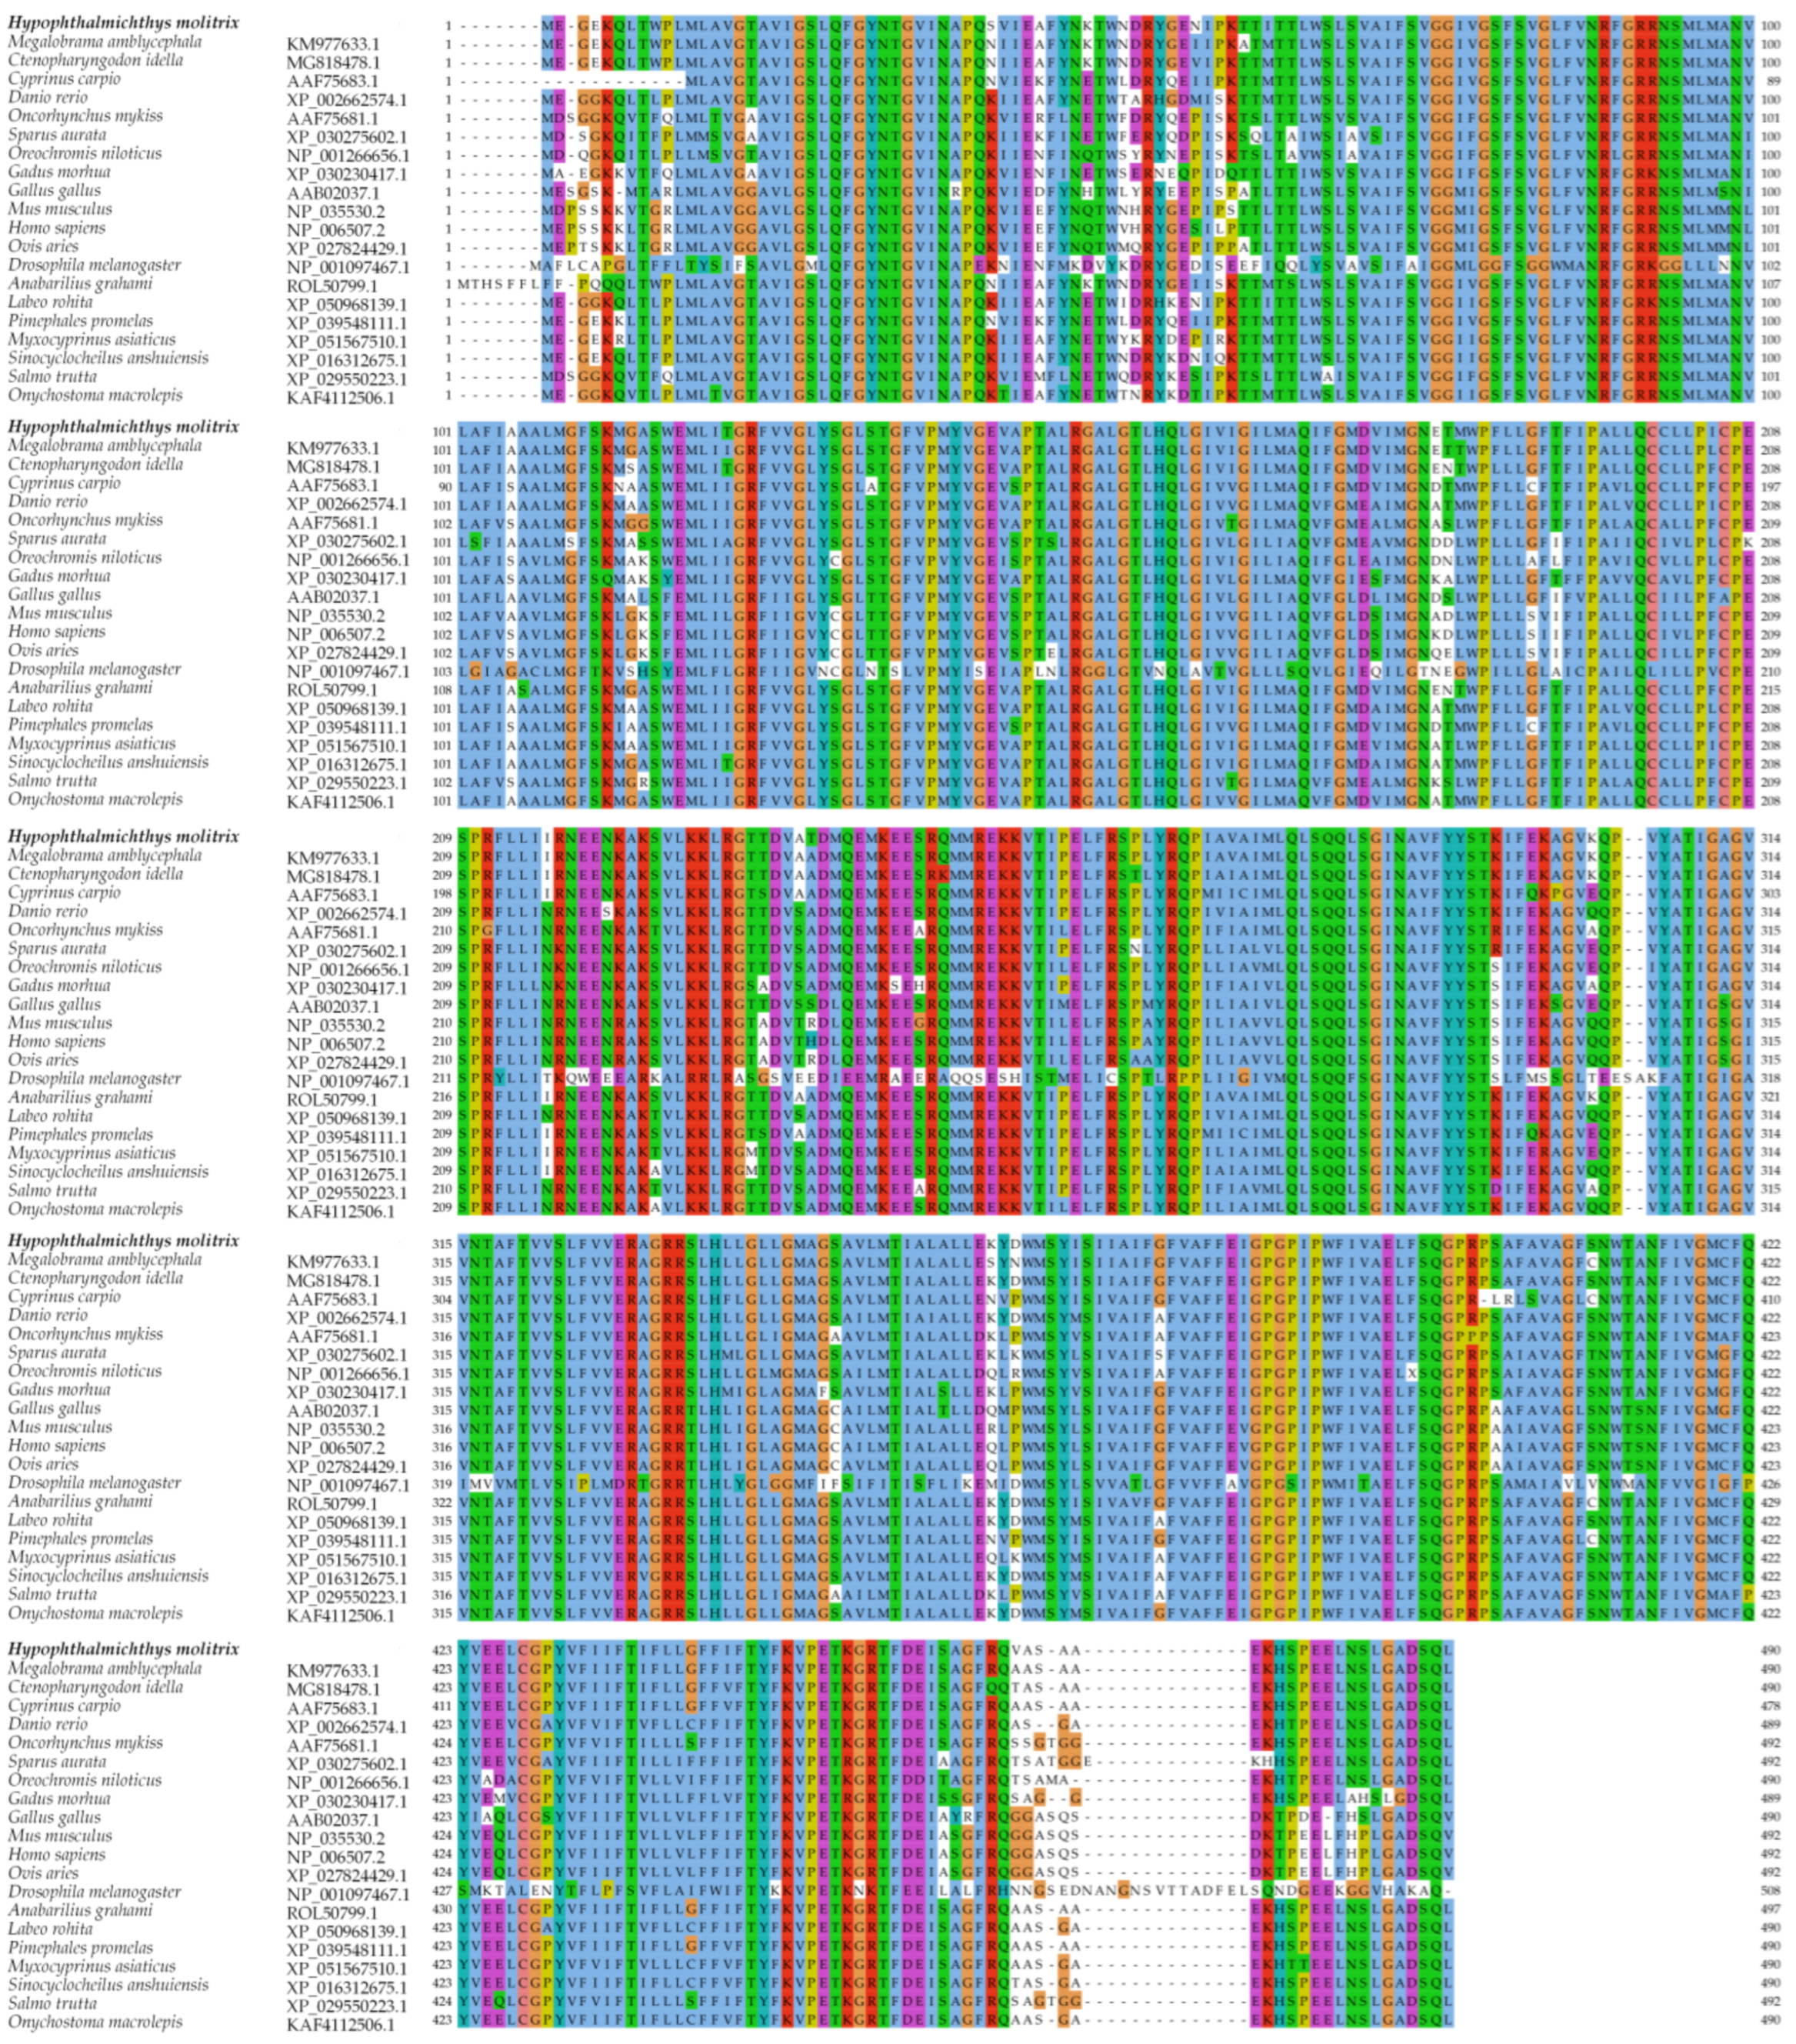
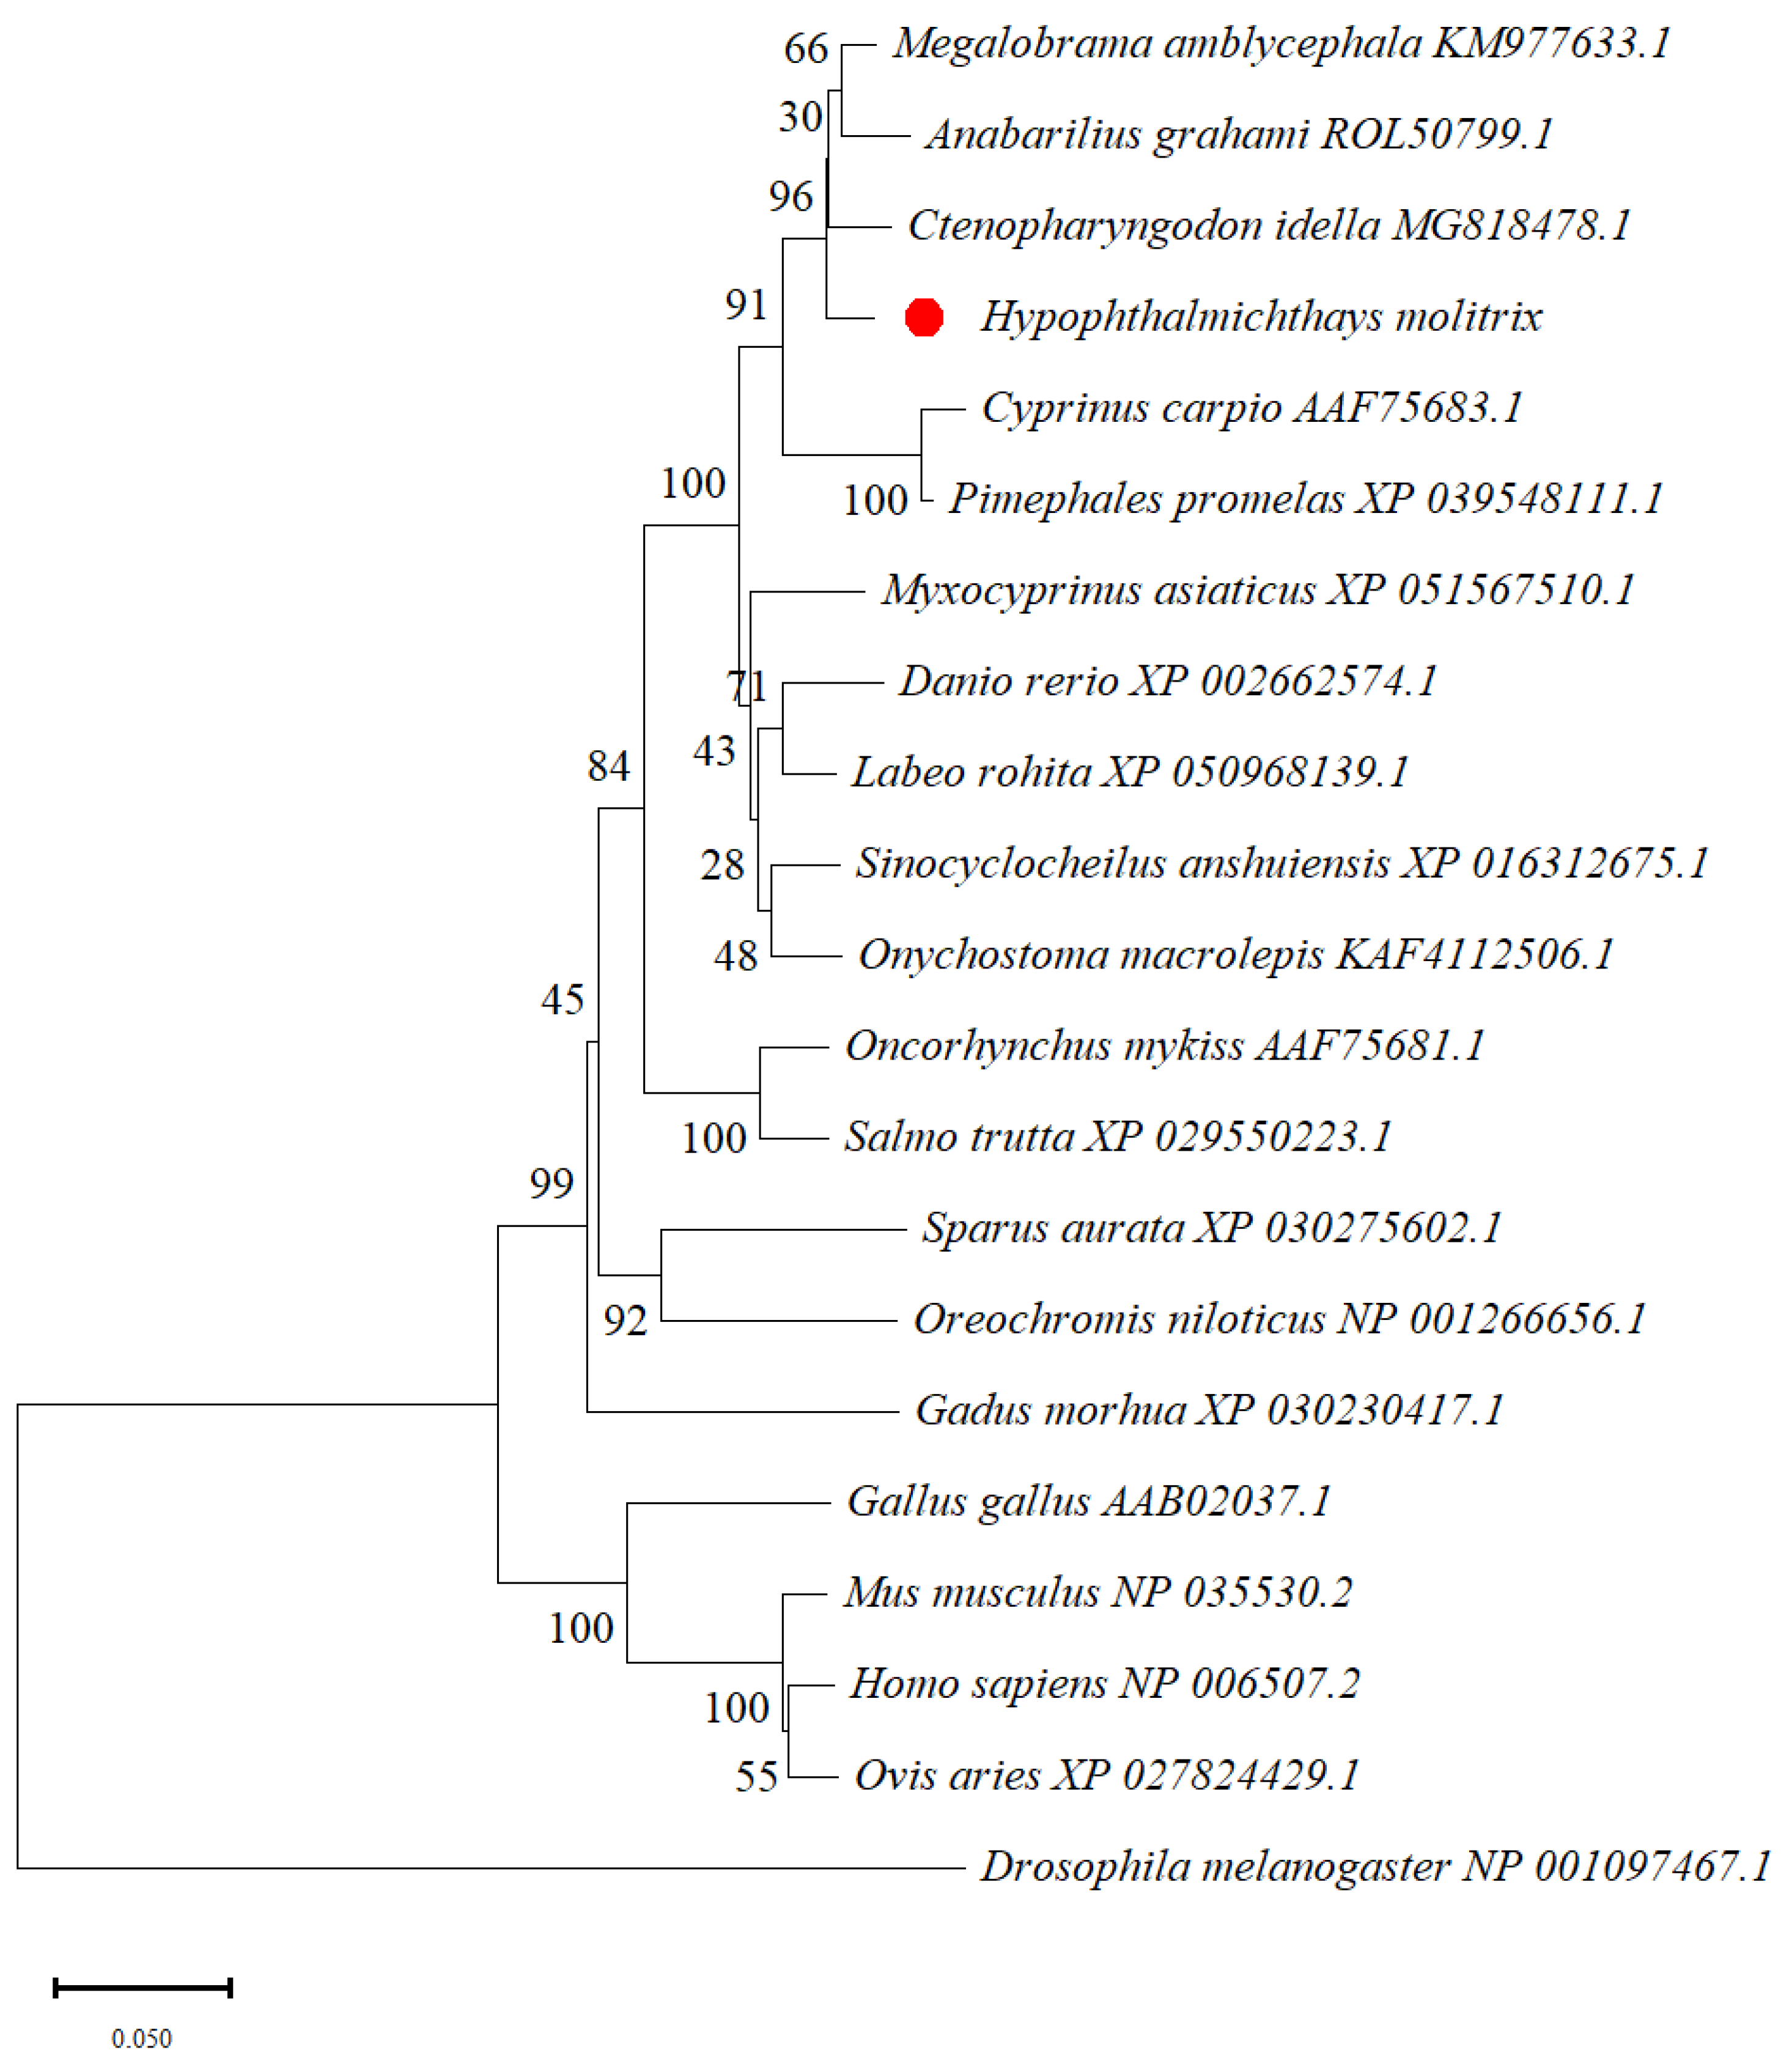
3.2. Homology and Phylogenetic Tree Analysis of Silver Carp glut1

Homology analysis sequence alignment of the amino acid sequences of glut1 in different species showed that the amino acid sequences of silver carp glut1 were highly homologous with those of other species, and this sequence was relatively conserved (Table 2, Figure 2). The glut1 phylogenetic tree (Figure 3) revealed that silver carp first clustered with the Megalobrama into a small branch, and then clustered into a large branch with other fish, indicating that the silver carp had the closest genetic relationship with Ctenopharyngodon idella; finally, this branch clustered into a branch with mammals. Silver carp exhibited the maximum distance from insects (fruit flies), followed by mammals (humans, mice, and sheep). These results confirmed that the glut1 sequence was highly conserved.

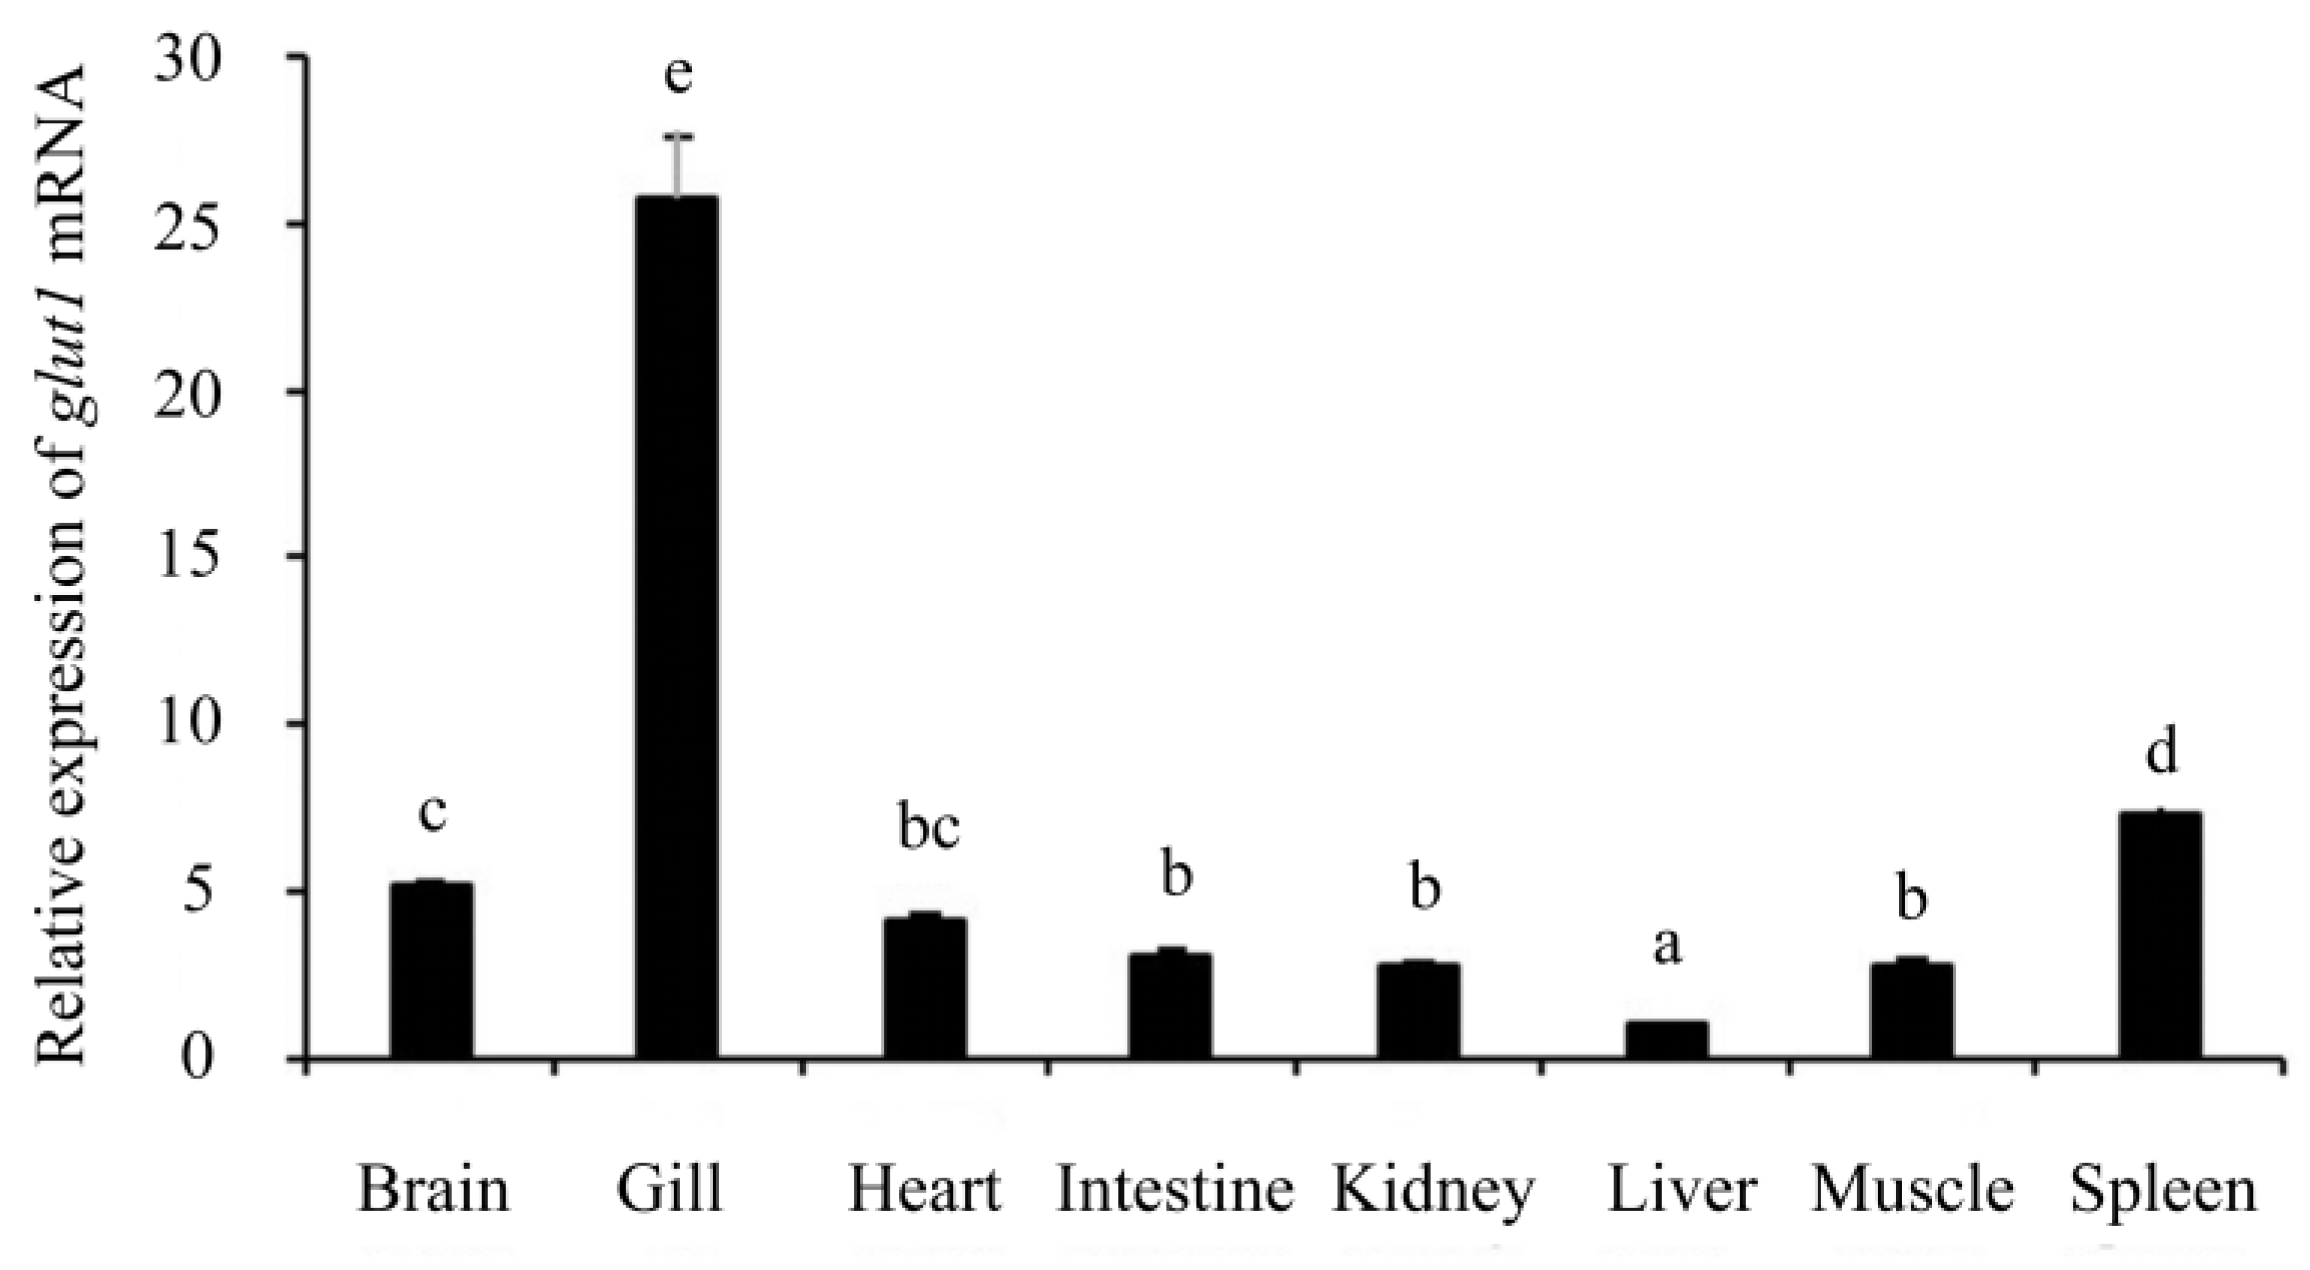
3.3. Expression Pattern of glut1 in Different Tissues of Silver Carp

We performed qPCR to determine the expression of glut1 in the brain, gill, heart, intestine, liver, kidney, muscle, and spleen tissues of silver carp (Figure 4). The expression of glut1 was detected in all eight tissues, with the highest level in the gill tissue, followed by the spleen tissue, and the lowest in the liver tissue compared with other tissues. The significance difference analysis did not reveal a significant difference in glut1 expression in the intestine, kidney, muscle, and heart tissues (p > 0.05). Compared with brain tissue, significant differences in glut1 expression in the other six tissues were not observed (p < 0.05), except in heart tissue.

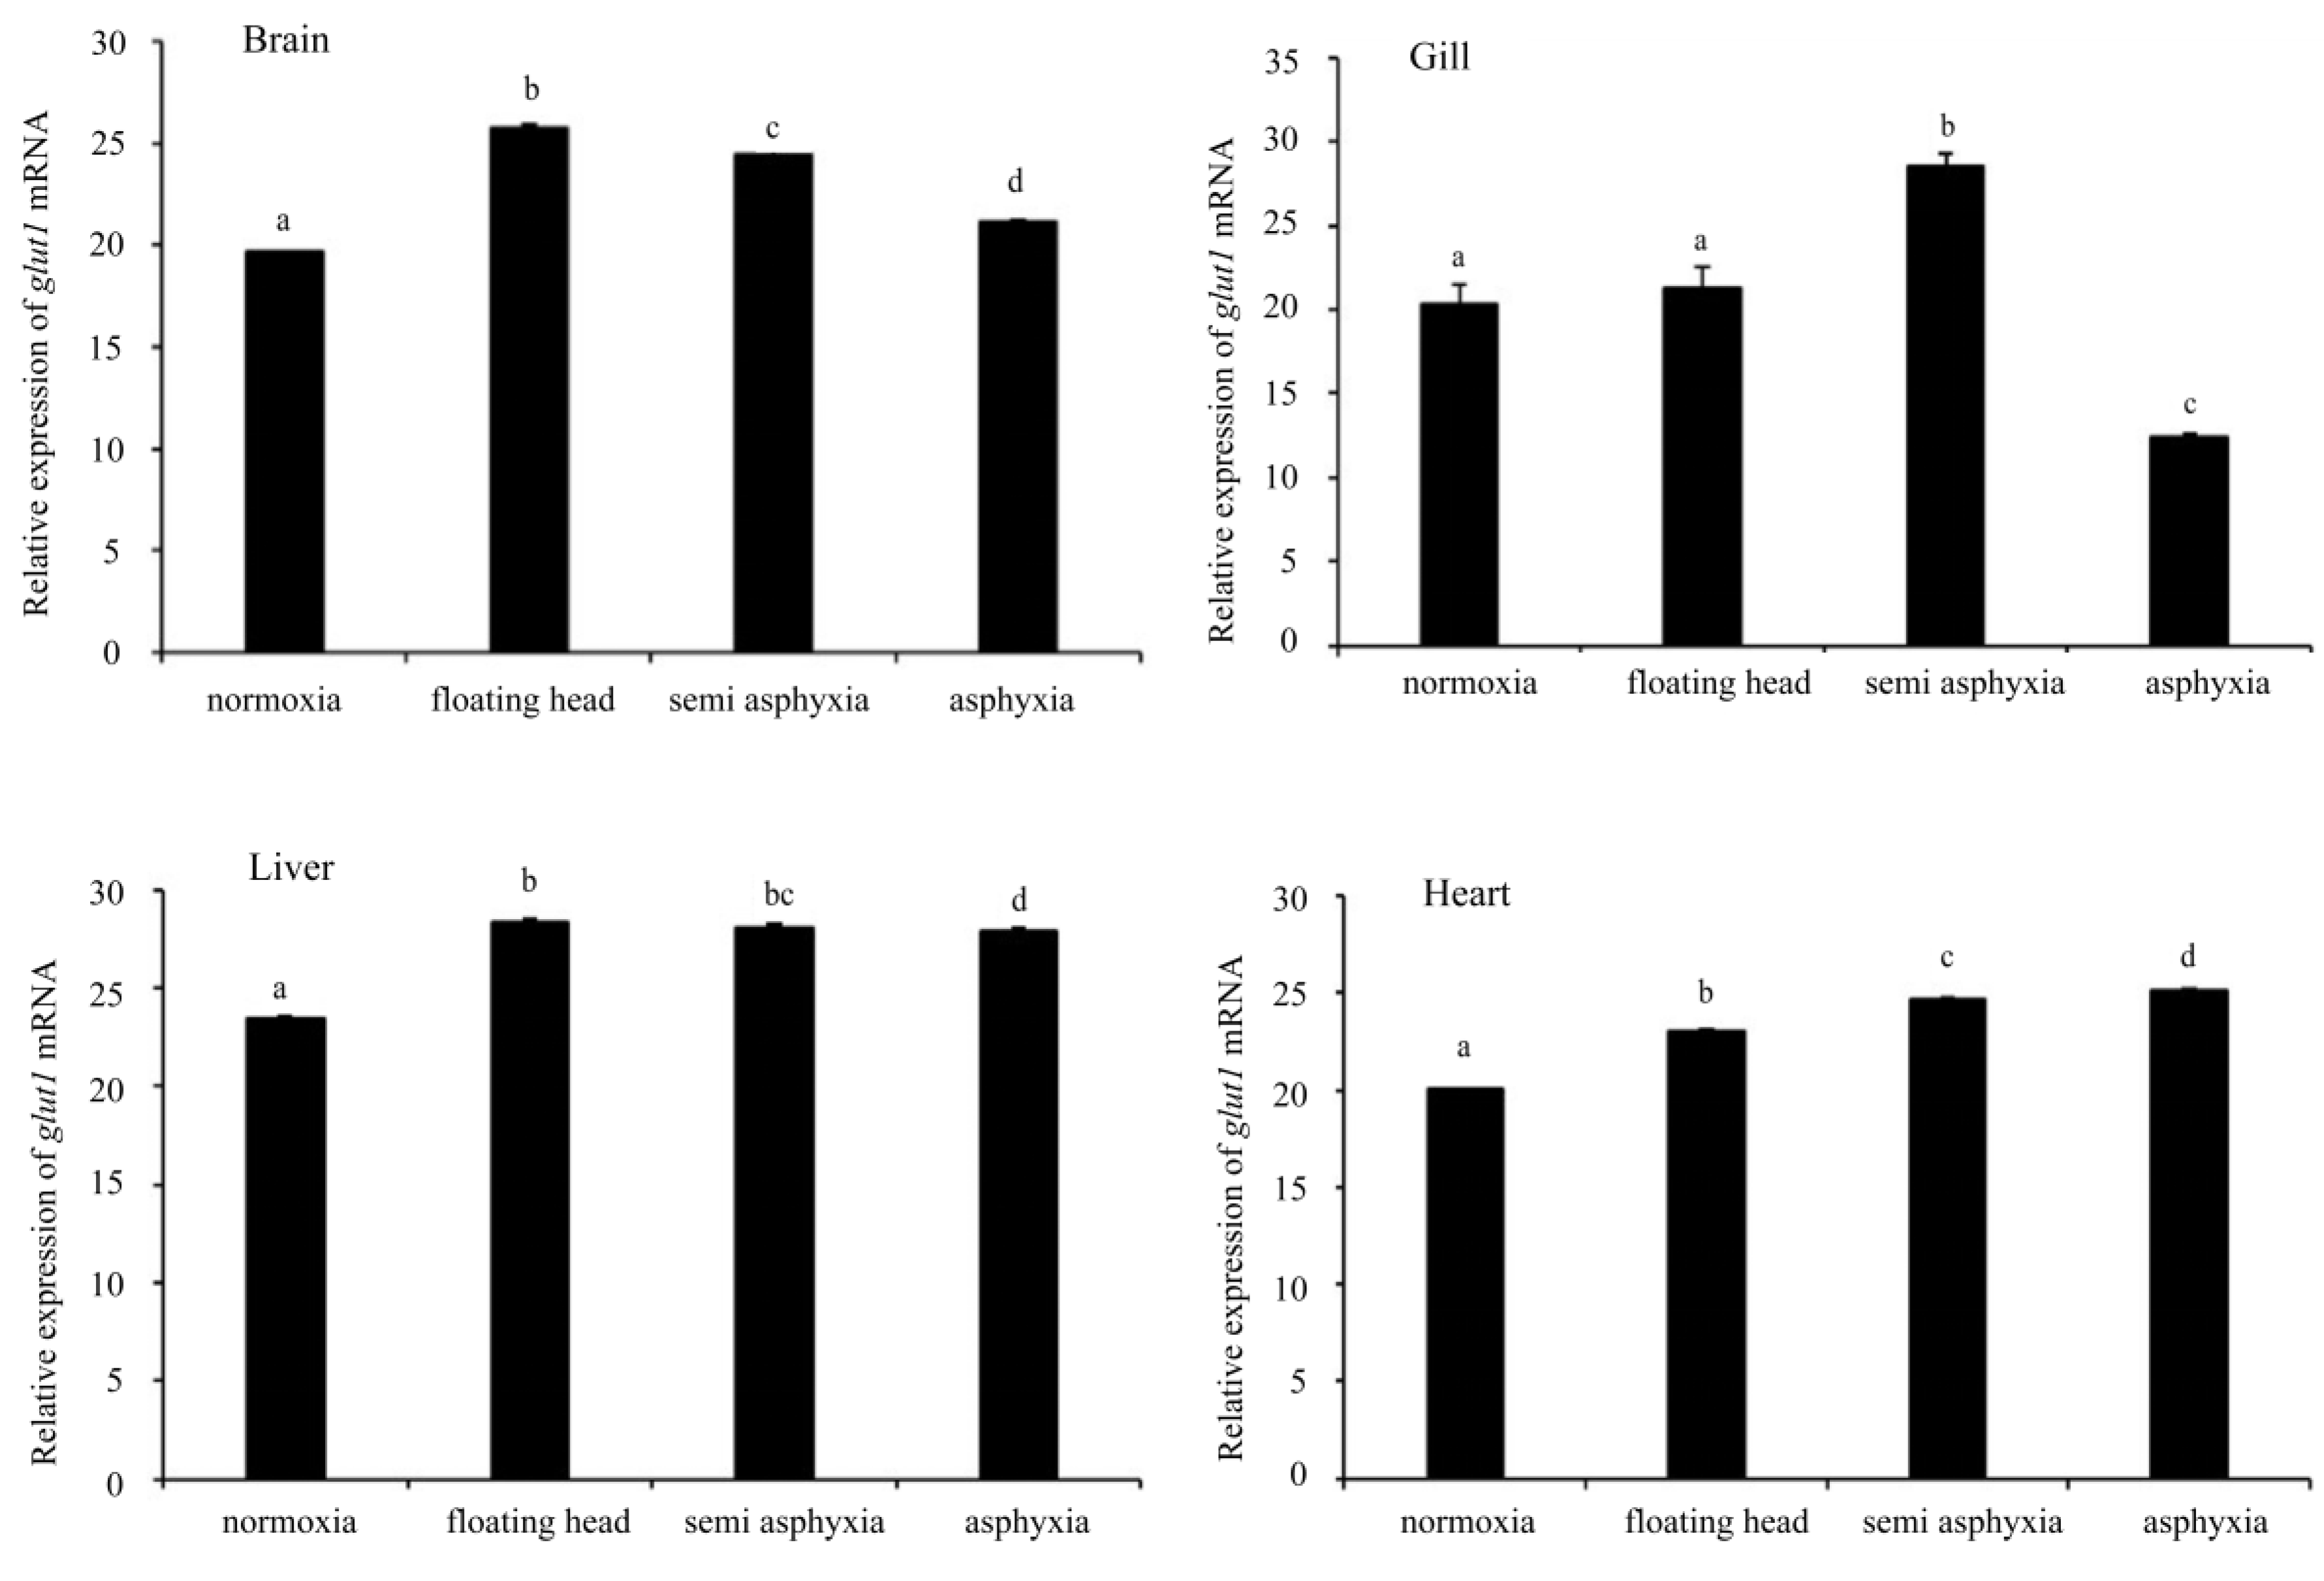
3.4. Analysis of glut1 Expression in Tissues under Different Oxygen Concentrations

Changes in glut1 expression in silver carp tissues under different oxygen concentrations are shown in Figure 5. glut1 expression was the lowest and relatively stable in all tissues in the normoxia group. Moreover, glut1 expression in the brain tissue was highest in the floating head group compared with the normoxia group (p < 0.05). Furthermore, with the decrease in oxygen concentration, glut1 expression decreased, but it was significantly higher than the normoxia group (p < 0.05). In the case of gill tissue, glut1 expression was the highest in the semi-asphyxia group and was lowest in the asphyxia group as the oxygen concentration decreased compared with the normoxia group (p < 0.05). Throughout the entire experimental process, the expression of glut1 in the liver tissues of the three hypoxic treatment groups was significantly higher than the normoxic group. The expression of glut1 in the heart tissue increased with hypoxic stress, and the floating head and semi-asphyxia groups.

4. Discussion

Dissolved oxygen (DO) is one of the limiting factors for the growth, reproduction, and survival of fish throughout their entire life cycle [21]. This study investigated the effects of different hypoxic conditions (floating head, semi asphyxia, asphyxia) on the glut1 gene in silver carp. We analyzed the amino acid sequence of silver carp glut1, and the results show that silver carp have the highest homology with Ctenopharyngodon idella, with over 90% homology with other fish and mammals. This indicates that glut1 is relatively conserved, implying that the function of this gene is similar in fish and mammals. The phylogenetic tree elucidated that silver carp and C. idella first cluster into a small branch and then cluster into a large branch with other fish, suggesting that silver carp and C. idella are closely related [22].
The expression pattern of silver carp glut1 was elucidated. The results revealed that the glut1 gene is expressed widely in different tissues (Figure 4). The glut1 gene is highly expressed in the gills, brain, and heart, especially in the gills. In a previous study, glut1 was most expressed in the adult gill tissues of L. vannamei. Another study reported similar observations for the gills of Atlantic cod, which could be because fish gills not only regulate the respiration of the fish, but are closely related to the acid–base balance, ammonia nitrogen excretion, ion balance, immune defense and osmotic pressure regulation, and are very important components of fish [23,24,25,26]. The expression of glut1 in the liver is relatively low, but some studies have shown that the glut1 gene is closely related to the glycolysis pathway. As a vital organ for glucose regulation, the liver has also attracted our attention. Meanwhile, the liver is also of great research value as an important response organ for fish to hypoxia [10,27]. In addition, the expression levels of glut1 in the spleen is second only to the gills, which may be related to the fact that the spleen is an important immune organ of the fish and secretes immune cells under various adverse stimuli [28,29,30].
Previous studies have shown that four organs, liver, brain, heart and gill, play an important role in the adapted process of fish to hypoxia; therefore, they were selected to clarify the impact of hypoxia on the expression of glut1. The expression levels of glut1 in four tissues of silver carp under different oxygen concentrations was observed. In the floating head and semi-asphyxia groups, the overall expression levels of glut1 show an upward trend, possibly because during the regulation process, the body provides energy by regulating glucose metabolism to maintain normal physiological activities under hypoxic stress [31,32,33,34].
Except for the gills, the other three tissues were still upregulated glut1 relative to normal oxygen levels in the asphyxia group. As the oxygen concentration decreased, the expression of glut1 in the gill tissue during the asphyxia process was significantly lower than in the normoxia group, indicating that the expression of glut1 in the gill tissues was inhibited under hypoxic conditions, possibly related to severe damage to the gill tissues during the asphyxia process. This result is similar to the results reported by Chen et al. and Sun et al. [35,36]. Therefore, the change in glut1 expression in silver carp could be a regulatory mechanism for coping with hypoxic stress in water.
In this study, we cloned the glut1 gene of silver carp for the first time, and revealed its changes in expression under hypoxic stress, indicating that its upregulated expression in response to hypoxia is an adaptive mechanism of the body to hypoxia, which provides a reference for subsequent research on the hypoxia tolerance of silver carp.

5. Conclusions

In recent years, research on silver carp under hypoxia stress has mainly focused on cDNA cloning and gene expression under hypoxic stress; however, it is unclear which tissues of the silver carp are more sensitive to hypoxia and how they can adapt to a hypoxic environment through autoregulation. In this study, a potential regulatory protein, glut1, for hypoxia tolerance in silver carp was investigated through transcriptome sequencing. Multiple sequence analyses revealed that silver carp glut1 is highly conserved. Furthermore, qPCR elucidated that glut1 is widely expressed in various silver carp tissues. These results provide a theoretical basis for understanding the molecular mechanism of the glucose transporter gene, glut1, in response to hypoxic stress in silver carp.

Supplementary Materials

The following supporting information can be downloaded at: https://www.mdpi.com/article/10.3390/fishes8080425/s1, Table S1: cDNA and amino acid sequences of GLUT1 in Hypophthalmichthys molitrix.

Author Contributions

Z.Z. Writing—original draft preparation, writing—review and editing, software; X.L.: methodology, formal analysis, investigation, data curation; G.Z. resources, funding acquisition; H.L. conceptualization, supervision, project administration, writing—review and editing, funding acquisition. All authors have read and agreed to the published version of the manuscript.

Funding

This work was supported by the National Key Research and Development Program of China (2022YFD2400100); the Earmarked Fund for China Agriculture Research System (CARS-45); the Foundation of Hubei Hongshan Laboratory (2021hskf014); the Central Public-interest Scientific Institution Basal Research Fund, YFI202211 and CAFS (2020TD33, 2023CG01, and 2023XT0402).

Institutional Review Board Statement

Laboratory Animal Ethical Inspection, Yangtze River Fisheries Research Institute, Chinese Academy of Fishery Sciences approved the study (protocol code: 2023zhangzewen01).

Informed Consent Statement

The data presented in this study are available in the article.

Data Availability Statement

The raw data that support this study are available from the corresponding author upon reasonable request.

Conflicts of Interest

The authors declare no conflict of interest.

References

  1. Fisheries and Fisheries Administration Bureau of the Ministry of Agriculture and Rural Affairs. 2022 China Fisheries Statistical Yearbook; China Agricultural Publishing House: Beijing, China, 2022. [Google Scholar]
  2. Guo, L.; Wang, Q.; Xie, P.; Tao, M.; Zhang, J.; Niu, Y.; Ma, Z. A non-classical biomanipulation experiment in Gonghu Bay of Lake Taihu: Control of Microcystis blooms using silver and bighead carp. Aquac. Res. 2015, 46, 2211–2224. [Google Scholar] [CrossRef]
  3. Shen, Y.; Wang, L.; Fu, J.; Xu, X.; Yue, G.H.; Li, J. Population structure, demographic history and local adaptation of the grass carp. BMC Genom. 2019, 20, 467. [Google Scholar] [CrossRef]
  4. Liu, J.; Xiong, B.; Wang, J.; Cheng, Z.; Wang, D. Analysis on the Ecological Function of Silver Carp and Bighead Carp in Aquaculture Water. Reserv. Fish. 2008, 158, 8–10. [Google Scholar]
  5. Li, C.; Wang, J.; Chen, J.; Schneider, K.; Veettil, R.K.; Elmer, K.R.; Zhao, J. Native bighead carp Hypophthalmichthys nobilis and silver carp Hypophthalmichthys molitrix populations in the Pearl River are threatened by Yangtze River introductions as revealed by mitochondrial DNA. J. Fish Biol. 2020, 96, 651–662. [Google Scholar] [CrossRef]
  6. Li, X.; Zou, G.; Liang, H.; He, X.; Sha, H.; Feng, C.; Cui, F. Effects of continuous hypoxia stress on blood indicators, tissue antioxidant enzymes activity and genes expression in Changfeng silver carp. J. Hunan Agric. Univ. 2022, 6, 723–729. [Google Scholar] [CrossRef]
  7. Halliwell, B.; Gutteridge, J.M. Lipid peroxidation, oxygen radicals, cell damage, and antioxidant therapy. Lancet 1984, 1, 1396–1397. [Google Scholar] [CrossRef]
  8. Shi, X.; Zhou, B. The role of Nrf2 and MAPK pathways in PFOS-induced oxidative stress in zebrafish embryos. Toxicol. Sci. Off. J. Soc. Toxicol. 2010, 115, 391–400. [Google Scholar] [CrossRef]
  9. Zhang, Z.W.; Li, Z.; Liang, H.W.; Li, L.; Luo, X.Z.; Zou, G.W. Molecular cloning and differential expression patterns of copper/zinc superoxide dismutase and manganese superoxide dismutase in Hypophthalmichthys molitrix. Fish Shellfish. Immunol. 2011, 30, 473–479. [Google Scholar] [CrossRef]
  10. Li, X.; Feng, C.; Sha, H.; Zhou, T.; Zou, G.; Liang, H. Tandem Mass Tagging-Based Quantitative Proteomics Analysis Reveals Damage to the Liver and Brain of Hypophthalmichthys molitrix Exposed to Acute Hypoxia and Reoxygenation. Antioxidants 2022, 11, 589. [Google Scholar] [CrossRef]
  11. Li, X.; Li, F.; Zou, G.; Feng, C.; Sha, H.; Liu, S.; Liang, H. Physiological responses and molecular strategies in heart of silver carp (Hypophthalmichthys molitrix) under hypoxia and reoxygenation. Comp. Biochem. Physiology. Part D Genom. Proteom. 2021, 40, 100908. [Google Scholar] [CrossRef]
  12. Ling, C. Study on the Body and Molecular Response of Silver Carp to Hypoxia Stress. Master’s Thesis, Shanghai Ocean University, Shanghai, China, 2021. [Google Scholar] [CrossRef]
  13. Denko, N.C. Hypoxia, HIF1 and glucose metabolism in the solid tumour. Nat. Rev. Cancer 2008, 8, 705–713. [Google Scholar] [CrossRef] [PubMed]
  14. Liberti, M.V.; Locasale, J.W. The Warburg Effect: How Does it Benefit Cancer Cells? Trends Biochem. Sci. 2016, 41, 211–218. [Google Scholar] [CrossRef] [PubMed]
  15. Osthus, R.C.; Shim, H.; Kim, S.; Li, Q.; Reddy, R.; Mukherjee, M.; Xu, Y.; Wonsey, D.; Lee, L.A.; Dang, C.V. Deregulation of glucose transporter 1 and glycolytic gene expression by c-Myc. J. Biol. Chem. 2000, 275, 21797–21800. [Google Scholar] [CrossRef] [PubMed]
  16. Qiu, Y.; Huang, G.; Liu, B.; Fan, S.; Li, Y.; Chen, M.; Yu, D. Cloning of glut1 gene from winged pearl oyster Pteria penguin and its expression in response to glucose challenge. South China Fish. Sci. 2016, 12, 81–89. [Google Scholar]
  17. Wang, E.F.; Li, X.; Jia, C.S.; Liu, G.W.; Fang, H.X.; Yu, S. ypoxic preconditioning up-regulates the activity and gene expressions of glucose transporters (glut1 and glut3) in cultured rat hippocampal neurons and astrocytes under anoxic condition. Basic Clin. Med. 2009, 29, 1273–1276. [Google Scholar]
  18. Ye, L.; Lu, K.; Zhang, D.; Qin, S. Insulin promotes glucose uptake via PlgK-AKT pathway in H9c2 myocardial cells. J. Third Mil. Med. Univ. 2015, 37, 538–542. [Google Scholar]
  19. Li, S.; Li, Z.; Sang, C.; Zhang, J.; Chen, N.-S.; Huang, X. Glucose transporters in pearl gentian grouper (Epinephelus fuscoguttatus ♀ × E. lanceolatus ♂): Molecular cloning, characterization, tissue distribution and their expressions in response to dietary carbohydrate level. Aquac. Res. 2018, 49, 253–264. [Google Scholar] [CrossRef]
  20. Zhang, Z.; Wu, R.S.; Mok, H.O.; Wang, Y.; Poon, W.W.; Cheng, S.H.; Kong, R.Y. Isolation, characterization and expression analysis of a hypoxia-responsive glucose transporter gene from the grass carp, Ctenopharyngodon idellus. Eur. J. Biochem. 2003, 270, 3010–3017. [Google Scholar] [CrossRef]
  21. Miller Neilan, R.; Rose, K. Simulating the effects of fluctuating dissolved oxygen on growth, reproduction, and survival of fish and shrimp. J. Theor. Biol. 2014, 343, 54–68. [Google Scholar] [CrossRef]
  22. Kuhlicke, J.; Frick, J.S.; Morote-Garcia, J.C.; Rosenberger, P.; Eltzschig, H.K. Hypoxia inducible factor (HIF)-1 coordinates induction of Toll-like receptors TLR2 and TLR6 during hypoxia. PLoS ONE 2007, 2, e1364. [Google Scholar] [CrossRef]
  23. Balmaceda-Aguilera, C.; Martos-Sitcha, J.A.; Mancera, J.M.; Martínez-Rodríguez, G. Cloning and expression pattern of facilitative glucose transporter 1 (GLUT1) in gilthead sea bream Sparus aurata in response to salinity acclimation. Comp. Biochem. Physiology. Part A Mol. Integr. Physiol. 2012, 163, 38–46. [Google Scholar] [CrossRef] [PubMed]
  24. Hall, J.R.; MacCormack, T.J.; Barry, C.A.; Driedzic, W.R. Sequence and expression of a constitutive, facilitated glucose transporter (GLUT1) in Atlantic cod Gadus morhua. J. Exp. Biol. 2004, 207, 4697–4706. [Google Scholar] [CrossRef] [PubMed]
  25. Morris, S. Neuroendocrine regulation of osmoregulation and the evolution of air-breathing in decapod crustaceans. J. Exp. Biol. 2001, 204, 979–989. [Google Scholar] [CrossRef] [PubMed]
  26. He, P.; Jiang, S.; Li, Y.; Yang, Q.; Jiang, S.; Yang, L.; Huang, J.; Zhou, F. Molecular cloning and expression pattern analysis of GLUT1 in black tiger shrimp (Penaeus monodon). South China Fish. Sci. 2019, 15, 72–82. [Google Scholar]
  27. Zhang, Z.; Li, X.; Yang, F.; Chen, C.; Liu, P.; Ren, Y.; Sun, P.; Wang, Z.; You, Y.; Zeng, Y.X.; et al. DHHC9-mediated GLUT1 S-palmitoylation promotes glioblastoma glycolysis and tumorigenesis. Nat. Commun. 2021, 12, 5872. [Google Scholar] [CrossRef]
  28. Vinagre, A.S.; Silva, R.S.M.D. Effects of fasting and refeeding on metabolic processes in the crab Chasmagnathus granulata (Dana, 1851). Can. J. Zool. 2002, 80, 1413–1421. [Google Scholar] [CrossRef]
  29. Teng, J.; Xiao, J. Research progress on glucose transporter 1. Biol. Teach. 2015, 40, 2–3. [Google Scholar]
  30. Wang, X.; Ye, K.; Wang, Z.; Han, F. Cloning and expression analysis of spleen tyrosine kinase gene in Larimichthys crocea. Hunan Agric. Univ. (Nat. Sci. Ed.) 2017, 43, 662–668. [Google Scholar]
  31. Sánchez-Paz, A.; García-Carreño, F.; Hernández-López, J.; Muhlia-Almazán, A.; Yepiz-Plascencia, G. Effect of short-term starvation on hepatopancreas and plasma energy reserves of the Pacific white shrimp (Litopenaeus vannamei). J. Exp. Mar. Biol. Ecol. 2007, 340, 184–193. [Google Scholar] [CrossRef]
  32. Bunn, H.F.; Poyton, R.O. Oxygen sensing and molecular adaptation to hypoxia. Physiol. Rev. 1996, 76, 839–885. [Google Scholar] [CrossRef]
  33. Lin, Z.; Weinberg, J.M.; Malhotra, R.; Merritt, S.E.; Holzman, L.B.; Brosius, F.C., 3rd. GLUT-1 reduces hypoxia-induced apoptosis and JNK pathway activation. Am. J. Physiol. Endocrinol. Metab. 2000, 278, E958–E966. [Google Scholar] [CrossRef] [PubMed]
  34. Wang, X.; Li, E.; Xu, Z.; Li, T.; Xu, C.; Chen, L. Molecular Response of Carbohydrate Metabolism to Dietary Carbohydrate and Acute Low Salinity Stress in Pacific White Shrimp Litopenaeus vannamei. Turk. J. Fish. Aquat. Sci. 2017, 17, 153–169. [Google Scholar]
  35. Chen, S. Golden pompano (Trachinotus ovatus) liver, gills physiological and pathological changes and related gene expression under hypoxia; Shanghai Ocean University: Shanghai, China, 2016. [Google Scholar]
  36. Sun, M.; Jiang, J.; Wang, L. Structural Changes in Gill, Kidney and Intestine of Juvenile Takifugu rubripes under Low Salinity Treatment. J. Zhanjiang Ocean. Univ. 2016, 36, 38–43. [Google Scholar]
Figure 1. Full-length cDNA of glut1 and the amino acid sequence of glut1. Codons of initiation (ATG) and termination (TAA) are highlighted; the MFS structural domain is also shown.
Fishes 08 00425 g001
Figure 2. Amino acid sequence alignment of glut1 from different species. The accession number of the GenBank is displayed on the left side of the sequence.
Fishes 08 00425 g002
Figure 3. Neighbor-joining phylogenetic tree of glut1 from silver carp and other species constructed using MEGA 11. The red dot represents the glut1 gene of silver carp. The GenBank accession numbers of the protein sequences used for analysis are as follows: Megalobrama amblycephala (KM977633.1); Anabarilius grahami (ROL50799.1); Ctenopharyngodon idella (MG818478.1); Cyprinus carpio (AAF75683.1); Pimephales promelas (XP_039548111.1); Myxocyprinus asiaticus (XP_051567510.1); Danio rerio (XP_002662574.1); Labeo rohita (XP_050968139.1); Sinocyclocheilus anshuiensis (XP_016312675.1); Onychostoma macrolepis (KAF4112506.1). Oncorhynchus mykiss (AAF75681.1); Salmo trutta (XP_029550223.1); Sparus aurata (XP_030275602.1); Oreochromis niloticus (NP_001266656.1); Gadus morhua (XP_030230417.1); Gallus gallus (AAB02037.1); Mus musculus (NP_035530.2); Homo sapiens (NP_006507.2); Ovis aries (XP_027824429.1); Drosophila melanogaster (NP_001097467.1).
Fishes 08 00425 g003
Figure 4. Glut1 expression in different tissues of silver carp. β-actin was the positive control. Data were shown as mean ± SE (n = 3). The data denoted with different lowercase letters indicate a significant difference (p < 0.05).
Fishes 08 00425 g004
Figure 5. Glut1 mRNA expression levels in different tissues of silver carp under different oxygen concentrations. Significant differences are indicated by different lowercase letters in the superscript (p < 0.05); no significant differences are indicated by the same letter (p >0.05).
Fishes 08 00425 g005
Table 1. Sequences of primers used in this study.
Primer NamePrimer Sequence (5′–3′)Function
Glut1-1F: CCCTTGGTTTCTGGGACTTORF amplification
R: ACTGGACGGTTCGTGGTAG
Glut1-3GSP1ACTATCGGAGCTGGAGTCGTCA3RACE
Glut1-3GSP2CTGGACCGCAAACTTTATCGTG3RACE
UPMCTAATACGACTCACTATAGGGCAAGCAGTGGTATCAACGCAGAGT
UPM ShortCTAATACGACTCACTATAGGGC
Glut1-qPCR-FTTGCCTTGCTGGAGAAATACGqPCR
Glut1-qPCR-RCCCACGATAAAGTTTGCGGTCqPCR
β-actin-FGAACCCCAAAGCCAACAGqPCR
β-actin-RCAGAGTCCATCACGATACCAGqPCR
Table 2. Homology analysis of the amino acid sequence of glut1 from different species.
SpeciesAccession NumberSequence Identity
Megalobrama amblycephalaKM977633.197.3%
Ctenopharyngodon idellaMG818478.196.7%
Sinocyclocheilus anshuiensisXP_016312675.194.7%
Anabarilius grahamiROL50799.194.4%
Labeo rohitaXP_050968139.193.7%
Onychostoma macrolepisKAF4112506.193.3%
Pimephales promelasXP_039548111.192.9%
Myxocyprinus asiaticusXP_051567510.191.8%
Danio rerioXP_002662574.191.2%
Cyprinus carpioAAF75683.189.4%
Salmo truttaXP_029550223.187.2%
Oncorhynchus mykissAAF75681.186.8%
Oreochromis niloticusNP_001266656.181.8%
Sparus aurataXP_030275602.181.5%
Gadus morhuaXP_030230417.181.4%
Mus musculusNP_035530.280.3%
Homo sapiensNP_006507.279.9%
Ovis ariesXP_027824429.179.5%
Gallus gallusAAB02037.178.8%
Drosophila melanogasterNP_001097467.146%
Disclaimer/Publisher’s Note: The statements, opinions and data contained in all publications are solely those of the individual author(s) and contributor(s) and not of MDPI and/or the editor(s). MDPI and/or the editor(s) disclaim responsibility for any injury to people or property resulting from any ideas, methods, instructions or products referred to in the content.

