Article

Growth Performance, Physiological Responses, and Histoarchitectural Changes in Juvenile Pangasianodon hypophthalmus under Different Environmental Salinities

by
Hany M. R. Abdel-Latif
1,*,
Hamada A. Ahmed
2,
Mustafa Shukry
3,
Asmaa F. Khafaga
4,
Bassem Khalil Elkhayat
5,
Mohsen Abdel-Tawwab
6 and
Rehab A. Abd-elaziz
7
1
Department of Poultry and Fish Diseases, Faculty of Veterinary Medicine, Alexandria University, Alexandria 22758, Egypt
2
Department of Nutrition and Veterinary Clinical Nutrition, Faculty of Veterinary Medicine, Damanhour University, Damanhour 22511, Egypt
3
Department of Physiology, Faculty of Veterinary Medicine, Kafrelsheikh University, Kafrelsheikh 33516, Egypt
4
Department of Pathology, Faculty of Veterinary Medicine, Alexandria University, Alexandria 22758, Egypt
5
Independent Researcher, Alexandria 21431, Egypt
6
Department of Fish Biology and Ecology, Central Laboratory for Aquaculture Research, Agriculture Research Center, Abbassa, Abo-Hammad, Sharqia 44662, Egypt
7
Fish Diseases Department, Alexandria Provincial Lab, Animal Health Research Institute (AHRI), Agriculture Research Center (ARC), Alexandria 21517, Egypt
*
Author to whom correspondence should be addressed.
Fishes 2023, 8(6), 282; https://doi.org/10.3390/fishes8060282
Submission received: 3 April 2023 / Revised: 28 April 2023 / Accepted: 19 May 2023 / Published: 25 May 2023

Abstract

:
Environmental salinity is an important abiotic factor that directly affects the growth, metabolism, osmoregulatory processes, and physiological performance of fish. Herein, the effects of long-term salinity stress on juvenile Pangasianodon hypophthalmus have been evaluated. Fish were allotted in five triplicate groups and exposed to five different salinities (0.0, 4.0, 8.0, 12.0, and 16.0‰) for 56 days. After exposure, the final weight, weight gain percent, and specific growth rate were significantly decreased in groups reared in 8‰, 12‰, and 16‰ salinities. The feed intake was also significantly reduced in groups raised in water salinities of 12‰ and 16‰ compared with other groups. Conversely, the feed conversion ratio values were significantly increased in groups reared in water salinities between 8‰ and 16‰ compared with other groups. The lowest survival rates were observed in groups reared at salinities of 12‰ and 16‰ (91.1% and 77.8%, respectively). Body moisture (%) was significantly decreased, while crude protein and crude lipids (%) were significantly increased in groups exposed to salinities ranging from 8.0‰ to 16.0‰. Stress biomarkers (such as blood glucose, lactate, and cortisol levels) and oxidative stress indicators (such as carbonyl proteins, malondialdehyde (MDA), superoxide dismutase (SOD), catalase (CAT), and glutathione peroxidase (GPX)) were significantly increased in groups exposed to different salinities compared with the control group, and their highest levels were in the group exposed to 16‰ salinity. The histoarchitectural changes were different among groups in relation to the salinity level. Moreover, the scored histopathological lesions showed a significant increase in groups exposed to different salinities compared with the control, and the highest scores were reported in groups exposed to the highest salinities (12‰ and 16‰). Based on the fitting curves, the present study suggests that P. hypophthalmus could tolerate salinities up to 8.0‰ with no mortalities; however, 4‰ salinity was more suitable with no adverse effects on the growth and little impact on histology and physiological responses.
Key Contribution: (a) P. hypophthalmus can tolerate water salinity up to 4‰ with no negative effects on the growth performance; (b) stress biomarkers such as glucose; lactate, and cortisol levels were significantly increased in groups exposed to different salinities compared with the controls; (c) oxidative stress occurs as manifested by elevated SOD, GPX, CAT, MDA, and carbonyl protein contents in salinity-exposed groups; and (d) several histopathological changes were recorded in the gills, muscles, and liver of fish exposed to different salinities.

Graphical Abstract

1. Introduction

Environmental salinity is an important abiotic factor that directly influences the growth, development, reproduction, immune responses, osmoregulatory mechanisms, and overall physiological performance of several aquatic organisms [1,2,3]. The effects of salinity stress have been previously documented in several finfish species. For instance, changes in environmental salinities have led to modifications in the osmoregulatory capacities and energy metabolism of red porgy fries (Pagrus pagrus) [4]. Exposure of Senegalese sole (Solea senegalensis) to a sudden salinity change caused changes in several physiological responses, including increased oxygen consumption and elevated plasma cortisol values [5]. Short-term changes in environmental salinities also elicited changes in the metabolic and osmoregulatory responses of Senegalese sole [6]. Moreover, short-term, and long-term exposures to different salinities induced changes in the branchial (gill) osmoregulatory responses of gilthead sea bream (Sparus auratus) [7]. Furthermore, environmental salinity stress also affected the growth performance and metabolic variables of meagre (Argyrosomus regius) fingerlings [8].
Physiologically, salinity stress exerts its effects by triggering an increase in energy metabolism to maintain the osmotic balance in exposed organisms [9]. Consequently, excess energy metabolism may lead to increased oxidation levels and the accumulation of free radicals and reactive oxygen species, subsequently inducing oxidative stress injury [10]. In some cases, these mechanisms may help the fish cope with oxidative stress and provide significant protection from oxidative injury. However, the inability of fish to resist the negative effects of this stress will lead to oxidative damage. In general, fish can maintain a fairly constant osmolality and ionic composition of their internal body fluids when subjected to variations in the surrounding water salinities, at least until the limits that cause stress disturbance are reached. These limits vary greatly among different fish species [11]. Indeed, the differences among the different species may be associated with their capability to adapt to changes in water salinity and the body’s responses to maintain homeostasis. Studying the osmoregulatory processes that occur in the fish body after their exposure to salinity changes is important to optimize several farming practices, especially for stenohaline species that are proposed to be used in aquaculture activities, which may also be combined with other groups of fish species in an integrated aquaculture system [12,13,14].
Striped catfish (P. hypophthalmus), a member of the family Pangasiidae, is a freshwater fish commonly cultured with high production rates, especially in a variety of Asian countries [15,16,17]. This fish species is promising for culture and preferable to many fish farmers for several reasons, including its high growth rates, tolerance to environmental conditions, survivability and thriving in high stocking densities, acceptable taste, somewhat decreased production costs, and relatively high economic returns [18]. This fish has been recently introduced as an exotic species in Egypt; however, its suitability to be farmed in Egyptian farming conditions has not been established and confirmed until now [19,20,21].
Several studies have evaluated the effects of environmental salinity stress on P. hypophthalmus, with special emphasis on their ages and life stages, to establish their suitability for coastal aquaculture. For instance, Nguyen et al. [22] illustrated that water salinity should not exceed 10‰ for better performance of P. hypophthalmus juveniles (15–20 g). However, Mandal et al. [23] suggested the suitability of rearing P. hypophthalmus fingerlings (4.68 ± 0.15 g) in water with salinity up to 4‰ with desirable growth rates. However, Ha et al. [24] declared that digestive enzyme activities and plasma osmolality were not significantly altered upon rearing P. hypophthalmus larvae (24–36 h post-hatching) in water with a 6‰ salinity level. The aforementioned studies showed that discrepancies between studies could also be associated with differential ages and life stages.
Regarding its effects on fish immunity and disease resistance, it was found that chronic exposure of one-week-old P. hypophthalmus to hyperosmotic stress (up to 20‰) has led to interfered immune homeostasis and plasma osmolarity and induced excessive inflammatory responses during Edwardsiella ictaluri infection [25,26]. Oanh and Phu [27] also observed that increasing water salinities over 11‰ significantly elevated the susceptibility of P. hypophthalmus fingerlings to Aeromonas hydrophila infection. Jahan et al. [28] reported that short-term exposure to 12‰ negatively affects the growth and haemato-biochemical variables of P. hypophthalmus fingerlings. Recently published studies reported that rearing larval P. hypophthalmus at a water salinity of 20‰ for 10 days caused skeletal deformities, decreased survival rates [29], and disrupted intestinal microbiota [30]. The negative impacts of high salinity levels (12‰) are also linked to severe histopathological lesions recorded in the gills, hepatopancreatic, and renal tissues of P. hypophthalmus fingerlings [31]. According to the literature mentioned above, the present study aimed to investigate the effects of different water salinities on survival rates, growth performance, whole-body composition, physiological responses, and histoarchitectural changes in juvenile P. hypophthalmus. In an attempt to determine the adequate environmental salinities for rearing this fish species in Egypt, this research study was designed as a pilot study.

2. Materials and Methods

2.1. Animals and Experimental Design

Striped catfish were reared in an indoor wet laboratory at a private fish hatchery, Borg-El-Arab, Alexandria province, Egypt. Fish were acclimated in five circular black fiberglass tanks (500 L water capacity) for 14 days before conducting the experiment. During the acclimation period, fish were fed daily on a commercial feed (30% crude protein, 5.2% crude fat, 5.8% ash, 16.74 MJ gross energy, and 8.7 MJ kg−1 digestible energy, Aller Aqua Company, Egypt). The feed ingredients of this diet were formulated to contain all the nutritional necessities for rearing the fish in accordance with NRC guidelines [32]. Fish were acclimated in these tanks, which contain freshwater with 0‰ salinity, 27.50 ± 2.00 °C water temperature, 8.00 ± 0.22 pH value, and 7.5 ± 0.50 mg/L dissolved oxygen (DO). All the fish individuals, during acclimation, exhibited normal swimming and feeding behavioral patterns. After acclimation, one hundred and eighty juveniles (180) of P. hypophthalmus (17.00 ± 0.56 g body mass and 11.20 ± 1.0 cm furcal length) were randomly allotted into five triplicate groups. Note that differences in weight among experimental groups were not significant. Fish were distributed into 15 glass aquaria (100 cm × 90 cm × 70 cm), each with a 100-L water capacity. Each experimental group contains 36 animals, and each aquarium contains 12 individuals. Fish were reared in these aquaria throughout the experiment period. Four different salinity levels of 4.0, 8.0, 12.0, and 16.0‰ were trialed to examine their respective effects on the overall performances of striped catfish juveniles compared with those reared in freshwater (0.0‰), which served as a control (CNT) treatment. Before the salinity acclimation stage started, four 500-L water tanks were chosen to serve as storage tanks with different water salinities. Fresh chlorine-free (left 24 h prior to use) and filtered tap water was mixed with sterile and filtered water obtained from Lake Mariout (northern Egypt, near Alexandria city). Lake water was passed through sand and biological filters and then through UV (ultraviolet) sterilization unit before mixing with the freshwater. This mixture was composed to prepare the desired salinity concentrations, and the salinity was confirmed. These tanks were used to substitute the water in different groups with regard to the corresponding salinity levels.
The procedures used for the salinity acclimation of fish were conducted in accordance with the protocols specified by Nguyen et al. [22] and Mandal et al. [23], with modifications to the salinity exposure levels. Fish were gradually acclimated to salinity levels until they reached the specific required salinity level. Fish were first released into the aquarium with 0.0‰ saline water at a gradually increased rate of 2.0‰ with a 2-day interval until all tanks had reached their target salinities. After that, each aquarium was filled to 100 L capacity. Fish were exposed to these salinities for 56 days as a long-term salinity stress test. The water salinities were measured daily to confirm the specified salinities. During the salinity exposure experiment, fish were hand-fed ad libitum 3 times daily using a commercial pelleted diet (30% crude protein, Aller Aqua Company, 6th October City, Giza Province, Egypt) in a feeding ratio of 3% of their wet body weight. Every two weeks, fish per aquarium were group-weighed, and the amount of feed given to each aquarium was adjusted accordingly. Every three days, a third of the aquarium’s water was substituted with well-aerated water from storage tanks that were previously prepared to contain the same required salinity levels. Metabolic waste and uneaten food were siphoned off daily to reduce the impacts of the formed ammonia on the reared fish. The lighting regimen for the dark and light cycles was set at 10 h:14 h. All aquaria were supported by two air stones connected with air pumps to maintain suitable aeration.

2.2. Calculations for Evaluating the Fish Growth and Survival

At the end of the 56-day exposure period, all fish in each aquarium were netted using the harvesting nets, counted, and weighed. Feed intake (FI) has been calculated. The survival rates, final weights (Wt56), weight gain (WG; g), WG%, specific growth rate (SGR), and feed conversion ratio (FCR) are determined according to the following equations:
SR (%) = 100 [No. of fish that survived after salinity exposure/Initial No. of fish stocked before the start of the salinity stress];
WG % = 100 [(Wt56 − Wt0)/Wt0];
SGR (%/day) = 100 [Ln Wt56 − Ln Wt0]/56;
FI (g feed/fish) = The total amount of diets utilized by fish over the whole period of the salinity exposure experiment (56 days);
FCR = FI (g)/WG (g).

2.3. Monitoring the Water Quality

Dissolved oxygen (DO; mg/L) values were evaluated daily using the HI9829 multiparameter apparatus (HANNA Instruments, Nasr City, Egypt). The water temperature (°C) was measured by a water thermometer. The pH values were examined using a pH meter (HI 8424, Hanna Instruments, Szeged, Hungary). Nitrite (NO2; mg/L) and unionized ammonia (NH3; mg/L) values were also measured by using a DREL portable spectrophotometer 2000 (HACH Co., Loveland, CO, USA). Salinity levels were monitored using a handheld refractometer. During the salinity exposure period, the mean (average) values of DO, water temperature, pH, NO2, and NH3 were 7.5 ± 0.3 mg/L, 27.50 ± 1.50 °C, 8.00 ± 0.22, 0.03 ± 0.01 mg/L, and 0.05 ± 0.01 mg/L, respectively. These parameters were monitored weekly, and no major changes in their values were recorded throughout the experimental period. These values were suitable for rearing striped catfish during the experiment.

2.4. Proximate Chemical Composition of Whole-Body

After the salinity exposure experiment, fish were sampled per group, frozen at −20 °C, and preserved until analyzing the chemical composition of the whole fish body. The analyses of crude protein (CP; %), moisture (%), crude lipids (CL; %), and ash (%) were evaluated in accordance with the guidelines described by the Association of Analytical Chemists [33]. The moisture (%) was determined by drying the fish samples in the drying oven (Memmert UN110, Buchenbach, Germany) at 105 °C for 12 h to reach a constant dry weight. The CP (%) was assessed using the Micro-Kjeldahl apparatus (Foss Kjeltec 2200, Hillerød, Denmark). The petroleum ether extraction method was used to determine the CL (%) using the Soxhlet apparatus (Model SER 148, VELP Scientifica, Usmate, Italy) for 16 h. Ash (%) was estimated from the weight loss in the fish samples after complete incineration at 550 °C for 6 h using a muffle furnace (Heraeus Instruments K1252, Hanau, Germany).

2.5. Sampling Procedures

After the salinity exposure experiment ended, two fish from each replicate aquarium (n = 6 per group) were anesthetized with 50 µL/L clove oil (Algomhuria Co., Alexandria, Egypt) to reduce the handling stress. Blood samples from each group were collected from the caudal vein of each fish without anti-coagulant in a 3-mL plastic syringe and then transferred to sterile, labeled Eppendorf tubes to separate and collect serum. The blood samples were left in these tubes for an hour at room temperature in a vertical position to separate the serum. Centrifugation was performed at 2500 × g for 10 min at 4 °C, and serum samples were collected using a sterile micro-pipette. The collected samples were refrigerated at −20 °C until they were used to assess biochemical indices. Fish were then aseptically necropsied for sampling organs and tissues. Livers, dorsal musculature, and gills were sampled, rinsed with a cold buffered sterile PBS solution, and then transferred to 10% buffered formalin for further histopathological studies. Additional liver samples (n = 6 per group) were collected, left on ice, and then refrigerated at −20 °C until used to determine liver oxidative stress biomarkers.

2.6. Biochemical Analyses

Blood glucose (mg/dL) and lactate (mg/dL) were measured using commercial kits (Glucose-HK Ref 1001200; Lactate Ref 1001330, Spinreact® Co., Girona, Spain), adapted for 96-well microtiter plates, and following the manufacturer’s instructions. Cortisol levels (ng/dL) were determined using commercially purchased ELISA kits (Fish Cortisol ELISA Kit, CSB-E08487f, Cusabio Biotech Co., Ltd., Wuhan, China), and the assay procedures were performed according to the manufacturer’s instructions. Previously obtained liver samples stored at −20 °C were transferred to an ice-water bath to be melted, and 0.1 g of the sampled tissues were homogenized with 0.9 mL of phosphate-buffered saline (PBS) solution (pH ~7.4) in a Teflon-coated mechanical homogenizer (Omni Tissue Master Homogenizer, Kennesaw, GA, USA). Tissue homogenates were then centrifuged at 3500× g for 15 min. The sediment was discarded, and the supernatant was taken to assess the oxidative stress biomarkers. The enzymatic antioxidant parameters, including catalase (CAT), superoxide dismutase (SOD), and glutathione peroxidase (GPX) activities, were determined using fish-specific commercial kits (Fish Catalase (CAT) ELISA kit (CSB-E15928Fh), Fish Superoxide Dismutase (SOD) ELISA kit (CSB-E15929Fh), and Fish Glutathione Peroxidase (GSH-PX) ELISA kit (CSB-E15930Fh), Cusabio Biotech Co., Ltd., Wuhan, China), following the manufacturer’s instructions. Hepatic malondialdehyde (MDA) levels were evaluated using commercial kits (Lipid peroxide (MDA), Biodiagnostic Co., Diagnostic and Research Reagents, Dokki, Giza, Egypt). Carbonyl protein contents were quantified in the liver homogenate samples according to the method described previously by Reznick and Packer [34].

2.7. Histopathological Examination

Tissue samples from the control and experimental groups were promptly preserved in 10% buffered formalin for 48 h for fixation. The paraffin embedding technique was used to process the fixed tissue specimens following the methodology described in [35]. To sum up, the tissue specimens were dehydrated in increasing ethanol concentrations, cleared in three changes of xylene, blocked in paraffin wax, cut into 5 µm-thick sections, and finally stained with hematoxylin and eosin (H and E stain). After that, representative photomicrographs were taken with the Leica EC3 digital camera (Leica, Wetzlar, Germany) connected to a Leica DM500 microscope. The degree of tissue damage in the sampled fish tissues was blindly scored in 5 randomly selected fields/sections/organs. The standards used for lesion scoring were characterized as the following scores: (0) refers to no involvement of scored field, (1) refers to the involvement of 0–25% of the scored field, (2) refers to the involvement of 25–50% of the scored field, and (3) refers to the involvement of 50–100% of the scored field. The scored lesions for the muscular tissues include different items such as (a) dermis separation, (b) atrophy of muscle bundles, (c) hyalinization of myotomes, and (d) splitting and vacuolization of muscle fibers. However, the scored lesions in the liver include different items, such as (a) vascular congestion, (b) vacuolization, and (c) necrosis. Furthermore, lesions scored in gills include different items such as (a) epithelial hyperplasia and fusion, (b) epithelial necrosis and rupture, (c) lamellar epithelial lifting and edema, and (d) chloride cell hyperplasia.

2.8. Statistical Analysis
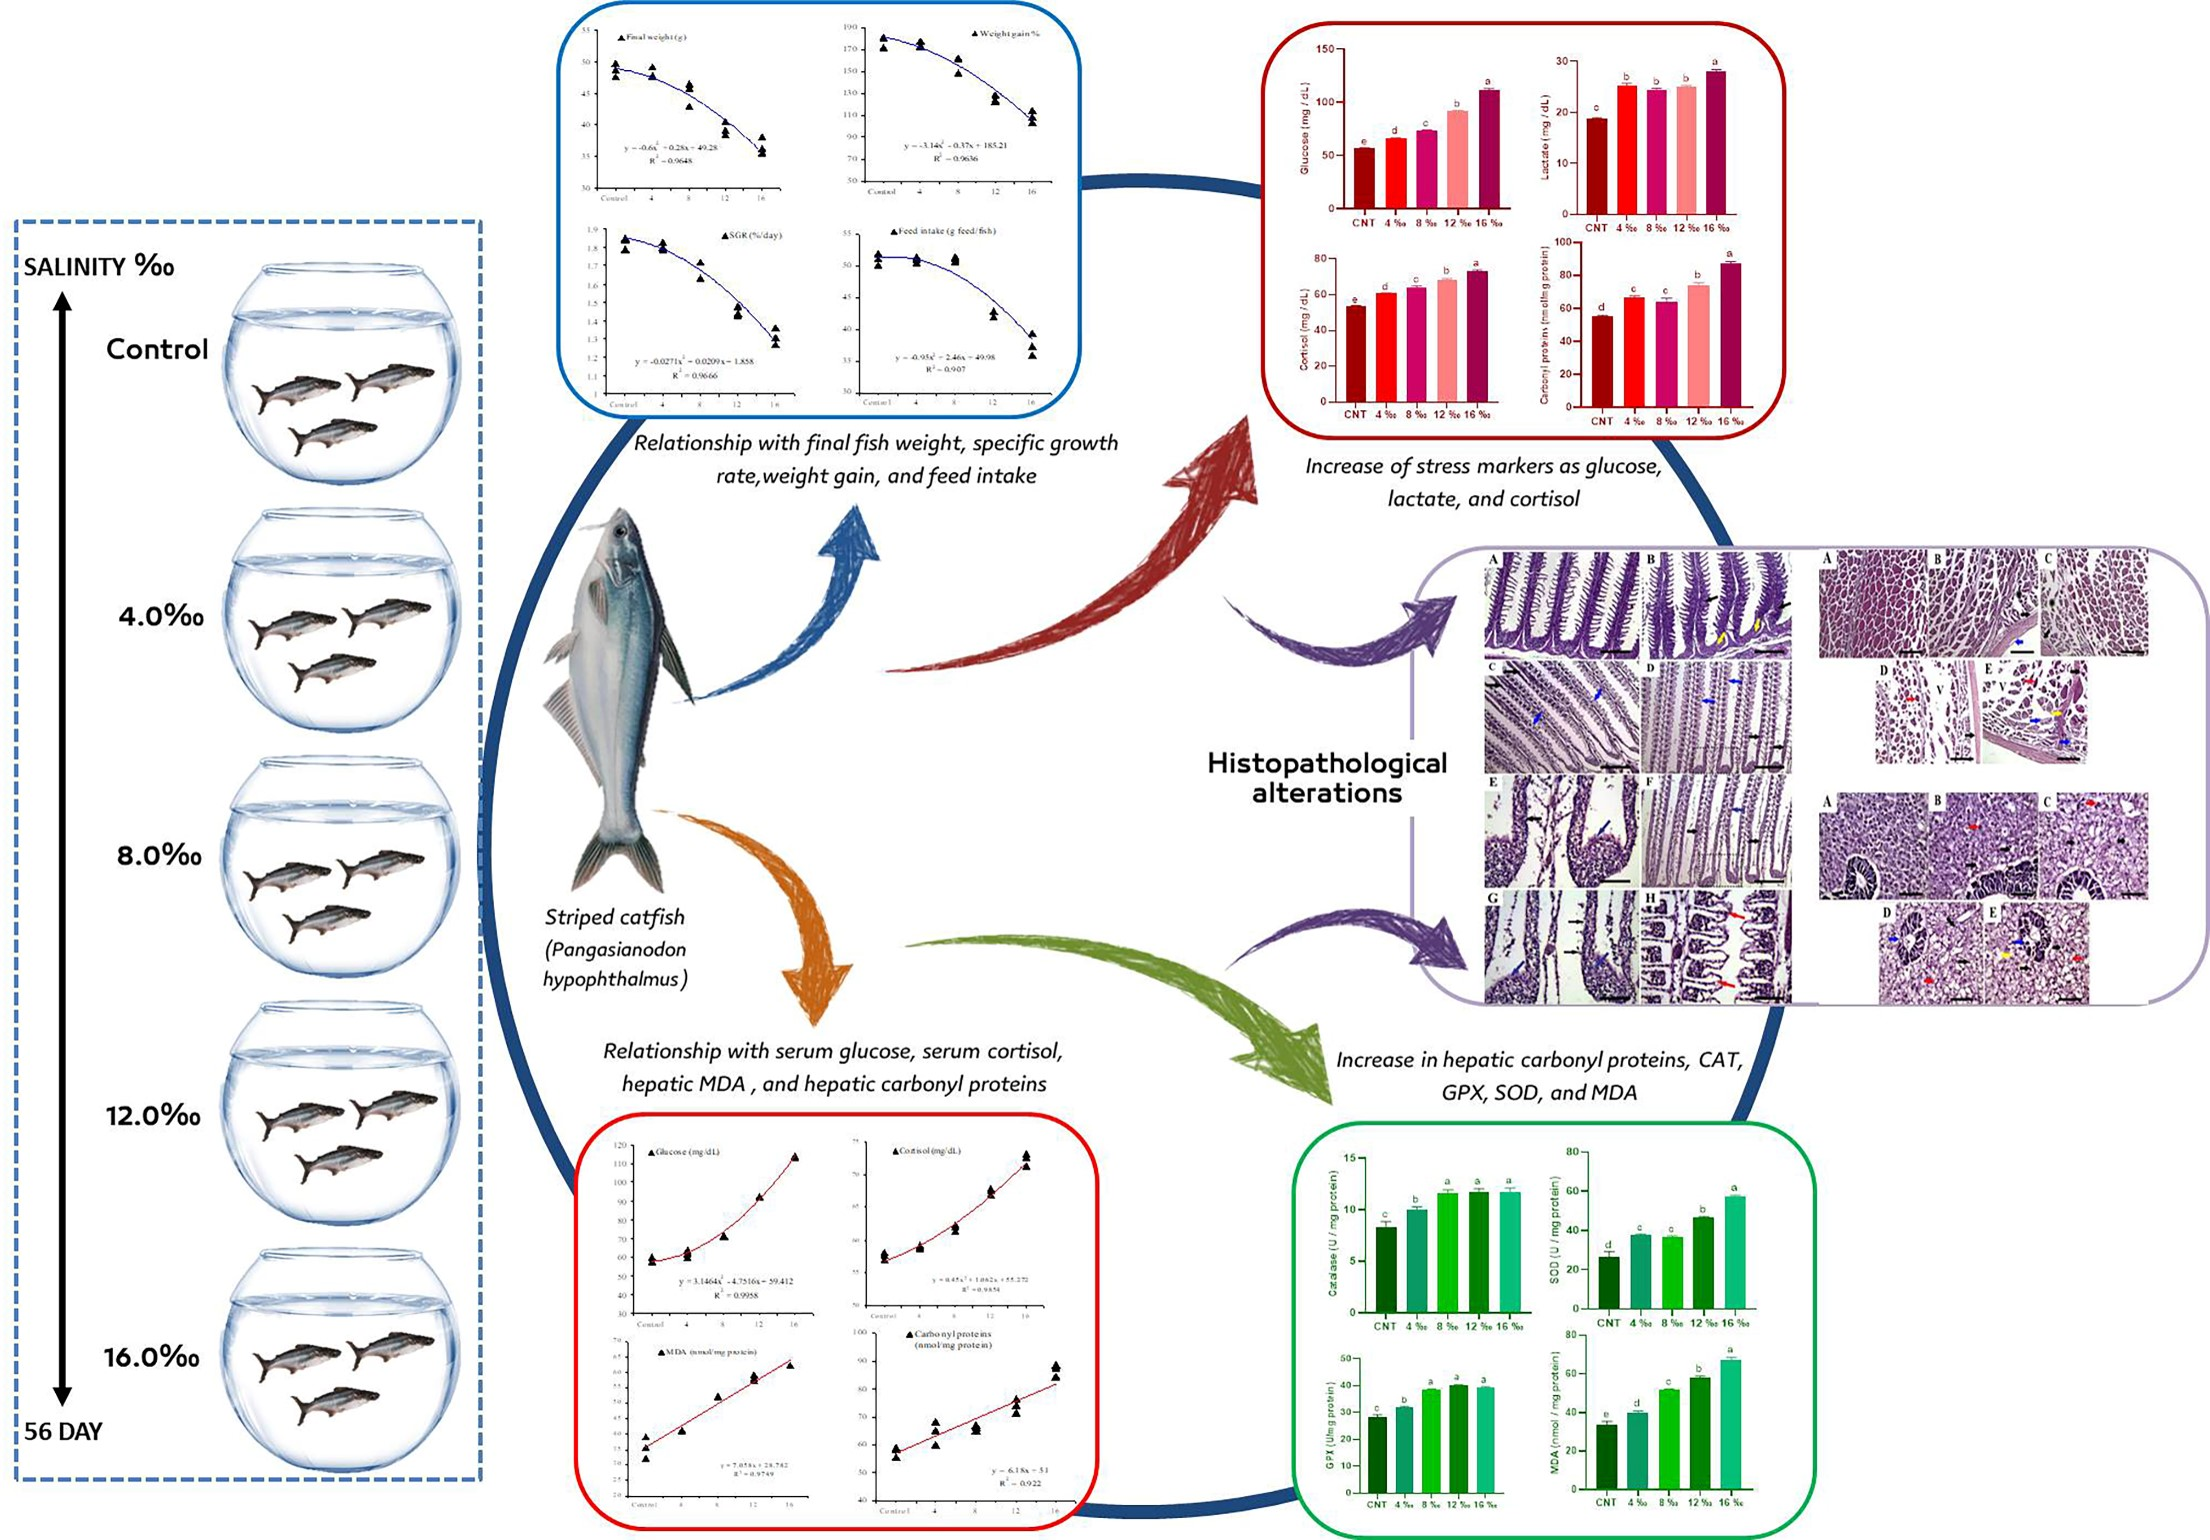
The collected data were examined using Kolmogorov–Smirnov and Bartlett’s tests to determine the normality of distribution and the homogeneity of variances among the experimental groups. Data obtained were then statistically subjected to one-way ANOVA, and differences between means were considered statistically significant at p < 0.05 by Duncan’s Multiple Range Test, which was used as a post-hoc test. Second-order polynomial regression analysis was conducted to determine the linear and quadratic effects of water salinities on growth parameters (Wt56, WG %, SGR, and FI) and stress markers (glucose, cortisol, lactate, and carbonyl proteins) [36]. Finally, the semi-quantitative scoring for histopathologic lesions was analyzed via non-parametric analysis using Kruskal–Wallis’s test to assess the significance between mean scores obtained from the Wilcoxon Rank-Sum Test. Statistics were performed using GraphPad Prism software (Prism version 8.0 for Windows, GraphPad Software, La Jolla, CA, USA) and the SPSS program (version 17 SPSS Inc., Chicago, IL, USA).

3. Results

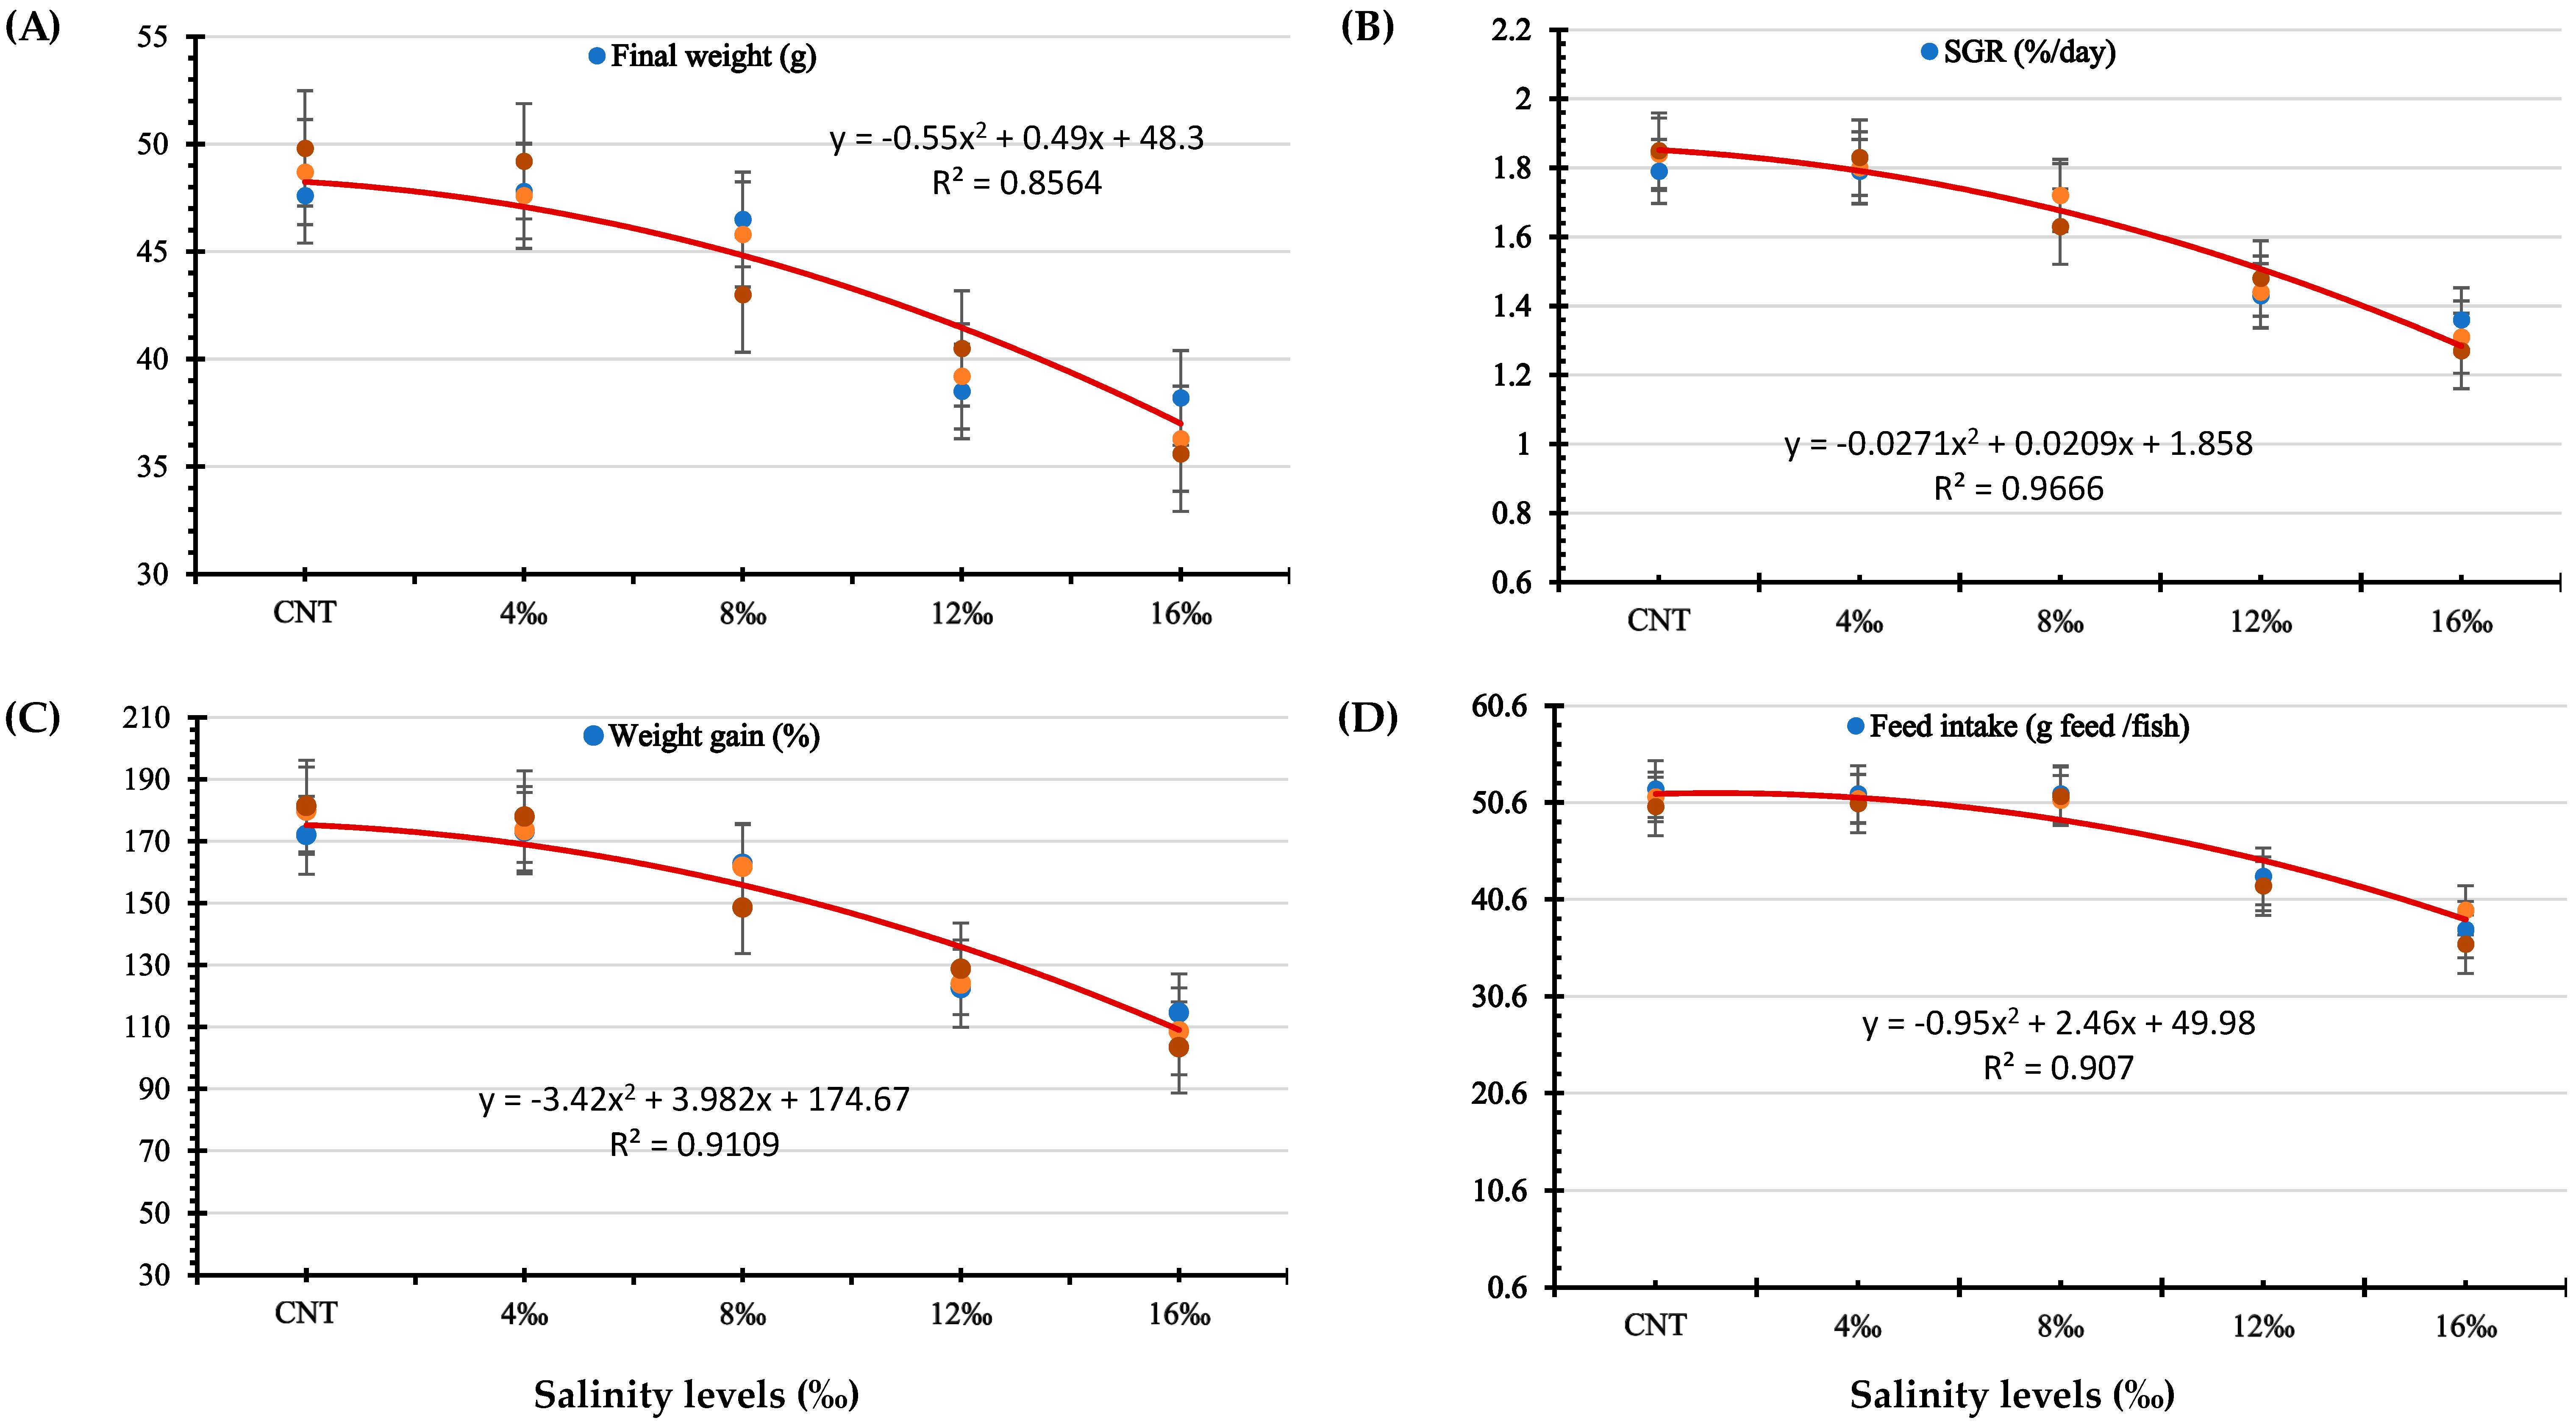
3.1. Growth Performance and Survival Rates

The growth performance and survival rates of P. hypophthalmus juveniles subjected to different salinities for 56 days are illustrated in Table 1. In comparison with the control group, it was found that the Wt56 (g), WG %, and SGR (%/day) were significantly (p < 0.05) decreased in fish groups reared in water with salinities ranging from 8‰ to 16‰ in a dose-exposure manner. However, these values were not significantly (p > 0.05) different between the control group and those reared in the group with a water salinity of 4‰. The FI (g feed/fish) values were significantly decreased in groups reared in water salinities of 12‰ and 16‰ compared with other groups. The FI values were not changed significantly in the control and fish groups exposed to 4‰ and 8‰ salinities. The FCR values were significantly increased in groups reared in salinities between 8‰ and 16‰ compared with the other groups; meanwhile, FCR values did not significantly differ between the control and 4‰ groups. No fish mortalities were recorded in the control and groups reared in water salinities of 4‰ and 8‰ (Table 1). However, fish survival rates (SR%) significantly decreased in groups reared at salinities of 12‰ and 16‰ compared with other groups. The lowest SR% was recorded in the group reared at a salinity of 16‰ (77.8%). These results indicate that P. hypophthalmus juveniles can survive easily at water salinities up to 8.0‰ with no recorded mortalities.
The relationships between Wt56 (g), WG %, SGR (%/day), and FI (g feed/fish) of P. hypophthalmus juveniles and the different salinity levels are presented in Figure 1. The second-order polynomial regression curve (Figure 1) shows inverse relationships between the water salinities and the fish growth parameters (Wt56, WG %, SGR, and FI).

3.2. Whole-Body Chemical Composition

The proximate chemical composition of the whole body (% on a fresh weight basis) of P. hypophthalmus subjected to different salinity levels for 56 days is illustrated in Table 2. It was found that the moisture content (%) was significantly decreased in groups exposed to salinities of 8.0‰ to 16.0‰ compared with other groups. On an inverse trend, the crude protein (%) and crude lipid (%) contents were significantly increased in groups exposed to salinities 8.0‰ to 16.0‰ compared with other groups. However, the ash content (%) was not significantly affected among all experimental groups.

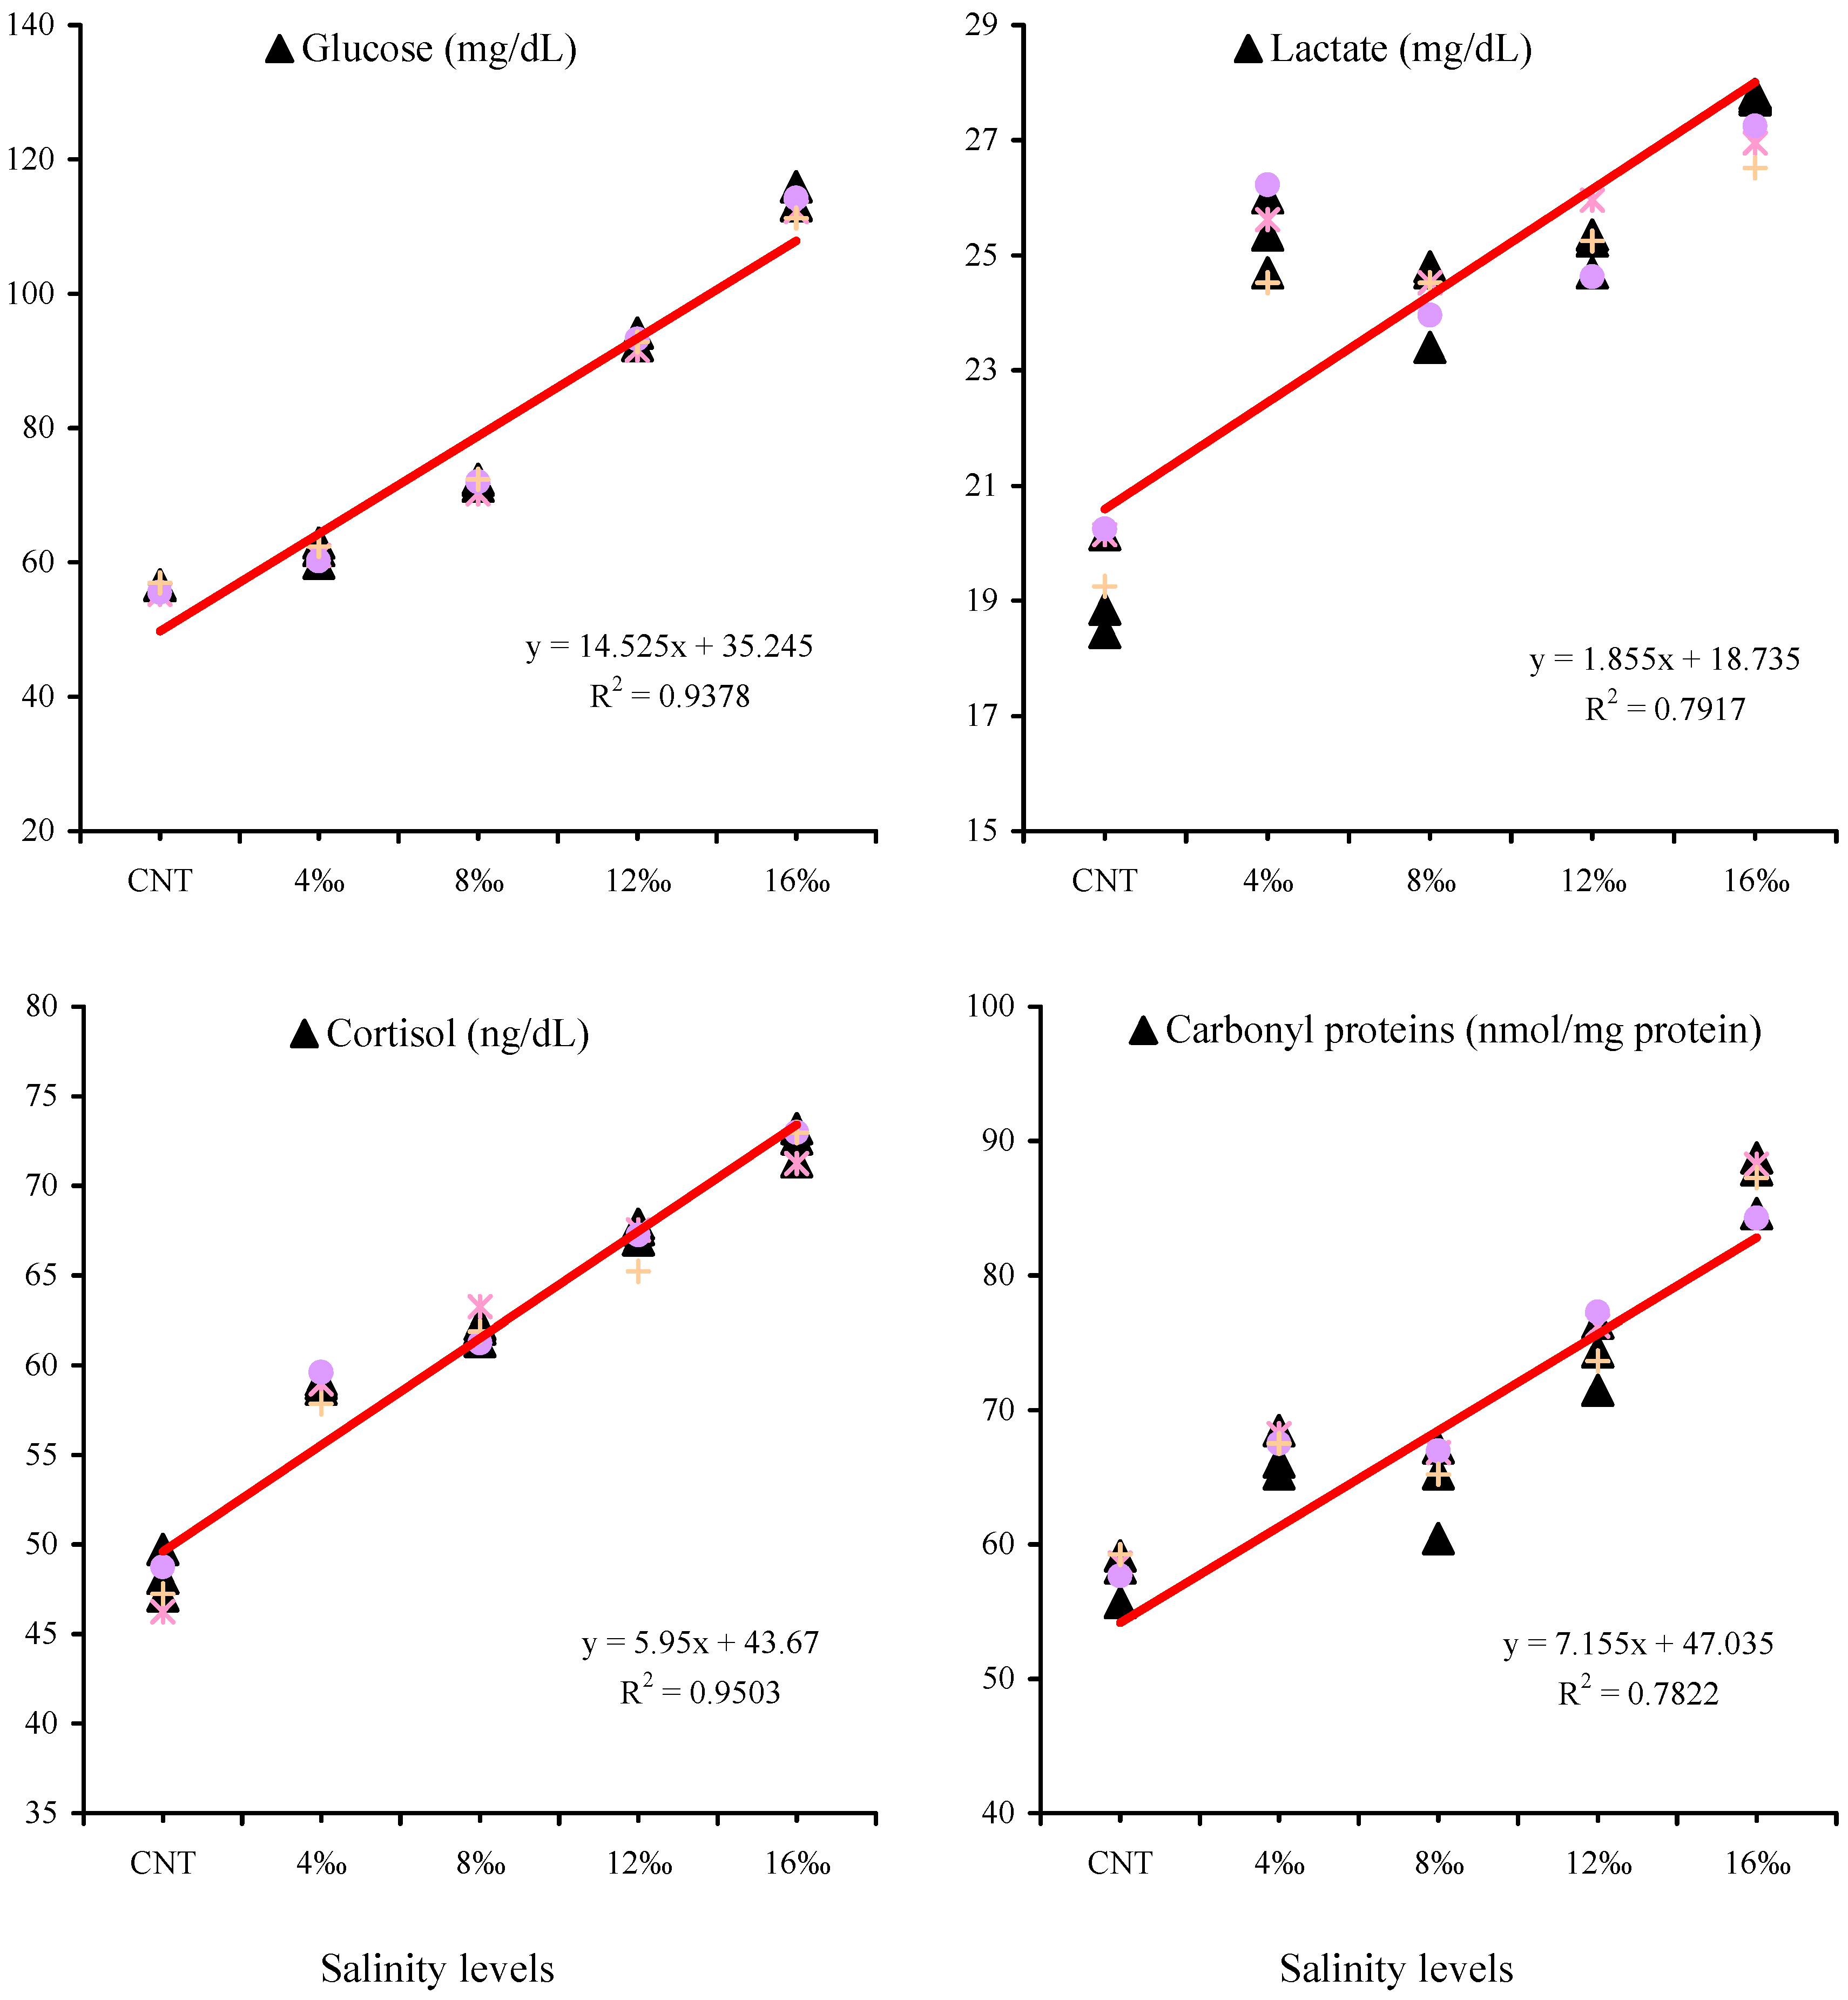
3.3. Serum Stress Biomarkers and Liver Antioxidant Parameters

Stress biomarkers, including blood glucose, lactate, cortisol levels, and liver carbonyl protein concentrations of P. hypophthalmus juveniles exposed to different salinity levels for 56 days, are illustrated in Figure 2. Blood glucose (Figure 2A; mg/dL), lactate (Figure 2B; mg/dL), cortisol (Figure 2C; ng/dL), and concentrations of hepatic carbonyl proteins (Figure 2D; nmol/mg protein) were significantly increased in fish groups exposed to different salinity levels when compared with the control group. The highest levels were found in the fish group exposed to 16‰ salinity compared with other groups. The hepatic antioxidant parameters, including CAT, SOD, GPX, and MDA concentrations, of P. hypophthalmus juveniles exposed to different salinity levels for 56 days are illustrated in Figure 3. Compared with their levels in the control group, the liver enzymatic antioxidants, including CAT (Figure 3A; U/mg protein), SOD (Figure 3B; U/mg protein), and GPX (Figure 3C; U/mg protein), were significantly elevated in fish groups exposed to different salinity levels. In a similar trend, the hepatic MDA concentrations (Figure 3D; nmol/mg protein) were significantly increased with regard to the salinity exposure level in a dose-dependent manner.
The relationships between blood glucose (mg/dL), lactate (mg/dL), cortisol (ng/dL), and hepatic carbonyl proteins (nmol/mg protein) of P. hypophthalmus juveniles exposed to different salinity levels for 56 days are presented in Figure 4. The second-order polynomial regression relationships (Figure 4) showed proportional effects of water salinities on blood glucose, lactate, cortisol, and hepatic carbonyl proteins, where R2 values are 0.9378, 0.7917, 0.9503, and 0.7822, respectively. Moreover, these linear relationships (Figure 4) indicate that salinity stress led to gradual increases in glucose, lactate, cortisol, and carbonyl protein values as salinity levels increased.

3.4. Histopathological Alterations

3.4.1. Effects of Different Salinities on Fish Muscular Tissues

The histopathological alterations of the dorsal muscular tissues of P. hypophthalmus juveniles exposed to different salinities (4‰, 8‰, 12‰, and 16‰) for 56 days are illustrated in Figure 5. The photomicrograph in Figure 5A shows the normal histologic structure of muscular tissue in the control group. However, the muscular tissue in the groups subjected to salinity levels of 4‰ and 8‰ (Figure 5B,C) showed focal separation of the dermis and epidermis with mild atrophy in the subcutaneous muscle bundle. The muscular tissues from fish subjected to salinity levels of 12‰ and 16‰ (Figure 5D,E) showed marked separation of dermis and epidermis in the majority of tissues, vacuums in the muscle layer, hyalinization, and necrosis of myotomes, marked degeneration and atrophy in muscle bundles, vacuolar degeneration and splitting of muscle fibers, and thickening of fibrous tissues separating muscle bundles.

3.4.2. Effects of Different Salinities on the Hepatopancreatic Tissues

The histopathological alterations of the hepatopancreatic tissues of P. hypophthalmus juveniles exposed to different salinities (4‰, 8‰, 12‰, and 16‰) for 56 days are illustrated in Figure 6. The hepatopancreatic tissues from the control group (Figure 6A) showed normal histoarchitecture of hepatic cells and cord, exocrine pancreases, acini, and bile canaliculi. However, tissues from fish exposed to salinity levels (4‰ and 8‰) (Figure 6B,C) showed focal areas of vacuolization and individual cell necrosis. On the other hand, the tissues from fish exposed to higher salinity levels (12‰ and 16‰) (Figure 6D,E) exhibited disorganization of hepatic tissue; besides, marked diffuse vacuolization, mostly of the vacuolar type and sometimes of the fatty type, was reported. In addition, focal areas of lytic necrosis of hepatocytes and exocrine pancreatic acini were evident.

3.4.3. Effects of Different Salinities on the Fish Gill Tissues

The histopathological alterations of the gill tissues of P. hypophthalmus juveniles exposed to different salinities (4‰, 8‰, 12‰, and 16‰) for 56 days are illustrated in Figure 7. Gills from the control group (Figure 7A) showed normal histologic limits of the central venous sinus, primary, and secondary lamellae. However, gills from the group exposed to 4‰ salinity (Figure 7B) showed mild to moderate epithelial hyperplasia, besides congestion and dilatation of primary lamellar blood capillaries and the gill arch. Gill tissues from fish exposed to 8‰ salinity (Figure 3C) exhibited focal lesions in the form of epithelial hyperplasia and fusion with lamellar epithelial lifting and edema. On the other hand, gill tissues collected from fish exposed to high salinity levels (12‰ and 16‰) (Figure 7D,F) showed degeneration of central cartilage, marked epithelial hyperplasia and fusion, marked edema, and epithelial lifting. In addition, gills from fish exposed to high salinity levels (12‰ and 16‰) also showed focal necrosis or complete rupture for the epithelial layer, marked hyperplasia in chloride and mucous cells, and clubbed tips of the secondary lamellae (Figure 7E,G,H).

3.5. Histopathological Scores of the Examined Fish Tissues

The semi-quantitative histopathological scores for the most common lesions in the muscular, hepatopancreatic, and gill tissues of P. hypophthalmus juveniles subjected to different salinities for 56 days compared with the control group are depicted in Table 3. The non-parametric analysis of the data of the scored lesions from the muscular tissues (including dermis separation, atrophy of muscle bundles, hyalinization of myotomes, and splitting and vacuolization of muscle fibers), liver (including vascular congestion, vacuolization, and necrosis), and gills (including (a) epithelial hyperplasia and fusion, (b) epithelial necrosis and rupture, (c) lamellar epithelial lifting and edema, and (d) chloride cells hyperplasia) of the exposed fish showed a significant increase in the lesion scores of fish groups exposed to different salinity levels compared with the control group. The highest lesion scores were reported in fish groups exposed to the highest salinity levels (12‰ and 16‰) (Table 3).

4. Discussion

The present study showed that growth performance was decreased in groups reared in water with salinities ranging from 8‰ to 16‰, which is also closely related to the suppressed feed intake in these groups. These findings led to an increase in FCR values in the same groups. Moreover, the regression analysis showed that P. hypophthalmus could tolerate water salinity up to 8‰, after which drastic declines in the growth parameters were observed up to 16‰. Therefore, the decreased growth of P. hypophthalmus in this study may be associated with the increased fish requirements to maintain normal osmoregulatory mechanisms, which need a high energy supply to adapt to the new stressful environmental conditions [37,38]. As it is well known, in stressful conditions such as hypoosmotic or hyperosmotic environments, fish utilize excessively high energy from their reserves to maintain normal physiological processes and body metabolic activities. As a result, this will decrease fish growth rates [39,40,41]. Furthermore, the decreased fish growth may also be linked to the effects of higher water salinities on the osmoregulation in the fish intestine, leading to a decrease in feed consumption, and concurrently, high FCR values will appear in fish groups reared at higher salinities compared with other groups [8,42,43].
When we looked closely at the results published for the same fish species, we found contradictory results or debates regarding the optimum salinity level required for the most favorable growth with no side effects for this fish species. For example, an earlier study [22] showed that salinity levels ranging from 2‰ to 10‰ provided optimal conditions for higher growth performance in P. hypophthalmus juveniles. After that, Phuc et al. [44] found that exposure of P. hypophthalmus juveniles to 6‰ water salinity for 56 days displayed the best growth and superior FCR values. Jahan et al. [28] further reported that a water salinity level of 8‰ was optimal for higher growth performances of P. hypophthalmus fingerlings. Furthermore, the growth of 15-day-old P. hypophthalmus fingerlings was higher when reared in a laboratory-based experiment in water of up to 4‰ salinities for 60 days [23]. Ha et al. [24] recently declared that a water salinity of 9‰ in a 60-day exposure experiment was suitable for the best growth rates of 24-h post-hatching larvae of P. hypophthalmus, and the fish growth rates were significantly depressed when fish were reared at a water salinity of 15‰.
In the present study, the fish SR was similar in the control and fish groups reared in water salinities of 4‰ and 8‰, with no mortalities recorded in these groups. However, SR was significantly decreased in fish groups reared in water salinities of 12‰ and 16‰ compared with the other groups, and the lowest SR was recorded in fish reared in water salinities of 16‰. These results indicate that P. hypophthalmus can survive at water salinities up to 8.0‰. In our study, the decreased SR of P. hypophthalmus may be associated with decreased feed utilization and impaired overall health status of the exposed fish [45,46]. Similar to growth parameters, several inconsistent results were also found in the fish SR among the previously published papers. Nguyen et al. [22] found that 2‰ to 10‰ of water salinities provided optimal conditions with a higher SR%, while salinities over 14‰ gave poor SR. The results obtained by Kumar et al. [47] showed that 10‰ water salinity could be considered optimal for the survival of P. hypophthalmus in inland saline water, and those authors also found that 100% mortality was observed when fish were exposed to 20‰ and 25‰ after 48 h and 18 h, respectively. Moreover, higher SR was recorded in P. hypophthalmus reared at water salinity levels of 8‰ [28]. The highest SR was also observed in P. hypophthalmus larvae exposed to water salinities of 6‰, and the lowest SR% was observed in fish larvae reared at 15‰ water salinities [24]. Another study [29] showed that the SR was not significantly different between P. hypophthalmus larval groups reared in different water salinities up to 10‰; however, the lowest SR% was observed in groups exposed to water salinities ranging from 15‰ to 20‰. To analyze the discrepancies in growth performance and SR between our findings and those published in P. hypophthalmus exposed to different salinities, we should direct our attention to several factors that may lead to these inconsistencies among results. These factors may include fish-related factors (such as age and size), experiment-related factors (such as exposure period and experimental design), or others (such as different localities, land salinities, or other environmental variables), among others.
The whole-body proximate composition can be used as a bioindicator to evaluate the nutritional status and overall health of fish [20]. The present study showed that long-term salinity stress significantly affected the chemical composition of the body of the exposed fish, which is manifested by decreased moisture (%) and increased CP (%) and CL (%) in groups exposed to salinities ranging from 8.0‰ to 16.0‰ compared with other groups. In a similar pattern, it was previously reported that the moisture content (%) decreased and the contents of CP (%) and CL (%) increased in P. hypophthalmus with the increase in water salinities [48]. As expected, it was well known that the biochemical composition of the fish tissues would be influenced by the surrounding water in which the fish were reared. Especially in our study, the fish were reared for a long period with prolonged exposure to different salinities, which will, in turn, produce significant changes in the tissues of the exposed fish. Regarding the moisture content (%), we found an inverse relationship between the moisture content (%) in the body of the exposed fish and salinity levels. This relationship may be attributed to the fact that these fish may absorb more water to be acclimatized to the new salinity environment and maintain normal physiological homeostasis [49]. Generally, the changes in fish body CP and CL are associated with their synthesis in the fish body and/or consumption as energy sources. Therefore, the changes in CP and CL contents may also result from salinity stress. The effects of long-term salinity stress may be associated with the ability of fish to regulate the osmotic pressure to enhance their adaptability to different salinity environments and maintain the energy required for the vital physiological processes that occur in their bodies [45].
Elevated blood cortisol is a bio-indicator for fish exposure to stressful conditions such as salinity stress [50,51], which triggers the stimulation of cortisol secretion. Moreover, blood glucose is normally secreted in fish as an energy source to cope with the negative effects of stressors [52]. It was previously reported that fish exposure to higher salinities led to higher blood cortisol and blood glucose [40]. As expected, blood glucose, lactate, and cortisol concentrations in the present study increased significantly in P. hypophthalmus groups exposed to different salinity levels compared with the control group. In a similar trend, it was found that blood glucose and cortisol levels were significantly increased in P. hypophthalmus after exposure to salinities over 12‰ [22,24,44]. In other finfish species, blood glucose and cortisol levels were also increased in African catfish, Clarias gariepinus [46], and Nile tilapia, Oreochromis niloticus [1], exposed to higher salinities. In addition, blood lactate, glucose, and cortisol concentrations were also increased in yellowfin seabream (Acanthopagrus latus) and Asian seabass (Lates calcarifer), which were exposed to higher water salinities [53].
Oxidative stress occurs due to the inability of the fish body to maintain redox balance [54]. It usually occurs after exposure of fish to stressful conditions, which leads to the generation of an excessive number of free radicals and reactive oxygen species [55], which leads to several series of events in the exposed cells, including lipid peroxidation, protein carbonylation, DNA damage, apoptosis, and programmed cell death [56]. Endogenous enzymatic antioxidant mechanisms, including SOD, CAT, and GPX enzymes, can mitigate the negative impacts of oxidative stress in exposed animals. MDA is the end product of the lipid peroxidation process. In this regard, disrupting the endogenous antioxidant defense mechanisms of fish and the overproduction of free radicals will lead to oxidative stress [56]. Thus, SOD, CAT, GPX, MDA, and protein carbonyls can be essential oxidative stress bioindicators [57]. In the present study, disruption of the hepatic antioxidative mechanisms occurs in salinity-exposed fish, manifested by significant increases in carbonyl proteins and MDA concentrations and activities of hepatic CAT, SOD, and GPX enzymes when compared with the control group. In a similar sense, it was reported that GPX and SOD activities, as well as lipid peroxidation concentrations, were increased gradually in the liver of yellowfin seabream after exposure to increased water salinities [53]. Recently, Dawood et al. [46] also found that African catfish exposed to salinities over 12‰ manifested a significant elevation of SOD, CAT, reduced glutathione, and MDA concentrations compared with the control fish. Environmental salinity is the main abiotic environmental factor that influences and modulates the physiological oxidative status of exposed aquatic animals [10]. In addition, salinity can exert its effects by producing free radicals and associated biochemical and molecular responses [58,59] with significant changes in mitochondrial functions and respiratory chain enzymes [60].
In aquaculture, studying histopathology is important to determine the effects of environmental stressors and aquatic pollutants on the exposed fish tissues [61]. As known, gills play important roles in respiration, osmoregulation, gaseous exchange, acid-base balance, and excretion of nitrogenous waste products [62,63]. Gills are very sensitive to aquatic pollutants and environmental abiotic stressors, which can induce anatomical and histological changes in the exposed gills and may be harmful if they are not promptly corrected if the fish body weakens and loses its ability to deal with these stressors [64]. It was reported that continuous and long-term exposure of fish gills to toxicants and water contaminants might induce serious damage to the chloride cells and gill tissues, leading to respiratory system dysfunction and oxygen transportation failure [65]. Herein, the present study showed different histopathological changes and scores in the gill tissues of the exposed fish with regard to the salinity level. As a result, these lesions may induce alterations in the vital functions of the gills [66]. In this regard, Takata et al. [11] reported that exposure of Lophiosilurus alexandri juveniles to increased salinities up to 10‰ for 28 days resulted in congestion, gill epithelial hyperplasia, lamellar fusion, hyperplasia of mucosal cells, loss of the structural integrity of the pillar cells, and the number of chloride cells. Mohamed et al. [38] also reported degenerative changes in the gills and adhesion of the secondary lamellae of Nile tilapia exposed to higher salinities of 10‰ or 15‰ for 10 days. Our results are in harmony with the findings recorded by Hossain et al. [31], who recently reported hypertrophy of the chloride and mucoid cells, epithelial necrosis, telangiectasia at the tips of secondary lamellae, fusion of secondary lamellae, and lamellar epithelial lifting in the gills of striped catfish fingerlings reared under salinities of 12‰ for 56 days. Recently, Dawood et al. [46] declared that the gills of African catfish exposed to salinities ranging from 4‰ to 12‰ for 4 weeks showed different degrees of telangiectasis of the secondary lamellae, hypertrophy of the chloride cells, and necrosis of the secondary lamellae with regard to the salinity exposure level. Salinity stress may alter the morphological and histoarchitectural structure of the chloride cells and increase cellular activities [67,68]. These changes can occur to maintain the body’s fluid homeostasis and the fish’s ability to adapt to the variations that occur in water salinities [11]. These physiological responses require energy, which should parallel the degree of salinity stress [69]. Thus, if the fish is exposed to salinities over the physiological and morphological limits, more energy will be required, excessive histopathological alterations will occur, and the fish will not achieve homeostasis [70]. All these events can lead to growth restriction and death.
The fish liver is important for food digestion, detoxification, and the biotransformation of toxicants [71]. Thus, it is considered a reliable biomarker and a vital indicator of fish health status [72]. In the present study, the livers of juvenile striped catfish exposed to different salinities showed varying histopathological lesions and alterations. In this regard, Mohamed et al. [38] found that the liver of Nile tilapia exposed to higher salinities demonstrated hydropic vacuolation and degenerative and necrotic changes within hepatic and pancreatic cells. Hossain et al. [31] found that the liver tissue of striped catfish fingerlings exposed to salinities of 12‰ for 56 days showed vacuolization, patchy degeneration, necrosis, and congestion of the hepatic sinusoids. In addition, Dawood et al. [46] demonstrated that African catfish exposed to salinities ranging from 4‰ to 12‰ for 4 weeks showed different degrees of vascular congestion, diffuse fatty vacuolization in hepatocytes, congestion of the hepatic sinusoids, and necrotic hepatocytes in relation to the degree of salinity exposure.
The development of fish musculature at any given life stage is a consequence of the balance between muscle fiber hypertrophy and hyperplasia, known as myogenesis [73]. Myogenesis, muscular cellularity, and flesh quality are usually affected by intrinsic or extrinsic factors [74,75]. The present study showed that long-term salinity stress caused a series of histopathological alterations in relation to salinity exposure levels. These effects may be attributed to the effects of salinity stress on muscle cellularity and muscle fibers, as illustrated by Takata et al. [11], and also to the effects of salinity stress on the development of muscle fibers, as illustrated by Johnston [74].

5. Conclusions and Prospects

In conclusion, the results showed that P. hypophthalmus juveniles could survive easily at water salinities up to 8.0‰ with no recorded mortalities. The regression analysis confirmed that the growth remained in the fish group reared at a water salinity of 4‰, the same as in the control group. However, the growth parameters of this fish species have negatively correlated with increasing water salinities above 4‰. Over 8‰ water salinity, there were drastic changes in the whole-body composition analysis (particularly crude protein, moisture, and crude lipid contents). Salinity stress also increased the stress indicators and the hepatic oxidative stress biomarkers of the exposed fish, which suggested the occurrence of oxidative stress. The histopathological alterations and increased lesion scores in the muscular, gill, and hepatopancreatic tissues, alongside the increase in water salinities, indicated histopathological damage under long-term salinity stress, particularly at levels of 12‰ and 16‰. To sum up, this preliminary study uncovered more insightful effects in the responses of P. hypophthalmus to long-term salinity stress. The results of this study may pave the way for a better understanding of the salinity tolerance limits for this fish species and provide insights and perceptions into determining the optimal salinity level for successful production strategies in Egypt. Prospects should be directed toward studying the effects of long-term salinity stress on disease resistance, the immune system, and gene expression analysis, which warrant further investigations. Moreover, the adaptive response mechanisms initiated by the fish to cope with rearing in different salinities necessitate detailed research studies.

Author Contributions

H.M.R.A.-L.: conceptualization; supervision; methodology; writing original draft, M.S.: methodology; validation; formal analysis, A.F.K.: methodology; validation; formal analysis, H.A.A.: methodology; investigation, B.K.E.: methodology; visualization, M.A.-T.: formal analysis; data curation; review and editing; validation, R.A.A.-e.: funding acquisition; software; data curation. All authors have read and agreed to the published version of the manuscript.

Funding

This research received no external funding.

Institutional Review Board Statement

The works conducted in the present study have been certified by the Local Experimental Animal Care Committee, Faculty of Veterinary Medicine, Alexandria University, and approved by the Institutional Animal Care and Use Committee at Alexandria University with ethical Approval Code (ALEXU-IACUC-013/2022/11/-3R/4P/161).

Informed Consent Statement

Not applicable.

Data Availability Statement

Data is available upon request.

Conflicts of Interest

The authors declare no conflict of interest.

References

  1. Shukry, M.; Abd El-Kader, M.F.; Hendam, B.M.; Dawood, M.A.O.; Farrag, F.A.; Aboelenin, S.M.; Soliman, M.M.; Abdel-Latif, H.M.R. Dietary Aspergillus oryzae modulates serum biochemical indices, immune responses, oxidative stress, and transcription of HSP70 and cytokine genes in Nile tilapia exposed to salinity stress. Animals 2021, 11, 1621. [Google Scholar] [CrossRef] [PubMed]
  2. Xiao, Y.; Zhang, Y.-M.; Xu, W.-B.; Chen, D.-Y.; Li, B.-W.; Cheng, Y.-X.; Guo, X.-L.; Dong, W.-R.; Shu, M.-A. The effects of salinities stress on histopathological changes, serum biochemical index, non-specific immune and transcriptome analysis in red swamp crayfish Procambarus clarkii. Sci. Total Environ. 2022, 840, 156502. [Google Scholar] [CrossRef] [PubMed]
  3. Xu, C.; Li, E.; Suo, Y.; Su, Y.; Lu, M.; Zhao, Q.; Qin, J.G.; Chen, L. Histological and transcriptomic responses of two immune organs, the spleen and head kidney, in Nile tilapia (Oreochromis niloticus) to long-term hypersaline stress. Fish Shellfish Immunol. 2018, 76, 48–57. [Google Scholar] [CrossRef] [PubMed]
  4. Vargas-Chacoff, L.; Calvo, Á.; Ruiz-Jarabo, I.; Villarroel, F.; Muñoz, J.L.; Tinoco, A.B.; Cárdenas, S.; Mancera, J.M. Growth performance, osmoregulatory and metabolic modifications in red porgy fry, Pagrus pagrus, under different environmental salinities and stocking densities. Aquac. Res. 2011, 42, 1269–1278. [Google Scholar] [CrossRef]
  5. Herrera, M.; Aragão, C.; Hachero, I.; Ruiz-Jarabo, I.; Vargas-Chacoff, L.; Mancera, J.M.; Conceição, L.E.C. Physiological short-term response to sudden salinity change in the Senegalese sole (Solea senegalensis). Fish Physiol. Biochem. 2012, 38, 1741–1751. [Google Scholar] [CrossRef]
  6. Arjona, F.J.; Vargas-Chacoff, L.; Ruiz-Jarabo, I.; Martín del Río, M.P.; Mancera, J.M. Osmoregulatory response of Senegalese sole (Solea senegalensis) to changes in environmental salinity. Comp. Biochem. Physiol. Part A Mol. Integr. Physiol. 2007, 148, 413–421. [Google Scholar] [CrossRef]
  7. Laiz-Carrión, R.; Guerreiro, P.M.; Fuentes, J.; Canario, A.V.M.; Martín Del Río, M.P.; Mancera, J.M. Branchial osmoregulatory response to salinity in the gilthead sea bream, Sparus auratus. J. Exp. Zool. Part A Comp. Exp. Biol. 2005, 303A, 563–576. [Google Scholar] [CrossRef]
  8. Ruiz-Jarabo, I.; Tinoco, A.B.; Vargas-Chacoff, L.; Martos-Sitcha, J.A.; Rodríguez-Rúa, A.; Cárdenas, S.; Mancera, J.M. Environmental salinity affects growth and metabolism in fingerling meagre (Argyrosomus regius). Fishes 2019, 4, 6. [Google Scholar] [CrossRef]
  9. Gan, L.; Xu, Z.X.; Ma, J.J.; Xu, C.; Wang, X.D.; Chen, K.; Chen, L.Q.; Li, E.C. Effects of salinity on growth, body composition, muscle fatty acid composition, and antioxidant status of juvenile Nile tilapia Oreochromis niloticus (Linnaeus, 1758). J. Appl. Ichthyol. 2016, 32, 372–374. [Google Scholar] [CrossRef]
  10. Bal, A.; Panda, F.; Pati, S.G.; Das, K.; Agrawal, P.K.; Paital, B. Modulation of physiological oxidative stress and antioxidant status by abiotic factors especially salinity in aquatic organisms. Comp. Biochem. Physiol. Part C Toxicol. Pharmacol. 2021, 241, 108971. [Google Scholar] [CrossRef]
  11. Takata, R.; Mattioli, C.C.; Bazzoli, N.; Júnior, J.D.C.; Luz, R.K. The effects of salinity on growth, gill tissue and muscle cellularity in Lophiosilurus alexandri juvenile, a Neotropical freshwater catfish. Aquac. Res. 2021, 52, 4064–4075. [Google Scholar] [CrossRef]
  12. Ahmed, N.; Thompson, S.; Glaser, M. Global aquaculture productivity, environmental sustainability, and climate change adaptability. Environ. Manag. 2019, 63, 159–172. [Google Scholar] [CrossRef]
  13. Dubey, S.K.; Trivedi, R.K.; Chand, B.K.; Mandal, B.; Rout, S.K. Farmers’ perceptions of climate change, impacts on freshwater aquaculture and adaptation strategies in climatic change hotspots: A case of the Indian Sundarban delta. Environ. Dev. 2017, 21, 38–51. [Google Scholar] [CrossRef]
  14. McCormick, S.D.; Bradshaw, D. Hormonal control of salt and water balance in vertebrates. Gen. Comp. Endocrinol. 2006, 147, 3–8. [Google Scholar] [CrossRef]
  15. Ali, H.; Haque, M.M.; Belton, B. Striped catfish (Pangasianodon hypophthalmus, Sauvage, 1878) aquaculture in Bangladesh: An overview. Aquac. Res. 2013, 44, 950–965. [Google Scholar] [CrossRef]
  16. Phan, L.T.; Bui, T.M.; Nguyen, T.T.T.; Gooley, G.J.; Ingram, B.A.; Nguyen, H.V.; Nguyen, P.T.; De Silva, S.S. Current status of farming practices of striped catfish, Pangasianodon hypophthalmus in the Mekong Delta, Vietnam. Aquaculture 2009, 296, 227–236. [Google Scholar] [CrossRef]
  17. Abd-Elaziz, R.A.; Shukry, M.; Abdel-Latif, H.M.R.; Saleh, R.M. Growth-promoting and immunostimulatory effects of phytobiotics as dietary supplements for Pangasianodon hypophthalmus fingerlings. Fish Shellfish Immunol. 2023, 133, 108531. [Google Scholar] [CrossRef]
  18. De Silva, S.S.; Phuong, N.T. Striped catfish farming in the Mekong Delta, Vietnam: A tumultuous path to a global success. Rev. Aquac. 2011, 3, 45–73. [Google Scholar] [CrossRef]
  19. Abdel-Latif, H.M.R.; Ahmed, H.A.; Shukry, M.; Chaklader, M.R.; Saleh, R.M.; Khallaf, M.A. Astragalus membranaceus Extract (AME) Enhances Growth, Digestive Enzymes, Antioxidant Capacity, and Immunity of Pangasianodon hypophthalmus Juveniles. Fishes 2022, 7, 319. [Google Scholar] [CrossRef]
  20. Abdel-Latif, H.M.R.; Chaklader, M.R.; Shukry, M.; Ahmed, H.A.; Khallaf, M.A. A multispecies probiotic modulates growth, digestive enzymes, immunity, hepatic antioxidant activity, and disease resistance of Pangasianodon hypophthalmus fingerlings. Aquaculture 2023, 563, 738948. [Google Scholar] [CrossRef]
  21. Zaki, M.A.A.; Khalil, H.S.; Allam, B.W.; Khalil, R.H.; Basuini, M.F.E.; Nour, A.E.-A.M.; Labib, E.M.H.; Elkholy, I.S.E.; Verdegem, M.; Abdel-Latif, H.M.R. Assessment of zootechnical parameters, intestinal digestive enzymes, haemato-immune responses, and hepatic antioxidant status of Pangasianodon hypophthalmus fingerlings reared under different stocking densities. Aquac. Int. 2023, 1–24. [Google Scholar] [CrossRef]
  22. Nguyen, P.T.H.; Do, H.T.T.; Mather, P.B.; Hurwood, D.A. Experimental assessment of the effects of sublethal salinities on growth performance and stress in cultured tra catfish (Pangasianodon hypophthalmus). Fish Physiol. Biochem. 2014, 40, 1839–1848. [Google Scholar] [CrossRef] [PubMed]
  23. Mandal, S.C.; Kadir, S.; Hossain, A. Effects of salinity on the growth, survival and proximate composition of Pangas, Pangasius hypophthalmus. Bangladesh J. Zool. 2020, 48, 141–149. [Google Scholar] [CrossRef]
  24. Ha, N.T.K.; Em, N.T.; Ngoc, N.M.; Takagi, Y.; Phuong, N.T.; Huong, D.T.T. Effects of salinity on growth performance, survival rate, digestive enzyme activities and physiological parameters of striped catfish (Pangasianodon hypophthalmus) at larval stage. Can Tho Univ. J. Sci. 2021, 13, 1–9. [Google Scholar]
  25. Schmitz, M.; Douxfils, J.; Mandiki, S.N.M.; Morana, C.; Baekelandt, S.; Kestemont, P. Chronic hyperosmotic stress interferes with immune homeostasis in striped catfish (Pangasianodon hypophthalmus, S.) and leads to excessive inflammatory response during bacterial infection. Fish Shellfish Immunol. 2016, 55, 550–558. [Google Scholar] [CrossRef]
  26. Schmitz, M.; Mandiki, S.N.M.; Douxfils, J.; Ziv, T.; Admon, A.; Kestemont, P. Synergic stress in striped catfish (Pangasianodon hypophthalmus, S.) exposed to chronic salinity and bacterial infection: Effects on kidney protein expression profile. J. Proteom. 2016, 142, 91–101. [Google Scholar] [CrossRef]
  27. Oanh, D.T.H.; Phu, T.Q. Effect of different salinities on the susceptibility of striped catfish (Pangasianodon hypophthalmus) to Aeromonas hydrophila bacteria causing hemorrhagic disease. Can Tho Univ. J. Sci. 2021, 13, 20–25. [Google Scholar]
  28. Jahan, A.; Nipa, T.T.; Islam, S.M.M.; Uddin, M.H.; Islam, M.S.; Shahjahan, M. Striped catfish (Pangasianodon hypophthalmus) could be suitable for coastal aquaculture. J. Appl. Ichthyol. 2019, 35, 994–1003. [Google Scholar] [CrossRef]
  29. Hieu, D.Q.; Hang, B.T.B.; Huong, D.T.T.; Kertaoui, N.E.; Farnir, F.; Phuong, N.T.; Kestemont, P. Salinity affects growth performance, physiology, immune responses and temperature resistance in striped catfish (Pangasianodon hypophthalmus) during its early life stages. Fish Physiol. Biochem. 2021, 47, 1995–2013. [Google Scholar] [CrossRef]
  30. Hieu, D.Q.; Hang, B.T.B.; Lokesh, J.; Garigliany, M.-M.; Huong, D.T.T.; Yen, D.T.; Liem, P.T.; Tam, B.M.; Hai, D.M.; Son, V.N.; et al. Salinity significantly affects intestinal microbiota and gene expression in striped catfish juveniles. Appl. Microbiol. Biotechnol. 2022, 106, 3245–3264. [Google Scholar] [CrossRef]
  31. Hossain, F.; Islam, S.M.M.; Islam, M.S.; Shahjahan, M. Behavioral and histo-pathological indices of striped catfish (Pangasionodon hypophthalmus) exposed to different salinities. Aquac. Rep. 2022, 23, 101038. [Google Scholar] [CrossRef]
  32. NRC. Nutrient Requirements of Fish and Shrimp; National Academy Press: Washington, DC, USA, 2011; p. 392. [Google Scholar]
  33. AOAC. Official Methods of Analysis, 13th ed.; Association of Analytical Chemists: Washington, DC, USA, 2012; p. 1018. [Google Scholar]
  34. Reznick, A.Z.; Packer, L. Oxidative Damage to Proteins: Spectrophotometric Method for Carbonyl Assay. In Methods in Enzymology; Academic Press: Cambridge, MA, USA, 1994; Volume 233, pp. 357–363. [Google Scholar]
  35. Bancroft, J.D.; Gamble, M. The Hematoxylin and Eosin. In Theory and Practice of Histological Techniques, 7th ed.; Suvarna, S.K., Layton, C., Bancroft, J.D., Eds.; Churchill Livingstone: Edinburgh, UK; New York, NY, USA, 2013; pp. 179–220. [Google Scholar]
  36. Yossa, R.; Verdegem, M. Misuse of multiple comparison tests and underuse of contrast procedures in aquaculture publications. Aquaculture 2015, 437, 344–350. [Google Scholar] [CrossRef]
  37. Dawood, M.A.O.; Noreldin, A.E.; Sewilam, H. Long term salinity disrupts the hepatic function, intestinal health, and gills antioxidative status in Nile tilapia stressed with hypoxia. Ecotoxicol. Environ. Saf. 2021, 220, 112412. [Google Scholar] [CrossRef]
  38. Mohamed, N.A.; Saad, M.F.; Shukry, M.; El-Keredy, A.M.S.; Nasif, O.; Van Doan, H.; Dawood, M.A.O. Physiological and ion changes of Nile tilapia (Oreochromis niloticus) under the effect of salinity stress. Aquac. Rep. 2021, 19, 100567. [Google Scholar] [CrossRef]
  39. Abass, N.Y.; Elwakil, H.E.; Hemeida, A.A.; Abdelsalam, N.R.; Ye, Z.; Su, B.; Alsaqufi, A.S.; Weng, C.-C.; Trudeau, V.L.; Dunham, R.A. Genotype–environment interactions for survival at low and sub-zero temperatures at varying salinity for channel catfish, hybrid catfish and transgenic channel catfish. Aquaculture 2016, 458, 140–148. [Google Scholar] [CrossRef]
  40. Laiz-Carrión, R.; Sangiao-Alvarellos, S.; Guzmán, J.M.; Martín del Río, M.P.; Míguez, J.M.; Soengas, J.L.; Mancera, J.M. Energy Metabolism in Fish Tissues Related to Osmoregulation and Cortisol Action. Fish Physiol. Biochem. 2002, 27, 179–188. [Google Scholar] [CrossRef]
  41. Soengas, J.L.; Sangiao-Alvarellos, S.; Laiz-Carrión, R.; Mancera, J.M. Energy Metabolism and Osmotic Acclimation in Teleost Fish. In Fish Osmoregulation; CRC Press: Boca Raton, FL, USA, 2019; pp. 277–307. [Google Scholar]
  42. Islam, M.J.; Kunzmann, A.; Thiele, R.; Slater, M.J. Effects of extreme ambient temperature in European seabass, Dicentrarchus labrax acclimated at different salinities: Growth performance, metabolic and molecular stress responses. Sci. Total Environ. 2020, 735, 139371. [Google Scholar] [CrossRef]
  43. Ruiz-Jarabo, I.; Barany, A.; Jerez-Cepa, I.; Mancera, J.M.; Fuentes, J. Intestinal response to salinity challenge in the Senegalese sole (Solea senegalensis). Comp. Biochem. Physiol. Part A Mol. Integr. Physiol. 2017, 204, 57–64. [Google Scholar] [CrossRef]
  44. Phuc, N.T.H.; Mather, P.B.; Hurwood, D.A. Effects of sublethal salinity and temperature levels and their interaction on growth performance and hematological and hormonal levels in tra catfish (Pangasianodon hypophthalmus). Aquac. Int. 2017, 25, 1057–1071. [Google Scholar] [CrossRef]
  45. Abdel-Tawwab, M.; Monier, M.N. Stimulatory effect of dietary taurine on growth performance, digestive enzymes activity, antioxidant capacity, and tolerance of common carp, Cyprinus carpio L., fry to salinity stress. Fish Physiol. Biochem. 2018, 44, 639–649. [Google Scholar] [CrossRef]
  46. Dawood, M.A.O.; Noreldin, A.E.; Sewilam, H. Blood biochemical variables, antioxidative status, and histological features of intestinal, gill, and liver tissues of African catfish (Clarias gariepinus) exposed to high salinity and high-temperature stress. Environ. Sci. Pollut. Res. 2022, 29, 56357–56369. [Google Scholar] [CrossRef] [PubMed]
  47. Kumar, A.; Harikrishna, V.; Reddy, A.K.; Chadha, N.; Babitha, A. Salinity tolerance of Pangasianodon hypophthalmus in inland saline water: Effect on growth, survival and haematological parameters. Ecol. Environ. Conserv. 2017, 23, 475–482. [Google Scholar]
  48. Kumar, A.; Krishna, V.H.; Reddy, A.; Chadha, N.; Rani, A.B. Effect of salinity on proximate composition of Pangasianodon hypophthalmus reared in inland saline water. Int. J. Zool. Stud. 2016, 3, 19–21. [Google Scholar]
  49. Xu, J.; Shui, C.; Shi, Y.; Yuan, X.; Liu, Y.; Xie, Y. Effect of Salinity on Survival, Growth, Body Composition, Oxygen Consumption, and Ammonia Excretion of Juvenile Spotted Scat. North Am. J. Aquac. 2020, 82, 54–62. [Google Scholar] [CrossRef]
  50. Barton, B.A. Stress in fishes: A diversity of responses with particular reference to changes in circulating corticosteroids. Integr. Comp. Biol. 2002, 42, 517–525. [Google Scholar] [CrossRef] [PubMed]
  51. Pankhurst, N.W. The endocrinology of stress in fish: An environmental perspective. Gen. Comp. Endocrinol. 2011, 170, 265–275. [Google Scholar] [CrossRef] [PubMed]
  52. Bonga, S.W. The stress response in fish. Physiol. Rev. 1997, 77, 591–625. [Google Scholar] [CrossRef]
  53. Mozanzadeh, M.T.; Safari, O.; Oosooli, R.; Mehrjooyan, S.; Najafabadi, M.Z.; Hoseini, S.J.; Saghavi, H.; Monem, J. The effect of salinity on growth performance, digestive and antioxidant enzymes, humoral immunity and stress indices in two euryhaline fish species: Yellowfin seabream (Acanthopagrus latus) and Asian seabass (Lates calcarifer). Aquaculture 2021, 534, 736329. [Google Scholar] [CrossRef]
  54. Lushchak, V.I. Environmentally induced oxidative stress in aquatic animals. Aquat. Toxicol. 2011, 101, 13–30. [Google Scholar] [CrossRef]
  55. Lushchak, V.I. Free radicals, reactive oxygen species, oxidative stress and its classification. Chem. Biol. Interact. 2014, 224, 164–175. [Google Scholar] [CrossRef]
  56. Nordberg, J.; Arnér, E.S.J. Reactive oxygen species, antioxidants, and the mammalian thioredoxin system. Free Radic. Biol. Med. 2001, 31, 1287–1312. [Google Scholar] [CrossRef]
  57. Chang, C.-H.; Wang, Y.-C.; Lee, T.-H. Hypothermal stress-induced salinity-dependent oxidative stress and apoptosis in the livers of euryhaline milkfish, Chanos chanos. Aquaculture 2021, 534, 736280. [Google Scholar] [CrossRef]
  58. Paital, B.; Chainy, G.B.N. Antioxidant defenses and oxidative stress parameters in tissues of mud crab (Scylla serrata) with reference to changing salinity. Comp. Biochem. Physiol. Part C Toxicol. Pharmacol. 2010, 151, 142–151. [Google Scholar] [CrossRef]
  59. Rivera-Ingraham, G.A.; Barri, K.; Boël, M.; Farcy, E.; Charles, A.-L.; Geny, B.; Lignot, J.-H. Osmoregulation and salinity-induced oxidative stress: Is oxidative adaptation determined by gill function? J. Exp. Biol. 2016, 219, 80–89. [Google Scholar] [CrossRef]
  60. Paital, B.; Chainy, G.B.N. Effects of salinity on O2 consumption, ROS generation and oxidative stress status of gill mitochondria of the mud crab Scylla serrata. Comp. Biochem. Physiol. Part C Toxicol. Pharmacol. 2012, 155, 228–237. [Google Scholar] [CrossRef]
  61. Bernet, D.; Schmidt, H.; Meier, W.; Burkhardt-Holm, P.; Wahli, T. Histopathology in fish: Proposal for a protocol to assess aquatic pollution. J. Fish Dis. 1999, 22, 25–34. [Google Scholar] [CrossRef]
  62. Hughes, G.M.; Morgan, M. The structure of fish gills in relation to their respiratory function. Biol. Rev. 1973, 48, 419–475. [Google Scholar] [CrossRef]
  63. Wilson, J.M.; Laurent, P. Fish gill morphology: Inside out. J. Exp. Zool. 2002, 293, 192–213. [Google Scholar] [CrossRef]
  64. Wedemeyer, G.A. Interactions with Water Quality Conditions. In Physiology of Fish in Intensive Culture Systems; Wedemeyer, G.A., Ed.; Springer: Boston, MA, USA, 1996; pp. 60–110. [Google Scholar]
  65. Khafaga, A.F.; Naiel, M.A.E.; Dawood, M.A.O.; Abdel-Latif, H.M.R. Dietary Origanum vulgare essential oil attenuates cypermethrin-induced biochemical changes, oxidative stress, histopathological alterations, apoptosis, and reduces DNA damage in Common carp (Cyprinus carpio). Aquat. Toxicol. 2020, 228, 105624. [Google Scholar] [CrossRef]
  66. Poleksić, V.; Mitrović-Tutundžić, V. Fish Gills as a Monitor of Sublethal and Chronic Effects of Pollution. In Sublethal and Chronic Effects of Pollutants on Freshwater Fish; Muller, R., Lloyd, R., Eds.; Fishing News Books Ltd.: Farnham, UK, 1994; pp. 339–352. [Google Scholar]
  67. Azodi, M.; Bahabadi, M.N.; Ghasemi, A.; Morshedi, V.; Mozanzadeh, M.T.; Shahraki, R.; Khademzadeh, O.; Hamedi, S.; Avizhgan, S. Effects of salinity on gills’ chloride cells, stress indices, and gene expression of Asian seabass (Lates calcarifer, Bloch, 1790). Fish Physiol. Biochem. 2021, 47, 2027–2039. [Google Scholar] [CrossRef]
  68. Carmona, R.; García-Gallego, M.; Sanz, A.; Domezaín, A.; Ostos-Garrido, M.V. Chloride cells and pavement cells in gill epithelia of Acipenser naccarii: Ultrastructural modifications in seawater-acclimated specimens. J. Fish Biol. 2004, 64, 553–566. [Google Scholar] [CrossRef]
  69. Maetz, J.; Keynes, R.D. Fish gills: Mechanisms of salt transfer in fresh water and sea water. Philos. Trans. R. Soc. London. B Biol. Sci. 1971, 262, 209–249. [Google Scholar] [CrossRef]
  70. Kültz, D. Physiological mechanisms used by fish to cope with salinity stress. J. Exp. Biol. 2015, 218, 1907–1914. [Google Scholar] [CrossRef] [PubMed]
  71. Van der Oost, R.; Beyer, J.; Vermeulen, N.P.E. Fish bioaccumulation and biomarkers in environmental risk assessment: A review. Environ. Toxicol. Pharmacol. 2003, 13, 57–149. [Google Scholar] [CrossRef]
  72. Stentiford, G.D.; Longshaw, M.; Lyons, B.P.; Jones, G.; Green, M.; Feist, S.W. Histopathological biomarkers in estuarine fish species for the assessment of biological effects of contaminants. Mar. Environ. Res. 2003, 55, 137–159. [Google Scholar] [CrossRef]
  73. Johnston, I.A. Muscle development and growth: Potential implications for flesh quality in fish. Aquaculture 1999, 177, 99–115. [Google Scholar] [CrossRef]
  74. Johnston, I.A. Environment and plasticity of myogenesis in teleost fish. J. Exp. Biol. 2006, 209, 2249–2264. [Google Scholar] [CrossRef]
  75. Periago, M.J.; Ayala, M.D.; López-Albors, O.; Abdel, I.; Martínez, C.; García-Alcázar, A.; Ros, G.; Gil, F. Muscle cellularity and flesh quality of wild and farmed sea bass, Dicentrarchus labrax L. Aquaculture 2005, 249, 175–188. [Google Scholar] [CrossRef]
Figure 1. The relationship between (A) final fish weight (Wt56; g), (B) specific growth rate (SGR; %g/day), (C) weight gain %, and (D) feed intake (g feed/fish) of P. hypophthalmus exposed to different salinity levels for 56 days as described by second-order polynomial regression equations.
Fishes 08 00282 g001
Figure 2. A panel of stress markers: (A) blood glucose (mg/dL), (B) lactate (mg/dL), (C) cortisol (ng/dL), and (D) liver carbonyl protein concentrations (nmol/mg protein) of P. hypophthalmus exposed to different salinity levels for 56 days. Data represent three replicates per group with means ± standard error (S.E.) (n = 6). The CNT (control) group and other experimental groups were compared by one-way ANOVA analysis followed by Duncan’s Multiple Range test. Bars assigned with different letters are significantly different (p < 0.05).
Fishes 08 00282 g002
Figure 3. A panel of liver oxidative stress biomarkers: (A) catalase enzyme (CAT; U/mg protein), (B) superoxide dismutase enzyme (SOD; U/mg protein), (C) glutathione peroxidase enzyme (GPX; U/mg protein), and (D) malondialdehyde concentrations (MDA; nmol/mg protein) of P. hypophthalmus exposed to different salinity levels for 56 days. Data represent three replicates per group with means ± standard error (S.E.) (n = 6). The CNT (control) group and other experimental groups were compared by one-way ANOVA analysis followed by Duncan’s Multiple Range test. Bars assigned with different letters are significantly different (p < 0.05).
Fishes 08 00282 g003
Figure 4. The relationship between blood glucose (mg/dL), lactate (mg/dL), cortisol (ng/dL), and hepatic carbonyl proteins (nmol/mg protein) of P. hypophthalmus exposed to different salinity levels for 56 days as described by second-order polynomial regression equations.
Fishes 08 00282 g004
Figure 5. Representative photomicrographs in dorsal muscular tissues of P. hypophthalmus (H and E stain) (scale bar = 50 μm) exposed to different degrees of salinity (4, 8, 12, and 16‰) for 56 days. (A) control, (B) 4‰ salinity, (C) 8‰ salinity, (D) 12‰ salinity, and (E) 16‰ salinity. The muscular tissues showed normal striation and histologic structure (A) a focal separation between dermis and muscle (arrows) and mild atrophy in the subcutaneous muscle bundle (asterisk) (B,C), and degeneration and atrophy of muscle bundles, separation of the dermis (black arrow), vacuums (V) in the muscle layer, hyalinization of myotomes (red arrows), splitting and vacuolization of muscle fibers (blue arrows), and thickening of fibrous tissues separating muscle bundles (yellow arrow) (D,E).
Fishes 08 00282 g005
Figure 6. Representative photomicrographs in the hepatopancreas of P. hypophthalmus (H and E stain, scale bar = 50 μm) exposed to different degrees of salinity (4, 8, 12, and 16‰) for 56 days. (A) control, (B) 4‰ salinity, (C) 8‰ salinity, (D) 12‰ salinity, and (E) 16‰ salinity. Hepatopancreatic tissues showed normal histologic limits of hepatic cells and cord, exocrine pancreases acini, and bile canaliculi (A), hepatocytic vacuolization (black arrows), individual cell necrosis (red arrows) (B,C), diffuse vacuolization of vacuolar (black arrows) and fatty types (red arrows), and focal areas of lytic necrosis of hepatocytes (yellow arrow) and exocrine pancreatic acini (blue arrow) (D,E).
Fishes 08 00282 g006
Figure 7. Representative photomicrographs in the gills of P. hypophthalmus (H and E stain, scale bar = 200 μm, and scale bar = 50 μm for E, G, and H) exposed to different degrees of salinity (4, 8, 12, and 16‰) for 56 days. (A) control, (B) 4‰ salinity, (C) 8‰ salinity, (D,E) 12‰ salinity, and (FH) 16‰ salinity. Figure 7E is a higher magnification of dotted rectangle in Figure 7D, meanwhile Figure 7G,H is a higher magnification of dotted rectangle in Figure 7F. Gill tissues showed normal histologic limits of central venous sinus, primary and secondary lamellae (A), epithelial hyperplasia (black arrows) and congestion of primary lamellar blood capillaries (yellow arrows) (B), epithelial hyperplasia and fusion (black arrow) with lamellar epithelial lifting and edema (blue arrows) (C), marked epithelial hyperplasia and fusion (black arrows) and marked edema and epithelial lifting (blue arrows) (D,E), and complete rupture for the epithelial layer (black arrows), marked hyperplasia in chloride and mucous cells (yellow arrow), and clubbed tips of the secondary lamellae (red arrows) (FH).
Fishes 08 00282 g007
Table 1. Growth performance and survival rates of P. hypophthalmus juveniles subjected to different salinity levels for 56 days.
ParametersSalinity Levels (‰)p Value
0.0 (Control)4.08.012.016.0
Initial weight (Wt0; g)17.5 ± 0.0917.3 ± 0.0917.5 ± 0.1217.5 ± 0.1217.6 ± 0.120.990
Final weight (Wt56; g)48.7 ± 0.64 a48.2 ± 0.53 a45.1 ± 1.07 b39.4 ± 0.59 c36.7 ± 0.78 d< 0.001
Weight gain %177.3 ± 2.91 a178.6 ± 1.55 a157.7 ± 4.56 b125.1 ± 1.89 c108.5 ± 3.23 d< 0.001
Specific growth rate (%/day)1.83 ± 0.019 a1.83 ± 0.015 a1.69 ± 0.052 b1.45 ± 0.022 c1.31 ± 0.043 d< 0.001
Feed intake (g feed/fish)52.0 ± 0.13 a51.0 ± 0.29 a51.2 ± 0.19 a42.3 ± 0.33 b37.7 ± 1.01 b< 0.001
Feed conversion ratio 1.67 ± 0.032 b1.65 ± 0.032 b1.86 ± 0.065 a1.93 ± 0.055 a1.97 ± 0.073 a0.005
Fish survival (%)100.0 ± 0.00 a100.0 ± 0.00 a100.0 ± 0.00 a91.1 ± 2.22 b77.8 ± 2.22 c< 0.001
Means having different letters in the same row are significantly different at p < 0.05 (Duncan’s Multiple Range test).
Table 2. Proximate chemical composition of whole body (% on a fresh weight basis) of striped catfish, P. hypophthalmus juveniles, subjected to different salinity levels for 56 days.
Parameters (%)Salinity Levels (‰)p Value
0.0 (Control)4.08.012.016.0
Moisture76.2 ± 0.08 a76.8 ± 0.36 a74.7 ± 0.38 b74.6 ± 0.58 b73.7 ± 0.36 b0.001
Crude protein14.8 ± 0.11 b14.5 ± 0.26 b15.8 ± 0.20 a15.9 ± 0.42 a16.0 ± 0.48 a0.023
Crude lipids4.2 ± 0.08 c4.2 ± 0.04 c4.7 ± 0.10 b5.2 ± 0.21 a5.2 ± 0.20 a0.001
Ash3.1 ± 0.032.8 ± 0.033.0 ± 0.062.8 ± 0.152.9 ± 0.230.480
Means having different letters in the same row are significantly different at p < 0.05 (Duncan’s Multiple Range test).
Table 3. Semi-quantitative scoring for the most common lesions occurred in the muscular tissues, liver, and gills of striped catfish, P. hypophthalmus juveniles, subjected to different salinity levels for 56 days compared with the control group.
OrgansScored LesionsSalinity Levels (‰)p Value
0.04.08.012.016.0
Muscular tissuesDermis separation3.006.835.6611.6612.830.0261
Atrophy of muscle bundles3.505.006.5012.0013.000.0162
Hyalinization of myotomes4.004.007.0012.0013.000.0160
Splitting and vacuolization of muscle fibers4.005.505.5012.5012.500.0147
LiverVascular congestion4.004.009.0011.5011.500.0215
Vacuolization3.334.507.8310.8313.500.0171
Necrosis5.005.005.0011.5013.500.0087
GillsEpithelial hyperplasia and fusion2.505.168.0011.3313.000.0156
Epithelial necrosis and rupture4.504.506.1612.3312.500.0177
Lamellar epithelial lifting and edema3.004.0011.0011.0011.000.0087
Chloride cells hyperplasia2.005.008.5011.5013.000.0100
Disclaimer/Publisher’s Note: The statements, opinions and data contained in all publications are solely those of the individual author(s) and contributor(s) and not of MDPI and/or the editor(s). MDPI and/or the editor(s) disclaim responsibility for any injury to people or property resulting from any ideas, methods, instructions or products referred to in the content.

