
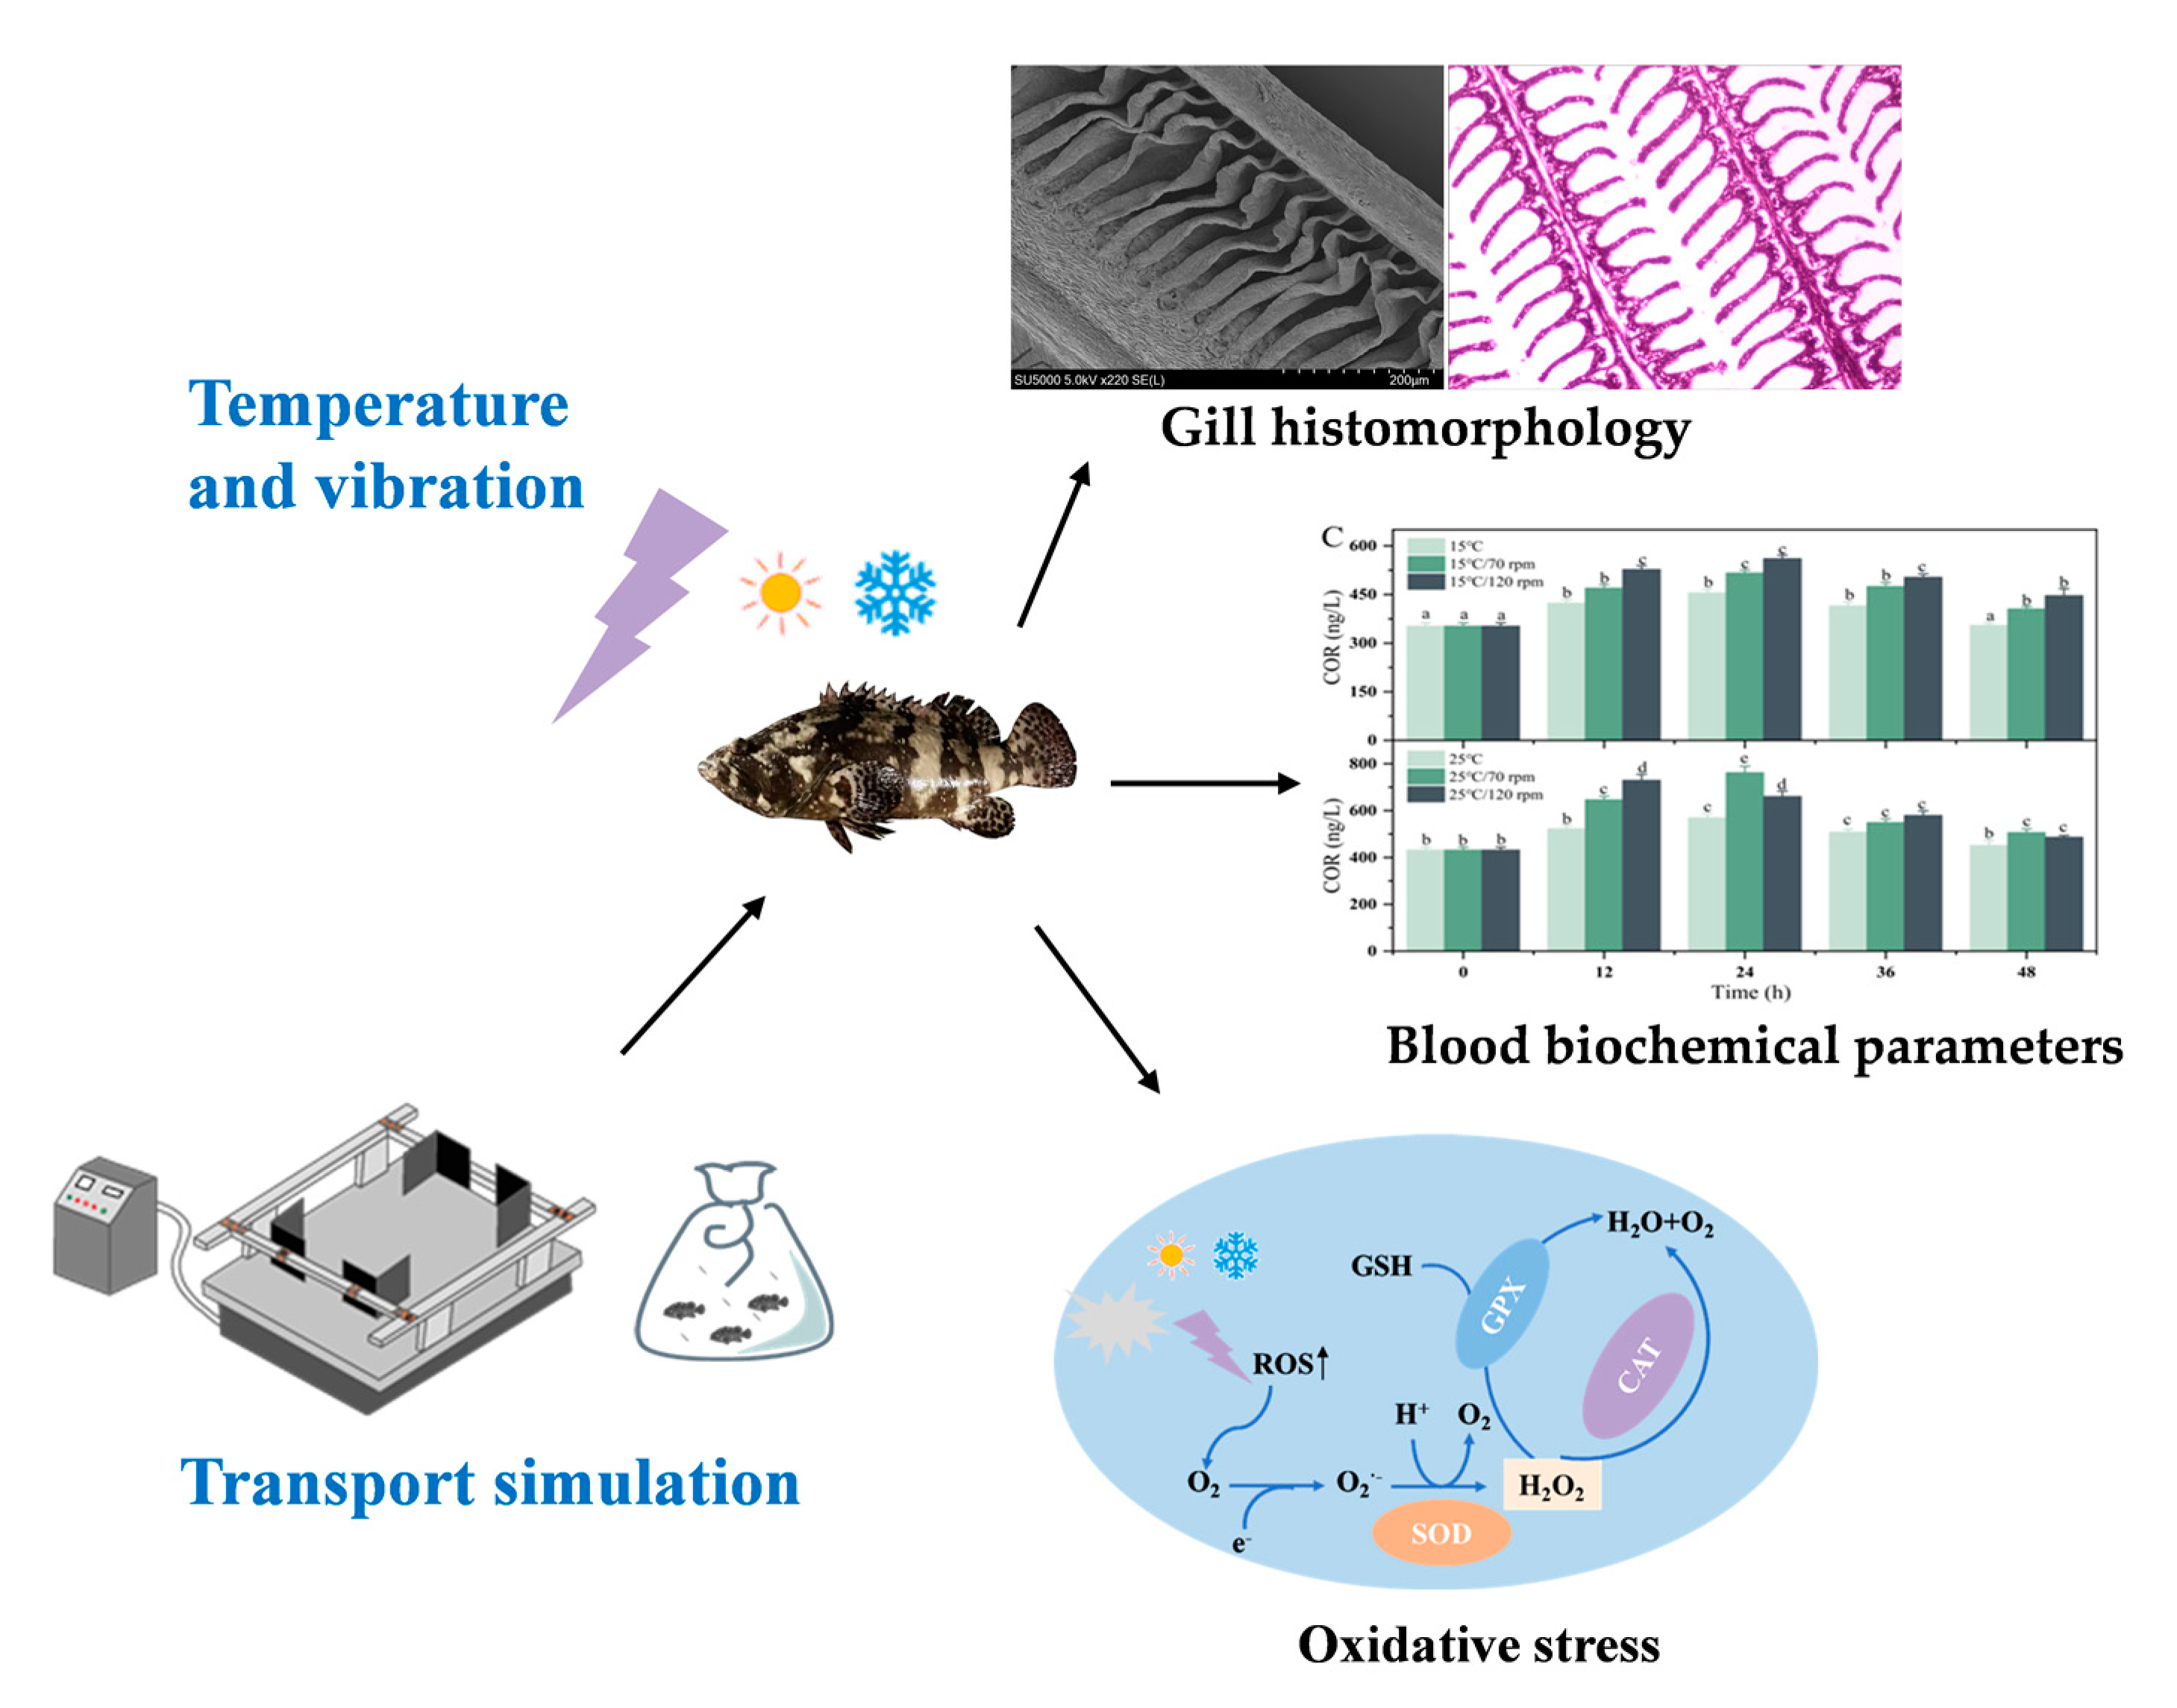
The Effects of Transport Stress (Temperature and Vibration) on Blood Biochemical Parameters, Oxidative Stress, and Gill Histomorphology of Pearl Gentian Groupers


Abstract

1. Introduction
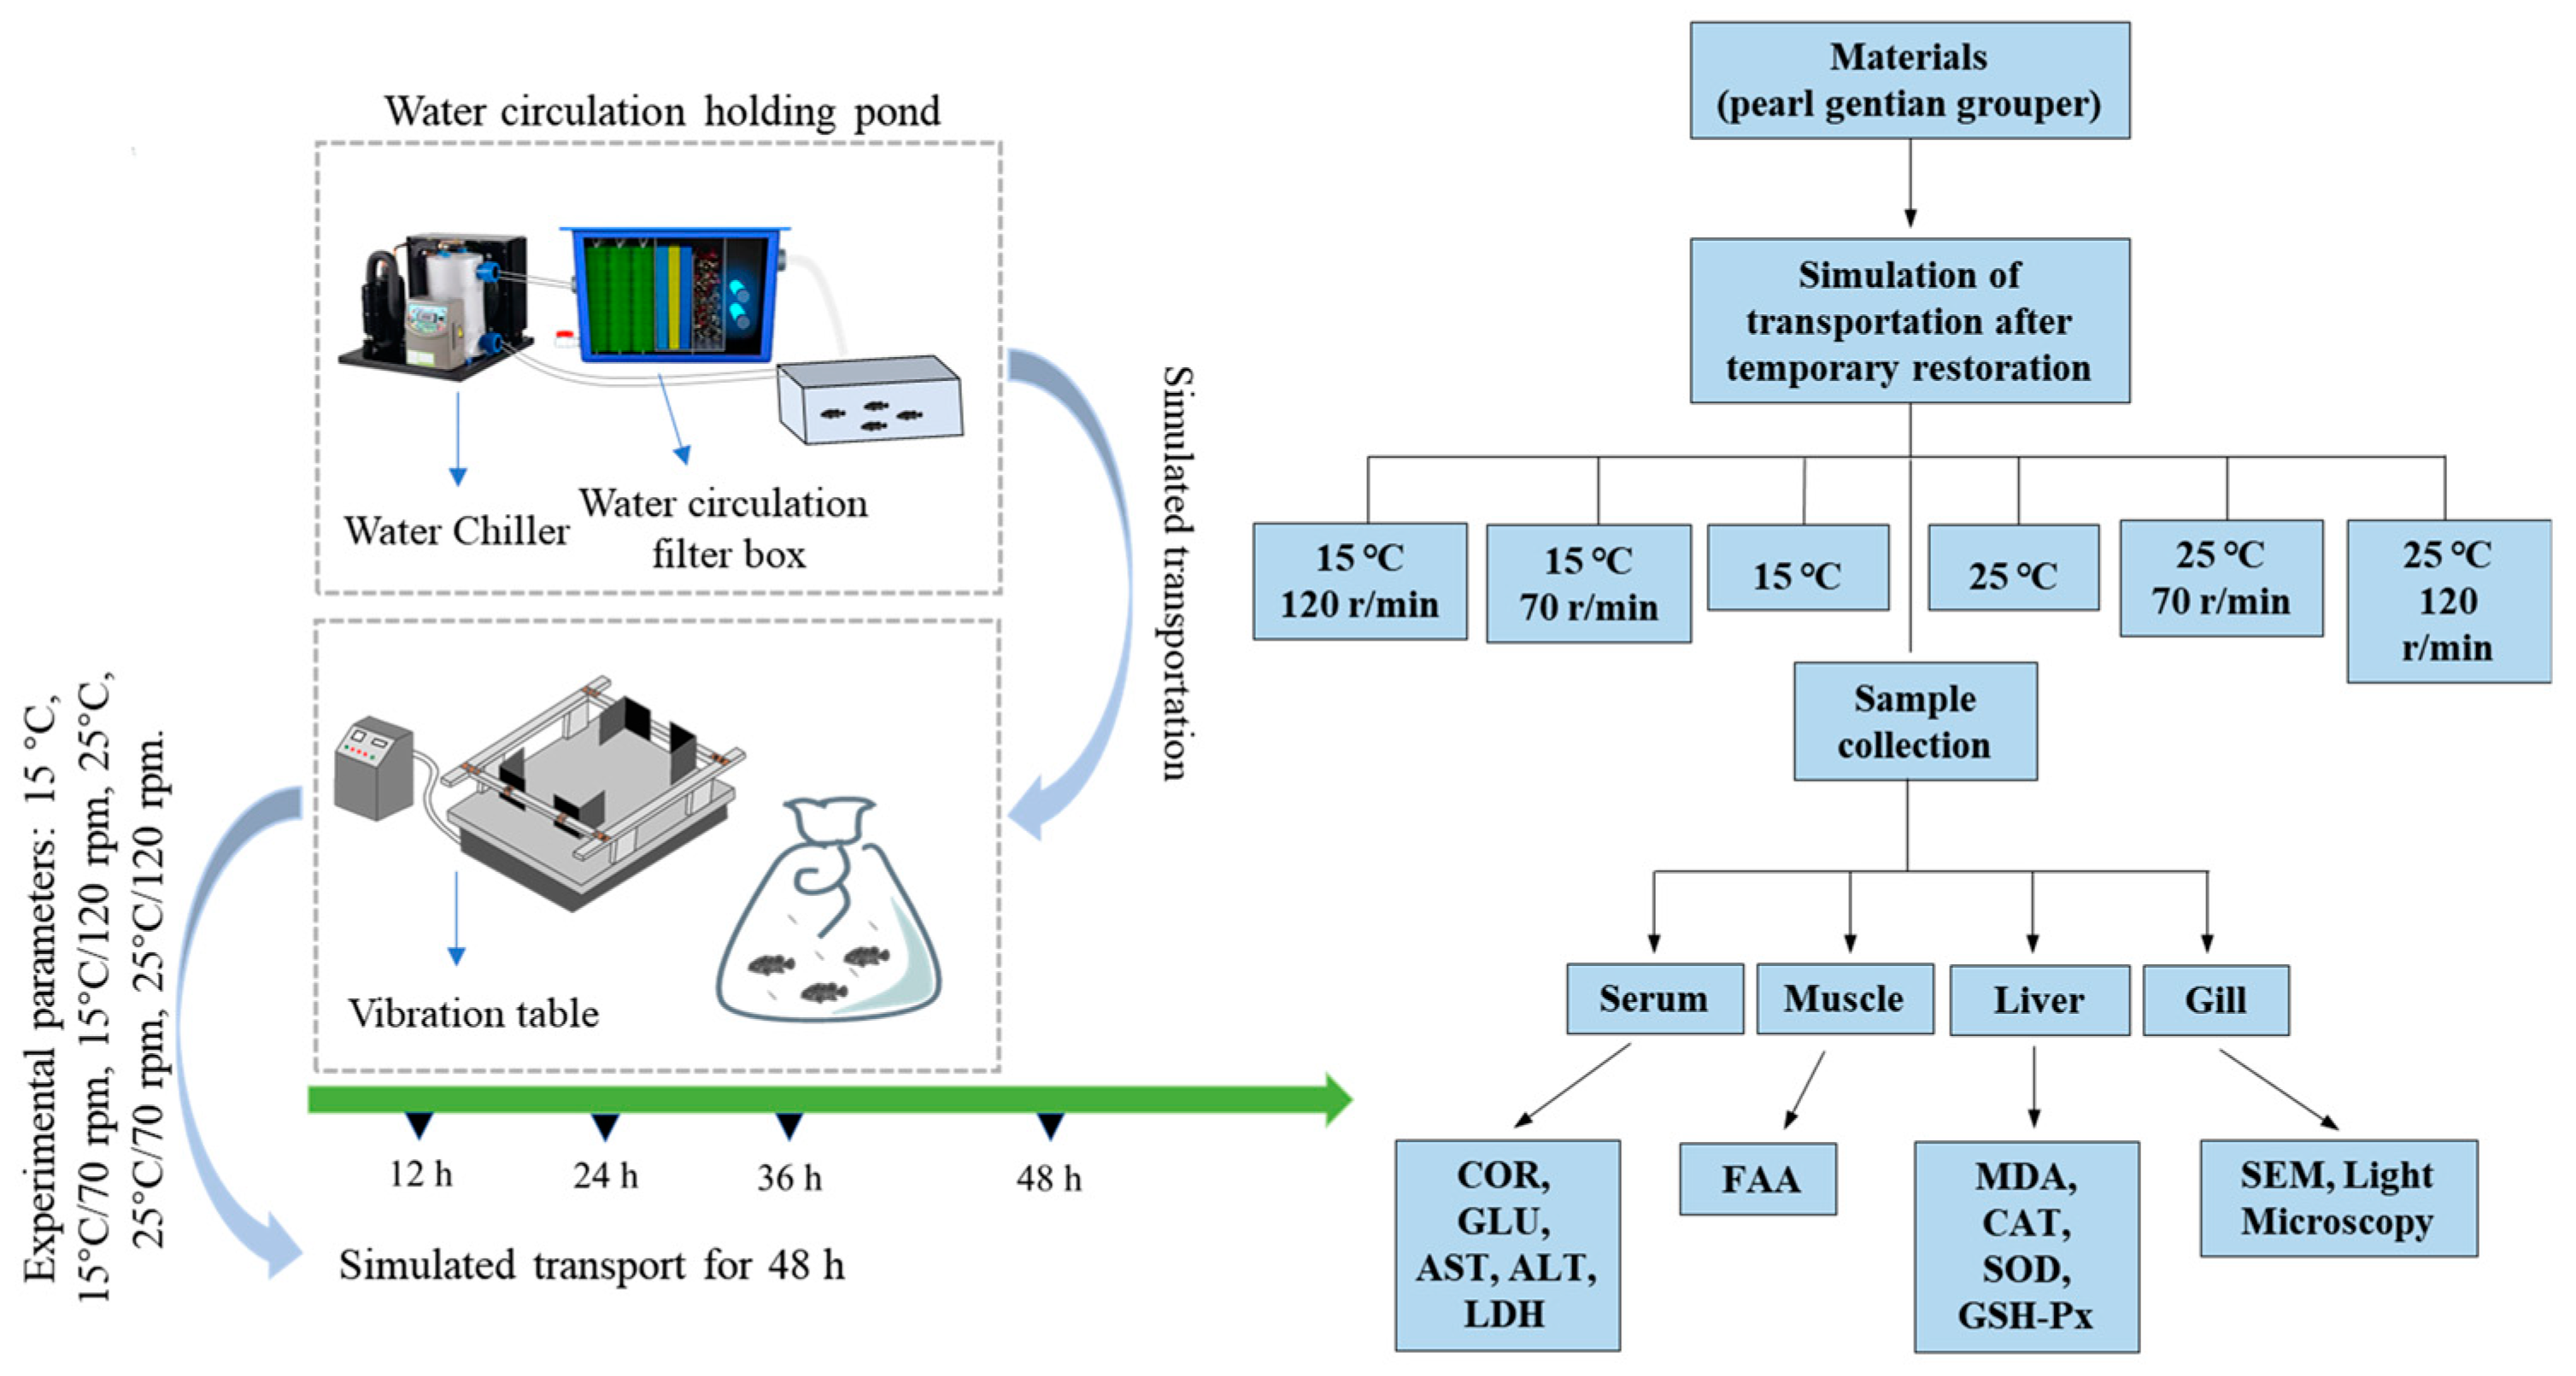
2. Materials and Methods
2.1. Experimental Fishes
2.2. Simulated Transportation
2.3. Samples Collection
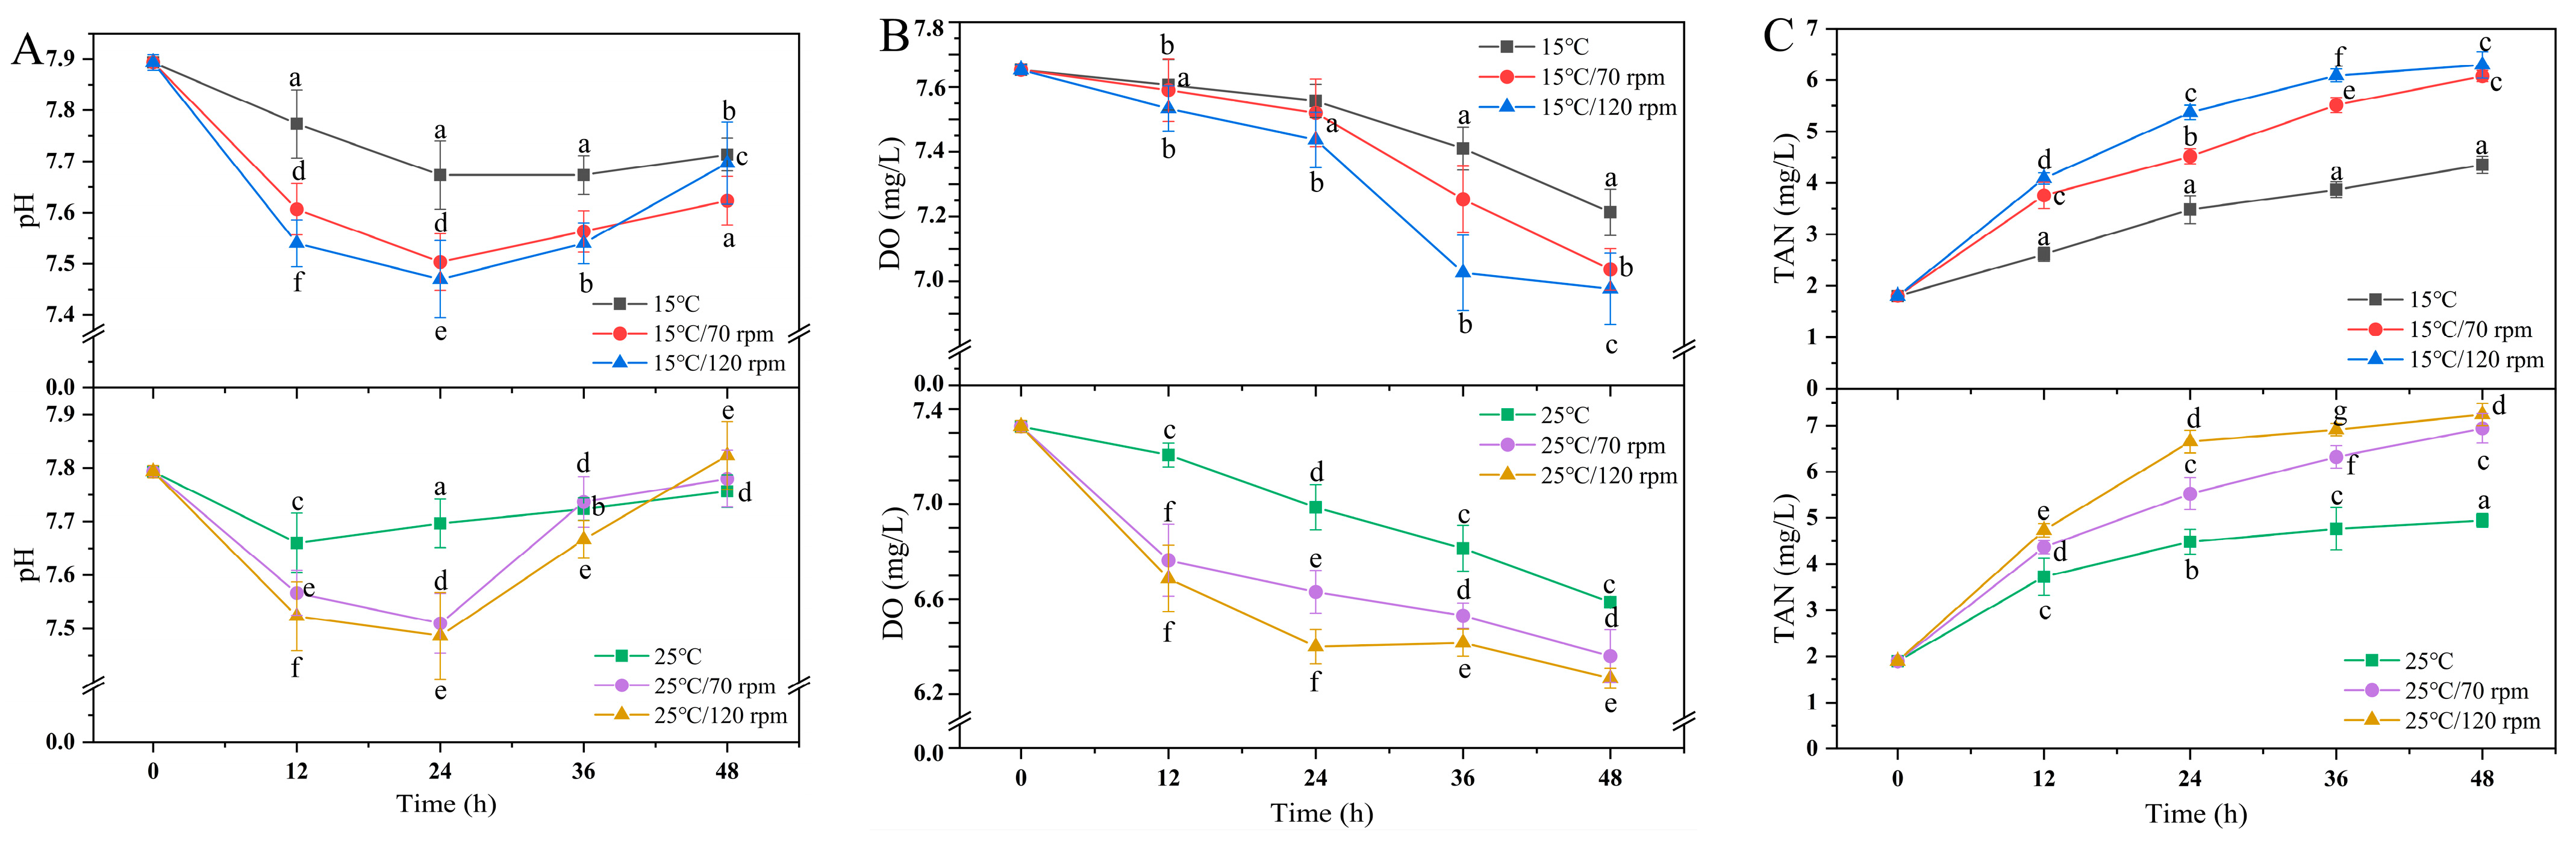
2.4. Water Quality
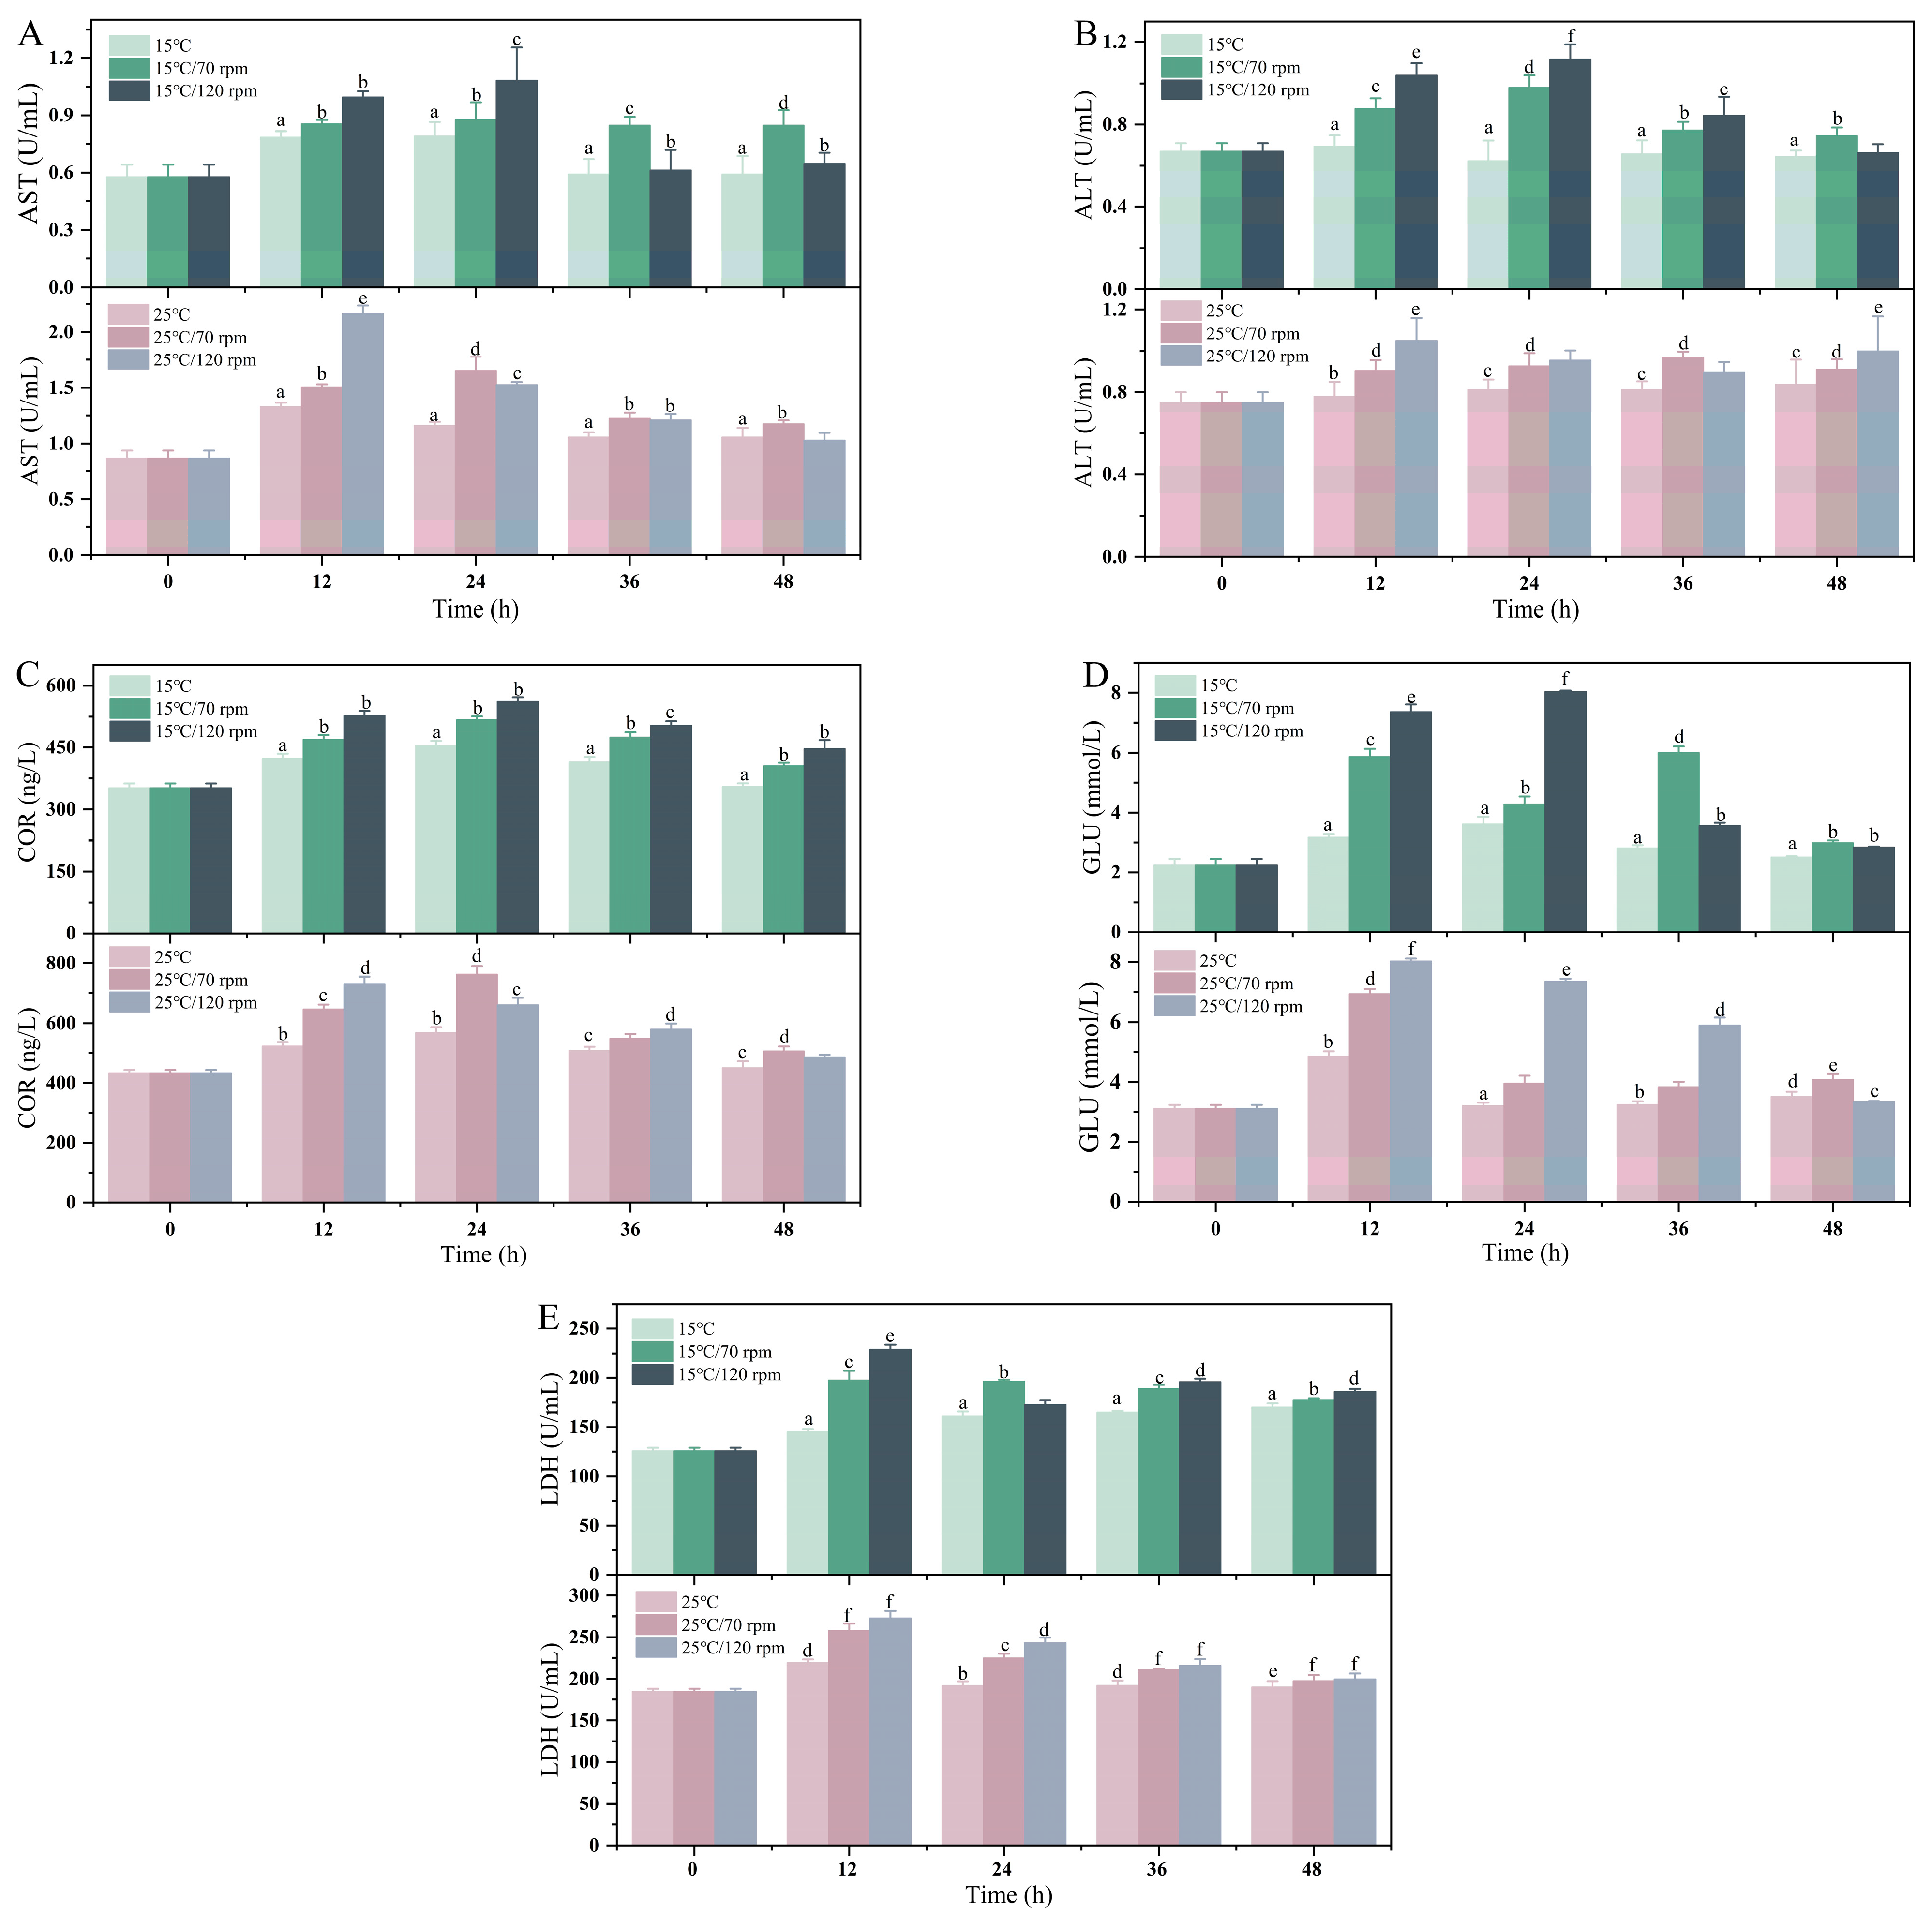
2.5. Serum Biochemical Analysis
2.6. Liver Biochemical Analysis
2.7. Light Microscopy Analysis
2.8. Scanning Electron Microscopy Analysis
2.9. Free Amino Acids
2.10. Statistical Analysis
3. Results
3.1. Survival Rate
3.2. Water Quality Parameters
3.3. Serum Biochemical Parameters
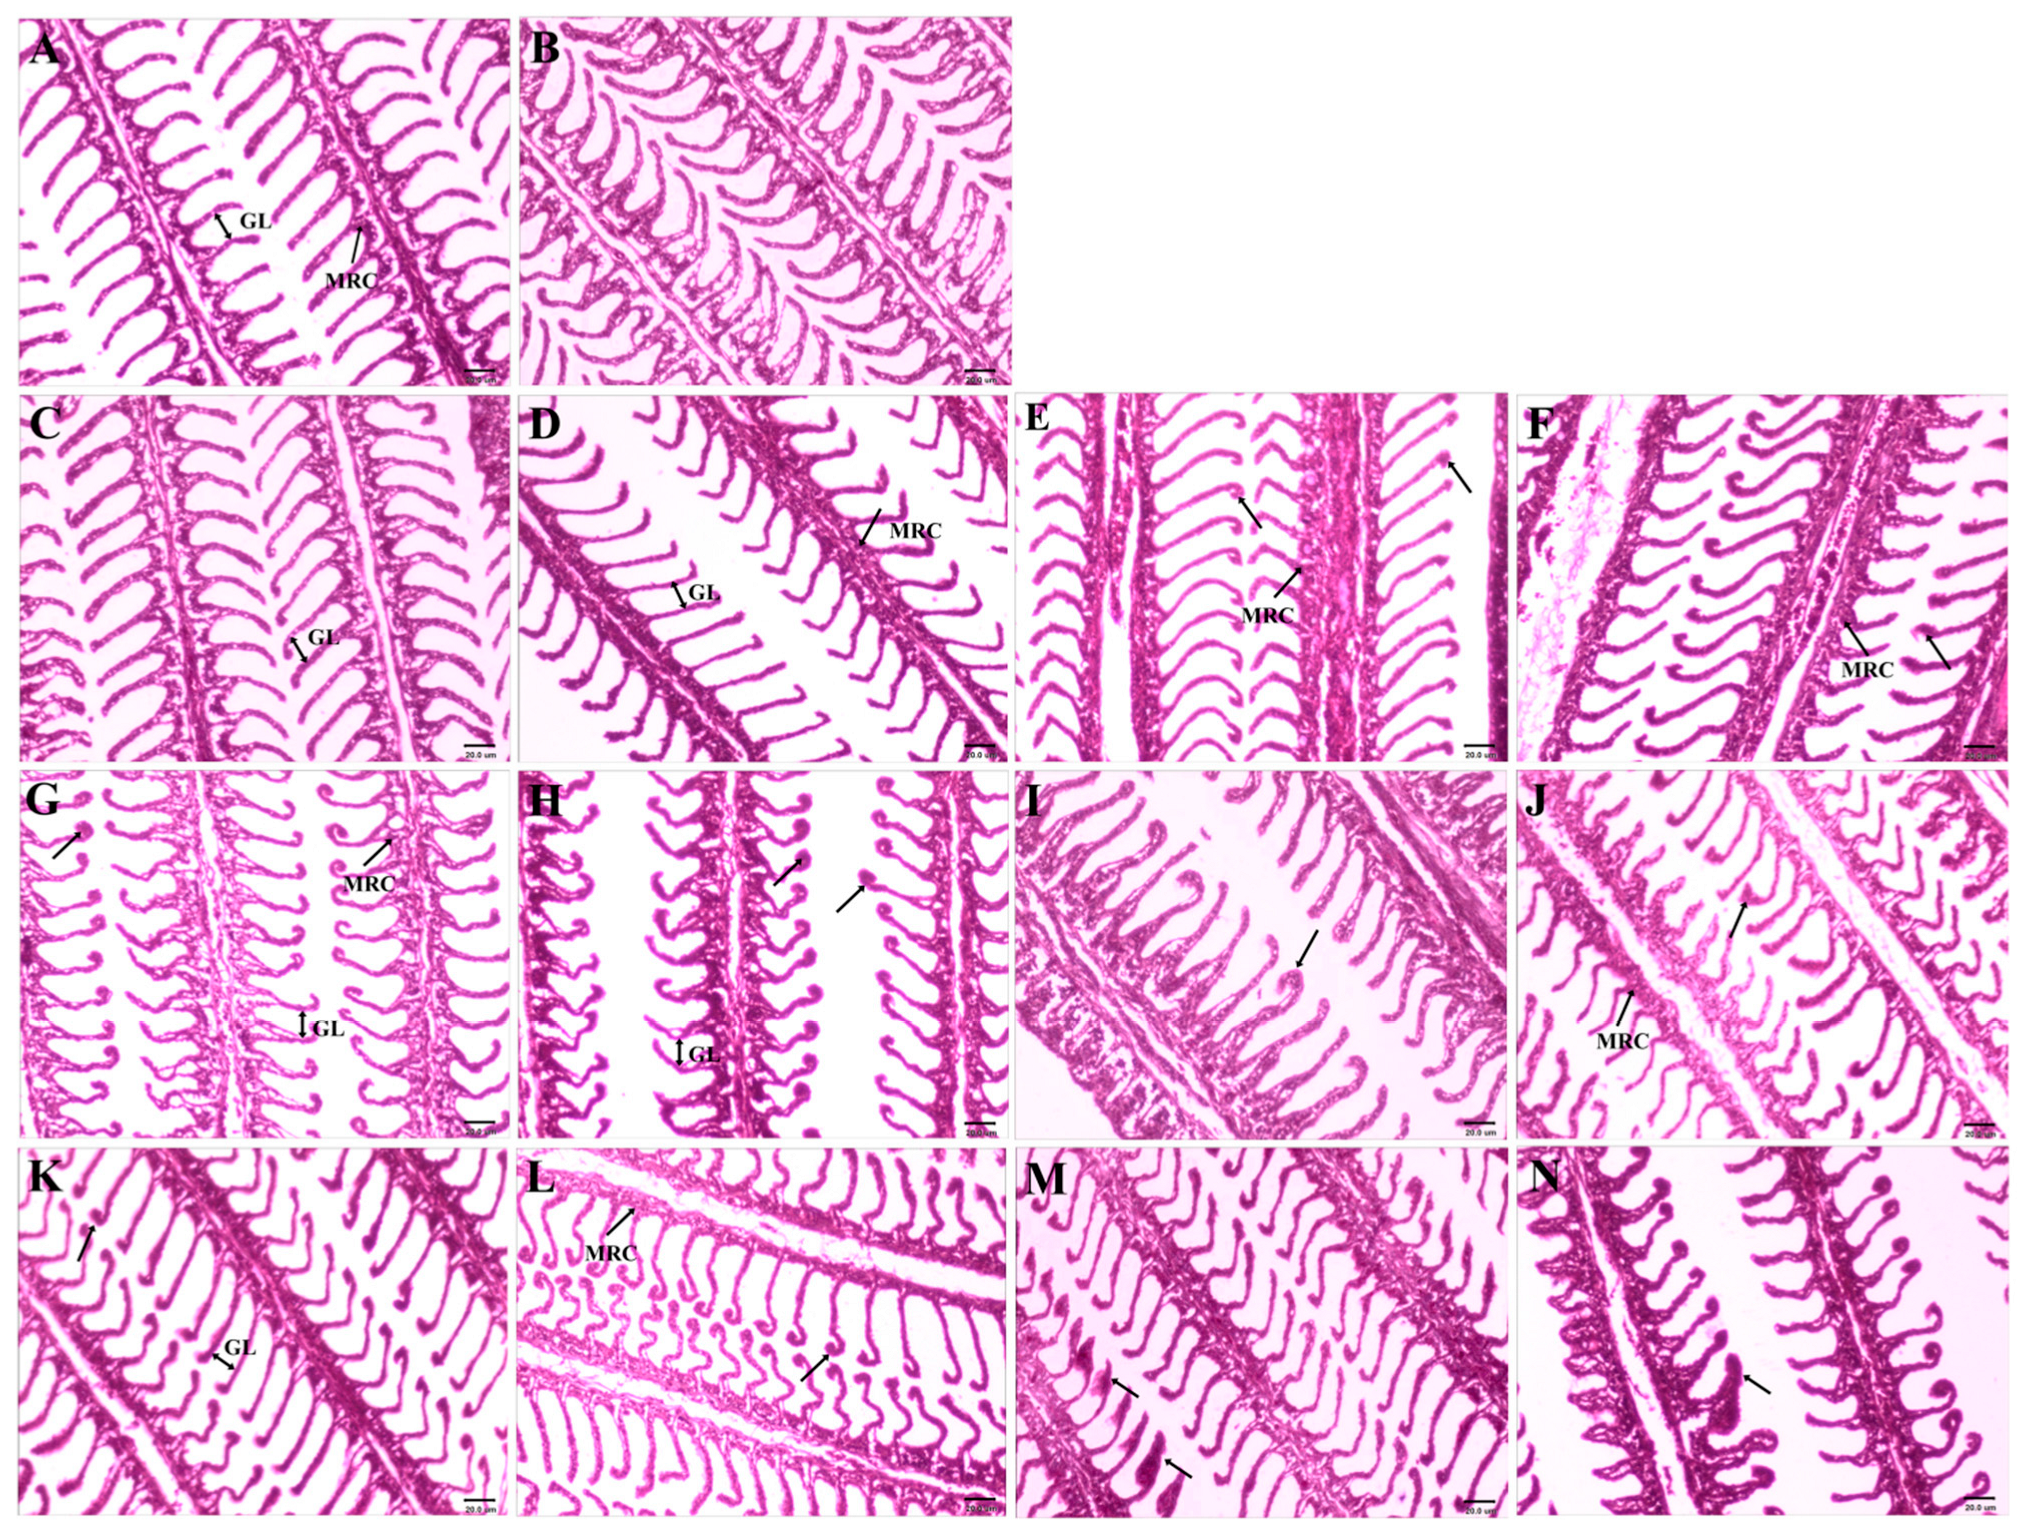
3.4. Light Microscopy Analysis
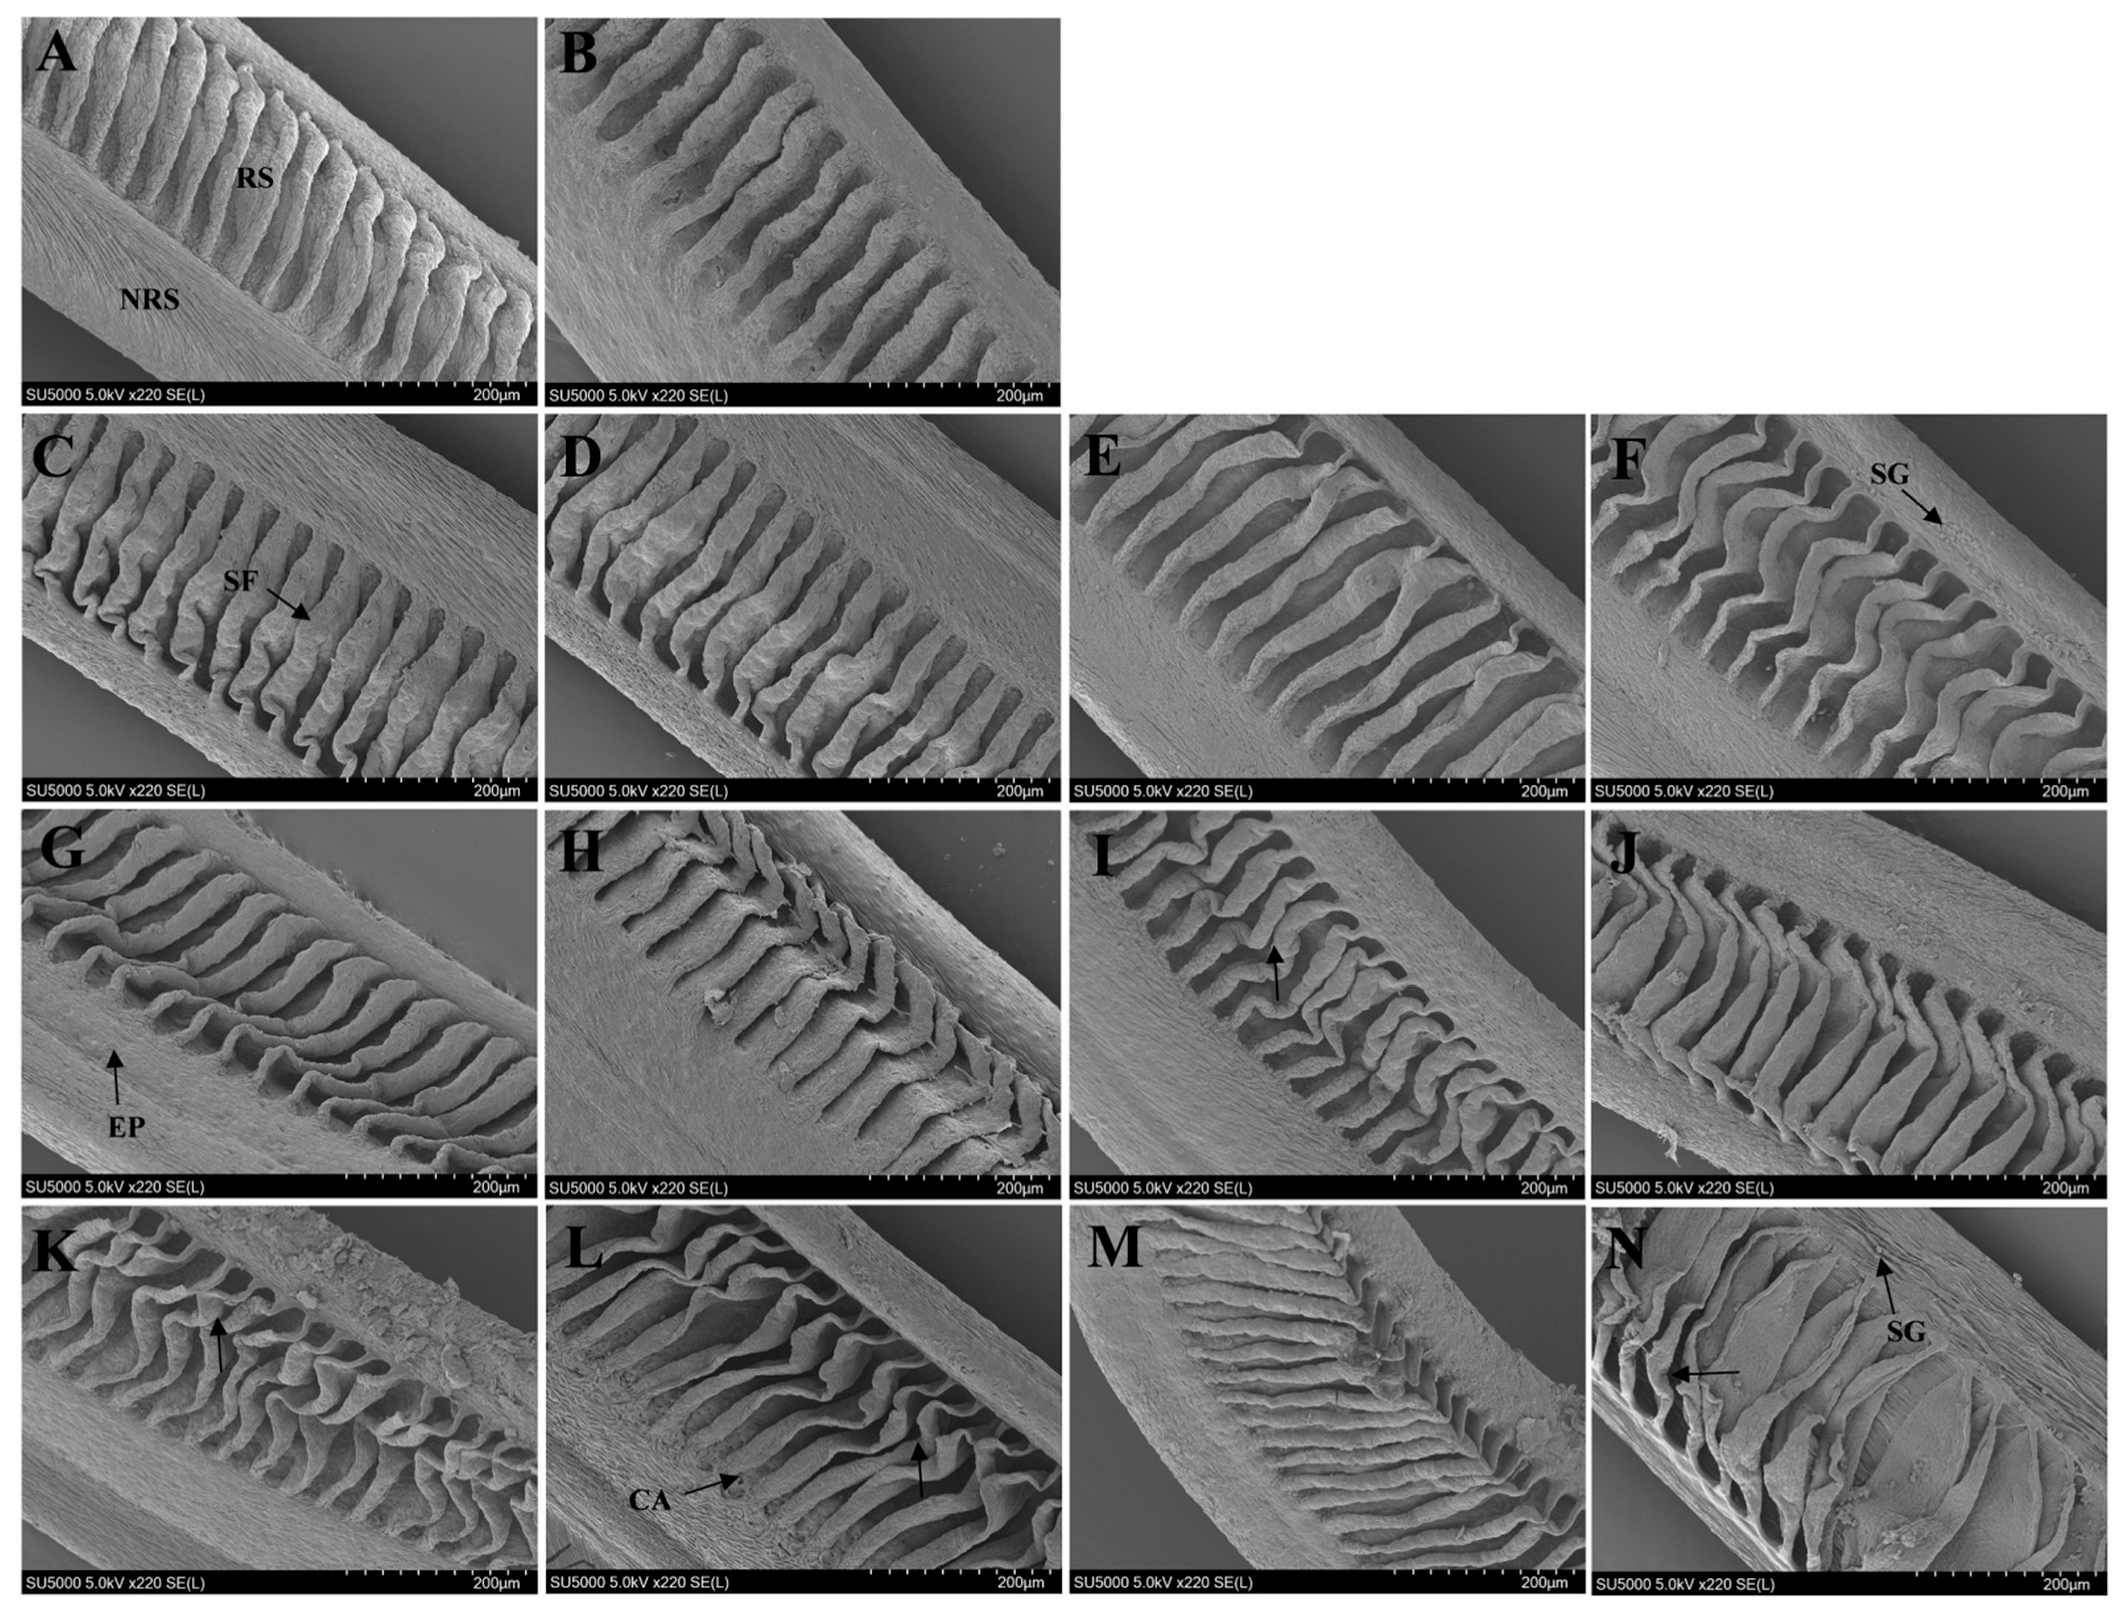
3.5. Scanning Electron Microscope Analysis
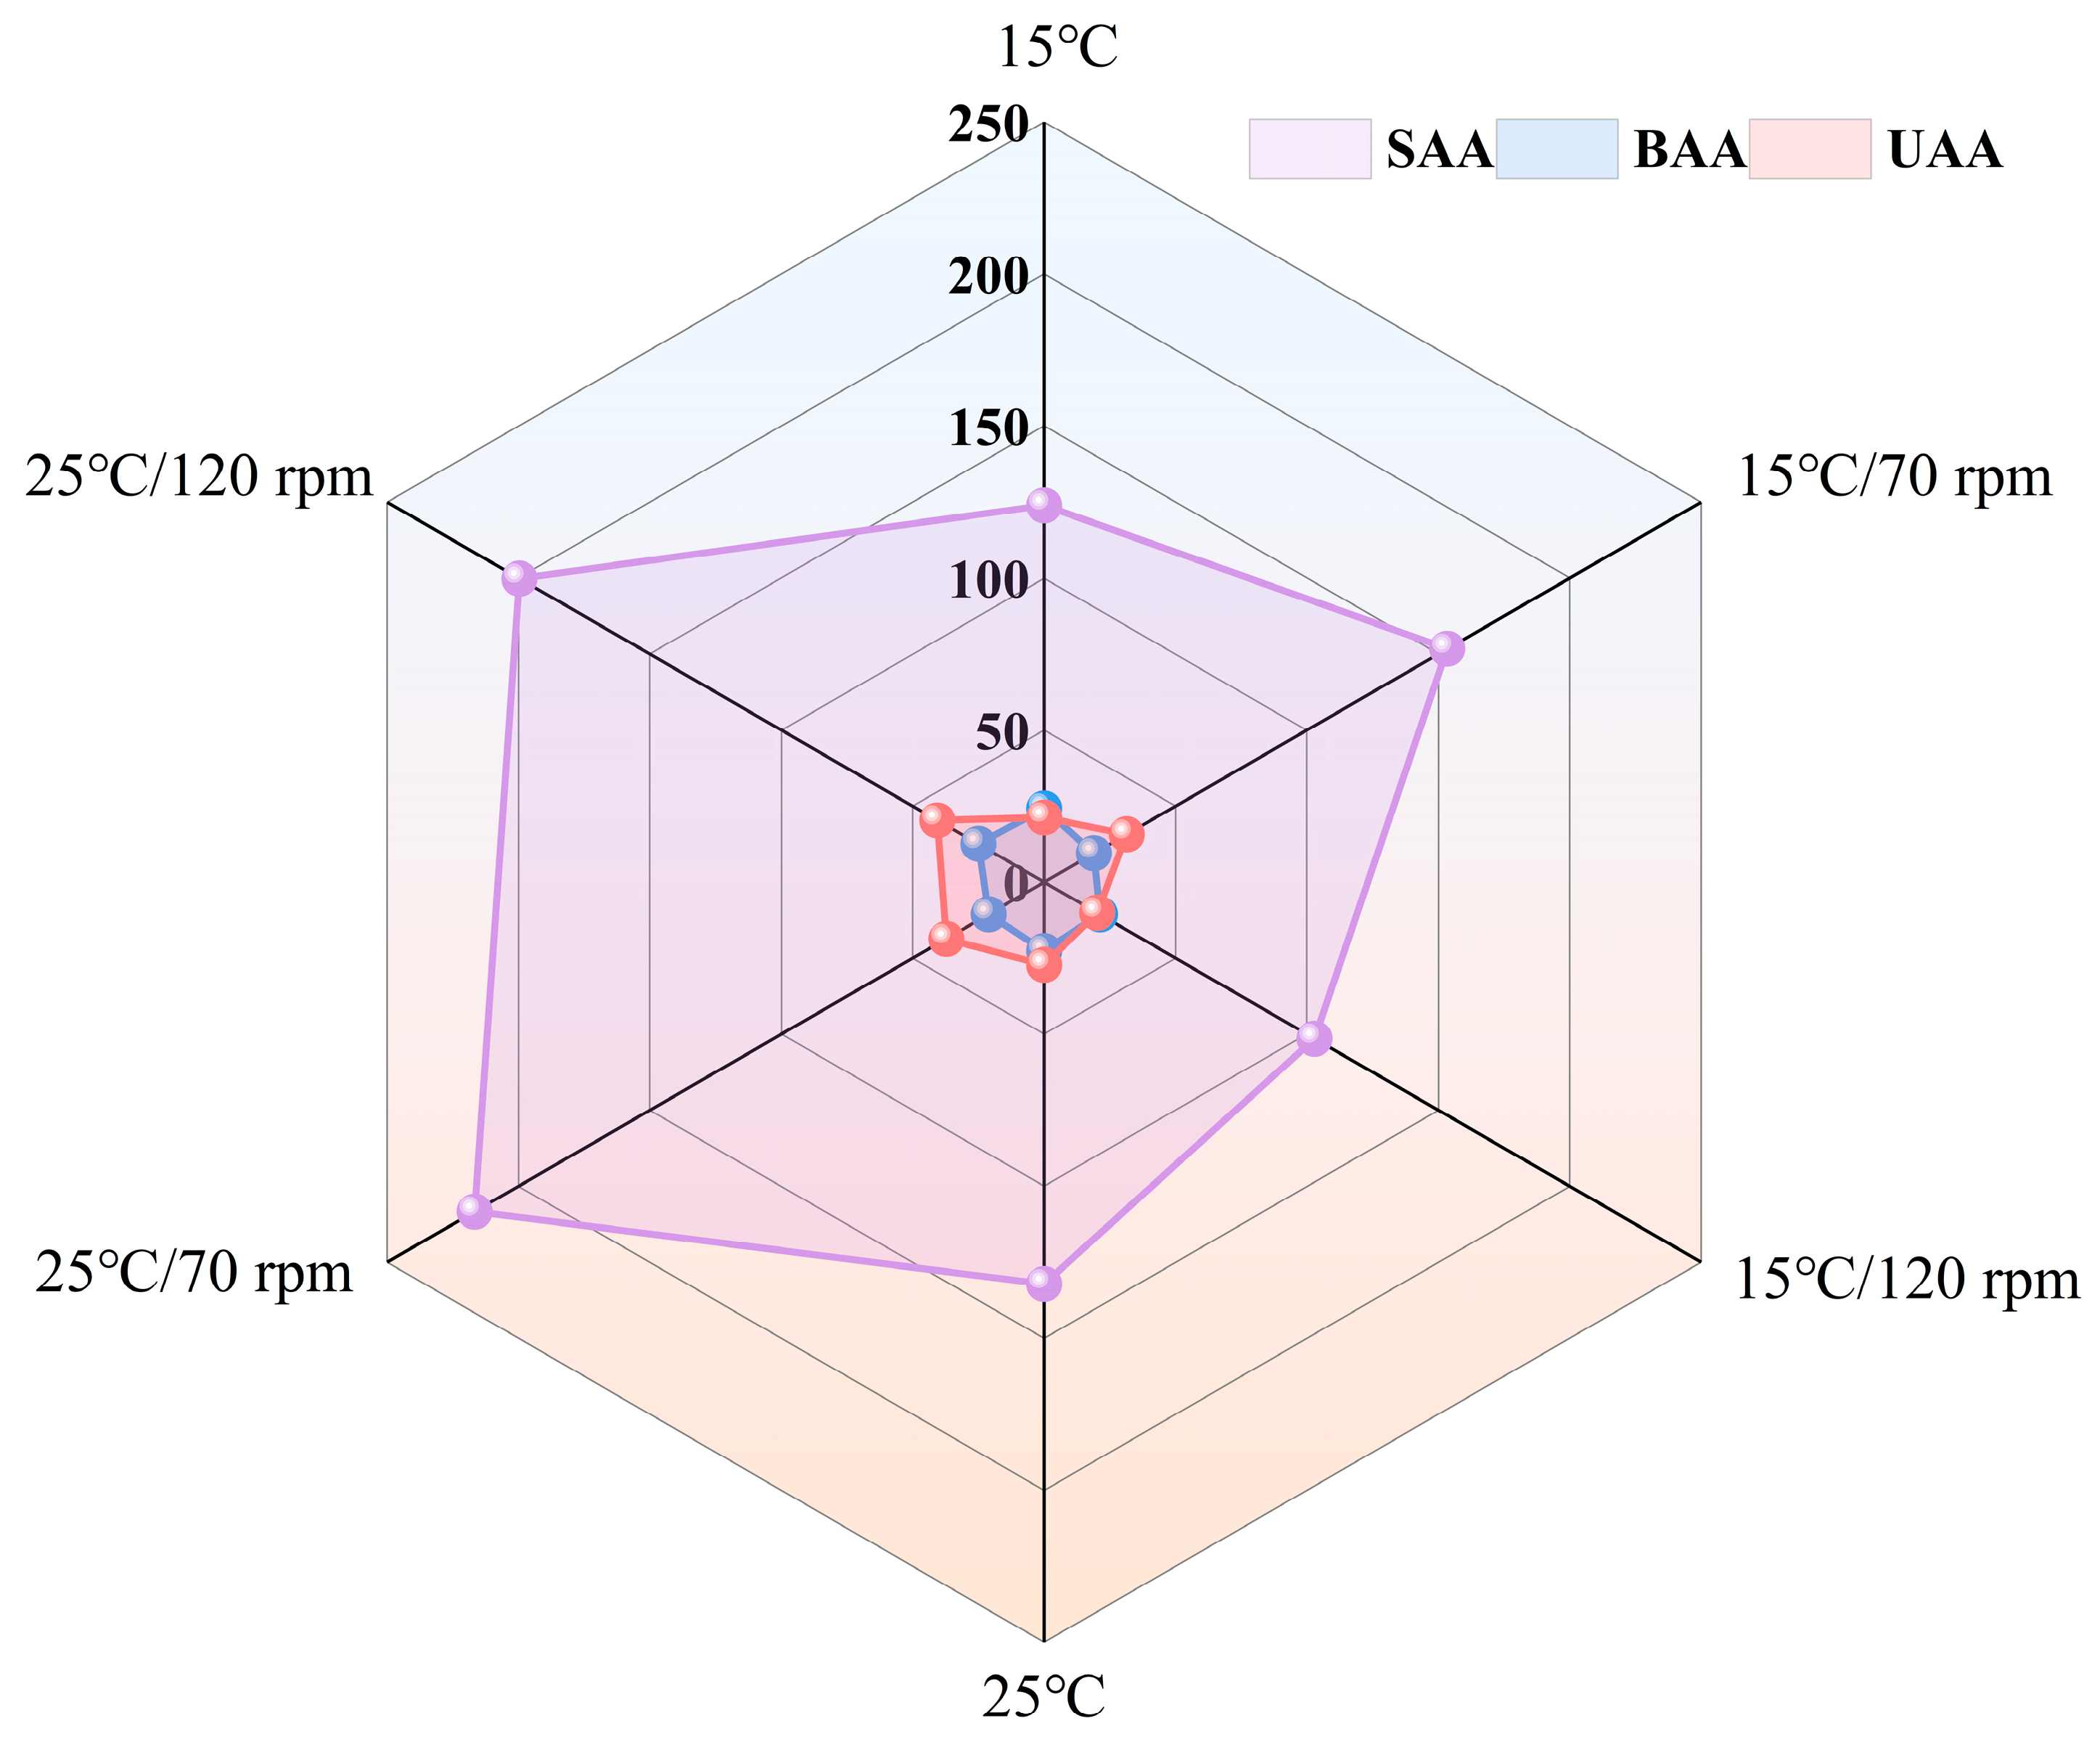
3.6. FAAs Analysis
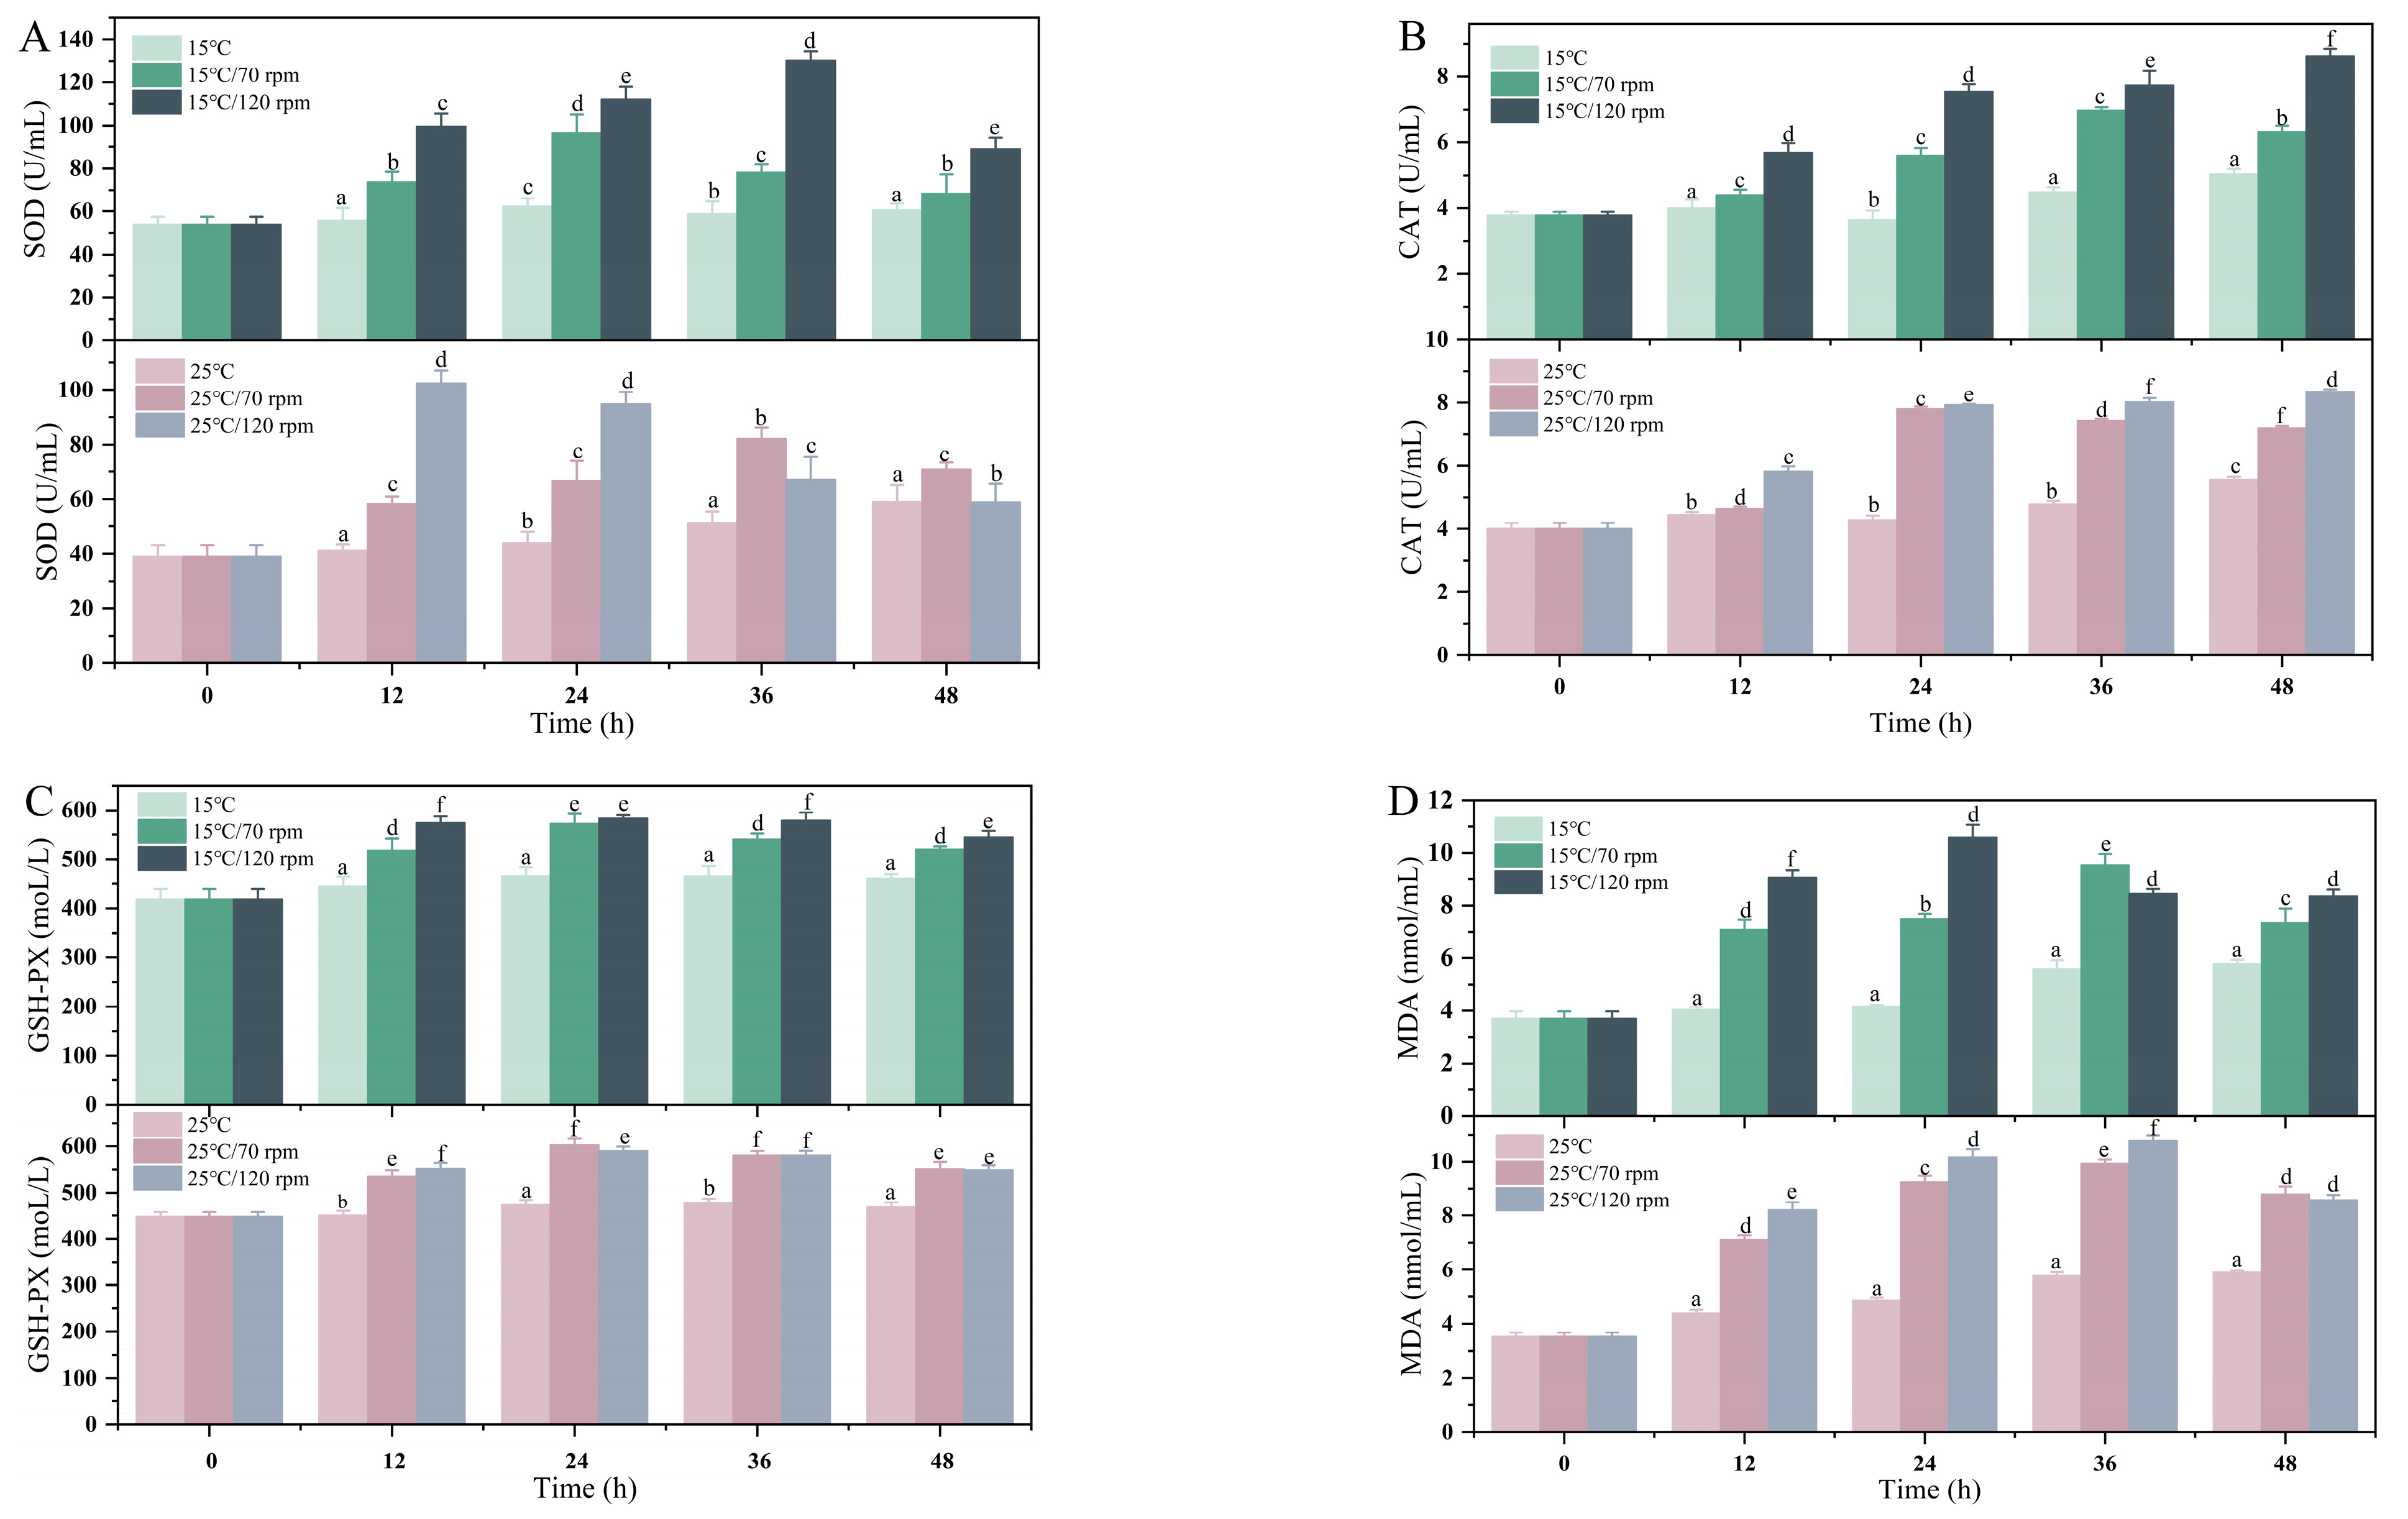
4. Discussion
5. Conclusions
Author Contributions
Funding
Institutional Review Board Statement
Data Availability Statement
Conflicts of Interest
References
- Ren, Y.; Men, X.; Yu, Y.; Li, B.; Zhou, Y.; Zhao, C. Effects of transportation stress on antioxidation, immunity capacity and hypoxia tolerance of rainbow trout (Oncorhynchus mykiss). Aquac. Rep. 2022, 22, 100940. [Google Scholar] [CrossRef]
- Hong, J.; Zhou, S.; Yu, G.; Qin, C.; Zuo, T.; Ma, Z. Effects of transporting stress on the immune responses of Asian seabass Lates calcarifer fry. Aquac. Res. 2021, 52, 2182–2193. [Google Scholar] [CrossRef]
- Deng, W.; Sun, J.; Chang, Z.-G.; Gou, N.-N.; Wu, W.-Y.; Luo, X.-L.; Zhou, J.-S.; Yu, H.-B.; Ji, H. Energy response and fatty acid metabolism in Onychostoma macrolepis exposed to low-temperature stress. J. Therm. Biol. 2020, 94, 102725. [Google Scholar] [CrossRef]
- Sun, J.-L.; Zhao, L.-L.; Liao, L.; Tang, X.-H.; Cui, C.; Liu, Q.; He, K.; Ma, J.-D.; Jin, L.; Yan, T. Interactive effect of thermal and hypoxia on largemouth bass (Micropterus salmoides) gill and liver: Aggravation of oxidative stress, inhibition of immunity and promotion of cell apoptosis. Fish Shellfish Immunol. 2020, 98, 923–936. [Google Scholar] [CrossRef] [PubMed]
- Liu, F.; Shi, H.-Z.; Guo, Q.-S.; Yu, Y.-B.; Wang, A.-M.; Lv, F.; Shen, W.-B. Effects of astaxanthin and emodin on the growth, stress resistance and disease resistance of yellow catfish (Pelteobagrus fulvidraco). Fish Shellfish Immunol. 2016, 51, 125–135. [Google Scholar] [CrossRef]
- Martínez, D.; Vargas-Lagos, C.; Saravia, J.; Oyarzún, R.; Loncoman, C.; Pontigo, J.; Vargas-Chacoff, L. Cellular stress responses of Eleginops maclovinus fish injected with Piscirickettsia salmonis and submitted to thermal stress. Cell Stress Chaperones 2020, 25, 93–104. [Google Scholar] [CrossRef]
- Liu, E.; Zhao, X.; Li, C.; Wang, Y.; Li, L.; Zhu, H.; Ling, Q. Effects of acute heat stress on liver damage, apoptosis and inflammation of pikeperch (Sander lucioperca). J. Therm. Biol. 2022, 106, 103251. [Google Scholar] [CrossRef]
- Wang, Y.; Li, C.; Pan, C.; Liu, E.; Zhao, X.; Ling, Q. Alterations to transcriptomic profile, histopathology, and oxidative stress in liver of pikeperch (Sander lucioperca) under heat stress. Fish Shellfish Immunol. 2019, 95, 659–669. [Google Scholar] [CrossRef]
- Zhao, S.-J.; Guo, S.-N.; Zhu, Q.-L.; Yuan, S.-S.; Zheng, J.-L. Heat-induced oxidative stress and inflammation involve in cadmium pollution history in the spleen of zebrafish. Fish Shellfish Immunol. 2018, 72, 1–8. [Google Scholar] [CrossRef]
- Wang, Y.; Peng, X.; Yang, Z.; Zhao, W.; Xu, W.; Hao, J.; Wu, W.; Shen, X.L.; Luo, Y.; Huang, K. iTRAQ mitoproteome analysis reveals mechanisms of programmed cell death in Arabidopsis thaliana induced by ochratoxin A. Toxins 2017, 9, 167. [Google Scholar] [CrossRef]
- Wang, J.; Xiong, G.; Bai, C.; Liao, T. Anesthetic efficacy of two plant phenolics and the physiological response of juvenile Ictalurus punctatus to simulated transport. Aquaculture 2021, 538, 736566. [Google Scholar] [CrossRef]
- Celi, M.; Filiciotto, F.; Maricchiolo, G.; Genovese, L.; Quinci, E.M.; Maccarrone, V.; Mazzola, S.; Vazzana, M.; Buscaino, G. Vessel noise pollution as a human threat to fish: Assessment of the stress response in gilthead sea bream (Sparus aurata, Linnaeus 1758). Fish Physiol. Biochem. 2016, 42, 631–641. [Google Scholar] [CrossRef]
- Ganesh, C. The stress–reproductive axis in fish: The involvement of functional neuroanatomical systems in the brain. J. Chem. Neuroanat. 2021, 112, 101904. [Google Scholar] [CrossRef]
- De, M.; Ghaffar, M.A.; Noor, N.M.; Cob, Z.C.; Bakar, Y.; Das, S.K. Effects of water temperature and diet on blood parameters and stress levels in hybrid grouper (Epinephelus fuscoguttatus ♀ × E. lanceolatus ♂) juveniles. Aquac. Rep. 2019, 15, 100219. [Google Scholar] [CrossRef]
- Wang, Q.; Yang, L.; Xing, K.; Sun, X.; Sun, J. Short-time Transport Stress Affected Biochemical Parameters in Takifugu Rubripes. In Proceedings of the IOP Conference Series: Materials Science and Engineering, Kazimierz Dolny, Poland, 21–23 November 2019; p. 012053. [Google Scholar]
- Wang, Q.; Ye, W.; Tao, Y.; Li, Y.; Lu, S.; Xu, P.; Qiang, J. Transport Stress Induces Oxidative Stress and Immune Response in Juvenile Largemouth Bass (Micropterus salmoides): Analysis of Oxidative and Immunological Parameters and the Gut Microbiome. Antioxidants 2023, 12, 157. [Google Scholar] [CrossRef] [PubMed]
- Zhang, Z.; Yang, Z.; Ding, N.; Xiong, W.; Zheng, G.; Lin, Q.; Zhang, G. Effects of temperature on the survival, feeding, and growth of pearl gentian grouper (female Epinephelus fuscoguttatus × male Epinephelus lanceolatus). Fish. Sci. 2018, 84, 399–404. [Google Scholar] [CrossRef]
- Wei, H.; Li, R.; Yang, Q.; Tan, B.; Ray, G.W.; Dong, X.; Chi, S.; Liu, H.; Zhang, S. Effects of Zn on growth performance, immune enzyme activities, resistance to disease and intestinal flora for juvenile pearl gentian grouper (Epinephelus lanceolatus ♂ × Epinephelus fuscoguttatus ♀) under low fishmeal diet. Aquac. Rep. 2021, 21, 100880. [Google Scholar] [CrossRef]
- Manuel, R.; Boerrigter, J.; Roques, J.; van der Heul, J.; van den Bos, R.; Flik, G.; van de Vis, H. Stress in African catfish (Clarias gariepinus) following overland transportation. Fish Physiol. Biochem. 2014, 40, 33–44. [Google Scholar] [CrossRef] [PubMed]
- Hong, J.; Chen, X.; Liu, S.; Fu, Z.; Han, M.; Wang, Y.; Gu, Z.; Ma, Z. Impact of fish density on water quality and physiological response of golden pompano (Trachinotus ovatus) flingerlings during transportation. Aquaculture 2019, 507, 260–265. [Google Scholar] [CrossRef]
- Qiang, J.; Xu, P.; He, J.; Wang, H.; Li, R. The combined effects of external ammonia and crowding stress on growth and biochemical activities in liver of (GIFT) Nile tilapia juvenile (Oreochromis niloticus). J. Fish. China 2011, 35, 1837–1848. [Google Scholar]
- Nie, X.; Zhang, F.; Wang, T.; Zheng, X.; Li, Y.; Huang, B.; Zhang, C. Physiological and morphological changes in Turbot (Psetta maxima) gill tissue during waterless storage. Aquaculture 2019, 508, 30–35. [Google Scholar] [CrossRef]
- Zhang, H.; Fang, D.; Mei, J.; Xie, J.; Qiu, W. A Preliminary Study on the Effects of Nitrite Exposure on Hematological Parameters, Oxidative Stress, and Immune-Related Responses in Pearl Gentian Grouper. Fishes 2022, 7, 235. [Google Scholar] [CrossRef]
- Slami, M.; Bahrekazemi, M.; Bahram, S.; Javadian, S.R. The positive effects of taurine on growth performance, immunohaematological parameters and stress response of farmed beluga (Huso huso) in both fresh water and brackish water. Aquac. Nutr. 2021, 27, 2279–2293. [Google Scholar] [CrossRef]
- Paterson, B.D.; Rimmer, M.A.; Meikle, G.M.; Semmens, G.L. Physiological responses of the Asian sea bass, Lates calcarifer to water quality deterioration during simulated live transport: Acidosis, red-cell swelling, and levels of ions and ammonia in the plasma. Aquaculture 2003, 218, 717–728. [Google Scholar] [CrossRef]
- Parodi, T.V.; Cunha, M.A.; Becker, A.G.; Zeppenfeld, C.C.; Martins, D.I.; Koakoski, G.; Barcellos, L.G.; Heinzmann, B.M.; Baldisserotto, B. Anesthetic activity of the essential oil of Aloysia triphylla and effectiveness in reducing stress during transport of albino and gray strains of silver catfish, Rhamdia quelen. Fish Physiol. Biochem. 2014, 40, 323–334. [Google Scholar] [CrossRef]
- Lima, A.F.; de Oliveira, H.J.B. Effect of density on survival, physiological parameters and water quality during pirarucu transportation in open system. Aquac. Res. 2018, 49, 947–952. [Google Scholar] [CrossRef]
- King, H.R. Fish transport in the aquaculture sector: An overview of the road transport of Atlantic salmon in Tasmania. J. Vet. Behav. 2009, 4, 163–168. [Google Scholar] [CrossRef]
- Dong, H.; Zeng, X.; Wang, W.; Duan, Y.; Chen, J.; Zhang, J. Protection of teprenone against anesthetic stress in gills and liver of spotted seabass Lateolabrax maculatus. Aquaculture 2022, 557, 738333. [Google Scholar] [CrossRef]
- Paulino, M.G.; Rossi, P.A.; Venturini, F.P.; Tavares, D.; da Silva Souza, N.E.; Sakuragui, M.M.; Moraes, G.; Terezan, A.P.; Fernandes, J.B.; Giani, A. Hepatotoxicity and metabolic effects of cellular extract of cyanobacterium Radiocystis fernandoi containing microcystins RR and YR on neotropical fish (Hoplias malabaricus). Chemosphere 2017, 175, 431–439. [Google Scholar] [CrossRef]
- Hoseini, S.M.; Gupta, S.K.; Yousefi, M.; Kulikov, E.V.; Drukovsky, S.G.; Petrov, A.K.; Mirghaed, A.T.; Hoseinifar, S.H.; Van Doan, H. Mitigation of transportation stress in common carp, Cyprinus carpio, by dietary administration of turmeric. Aquaculture 2022, 546, 737380. [Google Scholar] [CrossRef]
- Cheng, C.-H.; Ye, C.-X.; Guo, Z.-X.; Wang, A.-L. Immune and physiological responses of pufferfish (Takifugu obscurus) under cold stress. Fish Shellfish Immunol. 2017, 64, 137–145. [Google Scholar] [CrossRef] [PubMed]
- Schreck, C.B.; Tort, L. The concept of stress in fish. In Fish Physiology; Elsevier: Amsterdam, The Netherlands, 2016; Volume 35, pp. 1–34. [Google Scholar]
- Sampaio, F.D.; Freire, C.A. An overview of stress physiology of fish transport: Changes in water quality as a function of transport duration. Fish Fish. 2016, 17, 1055–1072. [Google Scholar] [CrossRef]
- Barton, B.A. Stress in fishes: A diversity of responses with particular reference to changes in circulating corticosteroids. Integr. Comp. Biol. 2002, 42, 517–525. [Google Scholar] [CrossRef]
- Xie, T.; Gao, Y.; Qin, H.; Zhang, J.; Li, M.; Gao, Y.; Guan, C.; Jia, Y. Physiological response of spotted knifejaw (Oplegnathus punctatus) during transportation in offshore aquaculture net pen. Aquaculture 2023, 563, 739029. [Google Scholar] [CrossRef]
- Mirghaed, A.T.; Ghelichpour, M. Effects of anesthesia and salt treatment on stress responses, and immunological and hydromineral characteristics of common carp (Cyprinus carpio, Linnaeus, 1758) subjected to transportation. Aquaculture 2019, 501, 1–6. [Google Scholar] [CrossRef]
- Iwama, G.K.; Vijayan, M.M.; Forsyth, R.B.; Ackerman, P.A. Heat shock proteins and physiological stress in fish. Am. Zool. 1999, 39, 901–909. [Google Scholar] [CrossRef]
- Islam, M.J.; Kunzmann, A.; Bögner, M.; Meyer, A.; Thiele, R.; Slater, M.J. Metabolic and molecular stress responses of European seabass, Dicentrarchus labrax at low and high temperature extremes. Ecol. Indic. 2020, 112, 106118. [Google Scholar] [CrossRef]
- Cheng, C.-H.; Guo, Z.-X.; Luo, S.-W.; Wang, A.-L. Effects of high temperature on biochemical parameters, oxidative stress, DNA damage and apoptosis of pufferfish (Takifugu obscurus). Ecotoxicol. Environ. Saf. 2018, 150, 190–198. [Google Scholar] [CrossRef]
- Romero, M.C.; Ansaldo, M.; Lovrich, G.A. Effect of aerial exposure on the antioxidant status in the subantarctic stone crab Paralomis granulosa (Decapoda: Anomura). Comp. Biochem. Physiol. Part C Toxicol. Pharmacol. 2007, 146, 54–59. [Google Scholar] [CrossRef]
- Wang, Q.; Mei, J.; Xie, J. The Effects of Lemon Balm (Melissa officinalis L.) Essential Oil on the Stress Response, Anti-Oxidative Ability, and Kidney Metabolism of Sea Bass during Live Transport. Animals 2022, 12, 339. [Google Scholar] [CrossRef]
- Refaey, M.M.; Li, D. Transport stress changes blood biochemistry, antioxidant defense system, and hepatic HSPs mRNA expressions of channel catfish Ictalurus punctatus. Front. Physiol. 2018, 9, 1628. [Google Scholar] [CrossRef] [PubMed]
- Paital, B.; Kumar, S.; Farmer, R.; Tripathy, N.K.; Chainy, G.B.N. In silico prediction and characterization of 3D structure and binding properties of catalase from the commercially important crab, Scylla serrata. Interdiscip. Sci. Comput. Life Sci. 2011, 3, 110–120. [Google Scholar] [CrossRef]
- Li, M.; Yu, N.; Qin, J.G.; Li, E.; Du, Z.; Chen, L. Effects of ammonia stress, dietary linseed oil and Edwardsiella ictaluri challenge on juvenile darkbarbel catfish Pelteobagrus vachelli. Fish Shellfish Immunol. 2014, 38, 158–165. [Google Scholar] [CrossRef] [PubMed]
- Das, S.K.; De, M.; Ghaffar, M.A.; Noor, N.M.; Mazumder, S.K.; Bakar, Y. Effects of temperature on the oxygen consumption rate and gill fine structure of hybrid grouper, Epinephelus fuscoguttatus ♀ × E. lanceolatus ♂. J. King Saud Univ.-Sci. 2021, 33, 101358. [Google Scholar] [CrossRef]
- Li, X.; Ling, C.; Wang, Q.; Feng, C.; Luo, X.; Sha, H.; He, G.; Zou, G.; Liang, H. Hypoxia stress induces tissue damage, immune defense, and oxygen transport change in gill of silver carp (Hypophthalmichthys molitrix): Evaluation on hypoxia by using transcriptomics. Front. Mar. Sci. 2022, 706. [Google Scholar] [CrossRef]
- Wang, Q.; Mei, J.; Cao, J.; Xie, J. Effects of Melissa officinalis L. essential oil in comparison with anaesthetics on gill tissue damage, liver metabolism and immune parameters in sea bass (Lateolabrax maculatus) during simulated live transport. Biology 2021, 11, 11. [Google Scholar] [CrossRef]
- Esam, F.; Khalafalla, M.M.; Gewaily, M.S.; Abdo, S.; Hassan, A.M.; Dawood, M.A. Acute ammonia exposure combined with heat stress impaired the histological features of gills and liver tissues and the expression responses of immune and antioxidative related genes in Nile tilapia. Ecotoxicol. Environ. Saf. 2022, 231, 113187. [Google Scholar] [CrossRef]
- Ma, X.; Yang, D.; Qiu, W.; Mei, J.; Xie, J. Influence of multifrequency ultrasound-assisted freezing on the flavour attributes and myofibrillar protein characteristics of cultured large yellow croaker (Larimichthys crocea). Front. Nutr. 2021, 8, 779546. [Google Scholar] [CrossRef]
- Wu, B.; Wang, Q.; Cao, J.; Mei, J.; Xie, J. Effects of ascorbic acid and β-1, 3-glucan on survival, physiological response and flesh quality of cultured tiger grouper (Epinephelus fuscoguttatus) during simulated transport in water. Biology 2020, 9, 37. [Google Scholar] [CrossRef]


| Parameters | Source of Variation | df | F | p-Value |
|---|---|---|---|---|
| Asp | Vibration | 2 | 113.694 | 0.000 |
| Temperature | 1 | 891.577 | 0.000 | |
| Time | 2 | 899.496 | 0.000 | |
| Vibration × Temperature | 2 | 229.825 | 0.000 | |
| Vibration × Time | 4 | 158.742 | 0.000 | |
| Temperature × Time | 2 | 69.978 | 0.000 | |
| Vibration × Temperature ×Time | 4 | 351.644 | 0.000 | |
| Thr | Vibration | 2 | 1553.037 | 0.000 |
| Temperature | 1 | 6899.695 | 0.000 | |
| Time | 2 | 9023.207 | 0.000 | |
| Vibration × Temperature | 2 | 1003.614 | 0.000 | |
| Vibration × Time | 4 | 1087.433 | 0.000 | |
| Temperature × Time | 2 | 2951.912 | 0.000 | |
| Vibration × Temperature ×Time | 4 | 2163.354 | 0.000 | |
| Ser | Vibration | 2 | 3085.985 | 0.000 |
| Temperature | 1 | 5251.312 | 0.000 | |
| Time | 2 | 9838.697 | 0.000 | |
| Vibration × Temperature | 2 | 270.116 | 0.000 | |
| Vibration × Time | 4 | 1279.598 | 0.000 | |
| Temperature × Time | 2 | 3896.565 | 0.000 | |
| Vibration × Temperature ×Time | 4 | 409.435 | 0.000 | |
| Glu | Vibration | 2 | 1102.377 | 0.000 |
| Temperature | 1 | 8871.22 | 0.000 | |
| Time | 2 | 7567.827 | 0.000 | |
| Vibration × Temperature | 2 | 667.828 | 0.000 | |
| Vibration × Time | 4 | 451.975 | 0.000 | |
| Temperature × Time | 2 | 299.909 | 0.000 | |
| Vibration × Temperature ×Time | 4 | 499.321 | 0.000 | |
| Gly | Vibration | 2 | 17,603.247 | 0.000 |
| Temperature | 1 | 478,216.287 | 0.000 | |
| Time | 2 | 38,773.851 | 0.000 | |
| Vibration × Temperature | 2 | 3022.137 | 0.000 | |
| Vibration × Time | 4 | 9400.451 | 0.000 | |
| Temperature × Time | 2 | 14,287.42 | 0.000 | |
| Vibration × Temperature ×Time | 4 | 8589.165 | 0.000 | |
| Cys | Vibration | 2 | 174.501 | 0.000 |
| Temperature | 1 | 37,580.373 | 0.000 | |
| Time | 2 | 10,097.668 | 0.000 | |
| Vibration × Temperature | 2 | 150.553 | 0.000 | |
| Vibration × Time | 4 | 201.304 | 0.000 | |
| Temperature × Time | 2 | 10,176.188 | 0.000 | |
| Vibration × Temperature ×Time | 4 | 166.22 | 0.000 | |
| Val | Vibration | 2 | 303.916 | 0.000 |
| Temperature | 1 | 54,920.23 | 0.000 | |
| Time | 2 | 15,503.886 | 0.000 | |
| Vibration × Temperature | 2 | 311.842 | 0.000 | |
| Vibration × Time | 4 | 354.428 | 0.000 | |
| Temperature × Time | 2 | 15,252.433 | 0.000 | |
| Vibration × Temperature ×Time | 4 | 331.264 | 0.000 | |
| Ile | Vibration | 2 | 336.723 | 0.000 |
| Temperature | 1 | 61,708.064 | 0.000 | |
| Time | 2 | 19,835.759 | 0.000 | |
| Vibration × Temperature | 2 | 365.589 | 0.000 | |
| Vibration × Time | 4 | 469.432 | 0.000 | |
| Temperature × Time | 2 | 17,646.533 | 0.000 | |
| Vibration × Temperature ×Time | 4 | 441.031 | 0.000 | |
| Leu | Vibration | 2 | 51.933 | 0.000 |
| Temperature | 1 | 145,997.2 | 0.000 | |
| Time | 2 | 3393.513 | 0.000 | |
| Vibration × Temperature | 2 | 180.624 | 0.000 | |
| Vibration × Time | 4 | 2192.068 | 0.000 | |
| Temperature × Time | 2 | 41,674.346 | 0.000 | |
| Vibration × Temperature ×Time | 4 | 1752.751 | 0.000 | |
| Tyr | Vibration | 2 | 6.475 | 0.004 |
| Temperature | 1 | 2015.841 | 0.000 | |
| Time | 2 | 11.41 | 0.000 | |
| Vibration × Temperature | 2 | 3.841 | 0.031 | |
| Vibration × Time | 4 | 43.12 | 0.000 | |
| Temperature × Time | 2 | 601.765 | 0.000 | |
| Vibration × Temperature ×Time | 4 | 3.813 | 0.011 | |
| Phe | Vibration | 2 | 318.167 | 0.000 |
| Temperature | 1 | 36,172.254 | 0.000 | |
| Time | 2 | 233.726 | 0.000 | |
| Vibration × Temperature | 2 | 7.608 | 0.002 | |
| Vibration × Time | 4 | 850.75 | 0.000 | |
| Temperature × Time | 2 | 3519.479 | 0.000 | |
| Vibration × Temperature ×Time | 4 | 64.426 | 0.000 | |
| Lys | Vibration | 2 | 150 | 0.000 |
| Temperature | 1 | 12,904.795 | 0.000 | |
| Time | 2 | 8375.469 | 0.000 | |
| Vibration × Temperature | 2 | 96.678 | 0.000 | |
| Vibration × Time | 4 | 63.197 | 0.000 | |
| Temperature × Time | 2 | 7616.867 | 0.000 | |
| Vibration × Temperature ×Time | 4 | 96.288 | 0.000 | |
| His | Vibration | 2 | 1616.965 | 0.000 |
| Temperature | 1 | 134,482.415 | 0.000 | |
| Time | 2 | 25,560.675 | 0.000 | |
| Vibration × Temperature | 2 | 379.78 | 0.000 | |
| Vibration × Time | 4 | 681.972 | 0.000 | |
| Temperature × Time | 2 | 14,767.69 | 0.000 | |
| Vibration × Temperature ×Time | 4 | 1506.107 | 0.000 | |
| Arg | Vibration | 2 | 144.023 | 0.000 |
| Temperature | 1 | 21,477.223 | 0.000 | |
| Time | 2 | 6785.463 | 0.000 | |
| Vibration × Temperature | 2 | 136.79 | 0.000 | |
| Vibration × Time | 4 | 141.608 | 0.000 | |
| Temperature × Time | 2 | 6627.54 | 0.000 | |
| Vibration × Temperature ×Time | 4 | 147.979 | 0.000 | |
| Ph | Vibration | 2 | 31.746 | 0.000 |
| Temperature | 1 | 2.75 | 0.102 | |
| Time | 4 | 96.711 | 0.000 | |
| Vibration × Temperature | 2 | 3.223 | 0.047 | |
| Vibration × Time | 8 | 7.936 | 0.000 | |
| Temperature × Time | 4 | 18.078 | 0.000 | |
| Vibration × Temperature ×Time | 8 | 0.792 | 0.612 | |
| DO | Vibration | 2 | 84.247 | 0.000 |
| Temperature | 1 | 1417.282 | 0.000 | |
| Time | 4 | 237.357 | 0.000 | |
| Vibration × Temperature | 2 | 14.784 | 0.000 | |
| Vibration × Time | 8 | 5.941 | 0.000 | |
| Temperature × Time | 4 | 24.497 | 0.000 | |
| Vibration × Temperature ×Time | 8 | 3.806 | 0.001 | |
| TAN | Vibration | 2 | 420.276 | 0.000 |
| Temperature | 1 | 272.822 | 0.000 | |
| Time | 4 | 1141.493 | 0.000 | |
| Vibration × Temperature | 2 | 0.329 | 0.721 | |
| Vibration × Time | 8 | 35.096 | 0.000 | |
| Temperature × Time | 4 | 14.454 | 0.000 | |
| Vibration × Temperature ×Time | 8 | 1.141 | 0.350 | |
| AST | Vibration | 2 | 62.166 | 0.000 |
| Temperature | 1 | 1092.343 | 0.000 | |
| Time | 4 | 179.605 | 0.000 | |
| Vibration × Temperature | 2 | 8.46 | 0.001 | |
| Vibration × Time | 8 | 22.458 | 0.000 | |
| Temperature × Time | 4 | 31.339 | 0.000 | |
| Vibration × Temperature ×Time | 8 | 10.941 | 0.000 | |
| ALT | Vibration | 2 | 51.675 | 0.000 |
| Temperature | 1 | 45.713 | 0.000 | |
| Time | 4 | 24.17 | 0.000 | |
| Vibration × Temperature | 2 | 2.749 | 0.072 | |
| Vibration × Time | 8 | 7.035 | 0.000 | |
| Temperature × Time | 4 | 8.578 | 0.000 | |
| Vibration × Temperature ×Time | 8 | 3.33 | 0.003 | |
| COR | Vibration | 2 | 240.539 | 0.000 |
| Temperature | 1 | 1250.821 | 0.000 | |
| Time | 4 | 521.194 | 0.000 | |
| Vibration × Temperature | 2 | 15.784 | 0.000 | |
| Vibration × Time | 8 | 30.728 | 0.000 | |
| Temperature × Time | 4 | 36.169 | 0.000 | |
| Vibration × Temperature ×Time | 8 | 14.087 | 0.000 | |
| GLU | Vibration | 2 | 1040.98 | 0.000 |
| Temperature | 1 | 224.507 | 0.000 | |
| Time | 4 | 1209.673 | 0.000 | |
| Vibration × Temperature | 2 | 35.114 | 0.000 | |
| Vibration × Time | 8 | 279.811 | 0.000 | |
| Temperature × Time | 4 | 69.353 | 0.000 | |
| Vibration × Temperature ×Time | 8 | 66.185 | 0.000 | |
| LDH | Vibration | 2 | 248.767 | 0.000 |
| Temperature | 1 | 1420.729 | 0.000 | |
| Time | 4 | 383.998 | 0.000 | |
| Vibration × Temperature | 2 | 1.503 | 0.231 | |
| Vibration × Time | 8 | 43.575 | 0.000 | |
| Temperature × Time | 4 | 67.161 | 0.000 | |
| Vibration × Temperature ×Time | 8 | 11.214 | 0.000 | |
| SOD | Vibration | 2 | 297.552 | 0.000 |
| Temperature | 1 | 210.732 | 0.000 | |
| Time | 4 | 122.229 | 0.000 | |
| Vibration × Temperature | 2 | 17.527 | 0.000 | |
| Vibration × Time | 8 | 34.359 | 0.000 | |
| Temperature × Time | 4 | 7.015 | 0.000 | |
| Vibration × Temperature ×Time | 8 | 21.037 | 0.000 | |
| GSH-PX | Vibration | 2 | 309.374 | 0.000 |
| Temperature | 1 | 26.216 | 0.000 | |
| Time | 4 | 184.179 | 0.000 | |
| Vibration × Temperature | 2 | 6.244 | 0.003 | |
| Vibration × Time | 8 | 22.767 | 0.000 | |
| Temperature × Time | 4 | 2.515 | 0.051 | |
| Vibration × Temperature ×Time | 8 | 0.634 | 0.746 | |
| MDA | Vibration | 2 | 1464.854 | 0.000 |
| Temperature | 1 | 50.881 | 0.000 | |
| Time | 4 | 981.196 | 0.000 | |
| Vibration × Temperature | 2 | 8.474 | 0.001 | |
| Vibration × Time | 8 | 132.411 | 0.000 | |
| Temperature × Time | 4 | 19.312 | 0.000 | |
| Vibration × Temperature ×Time | 8 | 18.65 | 0.000 |
| Samples | Keeping Alive Time/h | ||||
|---|---|---|---|---|---|
| 0 h | 12 h | 24 h | 36 h | 48 h | |
| 15 °C | 100 | 100 | 100 | 100 | 100 |
| 15 °C/70 rpm | 100 | 100 | 100 | 100 | 83 |
| 15 °C/120 rpm | 100 | 100 | 100 | 100 | 67 |
| 25 °C | 100 | 100 | 100 | 100 | 83 |
| 25 °C/70 rpm | 100 | 100 | 100 | 100 | 67 |
| 25 °C/120 rpm | 100 | 100 | 100 | 100 | 33 |
| Indicators | Samples | Simulated Transport Time (h) | ||
|---|---|---|---|---|
| 0 | 24 | 48 | ||
| Aspartic Acid 1 (Asp) (mg/kg) | 15 °C | 1.80 ± 0.02 | 0.83 ± 0.03 b | 0.98 ± 0.04 b |
| 15 °C/70 rpm | 0.63 ± 0.01 a | 1.48 ± 0.04 c | ||
| 15 °C/120 rpm | 0.66 ± 0.02 a | 0.83 ± 0.01 b | ||
| 25 °C | 2.07 ± 0.09 | 1.11 ± 0.02 c | 0.94 ± 0.02 b | |
| 25 °C/70 rpm | 1.99 ± 0.04 f | 0.85 ± 0.06 b | ||
| 25 °C/120 rpm | 1.29 ± 0.03 d | 2.94 ± 0.18 f | ||
| Threonine 2 (Thr) (mg/kg) | 15 °C | 11.53 ± 0.23 | 4.8 ± 0.05 a | 6.57 ± 0.06 b |
| 15 °C/70 rpm | 6.62 ± 0.07 b | 13.51 ± 0.06 e | ||
| 15 °C/120 rpm | 3.66 ± 0.01 | 6.11 ± 0.12 | ||
| 25 °C | 15.46 ± 0.03 | 9.33 ± 0.13 c | 5.11 ± 0.11 a | |
| 25 °C/70 rpm | 15.43 ± 0.24 f | 5.35 ± 0.23 e | ||
| 25 °C/120 rpm | 8.55 ± 0.03 | 13.46 ± 0.05 | ||
| Serine 2 (Ser) (mg/kg) | 15 °C | 23.64 ± 0.09 | 9.41 ± 0.14 a | 14.54 ± 0.17 a |
| 15 °C/70 rpm | 16.44 ± 0.08 c | 25.47 ± 0.36 f | ||
| 15 °C/120 rpm | 6.37 ± 0.09 | 14.15 ± 0.10 | ||
| 25 °C | 28.36 ± 0.24 | 24.69 ± 0.17 d | 12.62 ± 0.05 a | |
| 25 °C/70 rpm | 26.97 ± 0.55 e | 17.92 ± 0.36 c | ||
| 25 °C/120 rpm | 14.44 ± 0.09 b | 16.66 ± 0.28 b | ||
| Glutamic Acid 1 (Glu) (mg/kg) | 15 °C | 17.66 ± 0.39 | 15.68 ± 0.19 c | 20.33 ± 0.24 b |
| 15 °C/70 rpm | 12.81 ± 0.04 b | 30.09 ± 0.38 d | ||
| 15 °C/120 rpm | 12.11 ± 0.08 a | 19.37 ± 0.27 a | ||
| 25 °C | 23.91 ± 0.17 | 14.35 ± 0.04 b | 26.35 ± 0.21 c | |
| 25 °C/70 rpm | 24.78 ± 0.66 f | 36.47 ± 0.07 e | ||
| 25 °C/120 rpm | 19.5 ± 0.08 d | 37.78 ± 0.43 e | ||
| Glycine 2 (Gly) (mg/kg) | 15 °C | 75.26 ± 0.84 | 29.53 ± 0.14 | 102.87 ± 0.12 b |
| 15 °C/70 rpm | 47.74 ± 0.09 | 114.55 ± 0.25 | ||
| 15 °C/120 rpm | 22.82 ± 0.04 | 82.58 ± 0.41 a | ||
| 25 °C | 168.91 ± 0.61 | 159.72 ± 0.15 d | 114.57 ± 0.24 b | |
| 25 °C/70 rpm | 180 ± 0.38 | 193.5 ± 0.42 e | ||
| 25 °C/120 rpm | 93.35 ± 0.02 b | 169.69 ± 0.19 d | ||
| Cysteine (Cys) (mg/kg) | 15 °C | 16.45 ± 0.41 | 9.46 ± 0.04 b | 1.04 ± 0.01 e |
| 15 °C/70 rpm | 15.03 ± 0.06 c | 0.74 ± 0.01 b | ||
| 15 °C/120 rpm | 9.75 ± 0.05 | 0.87 ± 0.00 c | ||
| 25 °C | 0.79 ± 0.02 | 0.69 ± 0.01 | 0.96 ± 0.00 d | |
| 25 °C/70 rpm | 0.83 ± 0.00 | 0.77 ± 0.00 b | ||
| 25 °C/120 rpm | 0.48 ± 0.01 | 0.66 ± 0.02 a | ||
| Valine (Val)(mg/kg) | 15 °C | 151.96 ± 3.04 | 84.45 ± 0.54 a | 7.83 ± 0.00 |
| 15 °C/70 rpm | 144.28 ± 0.59 d | 5.43 ± 0.00 | ||
| 15 °C/120 rpm | 91.51 ± 0.86 | 6.84 ± 0.02 | ||
| 25 °C | 7.35 ± 0.01 | 7.46 ± 0.01 f | 7.34 ± 0.01 e | |
| 25 °C/70 rpm | 8.16 ± 0.01 a | 6.34 ± 0.02 c | ||
| 25 °C/120 rpm | 7.92 ± 0.11 d | 7.03 ± 0.02 | ||
| Isoleucine 3 (Ile) (mg/kg) | 15 °C | 41.61 ± 0.70 | 24.45 ± 0.01 c | 5.29 ± 0.02 |
| 15 °C/70 rpm | 39.26 ± 0.14 d | 3.94 ± 0.06 | ||
| 15 °C/120 rpm | 24.96 ± 0.21 | 4.91 ± 0.01 | ||
| 25 °C | 5.60 ± 0.03 | 6.69 ± 0.01 a | 4.34 ± 0.06 c | |
| 25 °C/70 rpm | 6.41 ± 0.03 a | 4.5 ± 0.03 d | ||
| 25 °C/120 rpm | 5.95 ± 0.01 | 5.4 ± 0.04 e | ||
| Leucine 3 (Leu) (mg/kg) | 15 °C | 4.53 ± 0.08 | 2.72 ± 0.01 a | 8.66 ± 0.00 f |
| 15 °C/70 rpm | 4.24 ± 0.00 b | 6.2 ± 0.01 a | ||
| 15 °C/120 rpm | 2.74 ± 0.04 | 7.93 ± 0.04 d | ||
| 25 °C | 8.89 ± 0.01 | 10.83 ± 0.01 a | 6.89 ± 0.02 b | |
| 25 °C/70 rpm | 10.59 ± 0.01 | 7.35 ± 0.02 c | ||
| 25 °C/120 rpm | 9.58 ± 0.01 b | 8.71 ± 0.01 f | ||
| Tyrosine 3 (Tyr) (mg/kg) | 15 °C | 2.12 ± 0.05 | 1.81 ± 0.00 | 3.77 ± 0.00 e |
| 15 °C/70 rpm | 1.99 ± 0.01 | 2.97 ± 0.02 a | ||
| 15 °C/120 rpm | 1.77 ± 0.02 | 3.57 ± 0.31 d | ||
| 25 °C | 4.23 ± 027 | 4.6 ± 0.02 d | 3.77 ± 0.01 e | |
| 25 °C/70 rpm | 5.29 ± 0.01 e | 2.86 ± 0.03 a | ||
| 25 °C/120 rpm | 4.37 ± 0.01 | 3.41 ± 0.02 c | ||
| Phenylalanine 3 (Phe) (mg/kg) | 15 °C | 1.03 ± 0.03 | 0.75 ± 0.00 | 1.76 ± 0.01 c |
| 15 °C/70 rpm | 0.86 ± 0.01 | 0.95 ± 0.02 a | ||
| 15 °C/120 rpm | 0.61 ± 0.02 | 1.28 ± 0.04 b | ||
| 25 °C | 2.56 ± 0.03 | 2.77 ± 0.02 a | 2.56 ± 0.03 e | |
| 25 °C/70 rpm | 3.26 ± 0.02 b | 1.40 ± 0.04 b | ||
| 25 °C/120 rpm | 2.91 ± 0.05 | 2.00 ± 0.04 c | ||
| Lysine (Lys) (mg/kg) | 15 °C | 347.6 ± 8.99 | 97.13 ± 0.13 b | 37.26 ± 0.01 a |
| 15 °C/70 rpm | 191.83 ± 0.56 f | 53.38 ± 0.06 d | ||
| 15 °C/120 rpm | 121.06 ± 1.67 c | 40.92 ± 0.17 b | ||
| 25 °C | 63.29 ± 0.24 | 72.91 ± 0.08 | 45.67 ± 0.09 | |
| 25 °C/70 rpm | 67.49 ± 0.15 | 62.04 ± 0.20 | ||
| 25 °C/120 rpm | 66.53 ± 0.09 | 50.94 ± 0.09 | ||
| Histidine 3 (His) (mg/kg) | 15 °C | 2.20 ± 0.04 | 1.10 ± 0.01 | 4.78 ± 0.01 c |
| 15 °C/70 rpm | 1.82 ± 0.01 | 4.79 ± 0.00 | ||
| 15 °C/120 rpm | 1.13 ± 0.01 | 3.53 ± 0.00 a | ||
| 25 °C | 4.96 ± 0.02 | 4.96 ± 0.01 d | 5.05 ± 0.03 d | |
| 25 °C/70 rpm | 5.29 ± 0.02 e | 5.03 ± 0.03 | ||
| 25 °C/120 rpm | 4.08 ± 0.02 | 5.55 ± 0.00 e | ||
| Arginine (Arg) (mg/kg) | 15 °C | 336.66 ± 10.19 | 157.58 ± 2.44 b | 9.05 ± 0.01 c |
| 15 °C/70 rpm | 285.29 ± 1.90 c | 7.24 ± 0.06 a | ||
| 15 °C/120 rpm | 162.29 ± 2.91 b | 7.95 ± 0.05 a | ||
| 25 °C | 12.51 ± 0.03 | 12.41 ± 0.01 | 10.78 ± 0.05 d | |
| 25 °C/70 rpm | 11.23 ± 0.01 | 11.89 ± 0.07 e | ||
| 25 °C/120 rpm | 10.76 ± 0.01 | 8.95 ± 0.02 b | ||
| Total | 15 °C | 1040.98 | 445.66 | 250.45 |
| 15 °C/70 rpm | 776.19 | 294.83 | ||
| 15 °C/120 rpm | 467.23 | 221.04 | ||
| 25 °C | 378.57 | 359.22 | 274.68 | |
| 25 °C/70 rpm | 394.53 | 385.28 | ||
| 25 °C/120 rpm | 274.9 | 361.87 | ||
Disclaimer/Publisher’s Note: The statements, opinions and data contained in all publications are solely those of the individual author(s) and contributor(s) and not of MDPI and/or the editor(s). MDPI and/or the editor(s) disclaim responsibility for any injury to people or property resulting from any ideas, methods, instructions or products referred to in the content. |
© 2023 by the authors. Licensee MDPI, Basel, Switzerland. This article is an open access article distributed under the terms and conditions of the Creative Commons Attribution (CC BY) license (https://creativecommons.org/licenses/by/4.0/).
Share and Cite
Fang, D.; Mei, J.; Xie, J.; Qiu, W. The Effects of Transport Stress (Temperature and Vibration) on Blood Biochemical Parameters, Oxidative Stress, and Gill Histomorphology of Pearl Gentian Groupers. Fishes 2023, 8, 218. https://doi.org/10.3390/fishes8040218
Fang D, Mei J, Xie J, Qiu W. The Effects of Transport Stress (Temperature and Vibration) on Blood Biochemical Parameters, Oxidative Stress, and Gill Histomorphology of Pearl Gentian Groupers. Fishes. 2023; 8(4):218. https://doi.org/10.3390/fishes8040218
Chicago/Turabian StyleFang, Dan, Jun Mei, Jing Xie, and Weiqiang Qiu. 2023. "The Effects of Transport Stress (Temperature and Vibration) on Blood Biochemical Parameters, Oxidative Stress, and Gill Histomorphology of Pearl Gentian Groupers" Fishes 8, no. 4: 218. https://doi.org/10.3390/fishes8040218
APA StyleFang, D., Mei, J., Xie, J., & Qiu, W. (2023). The Effects of Transport Stress (Temperature and Vibration) on Blood Biochemical Parameters, Oxidative Stress, and Gill Histomorphology of Pearl Gentian Groupers. Fishes, 8(4), 218. https://doi.org/10.3390/fishes8040218