
QTL Mapping of Growth Traits in Yellow River Carp (Cyprinus carpio haematopterus) at 5–17 Months after Hatching


Abstract
1. Introduction
2. Materials and Methods
2.1. Family and Phenotypic Measurement
2.2. QTL Mapping
2.3. Screening for Candidate Genes
3. Results
3.1. Phenotypic Analysis of Growth-Related Traits
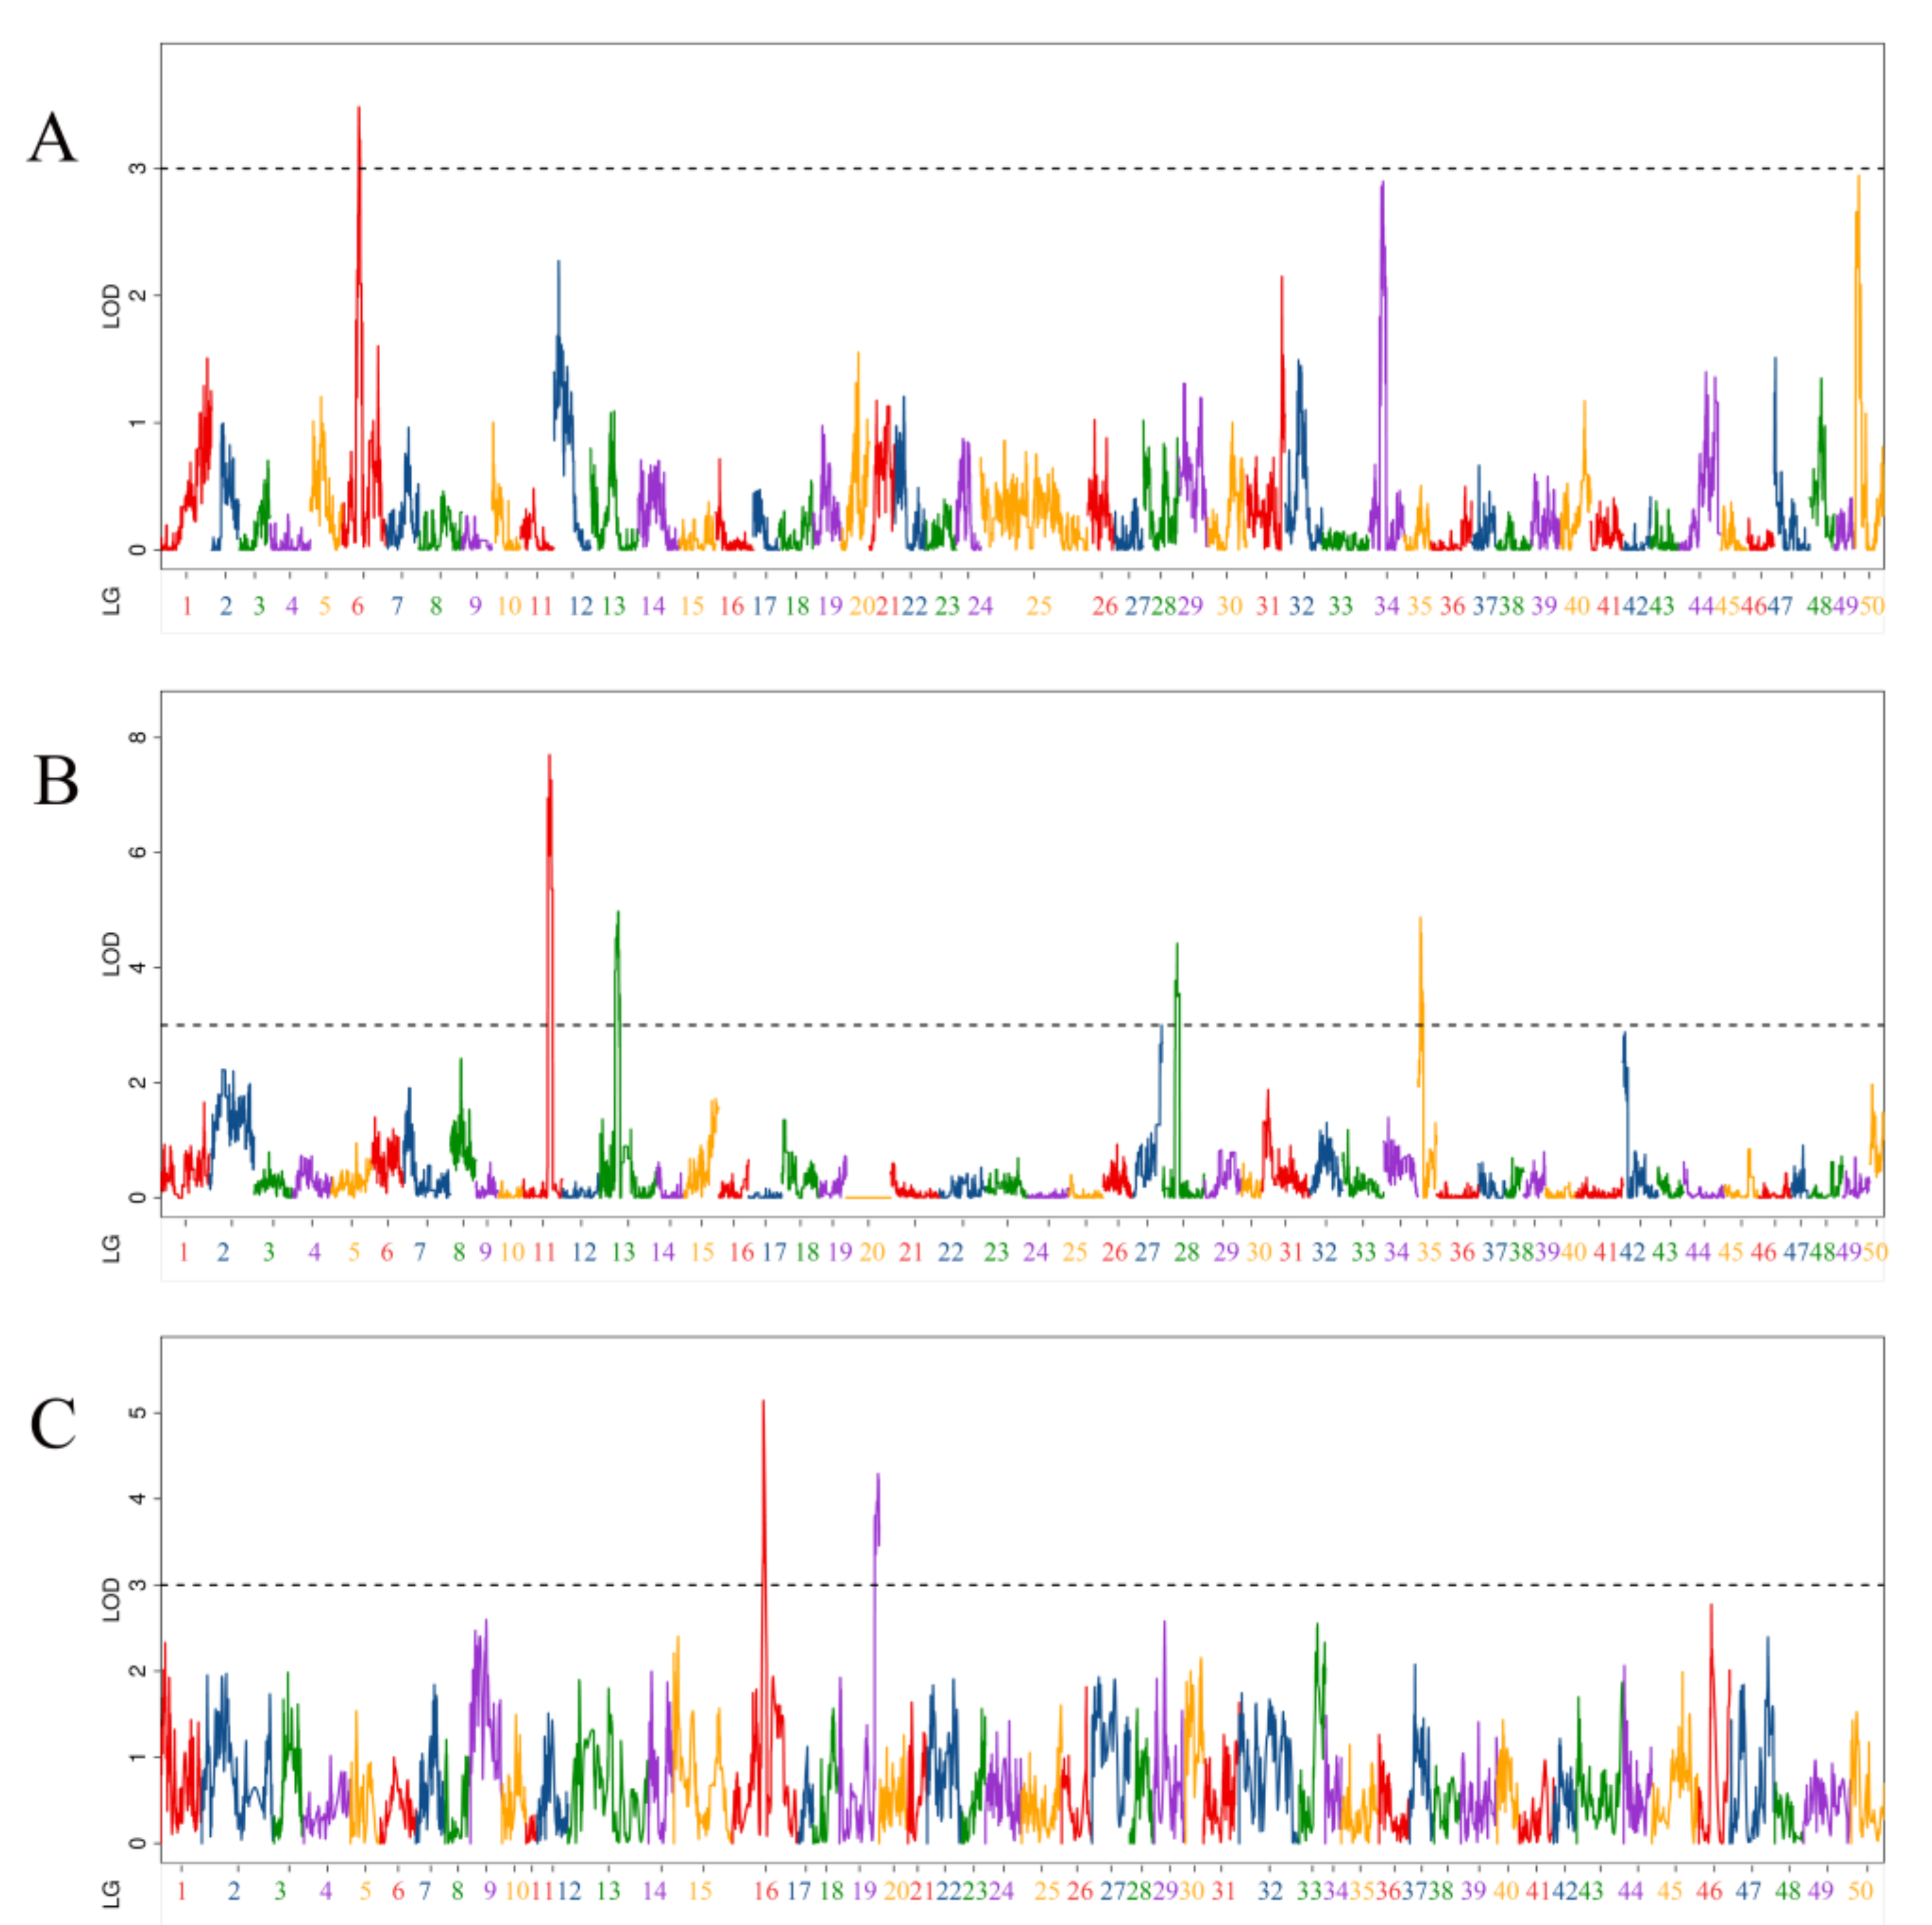
3.2. QTL Related to Body Length Traits
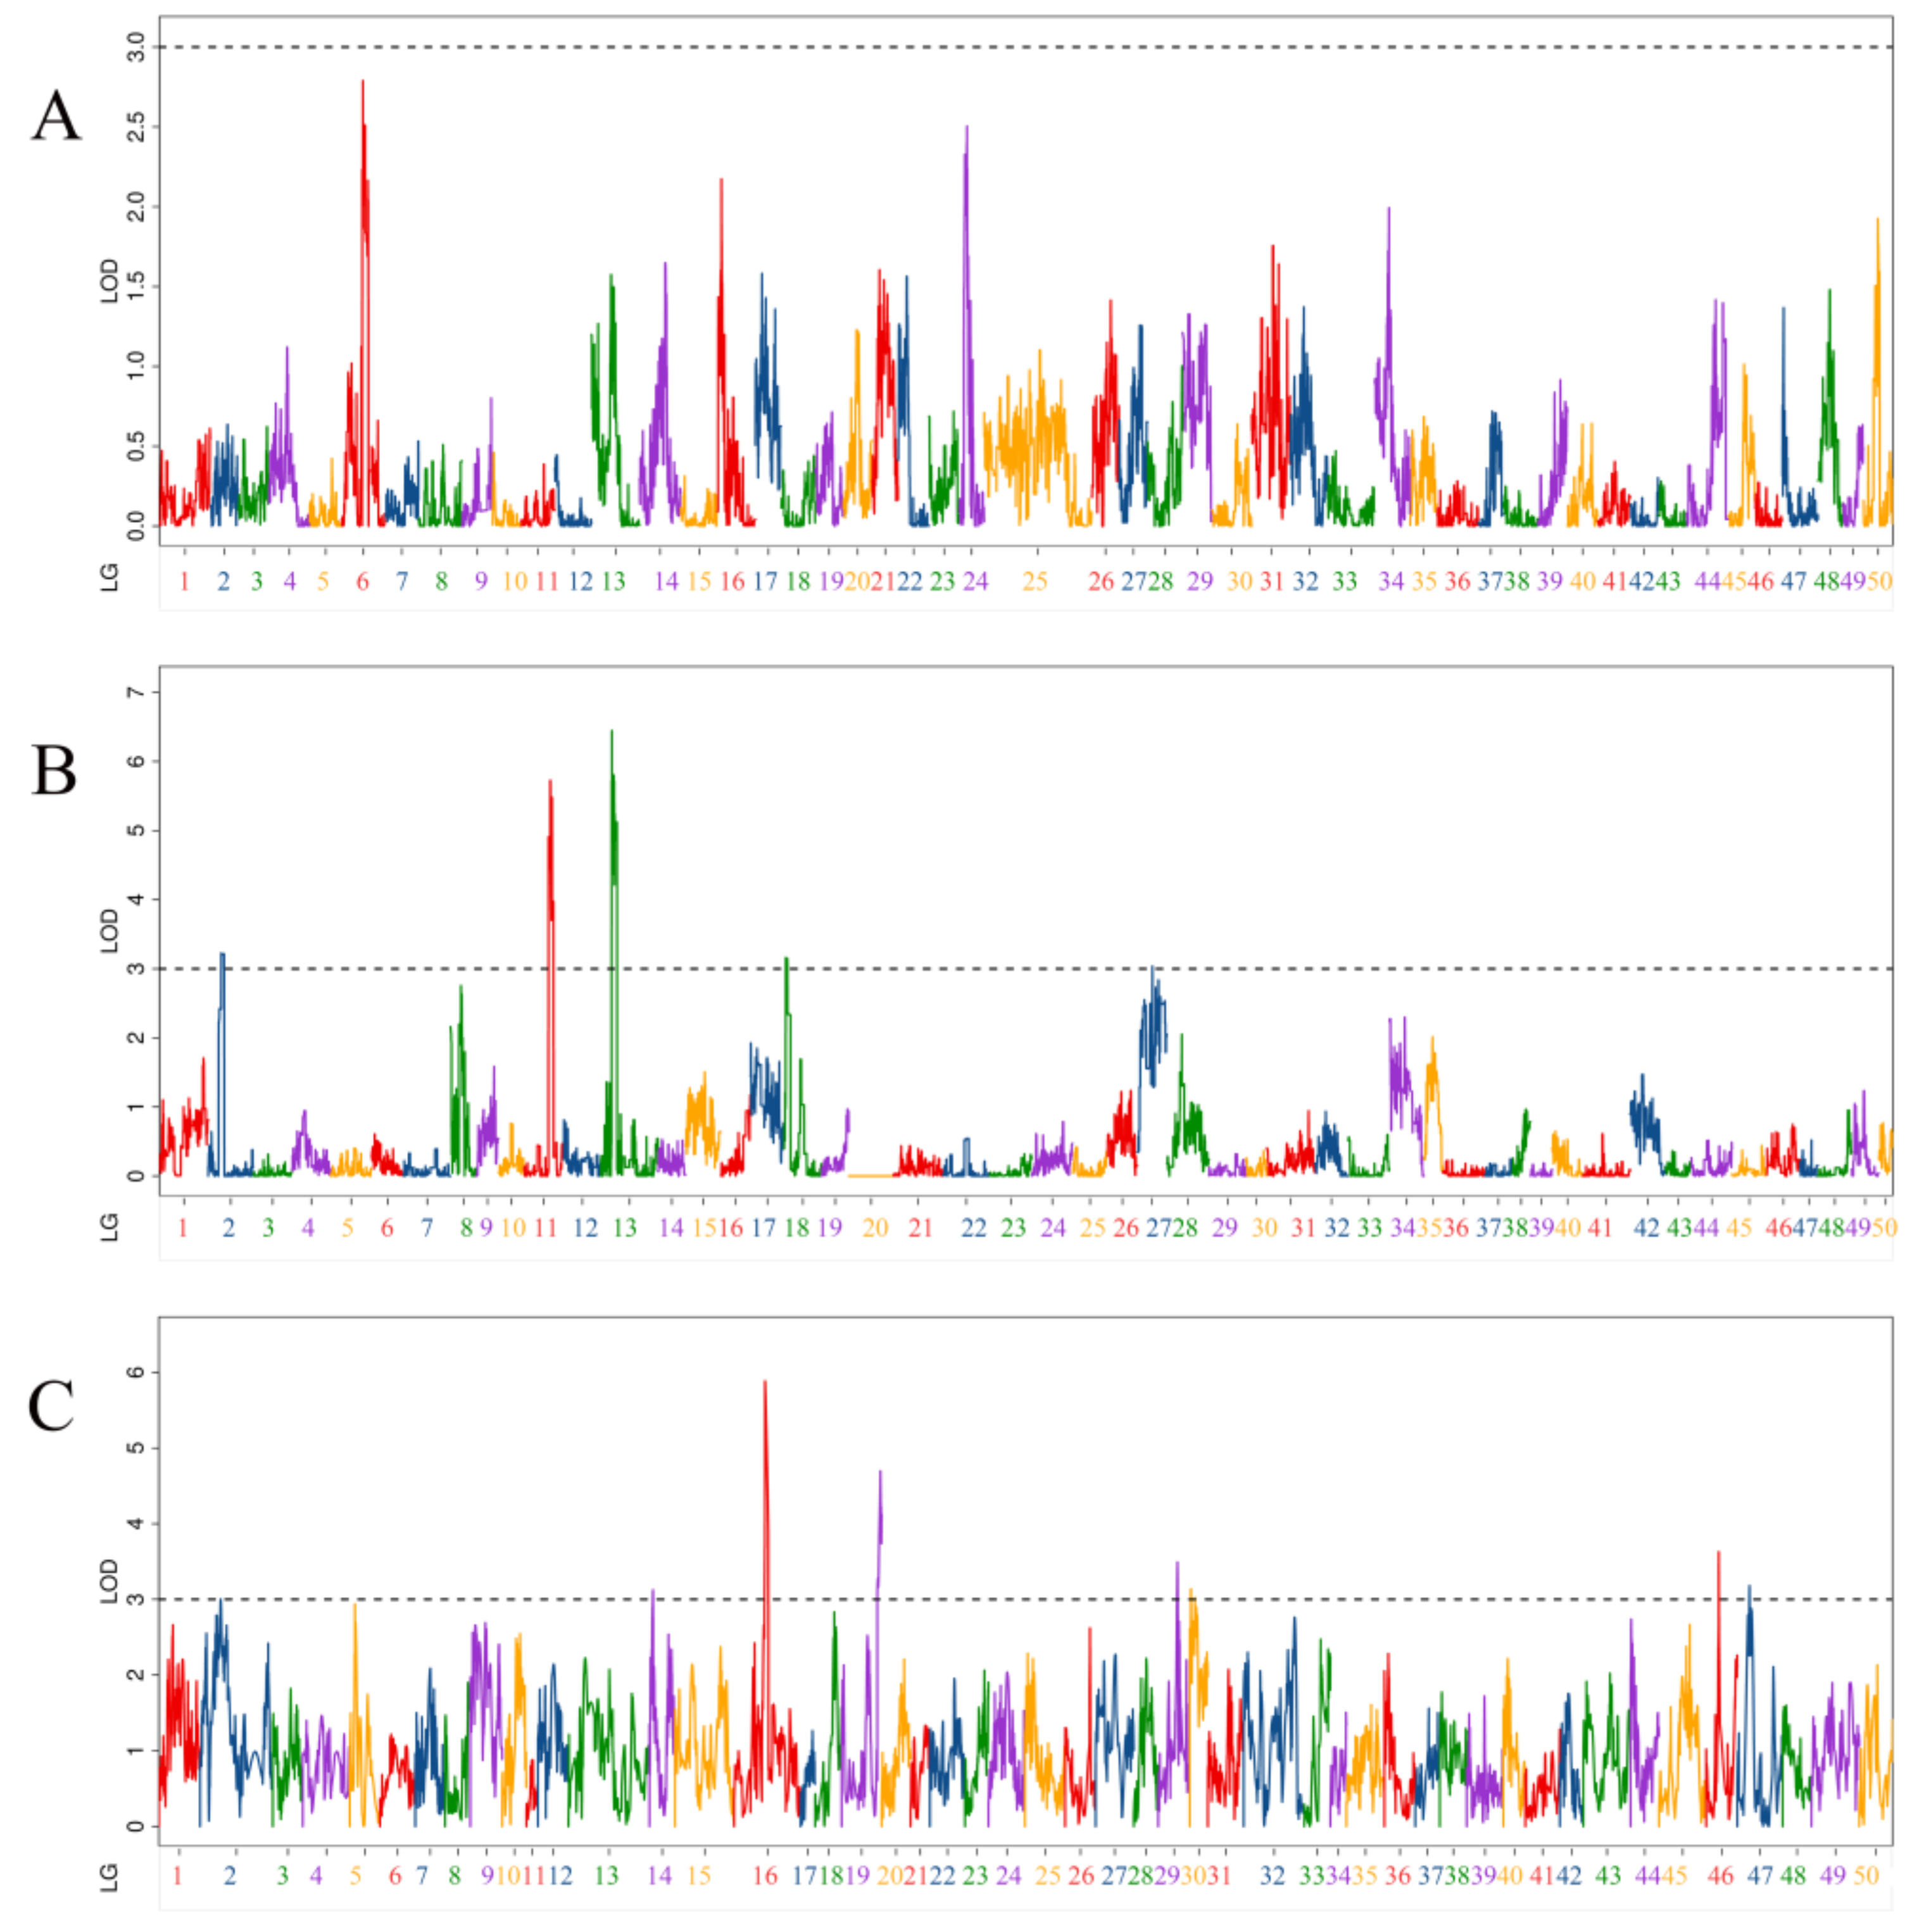
3.3. QTL Related to Body Height Traits
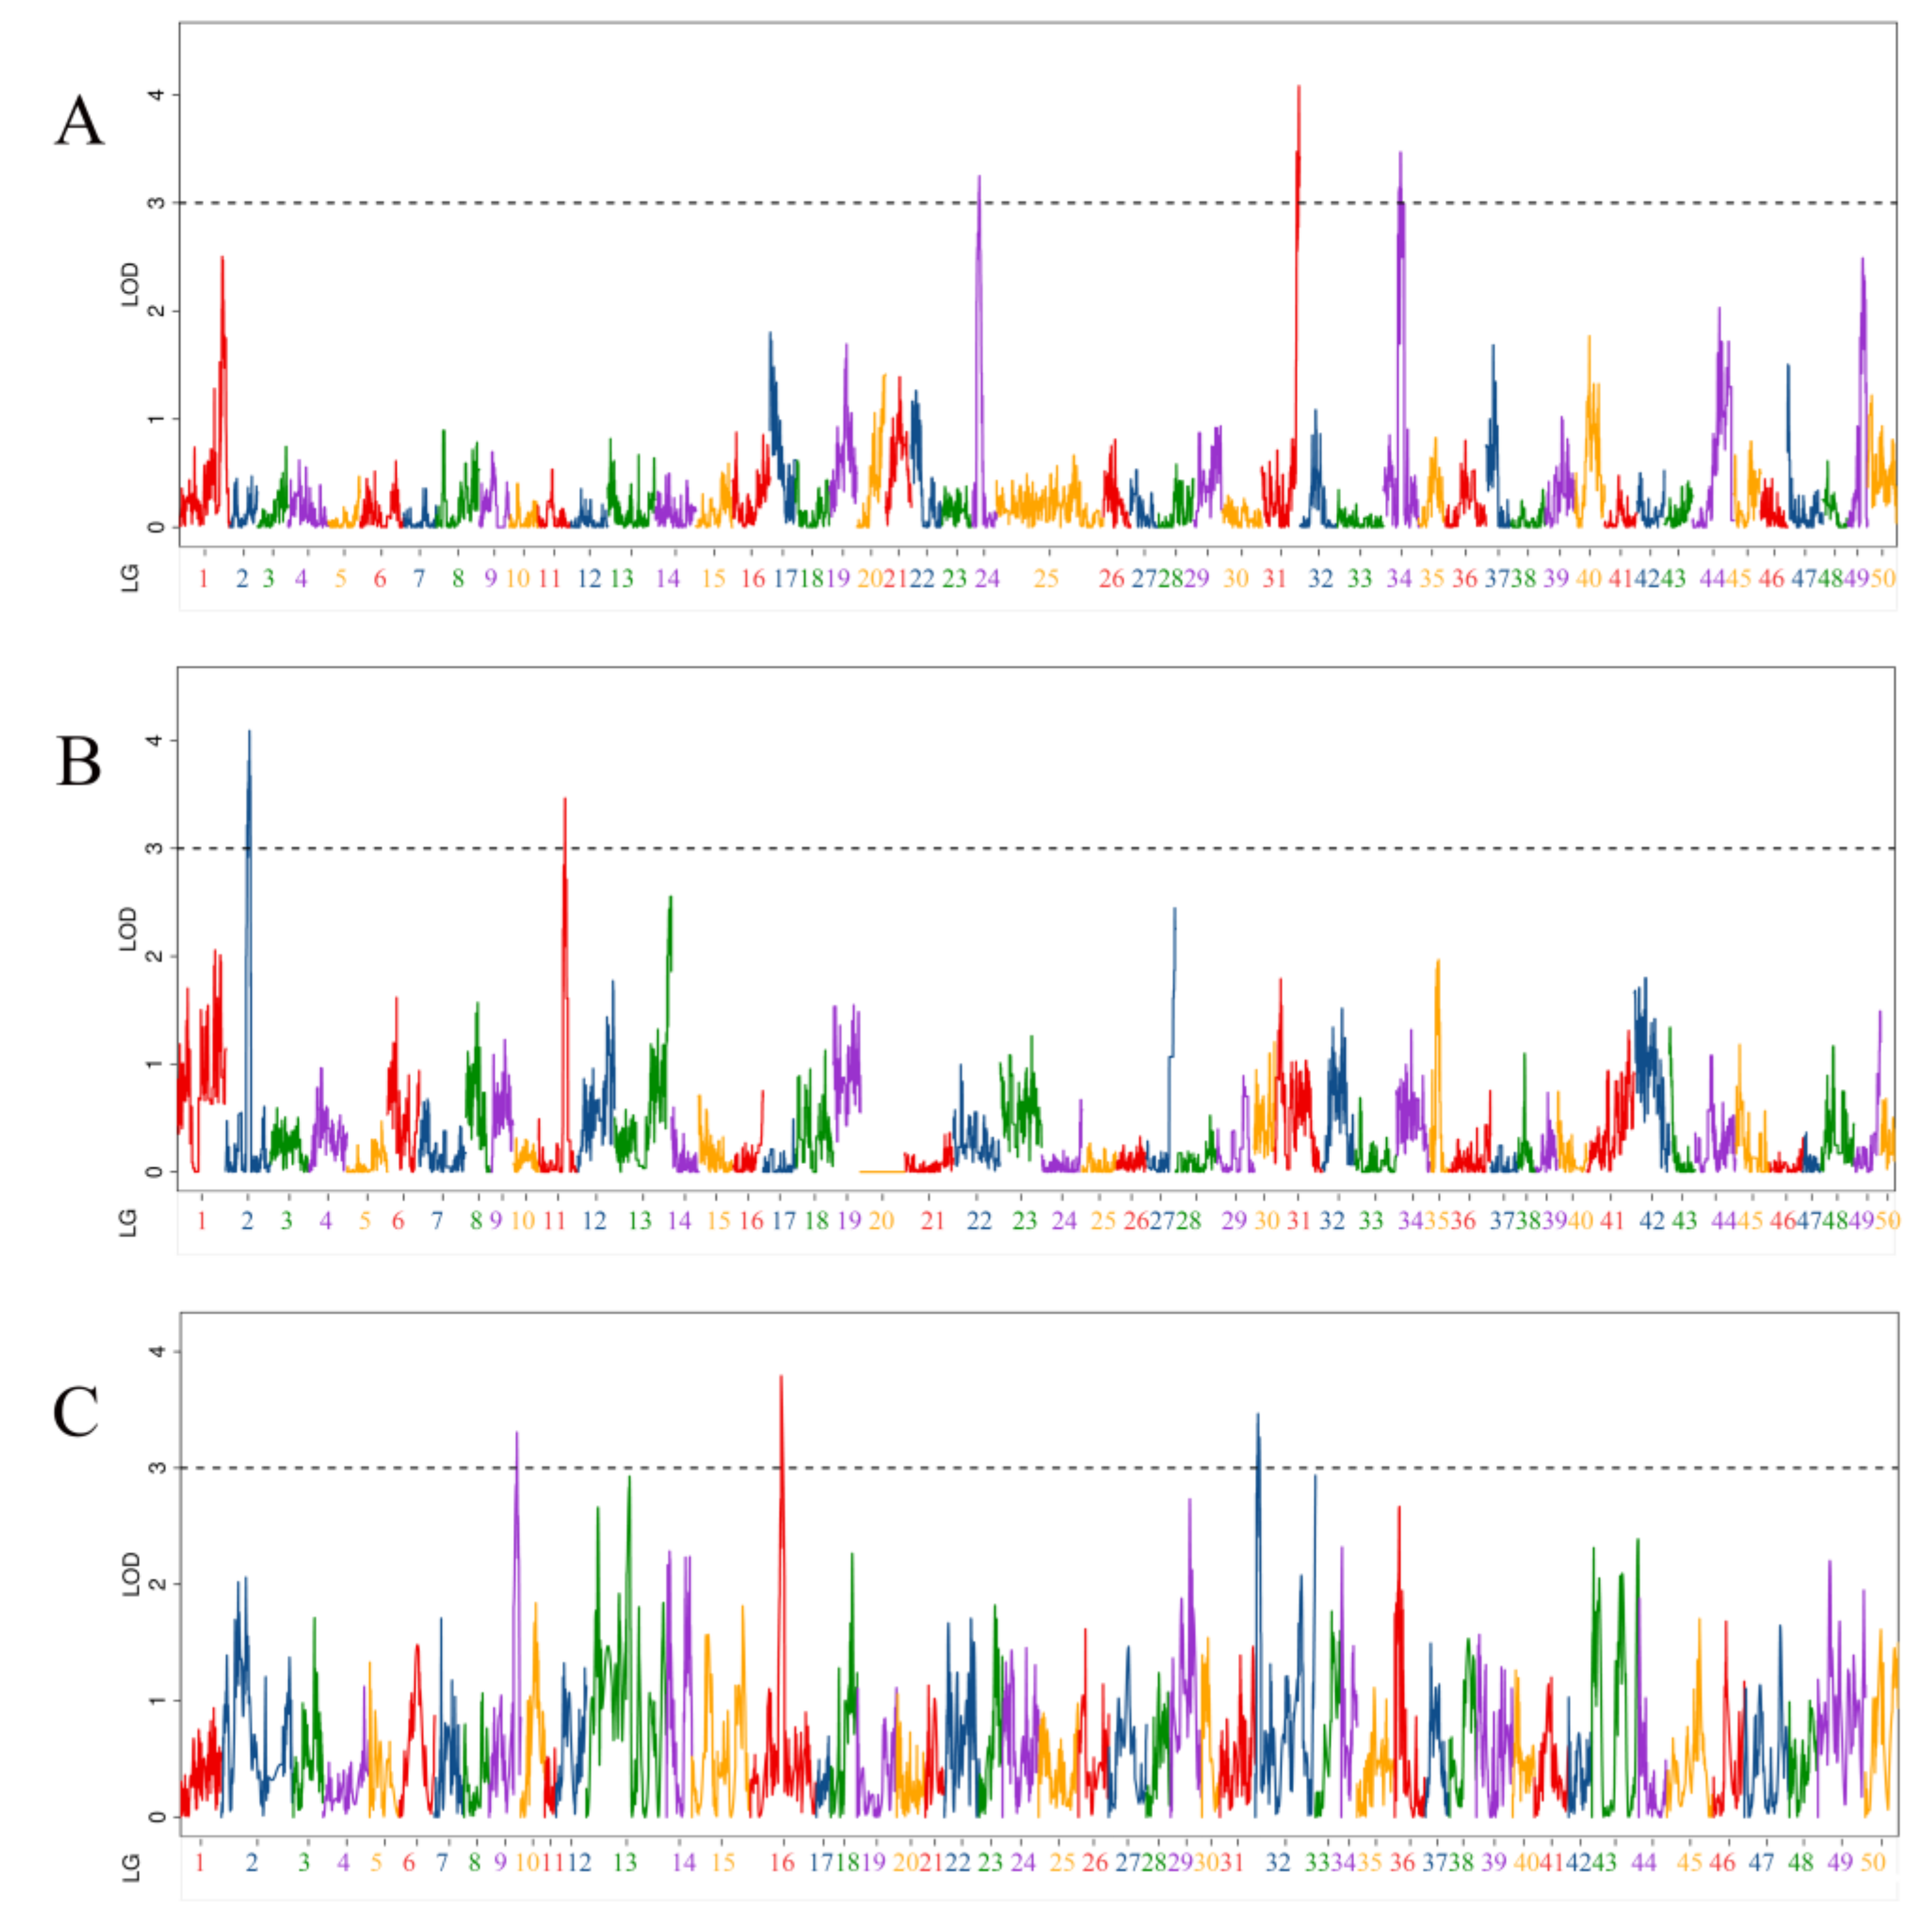
3.4. QTL Related to Body Thickness Traits
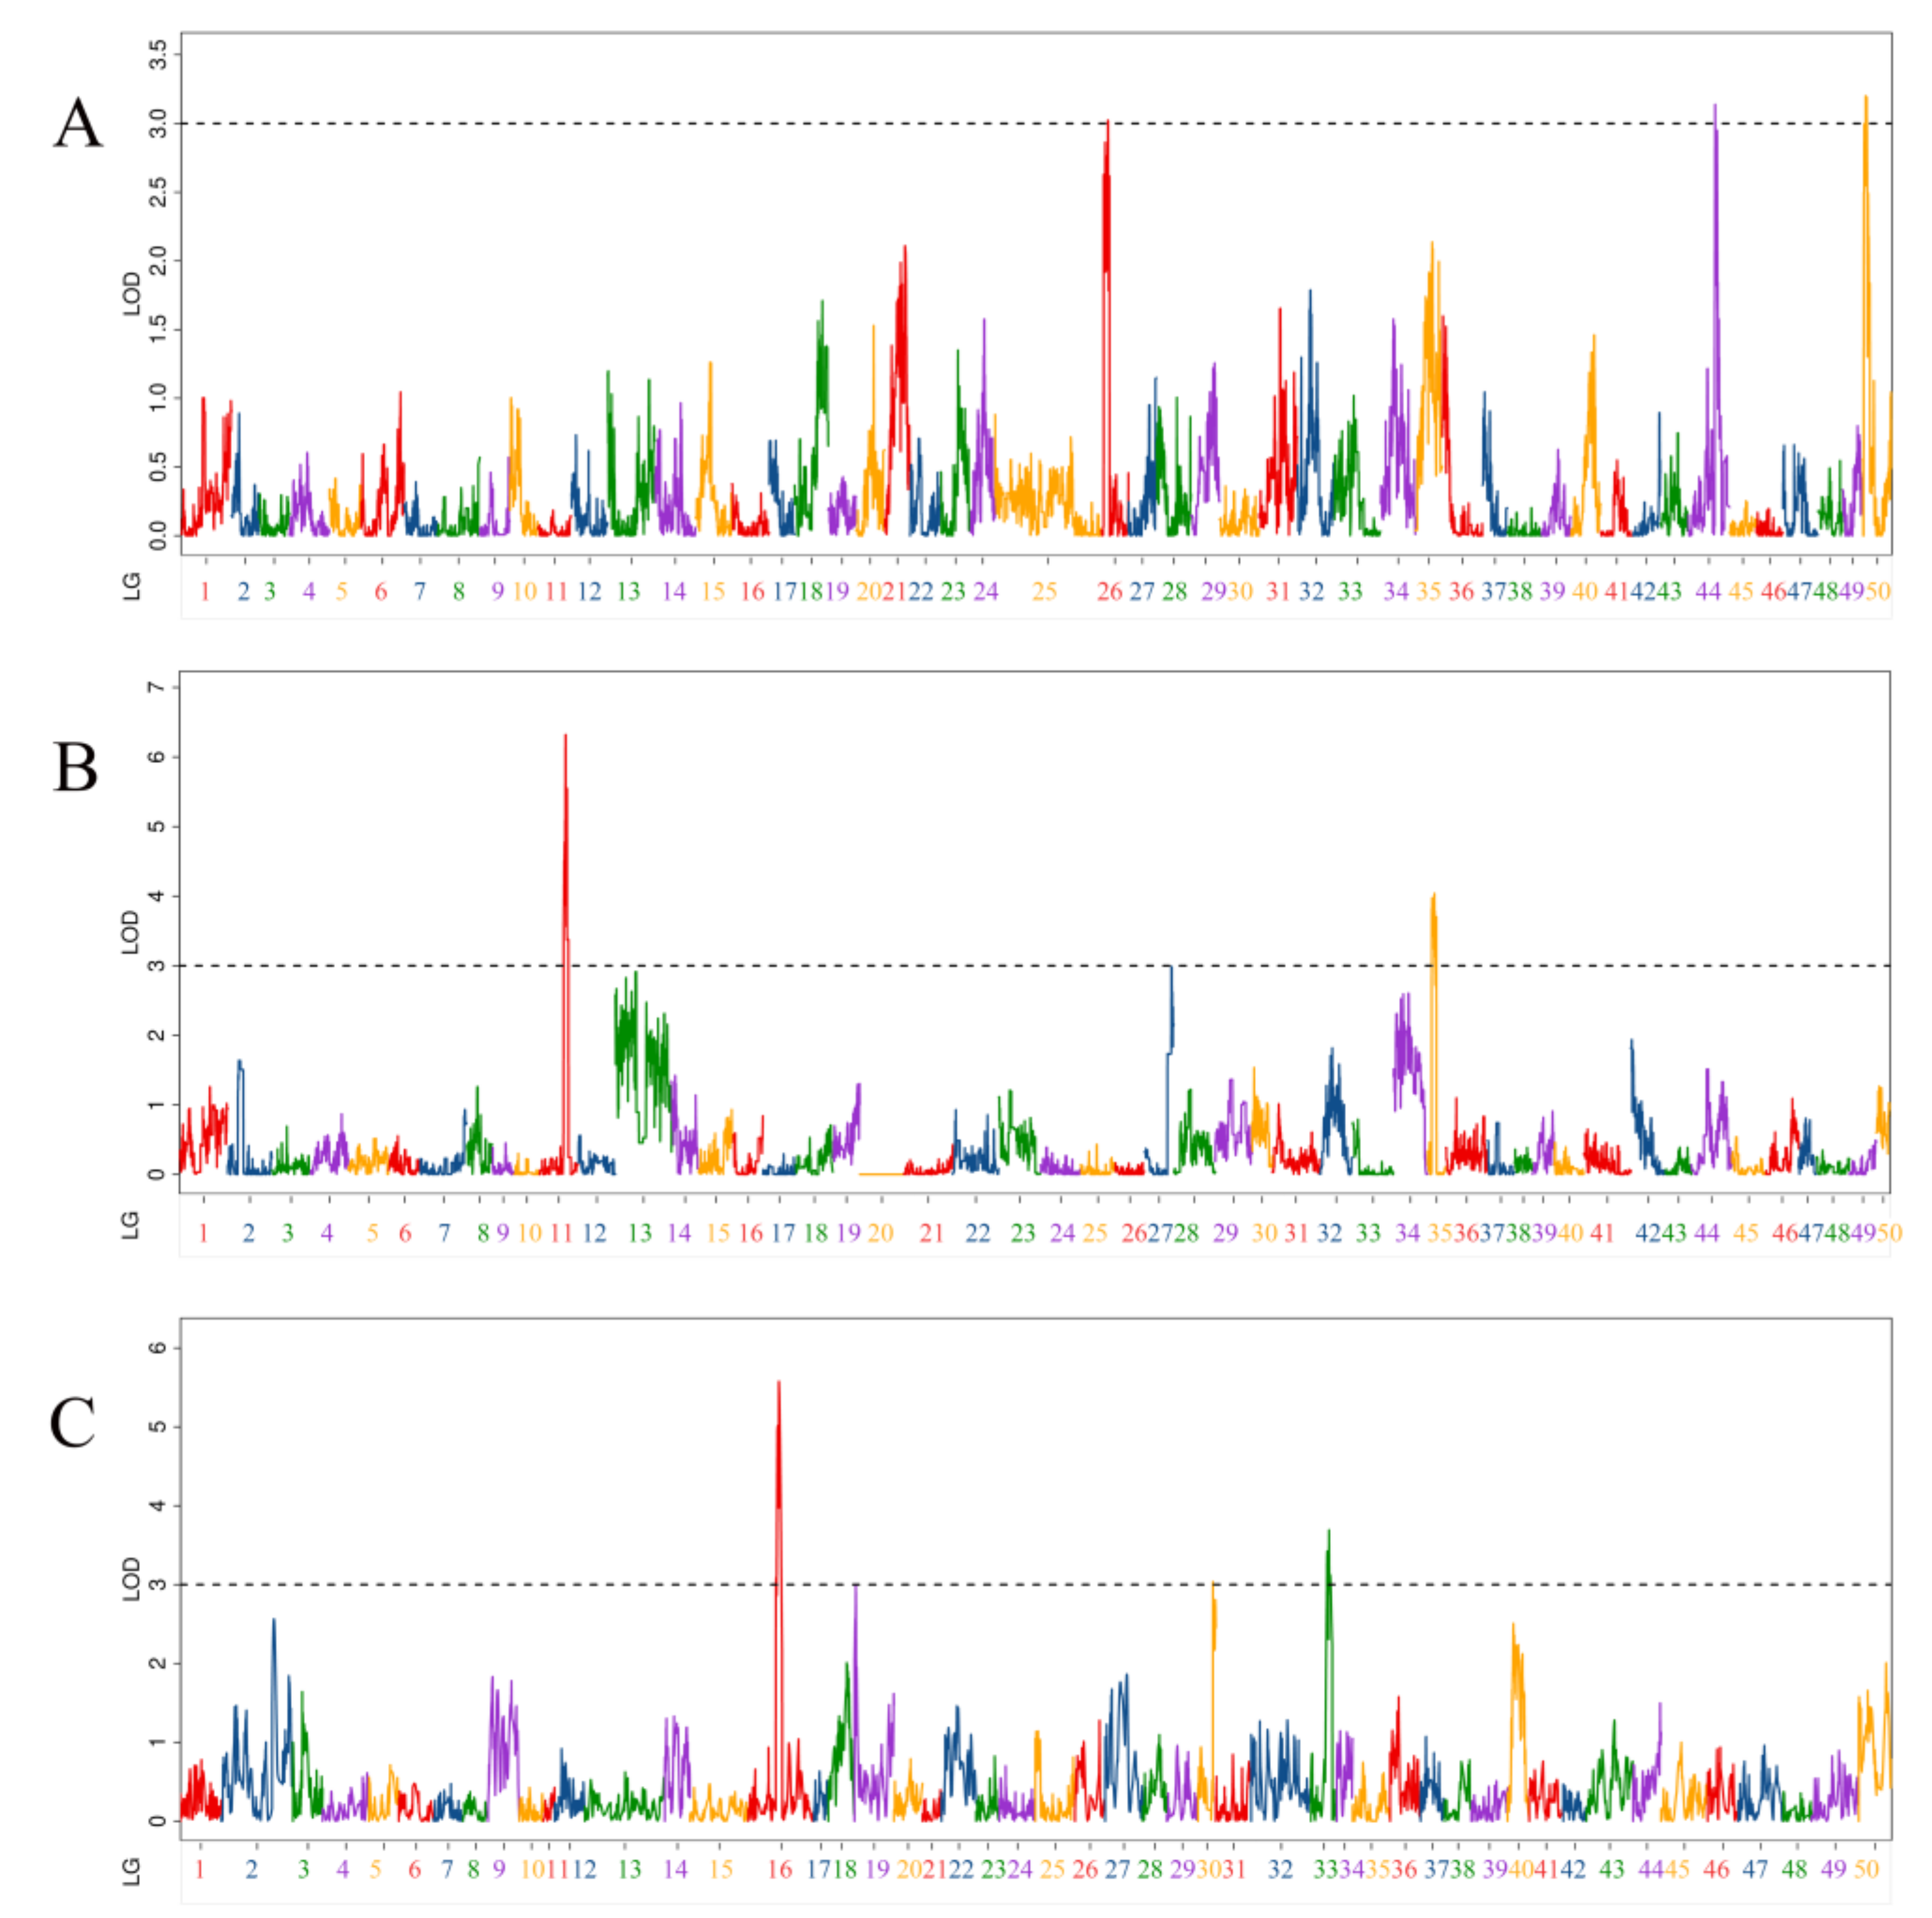
3.5. QTL Related to Body Weight Traits
3.6. Consensus QTL
3.7. Candidate Genes
4. Discussion
Supplementary Materials
Author Contributions
Funding
Institutional Review Board Statement
Informed Consent Statement
Data Availability Statement
Conflicts of Interest
References
- Nakajima, T.; Hudson, M.J.; Uchiyama, J.; Makibayashi, K.; Zhang, J. Common carp aquaculture in Neolithic China dates back 8000 years. Nat. Ecol. Evol. 2019, 3, 1415–1418. [Google Scholar] [CrossRef] [PubMed]
- Naylor, R.L.; Hardy, R.W.; Buschmann, A.H.; Bush, S.R.; Cao, L.; Klinger, D.H.; Little, D.C.; Lubchenco, J.; Shumway, S.E.; Troell, M. A 20-year retrospective review of global aquaculture. Nature 2021, 591, 551–563. [Google Scholar] [CrossRef] [PubMed]
- FAO. FAO Yearbook. Fishery and Aquaculture Statistics 2020; FAO: Roma, Italy, 2022. [Google Scholar]
- Xu, P.; Zhang, X.; Wang, X.; Li, J.; Liu, G.; Kuang, Y.; Xu, J.; Zheng, X.; Ren, L.; Wang, G.; et al. Genome sequence and genetic diversity of the common carp, Cyprinus carpio. Nat. Genet. 2014, 46, 1212–1219. [Google Scholar] [CrossRef] [PubMed]
- Li, J.T.; Wang, Q.; Huang, Y.M.; Li, Q.S.; Cui, M.S.; Dong, Z.J.; Wang, H.W.; Yu, J.H.; Zhao, Y.J.; Yang, C.R.; et al. Parallel subgenome structure and divergent expression evolution of allo-tetraploid common carp and goldfish. Nat. Genet. 2021, 53, 1493–1503. [Google Scholar] [CrossRef]
- Jiang, Y.; Zhang, S.; Xu, J.; Feng, J.; Mahboob, S.; Al-Ghanim, K.A.; Sun, X.; Xu, P. Comparative transcriptome analysis reveals the genetic basis of skin color variation in common carp. PLoS ONE 2014, 9, e108200. [Google Scholar] [CrossRef]
- Wang, L.; Zhang, L.; Chen, Y.; Chen, J.; Zhang, M.; Yu, M.; Jiang, H.; Qiao, Z.; Li, X. Mapping Growth-Related Quantitative Trait Locus (QTL) in Commercial Yellow River Carp (Cyprinus carpio haematopterus) during Overwintering. Fishes 2022, 7, 166. [Google Scholar] [CrossRef]
- Sun, X.; Liang, L. A genetic linkage map of common carp. J. Fish. Sci. China 2000, 7, 1–5. [Google Scholar]
- Wang, L.; Jia, S.; Zhang, Y.; Jiang, S.; Chen, Y.; Chen, J.; Yu, M.; Zhang, L.; Qiao, Z.; Li, X. Construction of Three High-Density Genetic Linkage Maps and Dynamic QTL Mapping of Growth Traits in Yellow River Carp (Cyprinus carpio haematopterus). Curr. Issues Mol. Biol. 2021, 43, 2276–2288. [Google Scholar] [CrossRef]
- Lu, C.; Laghari, M.Y.; Zheng, X.; Cao, D.; Zhang, X.; Kuang, Y.; Li, C.; Cheng, L.; Mahboob, S.; Al-Ghanim, K.A.; et al. Mapping quantitative trait loci and identifying candidate genes affecting feed conversion ratio based onto two linkage maps in common carp (Cyprinus carpio L). Aquaculture 2017, 468, 585–596. [Google Scholar] [CrossRef]
- Wang, X.; Zhang, X.; Li, W.; Zhang, T.; Li, C.; Sun, X. Mapping and genetic effect analysis on quantitative trait loci related to feed conversion ratio of conmmon carp (Cyprinus carpio L). Acta Hydrobiol. Sin. 2012, 36, 177–196. [Google Scholar]
- Kuang, Y.; Zheng, X.; Lv, W.; Cao, D.; Sun, X. Mapping quantitative trait loci for flesh fat content in common carp (Cyprinus carpio). Aquaculture 2015, 435, 100–105. [Google Scholar] [CrossRef]
- Zheng, X.; Kuang, Y.; Lv, W.; Cao, D.; Sun, Z.; Sun, X. Genome-Wide Association Study for Muscle Fat Content and Abdominal Fat Traits in Common Carp (Cyprinus carpio). PLoS ONE 2016, 11, e169127. [Google Scholar] [CrossRef]
- Zhang, Y.; Xu, P.; Lu, C.; Kuang, Y.; Zhang, X.; Cao, D.; Li, C.; Chang, Y.; Hou, N.; Li, H.; et al. Genetic linkage mapping and analysis of muscle fiber-related QTLs in common carp (Cyprinus carpio L.). Mar. Biotechnol. 2011, 13, 376–392. [Google Scholar] [CrossRef]
- Chen, L.; Peng, W.; Kong, S.; Pu, F.; Chen, B.; Zhou, Z.; Feng, J.; Li, X.; Xu, P. Genetic Mapping of Head Size Related Traits in Common Carp (Cyprinus carpio). Front. Genet. 2018, 9, 448. [Google Scholar] [CrossRef]
- Peng, W.; Xu, J.; Zhang, Y.; Feng, J.; Dong, C.; Jiang, L.; Feng, J.; Chen, B.; Gong, Y.; Chen, L.; et al. An ultra-high density linkage map and QTL mapping for sex and growth-related traits of common carp (Cyprinus carpio). Sci. Rep. 2016, 6, 26693. [Google Scholar] [CrossRef]
- Wang, X.; Fu, B.; Yu, X.; Qu, C.; Zhang, Q.; Tong, J. Fine mapping of growth-related quantitative trait loci in Yellow River carp (Cyprinus carpio haematoperus). Aquaculture 2018, 484, 277–285. [Google Scholar] [CrossRef]
- Mackay, T.F.; Stone, E.A.; Ayroles, J.F. The genetics of quantitative traits: Challenges and prospects. Nat. Rev. Genet. 2009, 10, 565–577. [Google Scholar] [CrossRef]
- Gjedrem, T. Genetic improvement of cold-water fish species. Aquac. Res. 2000, 31, 25–33. [Google Scholar] [CrossRef]
- Chai, C.K. Analysis of Quantitative Inheritance of Body Size in Mice. I. Hybridization and Maternal Influence. Genetics 1956, 41, 157–164. [Google Scholar] [CrossRef]
- Doupé, R.G.; Lymbery, A.J. Additive genetic and other sources of variation in growth traits of juvenile black bream Acanthopagrus butcheri. Aquac. Res. 2005, 36, 621–626. [Google Scholar] [CrossRef]
- Heath, D.D.; Fox, C.W.; Heath, J.W. Maternal effects on offspring size: Variation through early development of chinook salmon. Evolution 1999, 53, 1605–1611. [Google Scholar] [CrossRef] [PubMed]
- Green, B.S. Maternal effects in fish populations. Adv. Mar. Biol. 2008, 54, 1–105. [Google Scholar] [PubMed]
- Laghari, M.Y.; Zhang, Y.; Lashari, P.; Zhang, X.; Xu, P.; Xin, B.; Sun, X. Quantitative trait loci (QTL) associated with growth rate trait in common carp (Cyprinus carpio). Aquac. Int. 2013, 21, 1373–1379. [Google Scholar] [CrossRef]
- Nishida, H. Patterning the marginal zone of early ascidian embryos: Localized maternal mRNA and inductive interactions. Bioessays 2002, 24, 613–624. [Google Scholar] [CrossRef]
- Clarke, W.C.; Shelbourn, J.E.; Brett, J.R. Effect of artificial photoperiod cycles, temperature, and salinity on growth and smolting in underyearling coho (Oncorhynchus kisutch), chinook (O. Tshawytscha), and sockeye (O. nerka) salmon. Aquaculture 1981, 22, 105–116. [Google Scholar] [CrossRef]
- Handeland, S.O.; Imsland, A.K.; Stefansson, S.O. The effect of temperature and fish size on growth, feed intake, food conversion efficiency and stomach evacuation rate of Atlantic salmon post-smolts. Aquaculture 2008, 283, 36–42. [Google Scholar] [CrossRef]
- Falica, B.K.; Lehnert, S.J.; Pitcher, T.E.; Heath, D.D.; Higgs, D.M. Ontogentic shifts in genetic and maternal effects on length and survival in Chinook salmon (Oncorhynchus tshawytscha). Aquaculture 2017, 468, 218–225. [Google Scholar] [CrossRef]
- Qi, P.; Eudy, D.; Schnable, J.C.; Schmutz, J.; Raymer, P.L.; Devos, K.M. High Density Genetic Maps of Seashore Paspalum Using Genotyping-By-Sequencing and Their Relationship to The Sorghum Bicolor Genome. Sci. Rep. 2019, 9, 12183. [Google Scholar] [CrossRef]
- Wu, Y.; Bhat, P.R.; Close, T.J.; Lonardi, S. Efficient and accurate construction of genetic linkage maps from the minimum spanning tree of a graph. PLoS Genet. 2008, 4, e1000212. [Google Scholar] [CrossRef]
- Lander, E.S.; Green, P.; Abrahamson, J.; Barlow, A.; Daly, M.J.; Lincoln, S.E.; Newberg, L.A. MAPMAKER: An interactive computer package for constructing primary genetic linkage maps of experimental and natural populations. Genomics 1987, 1, 174–181. [Google Scholar] [CrossRef]
- Qi, P.; Gimode, D.; Saha, D.; Schroder, S.; Chakraborty, D.; Wang, X.; Dida, M.M.; Malmberg, R.L.; Devos, K.M. UGbS-Flex, a novel bioinformatics pipeline for imputation-free SNP discovery in polyploids without a reference genome: Finger millet as a case study. BMC Plant Biol. 2018, 18, 117. [Google Scholar] [CrossRef]
- Voorrips, R.E. MapChart: Software for the graphical presentation of linkage maps and QTLs. J. Hered. 2002, 93, 77–78. [Google Scholar] [CrossRef]
- Wang, S. Windows QTL Cartographer 2.5; North Carolina State University: Raleigh, NC, USA, 2012. [Google Scholar]
- Xu, P.; Xu, J.; Liu, G.; Chen, L.; Zhou, Z.; Peng, W.; Jiang, Y.; Zhao, Z.; Jia, Z.; Sun, Y.; et al. The allotetraploid origin and asymmetrical genome evolution of the common carp Cyprinus carpio. Nat. Commun. 2019, 10, 4625. [Google Scholar] [CrossRef]
- Luo, J.; Dou, L.; Yang, Z.; Zhou, Z.; Huang, H. CBFA2T2 promotes adipogenic differentiation of mesenchymal stem cells by regulating CEBPA. Biochem. Biophys. Res. Commun. 2020, 529, 133–139. [Google Scholar] [CrossRef]
- Nady, N.; Gupta, A.; Ma, Z.; Swigut, T.; Koide, A.; Koide, S.; Wysocka, J. ETO family protein Mtgr1 mediates Prdm14 functions in stem cell maintenance and primordial germ cell formation. eLife 2015, 4, e10150. [Google Scholar] [CrossRef]
- Laghari, M.Y.; Lashari, P.; Zhang, X.; Xu, P.; Narejo, N.T.; Xin, B.; Zhang, Y.; Sun, X. QTL mapping for economically important traits of common carp (Cyprinus carpio L.). J. Appl. Genet. 2015, 56, 65–75. [Google Scholar] [CrossRef]
- Feng, X.; Yu, X.; Fu, B.; Wang, X.; Liu, H.; Pang, M.; Tong, J. A high-resolution genetic linkage map and QTL fine mapping for growth-related traits and sex in the Yangtze River common carp (Cyprinus carpio haematopterus). BMC Genom. 2018, 19, 230. [Google Scholar] [CrossRef]
- Gjerde, B.; Gjedrem, T. Estimates of phenotypic and genetic parameters for carcass traits in Atlantic salmon and rainbow trout. Aquaculture 1984, 36, 97–110. [Google Scholar] [CrossRef]
- Luo, W.; Zeng, C.; Deng, W.; Robinson, N.; Wang, W.; Gao, Z. Genetic parameter estimates for growth-related traits of blunt snout bream (Megalobrama amblycephala) using microsatellite-based pedigree. Aquac. Res. 2014, 45, 1881–1888. [Google Scholar] [CrossRef]
- Lv, W.; Zheng, X.; Kuang, Y.; Cao, D.; Yan, Y.; Sun, X. QTL variations for growth-related traits in eight distinct families of common carp (Cyprinus carpio). BMC Genet. 2016, 17, 65. [Google Scholar] [CrossRef]
- Tu, S.; Narendra, V.; Yamaji, M.; Vidal, S.E.; Rojas, L.A.; Wang, X.; Kim, S.Y.; Garcia, B.A.; Tuschl, T.; Stadtfeld, M.; et al. Co-repressor CBFA2T2 regulates pluripotency and germline development. Nature 2016, 534, 387–390. [Google Scholar] [CrossRef] [PubMed]
- Sugita, S.; Ho, A.; Sudhof, T.C. NECABs: A family of neuronal Ca(2+)-binding proteins with an unusual domain structure and a restricted expression pattern. Neuroscience 2002, 112, 51–63. [Google Scholar] [CrossRef] [PubMed]
- Selman, K.; Wallace, R.A.; Sarka, A.; Qi, X. Stages of oocyte development in the zebrafish, Brachydanio rerio. J. Morphol. 1993, 218, 203–224. [Google Scholar] [CrossRef] [PubMed]
- Knaut, H.; Steinbeisser, H.; Schwarz, H.; Nüsslein-Volhard, C. An Evolutionary Conserved Region in the vasa 3′UTR Targets RNA Translation to the Germ Cells in the Zebrafish. Curr. Biol. 2002, 12, 454–466. [Google Scholar] [CrossRef]
- Dick, A.; Meier, A.; Hammerschmidt, M. Smad1 and Smad5 have distinct roles during dorsoventral patterning of the zebrafish embryo. Dev. Dyn. 1999, 216, 285–298. [Google Scholar] [CrossRef]
- Hild, M.; Dick, A.; Rauch, G.J.; Meier, A.; Bouwmeester, T.; Haffter, P.; Hammerschmidt, M. The smad5 mutation somitabun blocks Bmp2b signaling during early dorsoventral patterning of the zebrafish embryo. Development 1999, 126, 2149–2159. [Google Scholar] [CrossRef]
- Yabe, T.; Shimizu, T.; Muraoka, O.; Bae, Y.K.; Hirata, T.; Nojima, H.; Kawakami, A.; Hirano, T.; Hibi, M. Ogon/Secreted Frizzled functions as a negative feedback regulator of Bmp signaling. Development 2003, 130, 2705–2716. [Google Scholar] [CrossRef]


| Body Length | Body Height | Body Thickness | Body Weight | |
|---|---|---|---|---|
| Body length | 1 | 0.846 ** | 0.715 ** | 0.810 ** |
| Body height | 1 | 0.730 ** | 0.768 ** | |
| Body thickness | 1 | 0.714 ** | ||
| Body weight | 1 |
| QTL Name | Linkage Group | Position (cM) | LOD | Additive Effect | PVE (%) | Marker Chromosome | Marker Position (bp) |
|---|---|---|---|---|---|---|---|
| qBL-m1 | 6 | 58.5 | 3.48 | −0.62 | 6.20% | 6 | 16,383,826 |
| qBL-p-1 | 11 | 103.6 | 6.95 | −0.82 | 10.85% | 12 | 19,503,894 |
| qBL-p-2 | 11 | 111.5 | 7.70 | −0.87 | 11.94% | 12 | 24,980,556 |
| qBL-p-3 | 13 | 67.5 | 4.50 | 0.64 | 6.99% | 13 | 33,896,212 |
| qBL-p-4 | 13 | 84.3 | 3.54 | 0.57 | 5.55% | 13 | 25,639,005 |
| qBL-p-5 | 28 | 63 | 4.42 | −0.63 | 6.65% | 23 | 19,462,120 |
| qBL-p-6 | 35 | 10.9 | 4.87 | −0.66 | 7.31% | 39 | 1,951,059 |
| qBL-p-7 | 35 | 19.7 | 3.57 | −0.57 | 5.44% | 39 | 10,941,579 |
| qBL-h-1 | 16 | 132.7 | 5.14 | −1.03 | 8.50% | 12 | 25,680,671 |
| qBL-h-2 | 19 | 152.7 | 3.80 | −0.75 | 5.11% | 13 | 9,737,730 |
| QTL Uname | Linkage Group | Position (cM) | LOD | Additive Effect | PVE (%) | Marker Chromosome | Marker Position (bp) |
|---|---|---|---|---|---|---|---|
| qBH-p-1 | 2 | 55.2 | 3.23 | −0.17 | 4.99% | 4 | 7,884,172 |
| qBH-p-2 | 11 | 103.6 | 4.91 | −0.21 | 7.77% | 12 | 19,503,894 |
| qBH-p-3 | 11 | 111.5 | 5.73 | −0.23 | 8.99% | 12 | 24,980,556 |
| qBH-p-4 | 11 | 117.7 | 5.48 | −0.22 | 8.62% | 12 | 25,754,793 |
| qBH-p-5 | 13 | 45.9 | 6.45 | 0.25 | 10.25% | 13 | 28,611,274 |
| qBH-p-6 | 13 | 54 | 5.80 | 0.23 | 9.30% | 13 | 26,978,713 |
| qBH-p-7 | 18 | 8 | 3.16 | 0.17 | 4.86% | 18 | 24,240,677 |
| qBH-p-8 | 27 | 64.4 | 3.04 | −0.16 | 4.30% | 29 | 14,883,678 |
| qBH-h-1 | 14 | 15.2 | 3.12 | 0.12 | 0.38% | 18 | 13,961,785 |
| qBH-h-2 | 16 | 132.7 | 5.89 | −0.34 | 11.20% | 12 | 25,680,671 |
| qBH-h-3 | 19 | 166.2 | 4.70 | −0.19 | 6.87% | 13 | 33,051,888 |
| qBH-h-4 | 29 | 82.5 | 3.49 | 0.26 | 0.60% | 24 | 16,787,715 |
| qBH-h-5 | 30 | 5.1 | 3.14 | 0.20 | 1.83% | 29 | 19,199,891 |
| qBH-h-6 | 46 | 53.9 | 3.63 | −0.10 | 3.81% | 47 | 548,793 |
| QTL Name | Linkage Group | Position (cM) | LOD | Additive Effect | PVE (%) | Marker Chromosome | Marker Position (bp) |
|---|---|---|---|---|---|---|---|
| qBT-m-1 | 24 | 26.3 | 3.25 | 0.13 | 5.56% | 24 | 15,585,749 |
| qBT-m-2 | 31 | 123.8 | 3.47 | −0.13 | 6.02% | 31 | 22,977,299 |
| qBT-m-3 | 31 | 131.7 | 4.08 | −0.14 | 7.02% | 31 | 26,544,948 |
| qBT-m-4 | 34 | 60.3 | 3.47 | 0.13 | 5.93% | 34 | 9,720,686 |
| qBT-p-1 | 2 | 94.3 | 3.54 | −0.13 | 5.72% | 4 | 13,427,293 |
| qBT-p-2 | 2 | 104.2 | 3.67 | −0.13 | 5.92% | 4 | 19,441,752 |
| qBT-p-3 | 11 | 112.3 | 3.46 | −0.13 | 5.93% | 12 | 24,883,274 |
| qBT-h-1 | 9 | 119.9 | 3.31 | 0.18 | 3.13% | 4 | 17,045,253 |
| qBT-h-2 | 16 | 132.7 | 3.79 | −0.19 | 7.26% | 12 | 25,680,671 |
| qBT-h-3 | 32 | 17.2 | 3.26 | 0.15 | 1.88% | 31 | 24,691,636 |
| QTL Name | Linkage Group | Position (cM) | LOD | Additive Effect | PVE (%) | Marker Chromosome | Marker Position (bp) |
|---|---|---|---|---|---|---|---|
| qBW-m-1 | 26 | 23.3 | 3.02 | −30.82 | 5.24% | 26 | 18,959,884 |
| qBW-m-2 | 44 | 94.9 | 3.14 | 33.23 | 6.06% | 26720 | 65,263 |
| qBW-m-3 | 50 | 10.2 | 3.20 | 31.58 | 5.45% | 50 | 16,482,578 |
| qBW-p-1 | 11 | 106.1 | 4.51 | −37.67 | 7.72% | 12 | 23,575,083 |
| qBW-p-2 | 11 | 112.3 | 6.32 | −44.31 | 10.62% | 12 | 24,883,274 |
| qBW-p-3 | 11 | 118.7 | 5.55 | −41.53 | 9.40% | 12 | 25,754,793 |
| qBW-p-4 | 35 | 18.1 | 3.82 | −31.92 | 5.53% | 39 | 9,244,863 |
| qBW-p-5 | 35 | 32 | 3.78 | −31.89 | 5.48% | 39 | 10,593,376 |
| qBW-p-6 | 35 | 38.5 | 3.70 | −31.54 | 5.37% | 39 | 19,390,144 |
| qBW-h-1 | 16 | 132.7 | 5.58 | −52.80 | 5.00% | 12 | 25,680,671 |
| qBW-h-2 | 30 | 64.8 | 3.03 | 41.59 | 4.90% | 29 | 14,096,508 |
| qBW-h-3 | 33 | 70 | 3.42 | 42.25 | 3.20% | 39 | 4,996,409 |
| qBW-h-4 | 33 | 77.9 | 3.69 | 46.25 | 4.17% | 39 | 18,795,619 |
| Consensus QTL | QTL Name | Growth Trait | LOD | PVE(%) | Marker Name | Marker Chromosome | Marker Position (bp) |
|---|---|---|---|---|---|---|---|
| cQTL-1 | qBL-p-2 | Body Length | 7.70 | 11.94% | Tag_65007 | 12 | 24,980,556 |
| qBL-h-1 | Body Length | 5.14 | 8.50% | Tag_65171 | 12 | 25,680,671 | |
| qBH-p-3 | Body Height | 5.73 | 8.99% | Tag_65007 | 12 | 24,980,556 | |
| qBH-p-4 | Body Height | 5.48 | 8.62% | Tag_65221r | 12 | 25,754,793 | |
| qBH-h-2 | Body Height | 5.89 | 11.20% | Tag_65171 | 12 | 25,680,671 | |
| qBT-p-3 | Body Thickness | 3.46 | 5.93% | Tag_64958 | 12 | 24,883,274 | |
| qBT-h-2 | Body Thickness | 3.79 | 7.26% | Tag_65171 | 12 | 25,680,671 | |
| qBW-p-1 | Body Weight | 4.51 | 7.72% | Tag_64646r | 12 | 23,575,083 | |
| qBW-p-2 | Body Weight | 6.32 | 10.62% | Tag_64958 | 12 | 24,883,274 | |
| qBW-p-3 | Body Weight | 5.55 | 9.40% | Tag_65221r | 12 | 25,754,793 | |
| qBW-h-1 | Body Weight | 5.58 | 5.00% | Tag_65171 | 12 | 25,680,671 | |
| cQTL-2 | qBL-p-4 | Body Length | 3.54 | 5.55% | Tag_70882 | 13 | 25,639,005 |
| qBH-p-6 | Body Height | 5.80 | 9.30% | Tag_71188 | 13 | 26,978,713 | |
| cQTL-3 | qBL-p-7 | Body Length | 3.57 | 5.44% | Tag_198511 | 39 | 10,941,579 |
| qBW-p-5 | Body Weight | 3.78 | 5.48% | Tag_198454 | 39 | 10,593,376 |
| QTL | Chromosome | Gene Start | Gene End | Gene ID | Gene Name | Annotation |
|---|---|---|---|---|---|---|
| qBL-p-1 | 12 | 19552721 | 19559678 | HHLG12g0699 | ciks | Adapter protein CIKS |
| 19482413 | 19504238 | HHLG12g0695 | opa1 | Dynamin-like 120 kDa protein, mitochondrial | ||
| 19506396 | 19517988 | HHLG12g0696 | hrd1a | ERAD-associated E3 ubiquitin-protein ligase HRD1A | ||
| 19529810 | 19547739 | HHLG12g0698 | chd1l | Chromodomain-helicase-DNA-binding protein 1-like | ||
| 24858871 | 24869140 | HHLG12g0880 | syt1 | Synaptotagmin-1 | ||
| qBW-p-2 | 12 | 24873472 | 24874795 | HHLG12g0881 | manbl | Protein MANBAL |
| 24897900 | 24898634 | HHLG12g0883 | rn182 | E3 ubiquitin-protein ligase RNF182 | ||
| 24900978 | 24901894 | HHLG12g0884 | r9bp | Regulator of G-protein signaling 9-binding protein | ||
| 24905995 | 24909672 | HHLG12g0886 | tdif1 | Deoxynucleotidyltransferase terminal-interacting protein 1 | ||
| 24928567 | 24932818 | HHLG12g0888 | pltp | Phospholipid transfer protein | ||
| 24876144 | 24887937 | HHLG12g0882 | nfac2 | Nuclear factor of activated T-cells, cytoplasmic 2 | ||
| 24913041 | 24921314 | HHLG12g0887 | fcif1 | Phosphorylated CTD-interacting factor 1 | ||
| 24902429 | 24904315 | HHLG12g0885 | ube2c | Ubiquitin-conjugating enzyme E2 C | ||
| qBL-p-2 | 12 | 24928567 | 24932818 | HHLG12g0888 | pltp | Phospholipid transfer protein |
| qBH-p-5 | 13 | 28563605 | 28566253 | HHLG13g0819 | fis1 | Mitochondrial fission 1 protein |
| 28591609 | 28602139 | HHLG13g0821 | wap53 | Telomerase Cajal body protein 1 | ||
| 28570611 | 28584414 | HHLG13g0820 | perq1 | PERQ amino acid-rich with GYF domain-containing protein 1 |
| QTL | Chromosome | Gene Start | Gene End | Gene ID | Annotation |
|---|---|---|---|---|---|
| BL-PM-T1-2; BH-PM-T1-2; BH-PM-T2-2; BT-PM-T1-2; BW-PM-T1T2-2 | 12 | 25,771,196 | 25,808,027 | cbfa2t2 | Protein CBFA2T2 |
| 25,732,452 | 25,764,815 | neca1 | N-terminal EF-hand calcium-binding protein 1 |
Disclaimer/Publisher’s Note: The statements, opinions and data contained in all publications are solely those of the individual author(s) and contributor(s) and not of MDPI and/or the editor(s). MDPI and/or the editor(s) disclaim responsibility for any injury to people or property resulting from any ideas, methods, instructions or products referred to in the content. |
© 2023 by the authors. Licensee MDPI, Basel, Switzerland. This article is an open access article distributed under the terms and conditions of the Creative Commons Attribution (CC BY) license (https://creativecommons.org/licenses/by/4.0/).
Share and Cite
Chen, Y.; Huang, J.; Jin, Z.; Chen, J.; Zhang, M.; Yu, M.; Jiang, H.; Wang, L.; Qiao, Z. QTL Mapping of Growth Traits in Yellow River Carp (Cyprinus carpio haematopterus) at 5–17 Months after Hatching. Fishes 2023, 8, 79. https://doi.org/10.3390/fishes8020079
Chen Y, Huang J, Jin Z, Chen J, Zhang M, Yu M, Jiang H, Wang L, Qiao Z. QTL Mapping of Growth Traits in Yellow River Carp (Cyprinus carpio haematopterus) at 5–17 Months after Hatching. Fishes. 2023; 8(2):79. https://doi.org/10.3390/fishes8020079
Chicago/Turabian StyleChen, Yuhan, Jintai Huang, Zhan Jin, Junping Chen, Meng Zhang, Miao Yu, Hongxia Jiang, Lei Wang, and Zhigang Qiao. 2023. "QTL Mapping of Growth Traits in Yellow River Carp (Cyprinus carpio haematopterus) at 5–17 Months after Hatching" Fishes 8, no. 2: 79. https://doi.org/10.3390/fishes8020079
APA StyleChen, Y., Huang, J., Jin, Z., Chen, J., Zhang, M., Yu, M., Jiang, H., Wang, L., & Qiao, Z. (2023). QTL Mapping of Growth Traits in Yellow River Carp (Cyprinus carpio haematopterus) at 5–17 Months after Hatching. Fishes, 8(2), 79. https://doi.org/10.3390/fishes8020079