Abstract
Wood polymer composite (WPC), composed of polymer matrices reinforced with natural fibers, is increasingly used in structural and non-structural applications due to its sustainability and performance. Although teak and rice husk are common natural reinforcements, the use of oil palm empty fruit bunches (OPEFB) remains underexplored despite their abundance as agricultural waste. This study investigates the potential of OPEFB as an alternative reinforcement for recycled polyethylene-based WPC containing 20 wt% fiber and compares its morphology and performance with teak and rice husk. Compositional analysis shows that OPEFB exhibits lignin and cellulose contents as well as crystallinity comparable to teak, while exceeding rice husk in several structural parameters. These characteristics contribute to the highest tensile strength observed among the composites (37.45 MPa). Although its Shore D hardness is the lowest (58.8), the value remains within the acceptable range for construction applications. Combined with its favorable production costs, OPEFB emerges as a viable, resource-efficient alternative to conventional natural fibers, expanding the options for sustainable WPC development.
1. Introduction
Wood polymer composite (WPC) consists of plastic as a matrix phase, which provides toughness, along with dispersed wood or natural fibers that reinforce and improve strength and rigidity. WPC is known for being environmentally friendly, lightweight, high in strength, resistant to weathering, and thermal insulating [1]. Its growing adoption is reflected in the expanding market, which was valued at $7 billion in 2022 and is projected to reach $21.84 billion by 2032. Building and construction made up 73% of the total WPC revenue in 2022 [2]. These characteristics make WPC an attractive material for the construction industry, especially for applications like composite panels [1].
Polyethylene, polypropylene, and polyvinyl chloride are common resin materials used in WPC [3,4,5]. Additionally, WPC can incorporate recycled thermoplastics, such as recycled polyethylene (rPE), as the matrix. The usage of recycled plastic in WPC helps mitigate the environmental impact of plastic waste and lowers the demand for virgin plastics. Besides plastics, the selection of natural fibers in WPC varies and can be categorized based on fiber size, including long fibers, short fibers, and wood chips [6,7].
Recent studies have highlighted the growing potential of agricultural waste as sustainable fillers in polymer composites, demonstrating benefits such as enhanced thermal stability and reduced environmental impact [8,9]. A recent review further shows that residues such as wheat husk, rice husk, and hemp fiber can be effectively incorporated into polymer matrices, where their lignocellulosic structure contributes to improved thermal degradation resistance while simultaneously diverting biomass from environmentally harmful disposal routes [10]. Building on a broader trend, Indonesia has abundant natural resources that give significant opportunities to utilize its own biomass residue, including teak dust and rice husk as sustainable composite reinforcement.
Among these materials, oil palm empty fruit bunch (OPEFB) fiber has emerged as a particularly promising candidate due to its abundance and continuous generation as a byproduct of the palm oil industry. Indonesia produces large quantities of OPEFB waste, accounting for approximately 21% of the total fresh fruit bunch weight [11]. However, incinerating OPEFB waste contributes to greenhouse gas emissions and environmental harm [12]. Redirecting OPEFB into composite applications, therefore, not only aligns with global advances in agricultural-waste-based fillers but also supports national sustainability efforts by reducing waste, lowering emissions, and improving resource efficiency [13].
OPEFB fiber is a promising reinforcement material due to its high specific strength, low density, excellent thermal insulation, and strong renewability. Its mechanical strength exceeds that of other palm fibers, increasing its potential for industrial uses [14]. Additionally, the porous structure of OPEFB fiber allows for effective mechanical interlocking with matrix materials, enhancing composite performance [15]. These physical and mechanical properties match the fundamental requirements for reinforcing materials in WPC. OPEFB waste can be processed into high-value products for the wood-composite industry while also reducing environmental waste. This potential suggests that the Asia-Pacific region accounted for 31.2% of the total WPC market in 2022, highlighting the viability of OPEFB-based WPC as a competitive option in the Indonesian market [2].
However, despite these advantages, the competitiveness of OPEFB as a WPC reinforcement, particularly in comparison to fibers already established in the commercial market, remains underexplored. Rice husk and teak dust are widely used industrial fillers because their availability, preprocessing requirements, and processing behavior are already well understood across the WPC industry. In contrast, although OPEFB is equally abundant and inherently attractive due to its low cost and easy accessibility, its industrial-scale processing parameters and performance benchmarks have not been comprehensively evaluated. This lack of direct comparison creates uncertainty regarding whether OPEFB can match or exceed the practicality and cost-effectiveness of these conventional reinforcements. Therefore, a systematic technical and economic benchmarking study is still required to determine OPEFB’s feasibility as a market-ready alternative.
The processing of OPEFB into recycled plastic-based WPC offers a sustainable solution to tackle issues related to both OPEFB and plastic waste buildup. To support this initiative, this research investigates the potential of OPEFB fiber as a reinforcing material in WPC, comparing its performance with WPC reinforced by teak and rice husk fiber. The physical, chemical, and mechanical properties of these three fibers were thoroughly analyzed for their suitability in real-world applications. WPC samples were produced using recycled polyethylene (rPE) as a matrix, incorporating each of the three fiber types, and their mechanical properties were systematically assessed. This comparative analysis provides valuable insights into the strengths and limitations of each fiber as a WPC reinforcement, while also suggesting a potential waste management strategy for the palm oil industry.
2. Results and Discussion
2.1. Fiber Morphological Analysis
The SEM technique was carried out to examine the structure and morphology of the fibers. Along with the EDS technique, they helped in identifying the chemical element composition on the surface of the fibers. The results of SEM/EDS analysis are displayed in Figure 1.
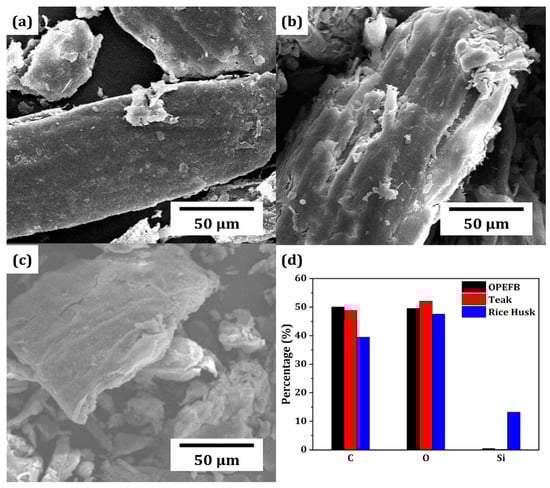
Figure 1.
Morphology images of (a) OPEFB, (b) teak, and (c) rice husk fibers, and (d) chemical composition of OPEFB, teak, and rice husk fibers.
As seen in Figure 1a–c, OPEFB and teak fibers consist of elongated structures, while rice husk fiber has a more rounded structure. The surfaces of teak and rice husk fibers also tend to be rougher than that of OPEFB fiber. In Figure 1d, the results of EDS analysis reveal that all three fibers contain carbon (C), oxygen (O), and silica (Si) elements. In OPEFB and teak fibers, the C and O content tends to be higher than the Si content. However, the Si content in rice husk fiber is much higher than that of OPEFB and teak fibers. The high Si content can affect the mechanical properties of the fiber, especially its hardness properties [16]. In turn, this can affect the hardness properties of the resulting WPC, as shown in the later section. C and Si content contribute similarly to the crystallinity of a polymer [17]. The results of XRD analysis, in the following few sections, show the effect of C and Si content on the crystallinity of the fibers.
2.2. Fiber Physical Properties
XRD analysis was carried out to determine the level of crystallinity of the three fibers, as it can affect the mechanical and thermal properties of the fibers. The analysis results show a diffraction pattern that depicts the crystalline and amorphous distribution of the fibers and provides insight into the crystal structure of the fibers. The crystallinity index of each fiber was calculated using the Segal method as shown in the following equation [18].
In this equation, Crl represents the crystallinity percentage of a cellulose-based material. I002 indicates the maximum intensity of the 002 lattice at 21.44° for OPEFB, 22.25° for teak, and 22.08° for rice husk. Iam is the diffraction intensity at 2θ, measured in the same units, at 17.31° for OPEFB, 18.16° for teak, and 17.87° for rice husk. Figure 2a,b show the results of the XRD analysis and the crystallinity percentages of the three fibers.
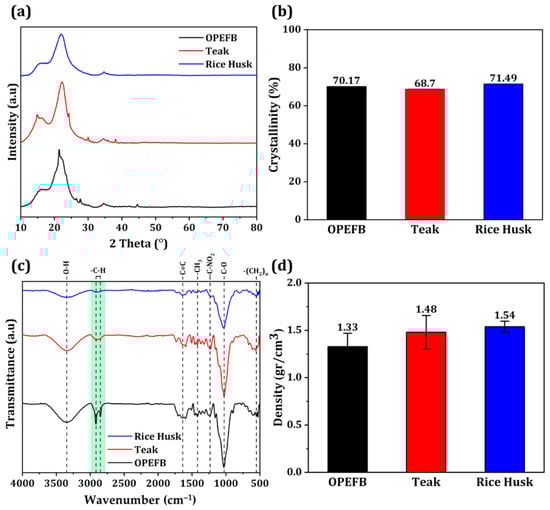
Figure 2.
(a) Overlay graphic of XRD and (b) crystallinity percentage of OPEFB, teak, and rice husk fibers, (c) Comparison of FTIR spectrum of OPEFB, teak, and rice husk fibers (the green shaded area highlights the C–H stretching vibration region), (d) Density of OPEFB, teak, and rice husk fibers.
In Figure 2a, two peaks are observed at around 18° and 22°, representing the amorphous and crystalline phases of lignocellulose materials. The intensity of these peaks was used in Equation (1) to calculate the crystallinity percentage, with the results shown as a bar graph in Figure 2b. The graph indicates that OPEFB exhibits a reasonably high level of crystallinity, surpassing that of teak fiber and approaching the level of rice husk fiber. The high silica content contributes to the elevated crystallinity in rice husk fiber. It is known that silica predominantly exists in a crystalline phase over the amorphous phase; therefore, increasing silica content in the fibers tends to raise crystallinity [19]. Crystallinity influences the strength and hardness of composite materials because crystalline regions consist of more orderly molecules, thereby enhancing the material’s strength and rigidity [20]. As mentioned earlier, the carbon (C) content also impacts polymer crystallinity [17]. Consequently, despite rice husk’s significantly higher Si content, its crystallinity was only marginally affected due to its low C content compared to that of OPEFB and teak fibers. Meanwhile, OPEFB fiber contains higher C and Si contents than teak, which results in a higher crystallinity.
Chemical composition analysis using the FTIR technique was performed to identify various functional groups in the fibers studied. Figure 2c depicts the functional groups in OPEFB, teak, and rice husk fibers. The FTIR spectra show the typical profile of lignocellulosic materials. All three samples display similar peaks at comparable wavenumbers. However, OPEFB fiber exhibits sharper peaks at 2800–2900 cm−1 compared to the other two fibers. These sharper peaks indicate a higher presence of -CH and -CH2 bonds, suggesting increased wax content in OPEFB fiber [21,22]. Most natural fibers, including those based on OPEFB, are hydrophilic due to cellulose and hemicellulose, which contain hydroxyl groups that attract water. Nonetheless, results reveal that OPEFB fiber has more wax on its surface layer. With more wax present, the fibers become more hydrophobic [23]. Greater hydrophobicity of the wood surface enhances interfacial compatibility with the polymer matrix, leading to stronger adhesion and improved mechanical properties [24,25].
In composite material production, information about density is essential for calculating volume and estimating material weight. These measurements also enhance understanding of the material’s composition and physical properties. The results of the density test on the three fibers are shown in Figure 2d. From the graph, it is clear that rice husk fiber has the highest density, due to its denser structure and thicker cell walls [26]. Additionally, rice husk fiber tends to have a higher silica content than OPEFB and teak fibers, as discussed in the results of the TGA and XRD tests. However, for future construction applications, lower-density fibers like OPEFB will be increasingly crucial for producing lighter materials [27,28].
However, several studies reported that additional mechanisms are needed to increase interfacial adhesion between materials with different water affinities [29]. Several mechanisms, including mechanical, chemical, and physicochemical reactions, as well as additives, have been studied and incorporated into hydrophilic-hydrophobic composites. Sianturi et al. used natural rubber-starch (NR-St) hybrid coupling agent to increase the compatibility between natural rubber and OPEFB [30]. The coupling agent improved the tensile strength and stiffness of the rubber composite, demonstrating the enhanced compatibility between the rubber matrix and the OPEFB filler. Another approach was taken by Nugraha et al., who employed atmospheric cold plasma and thermal oxidation to increase the compatibility of multilayer plastic waste (MLP) with bitumen, producing a polymer-modified bitumen (PMB) [31]. Both studies conclude that subsequent physicochemical treatments induce a compatibilizing effect on materials with different water affinities. Nonetheless, this study shows that OPEFB itself has sufficient wax content to enhance the properties of WPC compared to conventional organic fillers. Even so, further research on pre-treating OPEFB could deepen the understanding of how OPEFB behaves as a WPC filler.
2.3. Fiber Thermal Properties
The TGA technique was carried out to evaluate the thermal stability and decomposition of the tested fibers, aiming to describe how their mass changes as temperature increases. This analysis is crucial for observing the degradation stages that occur in the fibers with rising temperature. By understanding the thermal degradation profile of the tested material, this analysis can help identify the point at which the material begins to decompose, reducing the likelihood of product defects during manufacturing and determining the thermal stability of the WPC. The results of the TGA for the three fibers are presented in Figure 3.
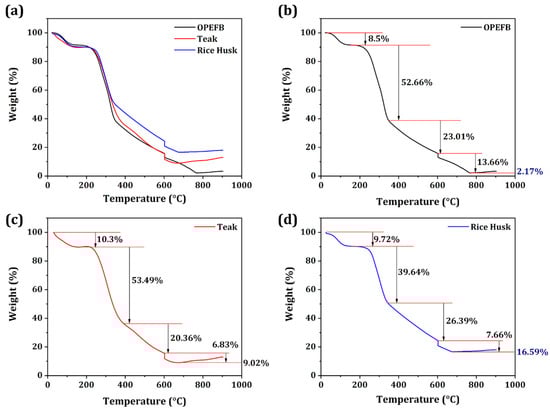
Figure 3.
TGA curves of (a) all fibers, (b) OPEFB, (c) teak, and (d) rice husk fibers.
The degradation and decomposition of each fiber involved four stages. Stage 1 involved the initial weight loss below 170 °C, marked by water loss and wax removal, signaling the start of fiber mass reduction [32,33]. During this stage, the -OH functional group, along with moisture and the C-H functional group with wax, was removed.
Stage 2, which occurs at 170–400 °C, is marked by the degradation of hemicellulose and several types of cellulose [34,35,36]. Based on the results from this stage, it can be concluded that OPEFB and teak fibers exhibit higher contents of hemicellulose and cellulose, indicating that the wood is more complicated and stronger [37,38].
Stage 3, which occurs between 400 and 600 °C, is marked by the partial degradation of extra cellulose and lignin in the fibers [39]. The weight loss comparison during this stage shows similar lignin content across the three samples, with rice husk fiber having the highest lignin level. This result indicates that softer woods tend to contain more lignin [40].
The final stage, which takes place at 600–900 °C, is marked by the carbonization process and complete decomposition. The C-H groups will entirely vanish due to the total breakdown of the remaining hydrocarbons. The remaining carbon from the earlier stage will be oxidized into CO2 [41]. Additionally, as confirmed by TGA, all three fibers leave residues at 900 °C. Figure 3b–d shows that rice husk fiber has more inorganic residue than teak and OPEFB fibers. This is due to the high silica content in rice husk fiber [42,43]. This finding indicates that the inherent properties of the wood fiber may affect the characteristics of the WPC.
2.4. Wood Polymer Composite Mechanical Properties
Scanning electron microscope images of the WPC samples are displayed in Figure 4 below. Every sample exhibited fine powders with sizes not exceeding the 75-micron standard of a 200-mesh sieve. The lower-magnification images indicate that the samples exhibit brittle fracture characteristics of composites [44]. A closer look shows a big void in the WPC-Teak and WPC-Rice Husk samples. These voids can be attributed to weak bonding between the matrix and the filler, as reported by prior studies [45,46,47]. This finding can be linked to lower hydrophobic group content on teak and rice husk, as shown by FTIR analysis. These voids may degrade the material’s mechanical properties by disrupting the matrix-filler connection, leading to reduced stress distribution and, consequently, lower mechanical retention [48,49].
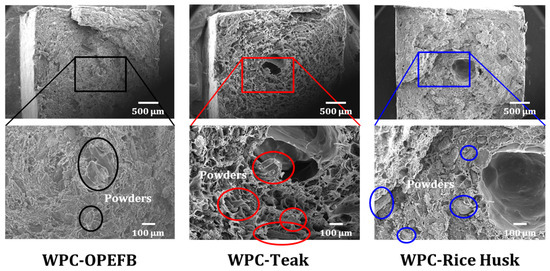
Figure 4.
Scanning electron micrograph of WPC samples.
Figure 5 shows the tensile properties of the three samples, with Figure 5a displaying the stress–strain diagram of the WPC samples. From the detailed values in Figure 5b,c, WPC-Teak exhibited the lowest maximum strength and the least strain at break. In addition, WPC-Rice husk possessed moderate tensile strength with the longest strain at break, while WPC-OPEFB possessed the highest strength with intermediate strain at break. These lead to similar elastic modulus values, as shown in Figure 5d; WPC-Teak has the highest elastic modulus, followed by WPC-OPEFB and WPC-Rice husk.
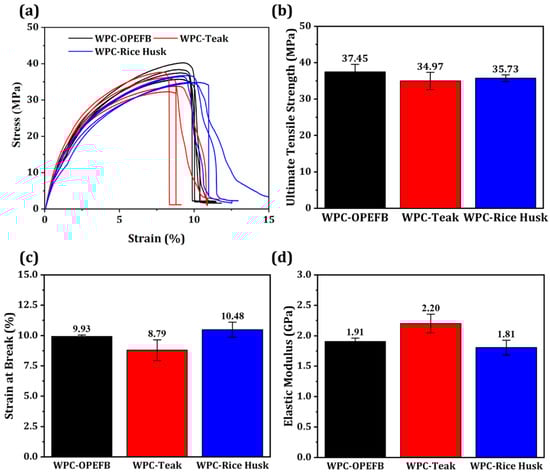
Figure 5.
(a) Graph of stress vs. strain, (b) Ultimate tensile strength, (c) Strain at break, and (d) Elastic modulus of WPC made from OPEFB, teak, and rice husk.
The detailed tensile strength values are shown in Figure 5b, which shows that the WPCs displayed nearly similar tensile strengths. These values fall well within, and in some cases exceed, previously reported ranges for natural fiber-reinforced WPC. Wood fiber WPC typically shows tensile strengths around 18–24 MPa, depending on fiber species and processing parameters, while bamboo-based WPCs exhibited significantly higher values ranging from 28 to 40 MPa due to their high aspect ratio and cellulose content [50,51].
OPEFB fiber-based WPC shows the highest tensile strength compared to teak fiber-based and rice husk fiber-based WPCs. As revealed in FTIR analysis, OPEFB fiber-based WPC contains a more organized fiber structure and has higher compatibility with polymer matrices due to its waxier surface. This improved compatibility led to better stress transfer and higher strength, leading to enhanced mechanical properties [43]. Surface waxes are non-polar substances that mask hydroxyl groups on the fiber surface, thereby reducing surface polarity and increasing hydrophobicity. A more hydrophobic fiber surface is better matched to hydrophobic matrices, allowing improved interfacial adhesion [52]. Additionally, because of its crystallinity percentage being similar to that of rice husk fiber, these properties contribute to OPEFB fiber-based WPC having slightly better tensile strength than that of teak fiber-based and rice husk fiber-based WPCs. Furthermore, TGA results also indicate that cellulose content in OPEFB fiber-based WPC is the highest, which enhances overall strength in the wood and WPC [37,38]. In conclusion, the high strength and high strain of WPC-OPEFB and WPC-Rice husk lead to a lower elastic modulus compared to WPC-Teak.
As seen in Figure 6, WPC-Rice husk shows the highest hardness value compared to the two other fiber-based WPCs. This is due to the high silica content in rice husk fiber, as revealed by the EDS test results [16]. Meanwhile, the hardness value of WPC-OPEFB, although it was the lowest, is still close to that of WPC-Teak and WPC-Rice husk. The hardness standard for WPC in construction applications, according to ASTM D143, is 500 kgf/cm2, which equals 50–60 on the Shore D hardness scale. Therefore, despite having the lowest hardness value, WPC-OPEFB is still considered suitable as a reinforcing material for construction and engineering purposes.
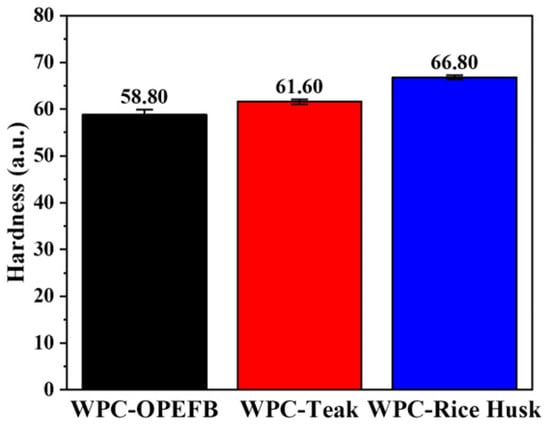
Figure 6.
Hardness of WPC made from OPEFB, teak, and rice husk.
2.5. Economic Feasibility Analysis of WPC
The economic feasibility analysis was conducted assuming that the WPC processing facility is located in Tangerang, Indonesia, and was based on prevailing market values in Indonesia. After establishing that OPEFB waste can replace teak and rice husk as reinforcement for WPC, a comparative economic analysis of these three fibers was performed. Table 1 lists the WPC fabrication prices for these fibers. Due to the high oil palm production volume in Indonesia, there is a strong likelihood of obtaining OPEFB as waste bunches without pre-treatment, resulting in a low price [53]. Similarly, teak fibers are generally collected as sawdust, while rice husk requires more pre-treatment before it can be processed into fibers.

Table 1.
Production cost of 1 ton of WPC using varied natural fibers.
The cost comparison in Table 1 was calculated based on the following assumptions: The monthly labor rate was set at USD 298.38 per operator (equivalent to IDR 4,760,289), based on the 2024 minimum wage (UMK) of Kota Tangerang as stipulated by the Decree of the Governor of Banten No. 561/Kep.293-Huk/2023 regarding Regency/City Minimum Wages in Banten Province for the year 2024 [54]. The electricity tariff was assumed to be USD 0.0649 per kWh (equivalent to IDR 1035.78 per kWh), referring to the non-subsidized business/industrial electricity tariff category for large-capacity customers (>200 kVA), specifically under the business tariff group (B3/P-2/TR) including peak and off-peak usage periods, as regulated by the Regulation of the Minister of Energy and Mineral Resources of the Republic of Indonesia No. 7 of 2024 on electricity tariffs provided by PT Perusahaan Listrik Negara (Persero) [55]. The additive cost of USD 1821.57 per ton represents a commercial multi-component additive system composed of several functional additives (e.g., coupling agents, process stabilizers, and processing aids) sourced from multiple domestic and international suppliers. Although the detailed formulation cannot be disclosed due to proprietary and confidential considerations, the value reflects current market prices of industrial-grade additive packages used in thermoplastic composite manufacturing in Indonesia. Transportation assumptions were based on realistic industrial logistics, with biomass supplies sourced from Bogor (OPEFB, ~61 km), Jakarta (teak, ~35 km), and Bekasi Regency (rice husk, ~58 km) to the processing facility in Tangerang, Indonesia. The WPC composition was fixed at 80 wt% rPE and 20 wt% fiber for all formulations to ensure a fair and consistent cost comparison among fiber types. Since the OPEFB was obtained as waste bunches, an additional crushing process is necessary to produce the desired fiber. Therefore, an extra crusher, as an additional machine, can increase both labor and electricity costs.
Based on the final calculation, it was revealed that rice husk fiber-based WPC is the most expensive overall, while OPEFB fiber-based WPC requires the highest labor, machine, and overhead costs. The total production cost of rPE/teak WPC was found to be the lowest at USD 2733.57 per ton. Next is rPE/OPEFB WPC at USD 2753.18 per ton, followed by rPE/rice husk at USD 2810.16 per ton.
In the case of OPEFB-based WPC, the higher labor and electricity costs are associated with the crushing and size-reduction steps needed to convert raw empty fruit bunches into usable fibers, a process that is not required for teak or rice husk. However, this preprocessing stage also produces versatile biomass particles that are not limited to WPC applications. The processed OPEFB can be further utilized in other value-added products, such as bio-based panels, molded composites, and biomass-derived materials, allowing the incremental cost of size reduction to be partially offset within a multi-product manufacturing system.
Therefore, despite its relatively higher processing costs, OPEFB demonstrates strong economic competitiveness and emerges as a promising alternative to rice husk as reinforcement in natural fiber-based rPE WPC. This conclusion is further strengthened by the higher tensile strength of OPEFB fibers, which enhances their technical suitability for WPC applications.
3. Materials and Methods
3.1. Materials
Recycled polyethylene (rPE) pellets were sourced from PT Polymindo Permata, Tangerang, Indonesia. The rPE exhibited a melt flow index (MFI) of 1.554 g/10 min at 190 °C/5 kg, density of 0.761 gr/cm3, melting temperature of 131.1 °C, and was classified as high-density polyethylene (HDPE). The pellets were used as received without further purification or chemical treatment. Oil palm empty fruit bunches (OPEFB) were obtained from PT Perkebunan Nusantara I Cikasungka, Bogor, Indonesia, chopped into fibers, washed, and naturally sun-dried for approximately 24 h to reduce the initial moisture content. The partially dried fibers were then shredded and sieved through a 120-mesh screen to produce fine OPEFB powder, followed by oven-drying at 80 °C for 24 h to ensure a moisture content below 6%, as confirmed using a moisture analyzer. Teak powder and rice husk were sourced from local wood and agro-industrial processing facilities in Java Island, Indonesia, in pre-processed fine particle form. Both materials were further sieved to pass a 120-mesh screen and oven-dried at 80 °C for 24 h to achieve a moisture content below 6% prior to compounding.
3.2. Fiber Characterizations
The physical, chemical, structural, and mechanical properties of the three fibers were analyzed through various tests. First, the shape and surface of the fibers were characterized using Scanning Electron Microscopy (JEOL, Tokyo, Japan). The observation was carried out at 500× magnification with an 11.0 mm working distance. Additionally, Energy Dispersive Spectroscopy (EDS) measurement was performed afterward, following the morphological inspection, to identify the different elements present in the samples, especially C, O, and Si.
Fourier Transform Infrared Spectroscopy (FTIR) was conducted using the FTIR Bruker Alpha II (Bruker Optics GmbH, Ettlingen, Germany) to identify the functional groups in the samples. The samples were placed into the FTIR instrument before being exposed to infrared light. They absorb the light, and the spectrum was then measured by recording the intensity of transmitted light at different wavelengths. The data were presented as FTIR spectra of transmittance versus wavenumber (cm−1).
The next test, X-ray Diffraction (XRD), was performed using the XRD PANalytical AERIS equipment (Malvern Panalytical, Almelo, The Netherland) based on ATM D695 to analyze the crystallinity of the samples. The instrument records the diffraction pattern that occurs when X-rays interact with the crystal structure of the samples. The intersecting X-rays help determine the crystal’s orientation, phase, and the spacing between the layers in the samples.
Thermogravimetric Analysis (TGA) was carried out using TA Trios V5 (TA Instruments, New Castle, DE, USA) based on ASTM E1131 to determine the degradation of the samples. The TGA instrument measured the weight of the samples when heated at a controlled level under nitrogen gas. Weight loss per temperature was used to display the measurement data. Lastly, a density test using the pycnometer method was carried out based on ASTM D792. The following adjustment was set: room humidity of 46% RH, room temperature of 22 °C, and ethanol temperature of 23–25 °C.
3.3. Wood Polymer Composite Compounding
The raw materials, consisting of rPE and fiber powder, were mixed and subjected to the same compounding for all fiber types (OPEFB, teak, and rice husk). For each formulation, the fiber content was fixed at 20 wt%. The mixture was compounded using a PolyLab OS PTW10 twin-screw extruder (Thermo Scientific, Dreieich, Germany) at 20 rpm, which has 10 heating zones. Zone 1 is closest to the feeder, with the subsequent zones progressively nearer to the die of the extruder. The temperature settings used in the compounding process are shown in Figure 7. During extrusion, the measured torque was approximately 45–60 Nm, with the screw speed maintained at 20 rpm. The melt pressure near the die (p50 sensor position) reached 23.14 bar, indicating stable melt flow under the applied processing conditions. After passing through the die, the samples were allowed to cool naturally. Once they cooled enough for handling, they were cut with a pelletizer to produce WPC pellets.
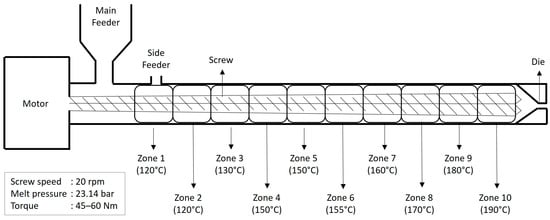
Figure 7.
Twin-screw extruder heating zone used in the compounding.
3.4. Wood Polymer Composite Characterization
A tensile test was performed to determine the tensile strength of the samples. First, the pellets were dried in an oven for 1–2 h at 100 °C. Next, the samples were prepared according to ASTM D638. The specimens for testing were produced using an injection method with a Haake Minijet Pro model mini-injection molding machine (Waltham, MA, USA). The following settings were applied: cylinder temperature of 180 °C, mold temperature of 40 °C, and pressure of 750 bar. The type IV specimens were prepared, and five specimens were tested for each formulation, as shown in Figure 8.
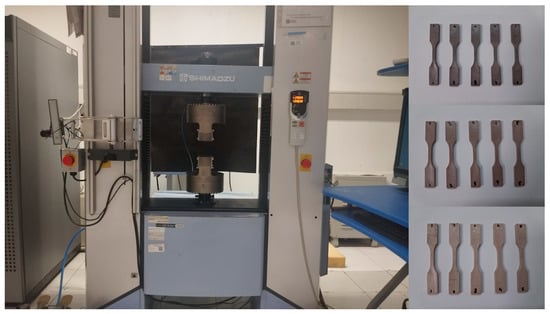
Figure 8.
Universal Tensile Machine used for tensile testing and the specimens of tensile test of each WPC-OPEFB, WPC-Teak, and WPC-Rice Husk.
Figure 8 also shows the tool used in this tensile test was the Universal Tensile Machine Shimadzu AG-X Plus 50 kN (Kyoto, Japan). The specimens were clamped on both ends, with one end fixed and the other end pulled at a controlled rate. The level of deformation will be automatically recorded so that the data can be instantly transformed into a stress vs. strain graph.
The hardness test for each specimen was performed using a Shore D durometer (Giuliani Tecnologie S.n.c, Torino, Italy) (Figure 9) at a room temperature of 23 ± 2 °C and a relative humidity of 50 ± 5%. For each formulation, one plate specimen was prepared and tested. Five indentations were made at different locations on the same plate, with an indentation time of 1 s. The reported hardness value represents the average of the five measurements. Before testing, the pellets were transformed into a 100 × 100 × 4 mm plate using a hot press. The hot press machine used was a YASUDA mini hot press (Nishinomiya, Japan). The following settings were applied: a load of 5 tons, a mold temperature of 180 °C, a pressure of 30 MPa, and a continuous pressing time of 15 min. Finally, the specimens were left to cool down naturally.
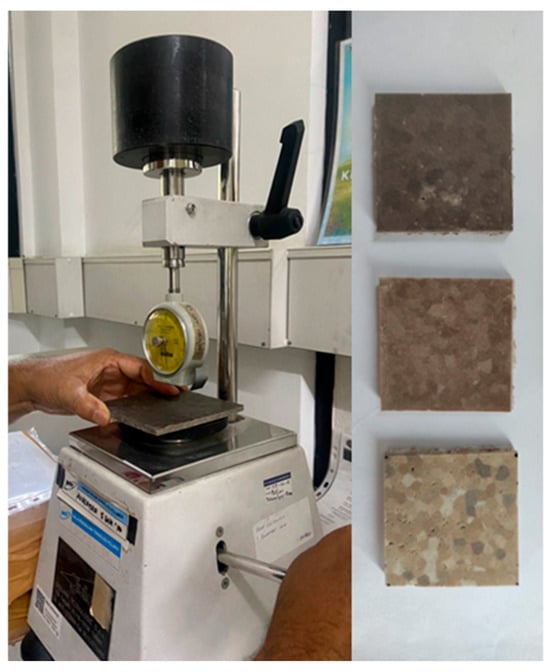
Figure 9.
Shore D durometer used for hardness testing and the specimens of hardness test of each WPC-OPEFB, WPC-Teak, and WPC-Rice Husk.
4. Conclusions
This study evaluates the mechanical performance, economic feasibility, and overall potential of OPEFB fiber-based WPC as a reinforcing material in WPC. The analysis began by examining the properties of fibers. These fiber-level attributes were then correlated with the WPC properties, allowing a clear interpretation of how differences in natural fiber translated into variations in mechanical properties.
The FTIR spectra show that OPEFB fiber has higher wax content on its surface, indicated by sharper peaks at 2800–2900 cm−1 representing -CH and -CH2 bonds. The results of TGA show higher levels of hemicellulose and cellulose in OPEFB and teak fibers, while rice husk fiber contains more residues. This is also due to its slightly higher crystallinity compared to OPEFB and teak fibers, as confirmed by EDS analysis, which indicates that rice husk fiber has a significantly higher Si content than the other two fibers. Additionally, the density of OPEFB fiber was found to be the lowest, along with a structure that is thinner and longer than that of the other fibers.
The fiber properties were effectively transferred to the WPC properties, with analysis results showing that OPEFB fiber-based WPC exhibits the highest tensile strength, at 37.45 MPa, compared to WPCs based on teak fiber and rice husk fiber. It also has a hardness value of 58.8, which is nearly the same as that of the other two fiber-based WPCs. Furthermore, a higher wax content in OPEFB improves the interfacial adhesion between OPEFB and rPE, leading to improved stress transfer and increased strength. Although crystallinity affects strength and hardness, OPEFB fiber-based WPC still shows a higher hardness value than the standard. Therefore, OPEFB fiber is considered a viable replacement for traditional fibers in WPC manufacturing.
Furthermore, the economic assessment indicates that OPEFB-based WPC is highly competitive compared to teak dust and rice husk, primarily due to its abundant availability and minimal preprocessing requirements. OPEFB offers lower fiber procurement costs and reduced energy consumption during size reduction and compounding, owing to its lower density and easier processability. These factors collectively reduce the estimated production cost by approximately 14–18%, demonstrating that OPEFB is a financially viable and scalable fiber source for WPC manufacturing, especially for large-volume industrial applications.
When considering both mechanical and economic criteria, OPEFB-based WPC emerges as the most promising reinforcement material among those studied. The combination of performance, cost efficiency, and alignment with waste valorization principles underscores its suitability as a viable alternative to traditional fibers. The findings also highlight promising research pathways, including modification of fiber, the optimization of fiber–matrix formulation, and evaluation for long-term durability. These opportunities strengthen the outlook for developing next-generation WPCs derived from agricultural residues, supporting circular economy initiatives and expanding the potential applications of sustainable composite materials.
In addition, several practical considerations must be addressed to enable large-scale adoption. One key challenge is the pulverization of OPEFB, which often requires specialized equipment and can become a bottleneck in production. This situation creates a clear opportunity for establishing dedicated fiber-processing or pulverization facilities, ensuring consistent quality and supply for downstream composite manufacturers. However, for such facilities to be economically viable, OPEFB powder must have a sufficiently broad market, not limited to WPC applications alone. Given the material’s versatility, there is considerable potential to develop additional derivative products, suuch as bio-fillers for bioplastics, reinforcement for polymer blends, particleboard substitutes, insulation materials, or bio-based functional additives—which would strengthen the demand ecosystem and ensure stable offtake.
By addressing these technical and market-readiness considerations, OPEFB can progress beyond feasibility and move toward full industrial integration as a renewable, scalable resource for multiple material sectors.
Author Contributions
Conceptualization, M.C. and A.F.N.; methodology, M.C., Y.F., F.D. and A.F.N.; validation, S.M.M., A.R., Z.Z. and A.F.N.; formal analysis, S.M.M., M.G., A.R., Z.Z. and M.H.A.A.; investigation, S.M.M., M.G., Y.F., F.D., A.R., Z.Z. and M.H.A.A.; resources, M.C., M.G., Y.F., F.D., A.R. and Z.Z.; data curation, S.M.M. and M.H.A.A.; writing—original draft preparation, S.M.M., and M.H.A.A.; writing—review and editing, M.C., A.I.P. and A.F.N.; visualization, S.M.M. and M.H.A.A.; supervision, M.C., A.I.P. and A.F.N.; project administration, A.F.N.; funding acquisition, A.F.N. All authors have read and agreed to the published version of the manuscript.
Funding
This study was supported by funding from the 2023 Palm Oil Research Grant, a program from the Oil Palm Plantation Fund Management Agency No. PRJ-72/DPKS/2023.
Data Availability Statement
The raw data supporting the conclusions of this article will be made available by the authors on request.
Acknowledgments
The authors would like to thank the National Research and Innovation Agency for providing the facilities for compounding and testing, and PT Polymindo Permata for providing the materials.
Conflicts of Interest
The authors declare no conflicts of interest.
Abbreviations
The following abbreviations are used in this manuscript:
| ASTM | American Society for Testing and Materials |
| Crl | Crystallinity Index |
| EDS | Energy Disperse Spectroscopy |
| FTIR | Fourier Transform Infrared Spectroscopy |
| OPEFB | Oil Palm Empty Fruit Bunch |
| rPE | Recycled Polyethylene |
| SEM | Scanning Electron Microscopy |
| TGA | Thermogravimetric Analysis |
| WPC | Wood Polymer Composite |
| XRD | X-ray Diffraction |
References
- Zuhri, M.Y.M.; Sapuan, S.M.; Ismail, N. Oil Palm Fibre Reinforced Polymer Composites: A Review. Prog. Rubber Plast. Recycl. Technol. 2009, 25, 233–246. [Google Scholar] [CrossRef]
- Presedence Research Wood Plastic Composite Market Size, Share, and Trends. Available online: https://www.precedenceresearch.com/wood-plastic-composite-market (accessed on 13 October 2025).
- Cosnita, M.; Cazan, C.; Pop, M.A.; Cristea, D. Aging Resistance under Short Time Ultraviolet (UV) Radiations of Polymer Wood Composites Entirely Based on Wastes. Environ. Technol. Innov. 2023, 31, 103208. [Google Scholar] [CrossRef]
- Pashazadeh, S.; Ghanbari, R.; Bek, M.; Aulova, A.; Moberg, T.; Brolin, A.; Kádár, R. Mapping Surface Defects in Highly-Filled Wood Fiber Polymer Composite Extrusion from Inline Spectral Analysis. Compos. Sci. Technol. 2023, 242, 110133. [Google Scholar] [CrossRef]
- Ayana, K.D.; De Angelis, M.; Schmidt, G.; Krause, A.; Ali, A.Y. Valorization of Potential Post-Consumer Polyethylene (PE) Plastics Waste and Ethiopian Indigenous Highland Bamboo (EHB) for Wood Plastic Composite (WPC): Experimental Evaluation and Characterization. Fibers 2022, 10, 85. [Google Scholar] [CrossRef]
- Rohit, K.; Dixit, S. A Review—Future Aspect of Natural Fiber Reinforced Composite. Polym. Renew. Resour. 2016, 7, 43–59. [Google Scholar] [CrossRef]
- Zhang, W.; Yao, X.; Khanal, S.; Xu, S. A Novel Surface Treatment for Bamboo Flour and Its Effect on the Dimensional Stability and Mechanical Properties of High Density Polyethylene/Bamboo Flour Composites. Constr. Build. Mater. 2018, 186, 1220–1227. [Google Scholar] [CrossRef]
- Zhiltsova, T.; Campos, J.; Costa, A.; Oliveira, M.S.A. Sustainable Polypropylene-Based Composites with Agro-Waste Fillers: Thermal, Morphological, Mechanical Properties and Dimensional Stability. Materials 2024, 17, 696. [Google Scholar] [CrossRef]
- Visco, A.; Bardella, N.; Scolaro, C.; Belhamdi, H.; Brahimi, S.; Gatto, V.; Samiolo, R.; Beghetto, V. Reuse of Beer Spent Grain for the Industrial Production of Biodegradable Bio-Composites. Ind. Crops Prod. 2025, 235, 121684. [Google Scholar] [CrossRef]
- Hiremath, V.S.; Reddy, D.M.; Reddy Mutra, R.; Sanjeev, A.; Dhilipkumar, T.; Naveen, J. Thermal Degradation and Fire Retardant Behaviour of Natural Fibre Reinforced Polymeric Composites- A Comprehensive Review. J. Mater. Res. Technol. 2024, 30, 4053–4063. [Google Scholar] [CrossRef]
- Badan Pengelola Dana Perkebunan Kelapa Sawit Potensi Limbah Kelapa Sawit Indonesia. Available online: https://www.bpdp.or.id/Potensi-Limbah-Kelapa-Sawit-Indonesia (accessed on 10 February 2025).
- He, Z.; Zhu, X.; Wang, J.; Mu, M.; Wang, Y. Comparison of CO2 Emissions from OPC and Recycled Cement Production. Constr. Build. Mater. 2019, 211, 965–973. [Google Scholar] [CrossRef]
- Rama Rao, P.; Ramakrishna, G. Oil Palm Empty Fruit Bunch Fiber: Surface Morphology, Treatment, and Suitability as Reinforcement in Cement Composites- A State of the Art Review. Clean. Mater. 2022, 6, 100144. [Google Scholar] [CrossRef]
- Khalili, P.; Tshai, K.Y.; Kong, I. Comparative Thermal and Physical Investigation of Chemically Treated and Untreated Oil Palm EFB Fiber. Mater. Today Proc. 2018, 5, 3185–3192. [Google Scholar] [CrossRef]
- Mohanty, A.K.; Misra, M.; Drzal, L.T. (Eds.) Natural Fibers, Biopolymers, and Biocomposites, 1st ed.; CRC Press: Boca Raton, FL, USA, 2005; ISBN 978-0-203-50820-6. [Google Scholar]
- Valášek, P.; Ruggiero, A.; Müller, M. Experimental Description of Strength and Tribological Characteristic of EFB Oil Palm Fibres/Epoxy Composites with Technologically Undemanding Preparation. Compos. Part B Eng. 2017, 122, 79–88. [Google Scholar] [CrossRef]
- Patel, R.V.; Yadav, A.; Winczek, J. Physical, Mechanical, and Thermal Properties of Natural Fiber-Reinforced Epoxy Composites for Construction and Automotive Applications. Appl. Sci. 2023, 13, 5126. [Google Scholar] [CrossRef]
- Segal, L.; Creely, J.J.; Martin, A.E.; Conrad, C.M. An Empirical Method for Estimating the Degree of Crystallinity of Native Cellulose Using the X-Ray Diffractometer. Text. Res. J. 1959, 29, 786–794. [Google Scholar] [CrossRef]
- Wei, Z.; Smith, A.T.; Tait, W.R.T.; Liu, J.; Ding, H.; Wang, H.; Wang, W.; Sun, L. Lignocellulose Aerogel and Amorphous Silica Nanoparticles from Rice Husks. J. Leather Sci. Eng. 2021, 3, 2. [Google Scholar] [CrossRef]
- Wang, S.; Wang, T.; Zhang, S.; Dong, Z.; Chevali, V.S.; Yang, Y.; Wang, G.; Wang, H. Enhancing Fiber-Matrix Interface in Carbon Fiber/Poly Ether Ether Ketone (CF/PEEK) Composites by Carbon Nanotube Reinforcement of Crystalline PEEK Sizing. Compos. Part B Eng. 2023, 251, 110470. [Google Scholar] [CrossRef]
- Brahmakumar, M.; Pavithran, C.; Pillai, R. Coconut Fibre Reinforced Polyethylene Composites: Effect of Natural Waxy Surface Layer of the Fibre on Fibre/Matrix Interfacial Bonding and Strength of Composites. Compos. Sci. Technol. 2005, 65, 563–569. [Google Scholar] [CrossRef]
- Tan, C.; Ahmad, I.; Heng, M. Characterization of Polyester Composites from Recycled Polyethylene Terephthalate Reinforced with Empty Fruit Bunch Fibers. Mater. Des. 2011, 32, 4493–4501. [Google Scholar] [CrossRef]
- Paulraj Gundupalli, M.; Cheng, Y.-S.; Chuetor, S.; Bhattacharyya, D.; Sriariyanun, M. Effect of Dewaxing on Saccharification and Ethanol Production from Different Lignocellulosic Biomass. Bioresour. Technol. 2021, 339, 125596. [Google Scholar] [CrossRef]
- Guo, D.; Shen, X.; Fu, F.; Yang, S.; Li, G.; Chu, F. Improving Physical Properties of Wood–Polymer Composites by Building Stable Interface Structure between Swelled Cell Walls and Hydrophobic Polymer. Wood Sci. Technol. 2021, 55, 1401–1417. [Google Scholar] [CrossRef]
- Ramesh, M.; Rajeshkumar, L.; Sasikala, G.; Balaji, D.; Saravanakumar, A.; Bhuvaneswari, V.; Bhoopathi, R. A Critical Review on Wood-Based Polymer Composites: Processing, Properties, and Prospects. Polymers 2022, 14, 589. [Google Scholar] [CrossRef] [PubMed]
- Aramwit, P.; Daniel Chin Vui Sheng, D.; Krishna Moorthy, G.; Guna, V.; Reddy, N. Rice Husk and Coir Fibers as Sustainable and Green Reinforcements for High Performance Gypsum Composites. Constr. Build. Mater. 2023, 393, 132065. [Google Scholar] [CrossRef]
- Saini, K.; Matsagar, V.A.; Kodur, V.R. Recent Advances in the Use of Natural Fibers in Civil Engineering Structures. Constr. Build. Mater. 2024, 411, 134364. [Google Scholar] [CrossRef]
- Silva, G.; Kim, S.; Aguilar, R.; Nakamatsu, J. Natural Fibers as Reinforcement Additives for Geopolymers—A Review of Potential Eco-Friendly Applications to the Construction Industry. Sustain. Mater. Technol. 2020, 23, e00132. [Google Scholar] [CrossRef]
- Liu, L.; Yuan, Z.; Fan, X.; Pan, C.; Li, X. A Review of Interfacial Bonding Mechanism of Bamboo Fiber Reinforced Polymer Composites. Cellulose 2022, 29, 83–100. [Google Scholar] [CrossRef]
- Sianturi, K.Y.; Nugraha, A.F.; Kristaura, B.; Chalid, M. Enhancing Compatibility and Mechanical Properties of Natural Rubber Composites. J. Mater. Explor. Find. 2023, 2, 17–23. [Google Scholar] [CrossRef]
- Nugraha, A.F.; Gaol, C.S.A.L.; Chalid, M.; Akbar, G.M.H.H.; Aqoma, H. Enhancing the Compatibility of Low-Value Multilayer Plastic Waste in Bitumen Mixtures Using Atmospheric Cold Plasma and Thermal Oxidation. Adv. Manuf. Polym. Compos. Sci. 2024, 10, 2375929. [Google Scholar] [CrossRef]
- Apaydın Varol, E.; Mutlu, Ü. TGA-FTIR Analysis of Biomass Samples Based on the Thermal Decomposition Behavior of Hemicellulose, Cellulose, and Lignin. Energies 2023, 16, 3674. [Google Scholar] [CrossRef]
- Elmoudnia, H.; Faria, P.; Jalal, R.; Waqif, M.; Saadi, L. Effectiveness of Alkaline and Hydrothermal Treatments on Cellulosic Fibers Extracted from the Moroccan Pennisetum alopecuroides Plant: Chemical and Morphological Characterization. Carbohydr. Polym. Technol. Appl. 2023, 5, 100276. [Google Scholar] [CrossRef]
- Díez, D.; Urueña, A.; Piñero, R.; Barrio, A.; Tamminen, T. Determination of Hemicellulose, Cellulose, and Lignin Content in Different Types of Biomasses by Thermogravimetric Analysis and Pseudocomponent Kinetic Model (TGA-PKM Method). Processes 2020, 8, 1048. [Google Scholar] [CrossRef]
- Balaji, A.N.; Nagarajan, K.J. Characterization of Alkali Treated and Untreated New Cellulosic Fiber from Saharan Aloe Vera Cactus Leaves. Carbohydr. Polym. 2017, 174, 200–208. [Google Scholar] [CrossRef]
- Belouadah, Z.; Ati, A.; Rokbi, M. Characterization of New Natural Cellulosic Fiber from Lygeum spartum L. Carbohydr. Polym. 2015, 134, 429–437. [Google Scholar] [CrossRef]
- Tarasov, D.; Leitch, M.; Fatehi, P. Lignin–Carbohydrate Complexes: Properties, Applications, Analyses, and Methods of Extraction: A Review. Biotechnol. Biofuels 2018, 11, 269. [Google Scholar] [CrossRef]
- Stagno, V.; Ricci, S.; Longo, S.; Verticchio, E.; Frasca, F.; Siani, A.M.; Capuani, S. Discrimination between Softwood and Hardwood Based on Hemicellulose Content Obtained with Portable Nuclear Magnetic Resonance. Cellulose 2022, 29, 7917–7934. [Google Scholar] [CrossRef]
- Nurazzi, N.M.; Asyraf, M.R.M.; Rayung, M.; Norrrahim, M.N.F.; Shazleen, S.S.; Rani, M.S.A.; Shafi, A.R.; Aisyah, H.A.; Radzi, M.H.M.; Sabaruddin, F.A.; et al. Thermogravimetric Analysis Properties of Cellulosic Natural Fiber Polymer Composites: A Review on Influence of Chemical Treatments. Polymers 2021, 13, 2710. [Google Scholar] [CrossRef] [PubMed]
- Amaral, S.S.; De Carvalho Junior, J.A.; Costa, M.A.M.; Neto, T.G.S.; Dellani, R.; Leite, L.H.S. Comparative Study for Hardwood and Softwood Forest Biomass: Chemical Characterization, Combustion Phases and Gas and Particulate Matter Emissions. Bioresour. Technol. 2014, 164, 55–63. [Google Scholar] [CrossRef]
- Shahril, S.M.; Ridzuan, M.J.M.; Majid, M.S.A.; Bariah, A.M.N.; Rahman, M.T.A.; Narayanasamy, P. Alkali Treatment Influence on Cellulosic Fiber from Furcraea foetida Leaves as Potential Reinforcement of Polymeric Composites. J. Mater. Res. Technol. 2022, 19, 2567–2583. [Google Scholar] [CrossRef]
- Suhot, M.A.; Hassan, M.Z.; Aziz, S.A.; Md Daud, M.Y. Recent Progress of Rice Husk Reinforced Polymer Composites: A Review. Polymers 2021, 13, 2391. [Google Scholar] [CrossRef]
- Mazzanti, V.; Pariante, R.; Bonanno, A.; Ruiz De Ballesteros, O.; Mollica, F.; Filippone, G. Reinforcing Mechanisms of Natural Fibers in Green Composites: Role of Fibers Morphology in a PLA/Hemp Model System. Compos. Sci. Technol. 2019, 180, 51–59. [Google Scholar] [CrossRef]
- Vilutis, A.; Jankauskas, V. Experimental and Numerical Investigation of the Fracture Behavior of Extruded Wood–Plastic Composites under Bending. Polymers 2024, 16, 1485. [Google Scholar] [CrossRef]
- Jamal, I.I.; Marsi, N.; Letchumanan, T.; Mohd Rus, A.Z.; Hashim, M.M. Characteristics of Mechanical Strength of Hybrid Reinforced Plastic Waste Mixed with Wood Waste. Int. J. Automot. Mech. Eng. 2024, 21, 11276–11286. [Google Scholar] [CrossRef]
- Widiastuti, I.; Panuntun, A.B.; Seno, E.B.; Towip; Sutrisno, V.L.P.; Pramesti, G. Mechanical Properties and Water Absorption Behaviour of Virgin/Recycled Polypropylene Wood Waste Composites: A Comparative Analysis of Injection and Compression Moulding. J. Korean Wood Sci. Technol. 2025, 53, 164–176. [Google Scholar] [CrossRef]
- Hwang, S.; Fowler, G.; Han, Y.; Gardner, D.J. Material Property Characterization of 3D Printed Polypropylene Wood Plastic Composites. Polym. Compos. 2024, 45, 16058–16074. [Google Scholar] [CrossRef]
- Zeng, Z.; Zhou, Y.; Wen, S.; Zhou, C. Predicting the Tensile Properties of Wood Plastic Composites Using Material Extrusion with Meta-Based Few-Shot Learning. Compos. Part A Appl. Sci. Manuf. 2025, 190, 108671. [Google Scholar] [CrossRef]
- Sun, J.; Xu, J.; Zhou, S.-J.; Pang, Y.; Zhang, W.; Zhou, J.; Liu, Y.; Guo, H.; Jiang, F. Enhancing Building Energy Efficiency: Leaf Transpiration Inspired Construction of Lignin-Based Wood Plastic Composites for Building Energy Conservation. Appl. Energy 2024, 367, 123448. [Google Scholar] [CrossRef]
- Zhou, H.; Li, W.; Hao, X.; Zong, G.; Yi, X.; Xu, J.; Ou, R.; Wang, Q. Recycling End-of-Life WPC Products into Ultra-High-Filled, High-Performance Wood Fiber/Polyethylene Composites: A Sustainable Strategy for Clean and Cyclic Processing in the WPC Industry. J. Mater. Res. Technol. 2022, 18, 1–14. [Google Scholar] [CrossRef]
- Mohammed, K.; Zulkifli, R.; Faizal Mat Tahir, M.; Sumer Gaaz, T. A Study of Mechanical Properties and Performance of Bamboo Fiber/Polymer Composites. Results Eng. 2024, 23, 102396. [Google Scholar] [CrossRef]
- Rodríguez-Fabià, S.; Torstensen, J.; Johansson, L.; Syverud, K. Hydrophobisation of Lignocellulosic Materials Part I: Physical Modification. Cellulose 2022, 29, 5375–5393. [Google Scholar] [CrossRef]
- Anuar, N.I.S.; Zakaria, S.; Gan, S.; Chia, C.H.; Wang, C.; Harun, J. Comparison of the Morphological and Mechanical Properties of Oil Palm EFB Fibres and Kenaf Fibres in Nonwoven Reinforced Composites. Ind. Crops Prod. 2019, 127, 55–65. [Google Scholar] [CrossRef]
- Gubernur Banten. Upah Minimum Kabupaten/Kota di Provinsi Banten Tahun 2024; No. 561/Kep.293-Huk/2023; Dinas Tenaga Kerja Kota Tangerang: Tangerang, Indonesia, 2023; Available online: https://disnaker.tangerangkota.go.id/assets/media/file/pengumuman/SK_UMK_Banten_2024_compressed.pdf (accessed on 11 May 2025).
- Menteri Energi Dan Sumber Daya Mineral Republik Indonesia Tarif Tenaga Listrik Yang Disediakan Oleh Pt Perusahaan Listrik Negara (Persero). 2024; Volume 7. Available online: https://peraturan.bpk.go.id/Details/294347/permen-esdm-no-7-tahun-2024 (accessed on 11 May 2025).


Disclaimer/Publisher’s Note: The statements, opinions and data contained in all publications are solely those of the individual author(s) and contributor(s) and not of MDPI and/or the editor(s). MDPI and/or the editor(s) disclaim responsibility for any injury to people or property resulting from any ideas, methods, instructions or products referred to in the content. |
© 2026 by the authors. Licensee MDPI, Basel, Switzerland. This article is an open access article distributed under the terms and conditions of the Creative Commons Attribution (CC BY) license.