Abstract
Changing the topography of electrodes by ultrafast laser ablation has shown great potential in enhancing electrochemical performance in lithium-ion batteries. The generation of microstructured channels within the electrodes creates shorter pathways for lithium-ion diffusion and mitigates strain from volume expansion during electrochemical cycling. The topography modification enables faster charging, improved rate capability, and the potential to combine high-power and high-energy properties. In this study, we present a preliminary exploration of this approach for sodium-ion battery technology, focusing on the impact of laser-generated channels on hard carbon electrodes in sodium-metal half-cells. The performance was analyzed by employing different conditions, including different electrolytes, separators, and electrodes with varying compaction degrees. To identify key factors contributing to rate capability improvements, we conducted a comparative analysis of laser-structured and unstructured electrodes using methods including scanning electron microscopy, laser-induced breakdown spectroscopy, and electrochemical cycling. Despite being based on a limited sample size, the data reveal promising trends and serve as a basis for further optimization. Our findings suggest that laser structuring can enhance rate capability, particularly under conditions of limited electrolyte wetting or increased electrode density. This highlights the potential of laser structuring to optimize electrode design for next-generation sodium-ion batteries and other post-lithium technologies.
1. Introduction
As global demand for energy rises, concerns over resource insecurity, supply chain volatility, and geopolitical tensions are also increasing. In this context, energy storage technologies, especially rechargeable batteries, play a crucial role in the transition to a more resilient and sustainable energy supply. Benefiting from decades of development and massive infrastructure investments, lithium-ion technologies are clearly dominating the market and the additional push to advance lithium-ion battery (LIB) recycling promises to mitigate some of the pressure on critical raw material supply [,,]. At the same time, alternative active materials such as lithium iron phosphate (LFP) reduce the dependence on high-risk materials like cobalt and nickel, offering a partial solution to resource scarcity and tensions [,]. Despite these efforts, the lithium-ion battery supply chain remains exposed to geopolitical instabilities and the uneven global distribution of key raw materials [,]. Post-lithium alternatives, like sodium-ion batteries (SIBs), which leverage widely available and more cost-effective materials, are becoming more important. Especially for stationary storage and other non-EV applications, where weight and energy density are less critical, sodium-ion technology offers strategic benefits in terms of supply chain resilience, geographic independence, and domestic manufacturing potential, supporting a more diverse and secure battery ecosystem [,].
While material development remains a key focus in SIB research, advanced electrode architectures also play a crucial role in enhancing the performance properties such as rate capability and overall efficiency. One promising approach is the modification of electrode surfaces through laser ablation by generating three-dimensional (3D) electrode topographies, which has already been successfully employed in lithium-ion batteries (LIBs) to enhance electrochemical performance [,,,,,]. The reported benefits included faster lithium-ion diffusion kinetics, enhanced charging rates, extended cell lifetime, and the ability to combine a high power operation with a high energy density [,,,,]. Furthermore, the introduced micropatterns such as microchannels can mitigate damage due to volume changes in materials, which plays a major role in silicon-based anodes, and improve electrolyte wettability during cell assembly, as well as effective rewetting during battery operation [,,,,].
The employment of ultrashort pulsed (USP) lasers in electrode processing offers several advantages, such as so-called ‘cold’ ablation, which minimized the thermal influence zone in the remaining material, as well as the possibility to manufacture precise and well-defined structures, while offering pattern flexibility [,]. Although the application of laser-structured 3D electrode design has been extensively studied for LIBs, this concept has not yet been explored in the context of SIBs, particularly for hard carbon electrodes. Hard carbon is the most established anode active material for SIBs, and besides variations in composition and structure, its performance is highly influenced by factors such as porosity, compaction, and surface manipulation [,]. In the present study, we explore the potential of ultrafast laser structuring to enhance the performance of hard carbon electrodes in half-cell configurations against sodium, with a particular focus on the influence of varying compaction degrees and the resulting rate capability, mainly employing two different electrolytes and separators. This enables a better overview of the effects of the laser treatment under different conditions and to what extent this method is applicable when facing different challenges than encountered for LIBs. To the best of our knowledge, this work represents the first study exploring the effects of topographical modifications through laser structuring on hard carbon electrodes for application in SIBs. While previous research has demonstrated the use of ultrafast laser micromachining on hard carbon/fumed silica composites for sodium-ion capacitors (SICs) [], this study focuses on applications more relevant to battery technology. Although the findings presented here are from preliminary investigations, they show the promising potential of laser-based 3D electrode design for SIB electrodes and encourage further research and optimization. Rather than aiming for quantitative analysis, this work focuses on identifying consistent electrochemical trends across different conditions to provide an overview of how the laser structuring influences performance. To guide these preliminary studies, we formulated the following hypotheses:
- Laser-generated microchannels enhance rate capability in hard carbon electrodes, particularly in highly compacted electrodes, likely due to enhanced ion accessibility and reduced transport limitations.
- The structuring effect is more pronounced under conditions of limited electrolyte wetting, for example, when comparing highly porous glass fiber (GF) separators, which exhibit superior wettability, with Al2O3-coated polyethylene (PE) separators, which show reduced wetting behavior.
- Postmortem elemental mapping reveals a more uniform sodium distribution within the electrode in structured electrodes.
These hypotheses were evaluated through comparative electrochemical cycling with performance factors including rate capability and postmortem distribution of sodium.
2. Materials and Methods
This work was conducted in order to gain first insights into how and under which conditions laser structuring affects the electrochemical performance of hard carbon electrodes when cycling against metallic sodium. For this purpose, a single batch of electrodes was produced and calendered to three different thicknesses. To exclude sodium contributions from the binder in the postmortem laser-induced breakdown spectroscopy (LIBS) studies, polyvinylidene fluoride (PVDF) was used instead of the commonly employed water-based sodium carboxymethylcellulose (Na-CMC) binder. The focus was on electrodes with higher compaction, as reducing the porosity, and therefore the contact area between the hard carbon material and the liquid electrolyte, is a common strategy to improve the initial coulombic efficiency (ICE). Accordingly, the samples were chosen to include two more compacted electrodes and one less compacted for comparison. For the laser structuring, a regular line pattern with 200 µm line distance was created by laser ablation of the electrode material. The laser-structured (ls) electrodes and their unstructured (us) reference counterparts were assembled in coin half-cells against sodium using NaPF6- and NaTFSI-based electrolytes and the influence evaluated by rate capability testing. The NaTFSI cells were built using a ceramic-coated separator that enabled extraction of the electrodes after electrochemical testing for postmortem investigations. The details of the procedures are provided below.
2.1. Electrode Preparation
The hard carbon (HC) slurry for the manufacturing of the electrodes was prepared by pre-mixing hard carbon (BHC400, MTI Corporation, Richmond, CA, USA) as the active material, PVDF (Solvay, Hannover, Germany) as the binder, and carbon black (CB, Timcal Super C65, MTI Corporation, Richmond, CA, USA) as the conductive agent, in a weight ratio of 93:5.6:1.4 (HC:PVDF:CB). N-methyl-2-pyrrolidone (NMP, BASF, Ludwigshafen, Germany) was subsequently added as the solvent to achieve a solid content of 50% and the slurry was homogenized using a centrifugal mixer (Speedmixer DAC 150 SP, Hauschild, Hamm, Germany) for 1.5 h with 1500–3500 rpm.
Before casting, the viscosity of the resulting mixture was controlled with a rheometer (MCR 72, Anton Paar GmbH, Graz, Austria) at 25 °C using a rotational flow measurement with a parallel plate configuration (plate distance: 0.5 mm). The viscosity at a shear rate of 50 s−1 was 5.1 Pa·s. The slurry was tape-cast with a doctor blade with 450 µm gap size on a 20 µm current collector foil and dried at 90 °C for 3 h.
The dry electrode was cut into several segments that were calendered at 60 °C using a rolling press (MSK-2150, MTI Corporation, Richmond, CA, USA) to obtain electrodes of varying compaction for comparison.
2.2. Laser Structuring
The electrodes were structured using a high-power, high-repetition-rate laser source operating in burst mode (PXpv, EdgeWave GmbH, Würselen, Germany). The laser had a total power of 400 W, with an inner-burst repetition rate of 0.5 GHz and a wavelength of 1064 nm. Each individual pulse had a duration of 10 ps. Beam delivery was achieved using an f-theta lens (JENar, JENOPTIK AG, Jena, Germany) with a focal length of 255 mm, resulting in a focused spot diameter of approximately 24 µm. The laser structuring was performed using a laser materials processing workstation (MSV203, M Solv Ltd., Eynsham, UK).
For the structuring process, the applied average power on the sample was 40 W, the inter-burst repetition rate was 1 MHz, the burst length was 30 ns, and the scan speed was 20 m/s. The number of scan iterations (n) required to ablate the electrode material varied depending on the electrode thickness. For A186, n was 27, for A145, it was 25, and for A137, 20 scans were needed.
2.3. Coin Cell Assembly and Electrochemical Testing
For electrochemical investigations, the ls as well as the us electrodes were laser-cut to disks with a diameter of 12 mm for half-cells and 15 mm for full cells and dried at 100 °C for 12 h under rough vacuum. A half-cell assembly versus sodium metal in a CR2032 coin cell was used to investigate the rate capability of the different hard carbon electrodes. Preparation of the sodium electrode and cell assembly were performed in an argon-filled glove box (LAB master pro sp., M. Braun, Garching, Germany) with H2O < 0.1 ppm and O2 < 0.1 ppm. For the sodium (Na) electrode, metallic Na (Merck, Darmstadt, Germany), stored under protective mineral oil, was washed with propylene carbonate (PC, Sigma-Aldrich, Steinheim, Germany), and the oxidized surface was carefully removed with a blade. The metal was then rolled between two polypropylene sheets to achieve a thickness below 1 mm and punched into disks with 15 mm diameter. Each cell was filled with 120 μL of one of two electrolytes for comparison. The first one was an in-house-prepared solution of 1M sodium fluorohexaphosphate (NaPF6) in ethylene carbonate (EC) and PC mixed in a 1:1 volume ratio with 5% fluoroethylene carbonate (FEC) as an additive as referenced in [], kindly provided by Dr. Andreas Hofmann from the Institute of Applied Materials—Materials Science and Engineering (IAM-WK), Karlsruhe Institute of Technology (KIT). The second electrolyte was a commercially available 1M sodium(I) bis(trifluoro-methanesulfonyl)imide (NaTFSI) in EC and dimethyl carbonate (DMC) with EC:DMC = 1:1 (vol%) (Solvionic, Toulouse France). For cells containing NaPF6, a glass fiber separator (GF/A, Whatman, Maidstone, UK; sourced via Sigma Aldrich, Steinheim, Germany) was used due to incompatibility with ceramic-coated separators (NaPF6/GF system). In contrast, NaTFSI-containing cells employed a ceramic-coated polyethylene (PE) foil (12 μm base + 2 μm Al2O3 coating on each side, Gelon, Shandong, China; NaTFSI/PE system), which enabled extraction of the electrode for postmortem analysis. Furthermore, as part of supplementary analyses with only one cell per test condition, additional cells with NaTFSI and glass fiber separators (NaTFSI/GF), as well as full cells assembled with NaTFSI/PE and Na3V2(PO4)3/C (NVP/C) cathodes. The used NVP/C active material was generously supplied by Nicole Bohn and Dr. Joachim Binder (Institute of Applied Materials—Energy Storage Systems, IAM-ESS, KIT) and synthesized as described in []. The NVP/C electrodes were manufactured and kindly provided by David Burger, Prof. Dr. Wilhelm Schabel, and Dr. Philip Scharfer (Thin Film Technology at KIT). The used NVP/C cathode had a composition of 92.5 wt.% NVP/C active material (containing 9.8 wt.% carbon), 2 wt.% C65 (carbon black), 1 wt.% CMC, 1.5 wt.% PAA (poly-acrylic acid), and 3 wt.% SBR (styrene–butadiene rubber) and an average areal capacity of 2.2 mAh/cm2. The full cells were designed with an N/P ratio of approximately 1.2 to support comparative analysis.
After assembly, the cells were sealed with an electric crimper machine (MSK-160D, MTI Corporation, Richmond, CA, USA) and stored for 20 h at room temperature to ensure complete wetting of the separator and the HC electrode.
The electrochemical properties of the half-cells were investigated through rate capability analysis with a BT2000 battery cycler system (Arbin Instruments, College station, TX, USA) in constant current–constant voltage (CCCV) mode inside a voltage range of 0.02–2 V. For each tested condition, three independent cells (n = 3) were measured, unless stated otherwise for specific complementary experiments. For the electrochemical formation, three cycles were conducted consisting of CCCV discharging and charging at a 0.05C rate with a cut-off current of 0.02C applied during the CV phase. Subsequently, the rate capability of the cells was tested, as outlined in Table 1. The protocol employed unsymmetrical cycling, where discharge steps were performed at increasing C-rates (0.1C to 5C) to evaluate rate capability while charge steps were kept constant at 0.2C to ensure consistent re-sodiation. Discharge steps were conducted in CCCV mode with a CV cut-off current of 0.1C, as specified in Table 1, while charge steps were performed in constant current (CC) mode only. A 15 min rest period was included between each charge and discharge step and the open-circuit voltage (OCV) in this timeframe was recorded with a step size of 10 s.

Table 1.
Cycling protocol of the rate capability testing of the hard carbon vs. sodium half-cells with 5 repetitions at each C-rate. The C-rate represents the rate of charging or discharging a battery relative to its capacity, where 1C and 2C correspond to fully charging or discharging in 1 h or 30 min, respectively.
The areal capacities were initially calculated, assuming a specific capacity of 270 mAh/g for the hard carbon active material, based on the known composition and mass of each electrode. This value was previously determined in separate experimental cells at the end of their formation step. After formation, the actual discharge capacity from the third cycle was used to normalize the C-rate for each individual cell. This method accounts for variations in accessibility and utilization of the active material, which are common in thick-film electrodes, and ensures that rate capability comparisons reflect the true performance of each cell. The state of discharge (SOD) was determined using the average charge capacity at 0.2C as the reference point. To measure capacity retention, a further 0.2C cycle with 5 repetitions was added at the end of the test protocol. For calculations, the averaged value of the five repetitions at each C-rate was used. Full cells were tested in the voltage range of 2.3 V to 3.8 V and the cycling protocol can be found in the Supplementary Materials, Table S1.
To investigate sodium distribution postmortem, cells with NaTFSI/PE were subsequently cycled at 0.1C for an additional 200 cycles after the rate capability assessment. This was performed to promote enhanced Na plating and distribution effects.
2.4. Material and Electrode Characterization
The commercially available hard carbon powder (BHC400) was analyzed as follows. The particle size distribution was measured by laser diffraction (LA-950, Horiba, Loos, France) after dispersion in 2-propanol and yielded a median particle size (d50) of 8.2 ± 3 µm. The specific surface area (SSA) of 4.49 ± 0.01 m2/g was obtained by Brunauer–Emmett–Teller (BET) analysis using nitrogen adsorption gas (Gemini VII 2390, Micromeritics, Norcross, GA, USA). The density of the materials was determined to be 2.060 ± 0.002 g/cm3 by helium pycnometry (AccuPyc 1330, Porotec, Hofheim, Germany).
With regard to the us hard carbon electrodes, the porosities were estimated using Equation (1) []
where I is the thickness of the composite electrode without the current collector, W is the weight per area, x is the mass fraction of each material in the composite electrode, and ρ is the density of each material. Cross-sections of the us and ls samples were prepared by embedding the electrodes in an epoxy resin adding a fluorescent dye. Subsequently, the samples were ground and polished and investigated under a light microscope.
Raman spectroscopy was performed using a laser confocal micro-Raman spectrometer (LabRAM Odyssey, Horiba, Loos, France) with a laser wavelength of 532 nm (output power: 108 mW; power on sample surface: 52 mW) and a 1800 gr/mm grating (500 nm blaze). The spectra were recorded with a 100× objective (N.A. 0.90) and a confocal hole of 100 µm. The laser power was attenuated to 1% to avoid laser-induced material modification. The exposition time was set to 10 s with 3 accumulations. The laser spot size had a diameter of approximately 1 μm.
Contact angle measurements were performed as static experiments under ambient air conditions using a contact angle analyzer (OCA15+, Dataphysics Instruments, Filderstadt, Germany) equipped with a high-resolution CCD camera and controlled via SCA20 software (version 4.3.12 build 1037). Specimen positioning was achieved using a motorized 3-axis stage. A defined volume of ethylene glycol (2 μL) was dispensed via a calibrated cannula onto the separator and electrode surface.
For postmortem analysis, the cell disassembly was performed in the glovebox on the de-crimper setup of the electric crimper machine. The isolated electrodes were washed in dimethyl carbonate (DMC) and dried in the glovebox for 12 h prior to characterization.
A scanning electron microscopy system equipped with an energy-dispersive X-ray spectrometer (SEM-EDX, Phenom XL, Thermo Scientific, Waltham, MA, USA) with 10 kV accelerating voltage was used to investigate the pristine and postmortem electrodes using secondary electrons as a signal.
For the assessment of Na distribution within postmortem electrodes, laser-induced breakdown spectroscopy (LIBS) was employed. The experimental setup (FiberLIBS SN013, Secopta Analytics GmbH, Teltow, Germany) used a 1064 nm Nd:YAG laser (pulse duration: 1.5 ns; maximum pulse energy: 3 mJ), and was equipped with two Czerny–Turner spectrometers (1200 gr/mm, 250 nm blaze), which were coupled to a Hamamatsu S11155 charge-coupled detector (CCD) with 14 μm pixel width and electronic shutter.
3. Results and Discussion
3.1. Influence of Compaction and Laser Structuring on the Structure and Morphology
Figure 1 shows the cross-sectional views of hard carbon electrodes at various stages of compaction. The pristine, uncalendered electrode (a) exhibits a thickness of 195 ± 3 µm, while progressively compacted electrodes show reduced thicknesses of 186 ± 2 µm (b), 145 ± 2 µm (c), and 137 ± 2 µm (d).
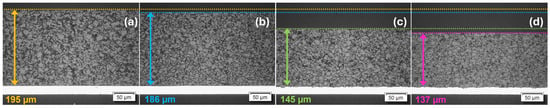
Figure 1.
Cross-sections of hard carbon electrodes with different stages of compaction: Pristine, uncalendered electrode ((a); 195(3) µm) and electrodes compacted to a thickness of 186(2) µm (b), 145(2) (c), and 137(2) µm (d). For clarity, a color-coding scheme is used to indicate compaction level: the uncalendered electrode A195 is shown in yellow, the least compacted electrode A186 in blue, the intermediate compaction level A145 in green, and the most compacted electrode A137 in pink. These sample identifiers (A195, A186, A145, A137) and colors are used consistently throughout the text.
The cross-sections reveal the structural changes resulting from calendering, including decreasing porosity and enhanced particle packing density as the thickness is reduced. Table 2 summarizes the identified quantitative properties, including the measured electrode thickness from the cross-sections, reduction in thickness relative to the uncalendared electrode, calculated porosities, total electrode weights, and calculated areal capacity. These values reflect the progressive compaction and mass reduction resulting from calendering. A reduction in current collector thickness is also observed in Figure 1, indicating that the electrode material has been pressed into the current collector. This deformation and reduced weight for compacted electrodes due to electrode elongation has been previously reported in [] and is not unexpected. This may introduce errors in specific capacity calculations, as the total electrode mass was used after subtracting a predefined current collector mass. However, for the purpose of trend analysis, these effects were not corrected, as the focus was placed on relative performance rather than absolute capacity values.
Table 2.
Measured and calculated properties of hard carbon electrodes with different compaction degrees.
SEM and cross-sectional images of the ls electrodes are shown in Figure 2. There is no indication of melt formation on the remaining active material adjacent to the generated channels in the SEM images of A186 (Figure 2a), A145 (Figure 2b), and A137 (Figure 2c). The corresponding cross-sections (Figure 2d–i) show how the channels extend through the full electrode thickness and provide insight into their geometry. The generated microstructures exhibit a trench-like profile with A186 (Figure 2d,g) exhibiting comparably straight and smooth sidewalls, while A145 (Figure 2e,h) and A137 (Figure 2f,i) show more irregularities in the profile and slightly inclined walls, resulting in a wider opening at the electrode surface and a narrower base near the current collector. The channel widths were quantified using the full-width-at-half-maximum (FWHM) of the electrode profiles from the cross-section images. Measurements were performed on five individual channels per electrode type, yielding average widths of 26.8 ± 2.6 µm for A186, 31.4 ± 2.7 µm for A145, and 30.6 ± 2.7 µm for A137. The corresponding aspect ratios, determined as the ratio of channel depth to channel width, are 6.94 (A186), 4.62 (A145), and 4.48 (A137), respectively. This difference in channel geometry and aspect ratio between A186 and the more compacted A145 and A137 can be attributed to the effects of electrode compaction on laser–material interaction. The lower compaction in A186 allows localized energy absorption and reduced lateral heat conduction, which confines the thermal effects to the immediate ablation zone. Additionally, the more loosely bound particles are more easily ejected without pulling larger fragments from the sidewalls, resulting in straighter sidewalls and higher aspect ratios. In contrast, the higher density of A145 and A137 promotes lateral thermal diffusion and less-selective material removal, causing more significant side erosion and inclined groove profiles with lower aspect ratios. The calculated material loss compared to the us electrode was 13.9% for A186, 20.7% for A145, and 21.5% in the case of A137. The corresponding areal capacities were calculated according to the method described in the Supplementary Information and were 3.63 mAh/cm2, 2.76 mAh/cm2, and 2.58 mAh/cm2, respectively.
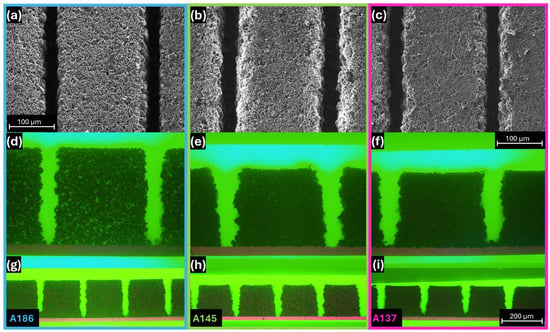
Figure 2.
Comparison of the electrodes A186, A145, and A137 after laser structuring. SEM top view images (a–c) and cross-sections with 50- (d–f) and 20-fold (g–i) magnification objective, showing the geometry of the laser-generated channels.
While the number of laser scan iterations (n) was adjusted to match the electrode thickness (27 for A186, 25 for A145, and 20 for A137), a detailed parametric study of how the channel depth and geometry evolve with the increasing pass number across compaction levels is beyond the scope of this investigation and will be addressed in future work.
While laser structuring introduces channels for enhanced ion transport, it also results in substantial material removal, consequently leading to a loss in capacity relative to its us counterpart. To find an optimum balance between performance enhancement and material sacrifice, further optimization of the process is essential. Potential strategies for this include adjusting the laser line spacing, limiting the ablation depth (e.g., to 70–80% of electrode thickness), and fine-tuning the beam shaping and laser parameters to achieve narrower and more precise channels.
Another important aspect with regard to sustainability is the recyclability of the removed material. For this purpose, the ablated material was recovered and analyzed to determine its potential for direct reuse in electrode fabrication. Raman spectroscopy (Figure 3a) revealed no significant changes in structural features. The D and G band intensities and positions are comparable to the ones of the pristine hard carbon. Further, the SEM images (Figure 3b) showed no notable morphological changes, with the edges of the particles remaining sharp and no signs of melting. These results suggest that the ablated material retains its structural integrity and may be suitable for reuse. While electrode fabrication and electrochemical testing with the recovered powder could not yet be realized due to a low yield and current limitations in the recovery process, further optimization is ongoing to enable direct reuse validation in future studies.
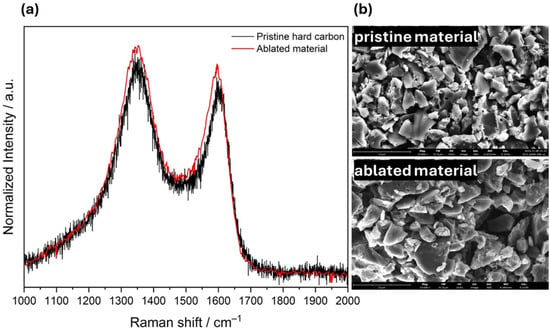
Figure 3.
Raman spectra (a) and SEM images (b) comparing the pristine hard carbon and the ablated material.
3.2. Rate Capability of Hard Carbon Electrodes
To establish a baseline, the influence of electrode compaction in combination with different electrolyte/separator combinations on electrochemical performance was evaluated using rate capability tests (Figure 4). The summarized values for the retention and the state of discharge (SOD) can be found in Tables S2–S4. Due to differences in electrolyte composition and separator type, the two setups are not directly comparable, but provide insights into the effect of electrode compaction within the specific system. In addition, cells using NaTFSI and a glass fiber separator (NaTFSI/GF) were analyzed. However, as only one cell was measured per condition, the statistical reliability is limited. Therefore, these results are reported as Supplementary Materials only (Figure S1).
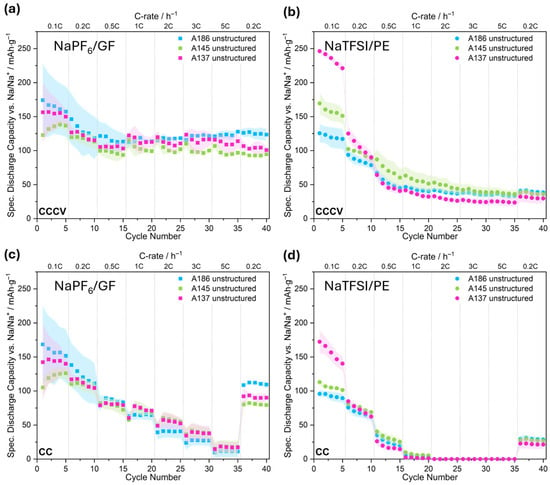
Figure 4.
Specific discharge capacity of us hard carbon electrodes with varying compaction degrees (A186, A145, A137) at different C-rates vs. Na/Na+. Top panels show the total capacity obtained during cycling in CCCV mode using NaPF6/GF (a) and NaTFSI/PE (b), respectively. Bottom panels display the specific capacity reached during the CC phase of the same CCCV protocol for NaPF6/GF (c) and NaTFSI/PE (d). Unless otherwise stated, each data point represents the mean of three cells and the shaded areas indicate the standard deviation. Cells with NaPF6 are represented by squares and the ones with NaTFSI in circles. The same identifiers are used in the following.
In the case of NaPF6-containing cells using glass fiber separators (NaPF6/GF), the reached capacity after CCCV and its CC contribution are shown in Figure 4a and Figure 4c, respectively. In the CCCV mode (Figure 4a), the least compacted electrode, A186 (blue), exhibits the highest capacity of approximately 175 mAh/g in the first cycle (0.1C) following the electrochemical formation step. However, the high standard deviation at low C-rates indicates poor reproducibility at slow cycling rates. At C-rates above 0.5C, the cells show less deviation, and all cells stabilize around 120–130 mAh/g with 96% capacity retention after the rate capability testing, suggesting good cycling stability under varying rates. The most compacted electrode, A137 (pink), exhibits slightly lower capacities overall but shows less variability across all discharging rates. The intermediate electrode, A145 (green), starts at 0.1C with lower capacity but with increased iterations reaches higher values. The cells here perform consistently but with slightly lower capacities than A186 and A137. For all three electrode types, the CC contribution (Figure 4c) decreases with the increasing C-rate as expected, with A145 and A137 showing nearly overlapping behavior from 0.5C to 5C while slightly outperforming A186. At 5C, the CC capacity drops to approximately 10 to 20 mAh/g across all electrodes, revealing the Na-ion diffusion limitations at high current densities. Overall, all three electrode types perform very similarly when using the NaPF6/GF combination.
In contrast to NaPF6, the capacities observed for NaTFSI-containing cells with ceramic-coated PE separators (NaTFSI/PE; Figure 4b) decline rapidly after the initial cycle. While the most compacted electrode (A137; pink) shows the highest initial capacity in the first cycle (~246 mAh/g at 0.1C), this benefit decreases quickly, and by 0.2C, all electrode types exhibit substantially reduced capacities. Beyond 1C, differences between compaction levels are minimal, and overall capacities stabilize around 50–75 mAh/g. The CC-only contribution (Figure 4d) becomes negligible already at 1C, indicating that most capacity is obtained during the CV phase. In comparison with the additional NaTFSI/GF (Figure S1) cells, a larger decline in capacity for the PE separator cells than for GF is observed. From the different tests, we conclude that NaTFSI electrolytes yield higher initial capacities at 0.1C for the more compacted electrodes (A145, A137) regardless of the separator type, but show faster capacity fading and stronger rate limitations than the NaPF6-based electrolyte. At C-rates of 0.5C and above, GF separators outperform PE, with NaPF6/GF achieving the best overall rate capability, likely due to better ionic conductivity or wettability. Despite lower capacities, the ceramic-coated PE separators enabled electrode recovery for postmortem analysis, which justifies their use in this study. It should also be acknowledged that the NaPF6-based electrolyte contained 5% FEC as an additive, which likely contributed to improved SEI stability and overall cycling performance.
Figure 5 shows the impact of the laser structuring of the compacted electrodes on the achieved specific capacity in the CCCV mode in dependance of the used electrolytes. With NaPF6, in the case of the least compacted electrode A186, the cells with the ls electrode exhibit a higher capacity at low C-rates below 0.5C than the us reference electrodes. In addition, they show less deviation than the us reference at low rates, so the results are more reproducible. At a rate of 0.5 C and above, the cells reach less capacity than the us reference. For A145 (Figure 5b) and A137 (Figure 5c), an improvement in the rate capability by laser structuring can be observed, with a more pronounced enhancement for the most compacted electrode. Also noteworthy is that in all three cases, the capacity of all electrodes initially decreases with an increasing C-rate, but begins to recover above 1C. This non-linear trend suggests a dynamic response that may involve factors such as electrolyte activation or changes in interfacial behavior, though further investigation would be required to clarify the underlying mechanisms.
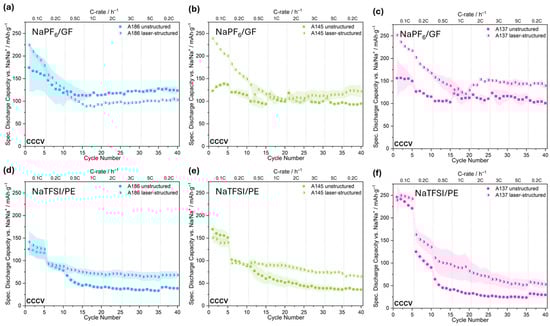
Figure 5.
Comparison of the specific discharge capacities reached after CCCV discharging of the us and ls hard carbon electrodes at different C-rates. Top panels show the trends for A186 (a), A145 (b), and A137 (c) using NaPF6. The bottom panels display the same for NaTFSI with A186 (d), A145 (e), and A137 (f). Data points for ls electrodes are represented by half-filled symbols.
In the case of NaTFSI/PE cells (Figure 5d–f), the improvement through the surface modification is evident in all three cases. The exception is the behavior of the medium compacted ls electrode (Figure 5e), which performs worse than the reference at 0.1C and 0.2C, but already surpasses it at 0.5C. At higher C-rates, its performance stabilizes, maintaining a capacity of approximately 30 mAh/g higher than the reference. The most compacted electrode, A137 (Figure 5f), has the highest initial capacity and the ls electrode outperforms the us reference and exhibits better stability. But it still exhibits capacity loss with progressing cycles, unlike A186 and A145, which demonstrate more stable cycling behavior. Compared to the NaTFSI/PE system, the NaTFSI/GF cells (Figure S1) also show enhanced rate capability through laser structuring. However, the smaller degree of improvement suggests that the GF separator itself contributes to performance, likely through its enhanced wetting or rewetting properties, as inferred from the immediate absorption of water droplets during contact angle testing compared to the ceramic-coated PE separator (Figures S3 and S4). For the electrodes, the ls electrode absorbed the liquid into the capillary structure, while the contact angle for the us electrode remained constant within the same timeframe (Figures S5 and S6). This further supports the assumption that laser structuring compensates for the limited wettability of the PE separator by improving electrolyte accessibility and interfacial contact. This compensatory effect explains why the influence is more pronounced in systems using PE separators than those using GF.
The corresponding capacities reached during CC discharging are shown in Figure 6. With NaPF6/GF (Figure 6a), the ls electrodes exhibit better performance compared to the us electrodes at low C-rates below 0.5C, and for A137, even at 0.5C. However, at higher C-rates (>0.5C), the us counterparts reach higher capacities during the constant current phase.
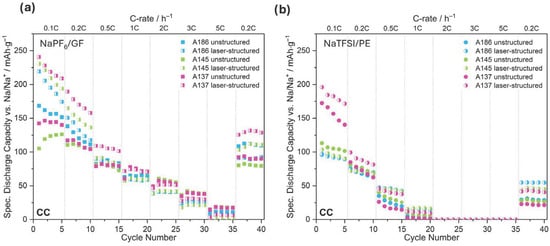
Figure 6.
Specific capacity reached during constant current (CC) discharging at different C-rates of us and ls electrodes with (a) NaPF6 and (b) NaTFSI electrolyte.
Using NaTFSI/PE (Figure 6b), the laser structuring generally shows an improvement for all three compaction levels at 0.5C and 1C, but no CC contribution above 2C. Among the electrodes, A137 consistently benefits from laser structuring, with the ls electrode outperforming the unmodified reference across all tested C-rates. For A145, the ls electrode performs worse at 0.1C, shows similar performance at 0.2C, and surpasses the us version at 0.5C and 1C. A186 shows overlapping performance between the ls and us electrodes at 0.1C and 0.2C, while the ls electrode performs better at higher C-rates of 0.5C and 1C. Across all configurations, no discharge capacity is observed above 1C in the constant current cycling. But all cells recover in the second 0.2C loop, with the ls electrodes achieving higher capacities than the us ones.
Based on the comparison between capacities reached after CCCV and CC cycling, it is evident that at lower C-rates, the constant current (CC) phase dominates the overall capacity contribution. As the C-rate increases, the relative contribution of the CV phase becomes more pronounced, particularly in ls electrodes at higher C-rates, suggesting facilitated ion transport and reduced polarization.
Effect sizes (Δ mAh/g and % change) were calculated for capacity retention (Table S2) and SOD between 0.5C and 5C (Table S4), comparing the ls and us electrodes. For example, A186 showed a 25% decrease in retention with NaPF6/GF, while the same electrode showed a 61.7% increase with NaTFSI/PE in CCCV discharging when using ls electrodes. For A145, retention decreased by 6.3% with NaPF6 and increased by 82.1% with NaTFSI. For A137, the change was −8.2% with NaPF6 and +27.6% with NaTFSI, indicating a consistent improvement in retention upon laser structuring when using NaTFSI. When comparing SOD, in the CCCV mode at 1C, A186 showed a 26% decrease in SOD with NaPF6, but a 58.8% increase with NaTFSI. A145 and A137 followed similar trends, with NaPF6 causing decreases of 20.5% and 21.4%, respectively, while NaTFSI led to increases of 69.0% and 69.4%. In the CC phase, the differences were even more dramatic. At 1C, A186 showed a 320% increase with NaTFSI, compared to a 13.8% decrease with NaPF6. A137 exhibited a 500% increase with NaTFSI, contrasting with a 33.8% decrease with NaPF6. These results demonstrate the significant improvement by laser structuring when employed in the NaTFSI/PE system but also underscore the strong influence of the electrolyte/separator system on discharge behavior.
For additional insight into the transport properties, the voltage relaxation behavior after discharge at various C-rates was investigated (Figure 7). The voltage was recorded after load removal over a 15 min period, with data points taken every 10 s. The first recorded value at 10 s does not represent a pure IR drop, as it already includes early relaxation effects and thus represents a combination of instantaneous ohmic resistance, capacitive relaxation, and kinetic or diffusive processes. Despite this, the data provide valuable insight into the relative voltage recovery behavior and internal dynamics of the cells.
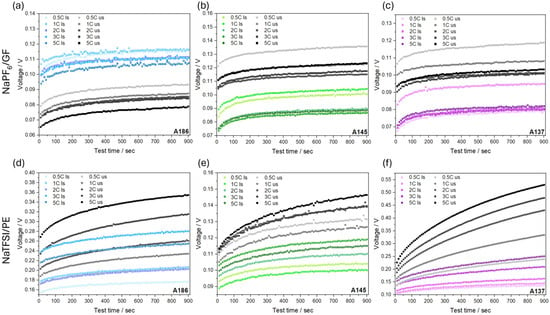
Figure 7.
Comparison of the recorded voltage response after load removal of cells with ls (colored scale) and corresponding us (gray scale) electrodes after different C-rates. The top panels show results using NaPF6/GF for A186 (a), A145 (b), and A137 (c) electrodes. The bottom panels display the corresponding data employing NaTFSI/PE for A186 (d), A145 (e), and A137 (f) electrodes.
In contrast, with NaTFSI/PE (Figure 7d–f), more pronounced differences between the ls and us electrodes are observed. The ls electrodes show lower initial voltages and flatter recovery curves, reaching lower voltages after 15 min compared to their counterparts. In contrast, the us electrodes exhibit higher starting voltages and steeper profiles, indicating slower ion redistribution, stronger concentration gradients, and higher internal resistance than observed in the ls electrodes. These differences suggest that the ls electrodes have a deeper and more uniform sodiation. While the voltage offset generally increases with the C-rate, the trend is non-monotonic, except for A137 (Figure 7f), where it is consistent. When comparing here the three electrode compaction levels, the difference in voltage recovery between the ls and us electrodes is least pronounced in A145 (Figure 7e), more evident in A186 (Figure 7d), and most significant in A137 (Figure 7f), the most compacted electrode. These trends also exhibit the influence of electrolyte wetting behavior. In the NaPF6/GF system, the high porosity and superior wettability of the glass fiber separator likely enable efficient electrolyte infiltration, resulting in similar curve shapes for the ls and us electrodes and suggesting that wetting is not a limiting factor. The NaTFSI/PE system, on the other hand, reveals more distinct differences between the ls and us electrodes. The improved voltage recovery and flatter profiles of the ls electrodes in this system point to enhanced electrolyte accessibility and rewetting, particularly under conditions of high compaction.
To explore whether these structuring effects observed in half-cell configurations translate to full-cell performance, additional preliminary tests were conducted using full cells with A137 anodes and unstructured Na3V2(PO4)3/C (NVP/C) cathodes in the NaTFSI/PE electrolyte (Figure S2). These tests revealed a significant improvement in rate capability for the ls anodes at C-rates above 0.2C. The increasing capacity of cells with the ls anode within the 0.1C loop also indicates a stabilization process and at the end also surpasses the us counterpart.
These combined results highlight how the impact of laser structuring on electrochemical performance is highly dependent on the combination of the electrolyte and separator, especially in terms of wettability and viscosity. In systems with glass fiber (GF) separators, which have high porosity and excellent wettability, the benefits of laser structuring, such as improved electrolyte filtration and rewetting, are largely attenuated. This explains the comparably small effect with the NaTFSI/GF and NaPF6/GF cells. The higher viscosity and lower wettability of the NaPF6-based electrolyte can still restrict ion transport within dense electrode structures, which is an advantage of the structuring. In contrast, PE separators with ceramic coatings are less wettable, resulting in poor electrolyte contact, especially with the more viscous NaPF6 system, which fails under these conditions. However, the NaTFSI electrolyte, which has a lower viscosity and better wetting behavior, works well with PE, and structuring significantly improves performance by creating channels that facilitate access for the electrolyte and mitigates the poor wettability of the separator. These results demonstrate the importance of compatibility between the electrolyte and separator and the role of laser patterning in improving performance when wetting is a limiting factor.
3.3. Postmortem Analysis
In the case of the NaTFSI/PE cells, the hard carbon electrodes were extracted after another 200 cycles at 0.1 C stopped in the discharged state to compare Na distribution and plating behavior. Figure 8 shows photographs of the postmortem us and ls electrodes for all compaction stages. For A186 electrodes (Figure 8a), the ls electrodes exhibit less sodium plating on the electrode surface. For A145 (Figure 8b) and A137 (Figure 8c), white deposits in the channels are more apparent.
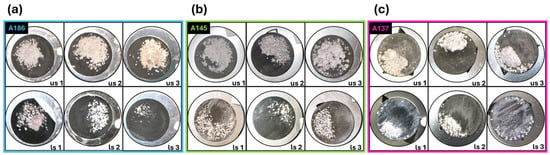
Figure 8.
Photographs of postmortem us (top) and ls (bottom) HC electrodes of A186 (a), A145 (b), and A137 (c) after long-term cycling at 0.1C. In panel (a), the ls1 electrode from A186 is missing a part that broke off during the washing process, not during electrochemical cycling.
These deposits were further investigated using SEM-EDX (Figure 9) and confirmed to be sodium. Closer examination revealed that the Na plating grew within the channels and as large accumulation on top of the electrode, but bridges between the channels also remained uncovered. It indicates that for ls electrodes, plating takes place within the channels first and just starting to form on the surface afterwards when the channels are already blocked or when having an additional nucleation site. Several factors likely contribute to this behavior. Laser ablation can selectively remove binder and increase porosity along the channel sidewalls, while plasma–material interactions or re-deposition may alter the local surface chemistry and create more sodiophilic sites. The channels also act as confinement zones that accumulate Na+, raising the local ion concentration and lowering the nucleation barrier for metal plating. The larger ionic radius and solvation dynamics of Na+ compared to Li+ may make these effects even more pronounced. Taken together, these findings suggest that Na plating is governed by a strong interplay of transport, surface chemistry, and geometry. From an electrode design perspective, this selective deposition is highly interesting. By steering sodium plating into engineered channels, laser structuring can mitigate uncontrolled surface deposition and delay dendritic growth. The ability to confine Na within predefined regions offers a potential route to stabilize hard carbon anodes and extend cycle life. At this stage, the interpretation remains speculative and will require validation through operando imaging and detailed surface characterization. Nonetheless, these results highlight the potential of laser patterning as both a mechanistic probe and a practical design strategy for next-generation sodium-ion anodes.
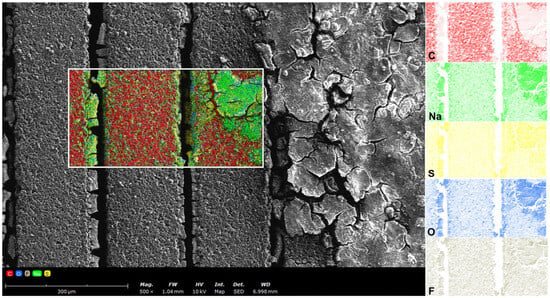
Figure 9.
SEM images with EDX elemental mapping of postmortem ls electrode taken at the sodium plating region. Sulfur (S) and fluorine (F) originate from the decomposition of the NaTFSI salt and are incorporated into the SEI.
To investigate the sodium distribution within the electrode below the surficial plated sodium, laser-induced breakdown spectroscopy (LIBS) was performed on sodiated postmortem A145 hard carbon electrodes. As PVDF has no sodium compared to the common water-based binder systems, the Na contribution from the binder can be excluded. Figure 10a (us) and Figure 10b (ls) display the lateral distribution as well as a photograph of the respective electrode, indicating the location of the plating before removal. In Figure 10c (us) and Figure 10d (ls), the averaged cross-sections along X and Y are additionally shown. The stripe pattern in the LIBS elemental map of the ls electrode (Figure 10b) does not align with the laser-generated channels. Rather, it results from an interference effect caused by the spatial mismatch between the LIBS measurement grid and the underlying electrode structure. The LIBS scan was performed in a direction not aligned with the channels, leading to alternating measurement points that either hit the electrode surface or the bottom of the ablated channels, where the current collector is exposed. This periodic variation in signal intensity produces a stripe-like pattern that reflects the measurement geometry rather than the actual sodium distribution.
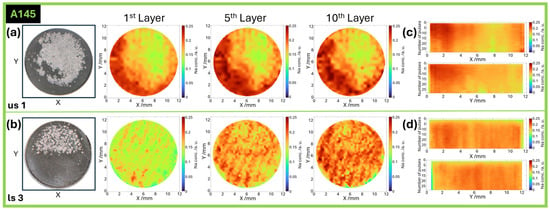
Figure 10.
Qualitative elemental mapping of sodium within postmortem hard carbon anodes (A145) measured by LIBS after removing surficial sodium plating. Photograph and lateral distribution in us (a) and ls (b) electrodes after 1, 5, and 10 pulses, as well as averaged cross-sectional view along X and Y for the respective electrodes (c,d).
The uneven lateral distribution in the us electrode (Figure 10a), as well as the averaged cross-section (Figure 10c), show less sodium below the plated region within the electrode, indicating limited Na+ diffusion in this part. In comparison, the ls electrode (Figure 10b,d) reveals a much more even distribution of sodium within the whole electrode. Even below the plating, Na could be distributed, enabled by the channels.
4. Conclusions
In this work, we examined the combined influence of the compaction degree, electrolyte composition, and separator type alongside laser structuring to assess their impact on the electrochemical performance of hard carbon anodes for sodium-based batteries. Our results show that cell performance is determined by the interplay of multiple design parameters, with laser structuring representing only one contributing factor.
The preliminary findings suggest that laser structuring of these electrodes, though still in the early stages of optimization, can enhance rate capability, particularly in sub-optimal or underperforming electrodes. This improvement appears to be linked to more uniform sodium distribution within the electrode, as evidenced by postmortem LIBS analysis. In well-balanced cells, however, the benefits may be negligible or even offset by material loss and associated capacity degradation.
SEM-EDX investigations further revealed that sodium plating preferentially occurs within the laser-generated channels before forming on the electrode surface, suggesting that the channel geometry, altered surface chemistry, and local ion concentration collectively steer deposition behavior. This selective plating may help mitigate uncontrolled surface deposition and delay dendritic growth, offering a promising route to stabilize hard carbon anodes and extend cycle life.
While not a universal solution, laser structuring can serve as an additional adjustment screw in targeted optimization efforts, unlocking untapped performance potential where other cell components are limiting. Its integration into holistic cell design, coupled with the reuse of ablated material, supports both performance and sustainability goals. These insights provide a basis for future targeted investigations into long-term cycling stability, interfacial dynamics, and material recovery strategies.
Supplementary Materials
The following supporting information can be downloaded at: https://www.mdpi.com/article/10.3390/batteries11110403/s1, Figure S1: Rate capability of cells with NaTFSI and glass fiber separator (NaTFSI/GF) for A186 (a), A145 (b), and A137 (c). Comparison of unstructured (us, filled symbol) and laser-structured (ls, half-filled symbol) electrodes with CCCV (circle) and CC (triangle) contribution; Table S1: Cycling protocol of the asymmetric rate capability testing of the A137 hard carbon anode vs. NVP/C cells with five repetitions at each C-rate in the range of 2.3 V to 3.8 V; Figure S2: Comparison of the rate capability of a us (filled symbol) and an ls (half-filled symbol) A137 electrode with CCCV (square) and CC (triangle) contribution in full-cell assemblies versus Na3V2(PO4)3/C (NVP/C) cathodes (a). Photographs of the corresponding postmortem anodes showing strong Na plating (b); Table S2: Capacity retention of the half-cells with calendered us and ls electrodes with NaPF6/GF and NaTFSI/PE at 0.2C for the CCCV and CC phases. Change is represented both as the absolute difference (Δ = ls-us, in mAh/g) in capacity and as the percentage change, each given relative to the corresponding us counterpart; Table S3: State of discharge (SOD) of the half-cells with us and ls electrodes (A186, A145, and A137) for NaPF6/GF and NaTFSI/PE at C-rates from 0.5C to 5C for the CCCV and CC phases; Table S4. Difference in CCCV and CC capacities at C-rates between 0.5C and 5C from Table S3, given as the absolute difference (Δ = ls-us, in mAh/g) and as the percentage change, both calculated relative to the respective us counterpart when employing NaPF6/GF or NaTFSI/PE; Figure S3. Contact angle measurement of ethylene glycol drop on the GF separator immediately before contact (t0) and 141.7 ms later as the drop was already absorbed; Figure S4: Contact angle of ethylene glycol drop on the ceramic-coated PE separator; Figure S5. Contact angle of ethylene glycol drop on a us A137 electrode; Figure S5: Absorption progression of ethylene glycol drop on an ls A137 electrode.
Author Contributions
Conceptualization, methodology, formal analysis, investigation, data curation, writing—original draft preparation, V.F.; resources, writing—review and editing, W.P. All authors have read and agreed to the published version of the manuscript.
Funding
We are grateful to the KIT library for supporting this publication through its open access funding program.
Data Availability Statement
The original contributions presented in the study are included in the article, further inquiries can be directed to the corresponding authors.
Acknowledgments
The authors would like to thank Theo Scherer (KIT, IAM-AWP) for granting access to the Raman spectrometer, and Francesco Mazzocchi and Gaetano Aiello (KIT, IAM-AWP) for their assistance and training on the instrument. Thanks to Thomas Bergfeldt (KIT, IAM-AWP) for chemical analysis, Marcus Müller, Monika Raab, and Christina Odemer (KIT, IAM-ESS) for the measurement of particle size, BET surface area, and density of the raw materials, and Alexandra Reif (KIT, IAM-AWP) for contact angle measurements. Ulrich Rist (KIT, IAM-AWP) for providing software tools for the conversion and processing of electrochemical and LIBS data and together with Yannic Sterzl (KIT, IAM-AWP) for valuable help and discussions on electrochemical characterization. We are grateful to Andreas Hofmann (KIT, IAM-WK) for the preparation and provision of the NaPF6 electrolyte, Joachim Binder and Nicole Bohn (KIT, IAM-ESS) for the synthesis of the active material, and David Burger, Wilhelm Schabel, and Philip Scharfer from Thin Film Technology at KIT for coating and drying NVP/C cathodes in their TFT Coating and Printing Lab.
Conflicts of Interest
W. Pfleging is listed as an inventor on a patent related to laser structuring of battery electrodes. Although the method is used in this study, the research focus does not directly relate to the patent. This is disclosed in the interest of transparency.
References
- Srinivasan, S.; Shanthakumar, S.; Ashok, B. Sustainable lithium-ion battery recycling: A review on technologies, regulatory approaches and future trends. Energy Rep. 2025, 13, 789–812. [Google Scholar] [CrossRef]
- Rezaei, M.; Nekahi, A.; Kumar, M.R.A.; Nizami, A.; Li, X.; Deng, S.; Nanda, J.; Zaghib, K. A review of lithium-ion battery recycling for enabling a circular economy. J. Power Sources 2025, 630, 236157. [Google Scholar] [CrossRef]
- Dixit, M.; Witherspoon, B.; Muralidharan, N.; Mench, M.M.; Kweon, C.-B.M.; Sun, Y.-K.; Belharouak, I. Insights into the Critical Materials Supply Chain of the Battery Market for Enhanced Energy Security. ACS Energy Lett. 2024, 9, 3780–3789. [Google Scholar] [CrossRef]
- Zhao, T.; Choi, Y.; Wu, C.; Zhang, Z.; Wang, C.; Liu, D.; Xu, W.; Huang, H.; Huo, X.; Zhao, W.; et al. A review on direct regeneration of spent lithium iron phosphate: From waste to wealth. Sci. Total Environ. 2024, 957, 177748. [Google Scholar] [CrossRef] [PubMed]
- Chen, T.; Li, M.; Bae, J. Recent Advances in Lithium Iron Phosphate Battery Technology: A Comprehensive Review. Batteries 2024, 10, 424. [Google Scholar] [CrossRef]
- Ren, H.; Mu, D.; Wang, C.; Yue, X.; Li, Z.; Du, J.; Zhao, L.; Lim, M.K. Vulnerability to geopolitical disruptions of the global electric vehicle lithium-ion battery supply chain network. Comput. Ind. Eng. 2024, 188, 109919. [Google Scholar] [CrossRef]
- Jetin, B. Electric batteries and critical materials dependency: A geopolitical analysis of the USA and the European Union. Int. J. Automot. Technol. Manage. 2023, 23, 383–407. [Google Scholar] [CrossRef]
- Cai, X.; Yue, Y.; Yi, Z.; Liu, J.; Sheng, Y.; Lu, Y. Challenges and industrial perspectives on the development of sodium ion batteries. Nano Energy 2024, 129, 110052. [Google Scholar] [CrossRef]
- Hu, Y.-S.; Li, Y. Unlocking Sustainable Na-Ion Batteries into Industry. ACS Energy Lett. 2021, 6, 4115–4117. [Google Scholar] [CrossRef]
- Pfleging, W. 3D electrode architectures for high energy and high power lithium-ion batteries. In Proceedings of the SPIE 12090, Energy Harvesting and Storage: Materials, Devices, and Applications XII, Orlando, FL, USA, 3–7 April 2022; p. 1209003. [Google Scholar] [CrossRef]
- Park, J.; Jeon, C.; Kim, W.; Bong, S.-J.; Jeong, S.; Kim, H.-J. Challenges, laser processing and electrochemical characteristics on application of ultra-thick electrode for high-energy lithium-ion battery. J. Power Sources 2021, 482, 228948. [Google Scholar] [CrossRef]
- Park, J.; Song, H.; Jang, I.; Lee, J.; Um, J.; Bae, S.-g.; Kim, J.; Jeong, S.; Kim, H.-J. Three-dimensionalization via control of laser-structuring parameters for high energy and high power lithium-ion battery under various operating conditions. J. Energy Chem. 2022, 64, 93–102. [Google Scholar] [CrossRef]
- Proell, J.; Kohler, R.; Mangang, A.; Ulrich, S.; Ziebert, C.; Pfleging, W. 3D Structures in Battery Materials. J. Laser Micro Nanoeng. 2012, 7, 97–104. [Google Scholar] [CrossRef]
- Nikam, E.; Bhattarai, R.M.; Hereijgers, J. Review on Recent Progress and Challenges in Laser-Structuring of Electrodes for Lithium-Ion Batteries. Adv. Energy Mater. 2025, 15, 2406021. [Google Scholar] [CrossRef]
- Hille, L.; Toepper, H.-C.; Schriever, C.; Kriegler, J.; Keilhofer, J.; Noecker, M.P.; Zaeh, M.F. Influence of Laser Structuring and Calendering of Graphite Anodes on Electrode Properties and Cell Performance. J. Electrochem. Soc. 2022, 169, 060518. [Google Scholar] [CrossRef]
- Kriegler, J.; Hille, L.; Stock, S.; Kraft, L.; Hagemeister, J.; Habedank, J.B.; Jossen, A.; Zaeh, M.F. Enhanced performance and lifetime of lithium-ion batteries by laser structuring of graphite anodes. Appl. Energy 2021, 303, 117693. [Google Scholar] [CrossRef]
- Hille, L.; Keilhofer, J.; Mazur, R.; Daub, R.; Zaeh, M.F. Comparative Evaluation of Graphite Anode Structuring for Lithium-Ion Batteries Using Laser Ablation and Mechanical Embossing. Energy Technol. 2024, 12, 2301502. [Google Scholar] [CrossRef]
- Sterzl, Y.; Pfleging, W. Optimizing Structural Patterns for 3D Electrodes in Lithium-Ion Batteries for Enhanced Fast-Charging Capability and Reduced Lithium Plating. Batteries 2024, 10, 160. [Google Scholar] [CrossRef]
- Hille, L.; Xu, L.; Keilhofer, J.; Stock, S.; Kriegler, J.; Zaeh, M.F. Laser structuring of graphite anodes and NMC cathodes—Proportionate influence on electrode characteristics and cell performance. Electrochim. Acta 2021, 392, 139002. [Google Scholar] [CrossRef]
- Tran, M.X.; Smyrek, P.; Park, J.; Pfleging, W.; Lee, J.K. Ultrafast-Laser Micro-Structuring of LiNi(0.8)Mn(0.1)Co(0.1)O(2) Cathode for High-Rate Capability of Three-Dimensional Li-ion Batteries. Nanomaterials 2022, 12, 3897. [Google Scholar] [CrossRef]
- Kim, J.S.; Pfleging, W.; Kohler, R.; Seifert, H.J.; Kim, T.Y.; Byun, D.; Jung, H.-G.; Choi, W.; Lee, J.K. Three-dimensional silicon/carbon core–shell electrode as an anode material for lithium-ion batteries. J. Power Sources 2015, 279, 13–20. [Google Scholar] [CrossRef]
- Meyer, A.; Ball, F.; Pfleging, W. The Effect of Silicon Grade and Electrode Architecture on the Performance of Advanced Anodes for Next Generation Lithium-Ion Cells. Nanomaterials 2021, 11, 3448. [Google Scholar] [CrossRef] [PubMed]
- Zheng, Y.; Yin, D.; Seifert, H.J.; Pfleging, W. Investigation of Fast-Charging and Degradation Processes in 3D Silicon–Graphite Anodes. Nanomaterials 2022, 12, 140. [Google Scholar] [CrossRef] [PubMed]
- Dunlap, N.; Sulas-Kern, D.B.; Weddle, P.J.; Usseglio-Viretta, F.; Walker, P.; Todd, P.; Boone, D.; Colclasure, A.M.; Smith, K.; Tremolet de Villers, B.J.; et al. Laser ablation for structuring Li-ion electrodes for fast charging and its impact on material properties, rate capability, Li plating, and wetting. J. Power Sources 2022, 537, 231464. [Google Scholar] [CrossRef]
- Berhe, M.G.; Musse, D.; Oh, H.G.; Park, S.-K.; Lee, D. Development of laser structured three-dimensional patterns for improved wettability and performance of electrodes for lithium-ion batteries. Colloids Surf. A 2024, 697, 134393. [Google Scholar] [CrossRef]
- Tünnermann, A.; Momma, C.; Nolte, S. Perspective on ultrashort pulse laser micromachining. Appl. Phys. A 2023, 129, 157. [Google Scholar] [CrossRef]
- Shin, S. Review of high-precision femtosecond laser materials processing for fabricating microstructures: Effects of laser parameters on processing quality, ablation efficiency, and microhole shape. J. Laser Appl. 2024, 36, 041201. [Google Scholar] [CrossRef]
- Tan, S.; Yang, H.; Zhang, Z.; Xu, X.; Xu, Y.; Zhou, J.; Zhou, X.; Pan, Z.; Rao, X.; Gu, Y.; et al. The Progress of Hard Carbon as an Anode Material in Sodium-Ion Batteries. Molecules 2023, 28, 3134. [Google Scholar] [CrossRef]
- Shafiee, F.N.; Mohd Noor, S.A.; Mohd Abdah, M.A.A.; Jamal, S.H.; Samsuri, A. Recent progress on hard carbon and other anode materials for sodium-ion batteries. Heliyon 2024, 10, e29512. [Google Scholar] [CrossRef]
- Jo, A.; Lee, B.; Kim, B.G.; Lim, H.; Han, J.T.; Jeong, S.Y.; Kim, J.; Seo, S.H.; Jeong, H.J.; Lee, G.-W.; et al. Ultrafast laser micromachining of hard carbon/fumed silica anodes for high-performance sodium-ion capacitors. Carbon 2023, 201, 549–560. [Google Scholar] [CrossRef]
- Stüble, P.; Müller, C.; Klemens, J.; Scharfer, P.; Schabel, W.; Häringer, M.; Binder, J.R.; Hofmann, A.; Smith, A. Enabling Long-term Cycling Stability of Na3V2(PO4)3/C vs. Hard Carbon Full-cells. Batter. Supercaps 2024, 7, e202300375. [Google Scholar] [CrossRef]
- Mayer, D.; Wurba, A.-K.; Bold, B.; Bernecker, J.; Smith, A.; Fleischer, J. Investigation of the Mechanical Behavior of Electrodes after Calendering and Its Influence on Singulation and Cell Performance. Processes 2021, 9, 2009. [Google Scholar] [CrossRef]
Disclaimer/Publisher’s Note: The statements, opinions and data contained in all publications are solely those of the individual author(s) and contributor(s) and not of MDPI and/or the editor(s). MDPI and/or the editor(s) disclaim responsibility for any injury to people or property resulting from any ideas, methods, instructions or products referred to in the content. |
© 2025 by the authors. Licensee MDPI, Basel, Switzerland. This article is an open access article distributed under the terms and conditions of the Creative Commons Attribution (CC BY) license (https://creativecommons.org/licenses/by/4.0/).