Abstract
To support the growing global population, sustainable farming methods like vertical farming must complement traditional agriculture. This study evaluated the effects of various nitrogen fertilizer application rates (N_low (1055.3 ppm), N_rec (1640.9 ppm), N_high (2811.3 ppm), and N_0 (469.9 ppm)) on organic kale (Brassica oleracea L. var. acephala ‘Lacinato’) and Swiss chard (Beta vulgaris subsp. Vulgaris ‘Ruby/Rhubarb Red’), grown in a vertical growing system installed in a high tunnel during the spring and fall season of 2023 at the organic farm of Tennessee State University. Growth parameters studied included fresh weight, Brix, chlorophyll, plant height, and leaf count. Most parameters did not exhibit statistically significant differences (alpha = 0.05). However, consistent numerical trends and deviations were observed. Although not statistically significant, kale achieved the highest mean fresh weight in N_rec (688.08 g), and Swiss chard in N_high by spring (649.62 g). Among the few parameters, significant differences were observed for Swiss chard plant height (48.07 cm) and leaf count (47.25), with N_high during fall. Findings suggest that while definitive conclusions were limited, recommended nitrogen rates (N_rec) may enhance crop performance and contribute sustainable yields in resource constrained vertical farming systems. Further controlled studies are warranted to validate trends and refine nutrient strategies in vertical growing system.
1. Introduction
Vertical farming has emerged as an innovative solution to answer the challenges associated with traditional agriculture, such as land availability, climate change, resource availability, and the demand for sustainable food production and consumption [,]. The method of cultivating crops in stacked layers, one above the other, maximizes efficient space utilization, offering precise control over climatic conditions and nutrient availability to the plants [,]. The management of nitrogen is very crucial in vertical farming, and it can be controlled through hydroponics or soil-based systems, which will result in optimized crop yields, eliminate pollution, enhance the efficient utilization of resources, and reduce wastage [,,].
Vertical farming systems may not always be equipped with sophisticated systems for advanced climate control, particularly in cost-effective systems such as tunnel farming, and low-tech urban farms [,]. Under these systems, the variations in temperature, moisture, light, and others can affect nutrient availability, crop development, and yield [,]. Although there is extensive research on nutrient requirements for traditional field-grown crops, there remains a significant knowledge gap specific to how crops respond to various nitrogen levels in vertical farming systems exposed to uncontrolled environmental conditions []. Understanding these interactions is pivotal for enhancing nitrogen use efficiency (NUE) and ensuring sustainable production practices in urban agricultural systems [].
Nitrogen is one of the most crucial macronutrients that support plant growth and development, specifically playing a significant role in fundamental physiological processes such as photosynthesis, biomass production, protein synthesis, etc. It is also an integral part of enzymes, chlorophyll, and amino acids. It directly regulates metabolism and energy production in plants []. Its availability and effective utilization are crucial in sustainable agricultural systems that aim to produce high-quality and -quantity yields with sustainable and minimal inputs []. Nitrogen management is the prominent factor to attain balance in crop productivity and environmental sustainability [,]. Nitrogen deficiency can cease plant growth, deplete yield, and destabilize the cropping system, while excessive nitrogen application can lead to even more adverse effects such as nitrogen leaching into water bodies, soil acidification, increased greenhouse gas emissions, such as nitrous oxide, and the loss of soil health and fertility []. All these factors raise concern for prioritizing precise nitrogen applications to achieve optimal nitrogen use efficiency without compromising ecological balance to maintain a stable sustainable agricultural system.
In urban agriculture, land, water, and capital resources are limited; hence, nutrient use optimization becomes even more critical []. Vertical farming systems in urban environments offer a non-compromising strategy for producing local fresh food by reducing reliance on extensive farmland and long chains of transportation networks [,]. However, the challenge still lies in tailoring nitrogen application rates to enhance crop yields and quality under changing environmental conditions while minimizing resource wastage.
This study evaluated the growth performance of nitrogen-demanding leafy greens, kale and Swiss chard [,,]. These crops were grown in a vertical farming system installed in a high tunnel, a cost-effective alternative to controlled farming systems. Unlike advanced vertical farms, high tunnels lack advanced climate control systems, making temperature and moisture highly variable and dependent on external weather conditions. By assessing plant responses to varying nitrogen rates, this study aimed to provide practical insights into optimizing nutrient use in resource-limited vertical farming systems, with broader implications for sustainable urban agriculture and food security. Despite the known importance of nitrogen, there is still a research gap in this area, such as limited studies on nitrogen dynamics in vertical farming in a high-tunnel setting, crop-specific response to the various nitrogen levels, long-term environmental impacts of nitrogen management in vertical farming, and the economic feasibility of optimized nitrogen rates in vertical farming systems. These are all the areas where extensive research can be carried out to produce broader solutions for the existing challenges in urban farming.
This study presents results from the effect of four nitrogen application rates (N_0, N_low, N_rec, and N_high) on the plant growth and yield of organic kale (Brassica oleracea L. var. acephala ‘Lacinato’) and Swiss chard (Beta vulgaris subsp. Vulgaris ‘Ruby/Rhubarb Red’) grown in vertical farming system installed in the high tunnel.
2. Materials and Methods
2.1. Study Site and Plant Material
The research trials were conducted in a vertical growing system (Verti-gro Inc., Summerfield, FL, USA) installed in high tunnel at the organic farm of the Tennessee State University Agricultural Research Facility. Organic kale (Brassica oleracea L. var. acephala ‘Lacinato’) and Swiss chard (Beta vulgaris subsp. Vulgaris ‘Ruby/Rhubarb Red’) (Figure 1), were selected for the study due to their relevance in urban agriculture. Seeds were procured from High Mowing Organic Seeds (Wolcott, VT, USA). These crop varieties were chosen due to their relevance in high nutritional value and adaptability, making them ideal crops for vertical farming systems. For the spring trial, seeds were sown in March, and for the fall trial, sowing was performed in July. A substrate mixture of coco coir and perlite was used for sowing, since it can support robust seedling capacity and is known for its excellent water holding capacity and aeration properties. The experiment followed organic management practices. After 4–6 weeks, the seedlings were fit to transplant into the vertical farming system (Verti-Gro system). The Verti-Gro system was obtained from Verti-Gro Inc., Summerfield, FL, USA, consisting of vertical towers, each with four Styrofoam pots, where each pot can hold up to four plants. Each pot measures 8 “in height and 10” in length, and one pot can hold up to 3.78 L of water. The pots were filled with the substrate composed of peat moss + perlite (80:20). Transplantation of seedlings of kale and Swiss chard for the spring trial was performed by 28 April 2023 and ended by 28 June 2023. Transplantation in the fall trial was performed by 29 August 2023 and ended by 29 October 2023.
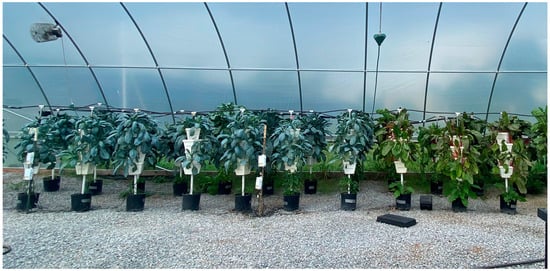
Figure 1.
Organic kale and Swiss chard in vertical growing system.
2.2. Experimental Design
The experiment was designed with two replications of four treatments per crop, comprising 16 towers, each containing 16 plants. Eight towers were allocated to kale, while the remaining eight were dedicated to Swiss chard. Each tower consists of four pots, with four plants in each pot. The macronutrient complex fertilizers, N-P-K (6-12-28) and N-P-K (15-0-0), were sourced from Verti Gro (Verti-Gro Inc., Summerfield, FL, USA). To prepare the liquid concentrate of N-P-K (6-12-28) and N-P-K (15-0-0), 907.2 g of fertilizer was dissolved in 3.78 L of water. Subsequently, 14.17 g of this concentrate was diluted in 3.78 L of water in the nutrient tank (44 G Brute, Lowes, Nashville, NC, USA) for irrigation. The fertilizer was mixed into the water and provided to each tank every two days, ensuring consistent nutrient delivery throughout the growing period. The nutrient tanks were connected with the water pumps and drip lines to supply the nutrient solution to the plants in pots. The hydroponic systems were irrigated using a timed drip irrigation method. Water was supplied four times a day, at 6 AM, 10 AM, 3 PM, and 7 PM, in 10 min intervals.
The four nitrogen treatments applied were
- N_0: 6-12-28 (N-P-K) + 0-0-0 (N-P-K)
In the N_0 treatment, 1183 mL of N-P-K (6-12-28) liquid concentrate and 0 mL of N-P-K (15-0-0) liquid concentrate were mixed into 151.42 L of water in the nutrient tank. In terms of Parts Per Million (ppm), 468.9 ppm of nitrogen was applied in this treatment.
- N_low: 6-12-28 (N-P-K) + 7.5-0-0 (N-P-K)
In the N_low treatment, 1183 mL of N-P-K (6-12-28) liquid concentrate solution and 592 mL of N-P-K (15-0-0) liquid concentrate were mixed into 151.42 L of water in the nutrient tank. In terms of ppm, 1055.3 ppm of nitrogen was applied in this treatment.
- N_rec: 6-12-28 (N-P-K) + 15-0-0 (N-P-K)
In the N_rec treatment (recommended rate), 1183 mL of N-P-K (6-12-28) liquid concentrate and 1183 mL of N-P-K (15-0-0) liquid concentrate were mixed into 151.42 L of water in the nutrient tank. In terms of ppm, 1640.9 ppm of nitrogen was applied in this treatment.
- N_high: 6-12-28 (N-P-K) + 30-0-0 (N-P-K)
In the N_high treatment, 1183 mL of N-P-K (6-12-28) liquid concentrate and 2366 mL of N-P-K (15-0-0) liquid concentrate were mixed into 151.42 L of water in the nutrient tank. In terms of ppm, 2811.3 ppm of nitrogen was applied in this treatment.
2.3. Data Collection and Statistical Analysis
Plants were harvested 60 days after transplantation and analyzed for various parameters. These intervals were chosen to capture variations in growth and physiological parameters as the plants matured. Several key metrics were measured to comprehensively assess plant performance. Data collection for chlorophyll content and Brix (°Bx) was synchronized with the harvest date to ensure consistency and accuracy. The data were recorded in a centralized database and analyzed using SAS 9.4 and R programming language (2024.12.1). The statistical analysis focused on identifying significant differences in plant height, plant leaves, chlorophyll levels in leaves, Brix in leaves, and the fresh weight of the kale and chard leaves harvested from the plants grown in nitrogen treatments. Chlorophyll content was measured using a SPAD-502 Plus Chlorophyll Meter (Konica Minolta, Inc., Tokyo, Japan), with three leaves per plant sampled from each pot in every tower, providing a consistent measure across all samples. For Brix (Brix degrees, °Bx), three leaves per plant were sampled from each pot in every tower at the same 60-day interval, and measurements were taken using a Digital Refractometer PAL-1 (ATAGO USA., Inc., Bellevue, WA, USA). One-way analysis of variance (ANOVA) by R-programming language was conducted to determine the significance of nitrogen treatment effects on parameters. Post hoc tests were performed to identify specific differences across treatments. Principal Component Analysis (PCA) was performed to study the variation in plant parameters with the influence of nitrogen treatments.
3. Results
3.1. Effect of Different Nitrogen Rates on Fresh Weight of Kale and Swiss Chard
Both kale and Swiss chard did not show a statistically significant difference in fresh weight in both trials with four nitrogen treatments. However, there is a notable numerical difference in the mean fresh weight of both crops in two trials. Based on this, the highest fresh weight for kale of 688.08 g was observed in the N_rec treatment in spring, and in fall, the N_high treatment produced the highest fresh weight of 229.77 g, while the lowest was observed in N_0, with 390.25 g in spring and 141.62 g in fall (Table 1). In Swiss chard, the highest yield was observed in the N_high treatment in spring (649.62 g) and fall (400.78 g), while the lowest was observed in N_0 (430.16 g) in spring and N_low (264.21 g) in fall (Table 1 and Figure 2).

Table 1.
Comparisons of mean fresh weight (g) of kale and Swiss chard per tower in different nitrogen treatments (spring and fall trial 2023). Statistical significance among treatments and crops was assessed using ANOVA followed by Tukey’s HSD post hoc test (α = 0.05).
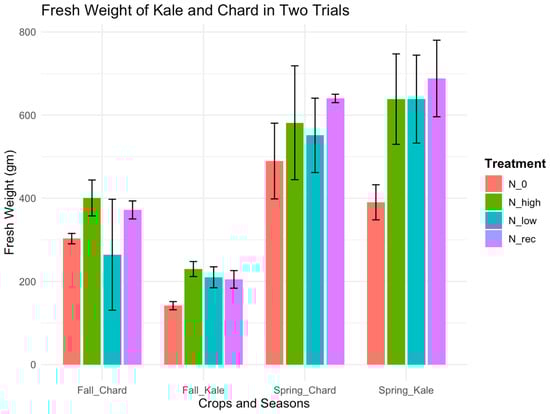
Figure 2.
Fresh weight (gm) of kale and Swiss chard grown under four nitrogen fertilizer treatments, N_0, N_low, N_rec, and N_high, across two seasonal trials (fall and spring) in a vertical farming system. The x-axis shows the crop and season combinations, while the y-axis represents the mean fresh weight (gm) per plant. Bars indicate mean values with standard deviation error bars derived from replicate samples within each treatment group.
3.2. Effect of Different Nitrogen Levels on Plant Height per Tower of Kale and Swiss Chard
The ANOVA analysis revealed that there was statistically significant difference in plant height per tower in Swiss chard in both trials, but not in kale among nitrogen treatments. However, there was a notable numerical difference in mean plant height per tower in kale. The highest plant height of kale was observed in N_rec in both spring (55.53 cm) and fall (46.53 cm) (Table 2), while the lowest was observed in N_0 (48.97 cm) in spring, with 39.97 cm in fall. Swiss chard recorded highest plant height per tower in the N_high treatment in both trials, with 44.82 cm and 48.07 cm, while lowest was recorded in the N_low treatment, with 38.71 cm in spring and 41.96 cm in the fall trial (Table 2 and Figure 3).
Table 2.
Comparisons of mean plant height (cm) of kale and Swiss chard per tower in different nitrogen treatments (spring and fall trial 2023). Statistical significance among treatments and crops was assessed using ANOVA followed by Tukey’s HSD post hoc test (α = 0.05).
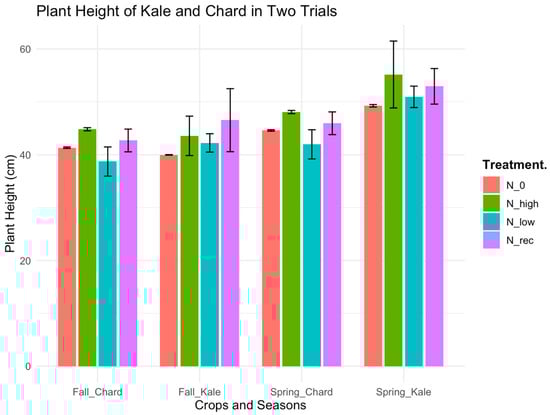
Figure 3.
Plant height (cm) of kale and Swiss chard grown under four nitrogen fertilizer treatments, N_0, N_low, N_rec, and N_high, across two seasonal trials (fall and spring) in a vertical farming system. The x-axis shows the crop and season combinations, while the y-axis represents the mean plant height (cm) per plant. Bars indicate mean values with standard deviation error bars derived from replicate samples within each treatment group.
3.3. Effect of Different Nitrogen Levels on Number of Leaves per Pot of Kale and Swiss Chard
A statistically significant difference in the no. of leaves per nitrogen rate was observed in the fall trial for Swiss chard but not in the spring trial; however, there was no significance in either trial for kale. In the fall trial, the highest number of leaves per pot in Swiss chard was observed in N_rec with 47.25, while the lowest was observed in N_0 with 40 (Table 3). The numerical differences in both trials for kale reveal that the N_high treatment in spring and N_0 in fall produced the lowest number of leaves, with 43.62 and 20.12, respectively (Table 3). The numerical difference in the spring trial for Swiss chard revealed that N_0, with 20.75 leaves per tower, resulted in the fewest leaves per tower (Table 3 and Figure 4).
Table 3.
Comparisons of mean no. of leaves of kale and Swiss chard per pot in different nitrogen treatments (spring and fall trial 2023). Statistical significance among treatments and crops was assessed using ANOVA followed by Tukey’s HSD post hoc test (α = 0.05).
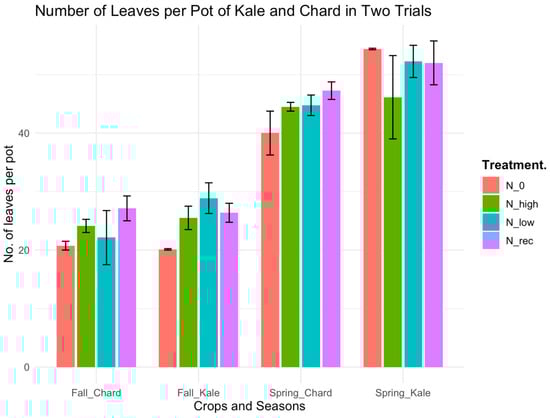
Figure 4.
Number of leaves per pot of kale and Swiss chard grown under four nitrogen fertilizer treatments, N_0, N_low, N_rec, and N_high, across two seasonal trials (fall and spring) in a vertical farming system. The x-axis shows the crop and season combinations, while the y-axis represents the mean no. of leaves per pot. Bars indicate mean values with standard deviation error bars derived from replicate samples within each treatment group.
3.4. Effect of Different Nitrogen Levels on SPAD in Leaves per Tower of Kale and Swiss Chard
The ANOVA analysis revealed that there was no statistically significant difference in SPAD values with regard to nitrogen treatments in the leaves of kale in both trials. Swiss chard showed statistical significance in the spring trial, unlike in the fall trial. However, notable numerical differences indicated that N_rec in kale showed the highest SPAD levels in the spring, with 66.86, and 59.53 by N_0 in the fall (Table 4). Significant results in the spring trial of Swiss chard revealed the highest SPAD level in the N_rec treatment (38.76) and the lowest in N_0 (32.28). In the fall trial, the highest was observed in N_rec (40.75) and the lowest in the N_0 (40.31) treatment (Table 4 and Figure 5) of Swiss chard.
Table 4.
Comparisons of mean chlorophyll readings by SPAD in kale and Swiss chard leaves per tower in different nitrogen treatments (spring and fall trial 2023). Statistical significance among treatments and crops was assessed using ANOVA followed by Tukey’s HSD post hoc test (α = 0.05).
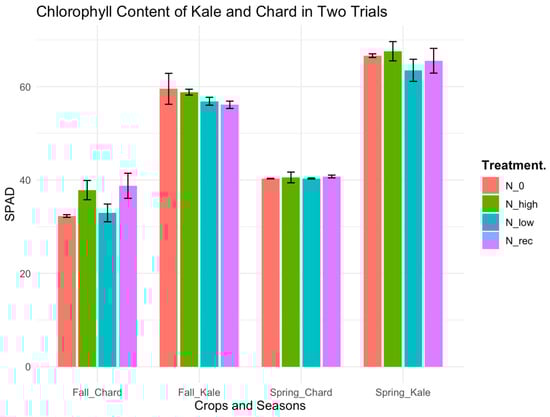
Figure 5.
Chlorophyll content in leaves of kale and Swiss chard grown under four nitrogen fertilizer treatments, N_0, N_low, N_rec, and N_high, across two seasonal trials (fall and spring) in a vertical farming system. The x-axis shows the crop and season combinations, while the y-axis represents the mean chlorophyll content (SPAD). Bars indicate mean values with standard deviation error bars derived from replicate samples within each treatment group.
3.5. Effect of Different Nitrogen Levels on Brix (°Bx) in Leaves per Tower of Kale and Swiss Chard
In kale and Swiss chard, there was no statistically significant difference in both trials for Brix in leaves per tower with the nitrogen treatments. The numerical difference shows that the N_high treatment caused the maximum Brix in leaves per tower for kale in spring (7.21 °Bx) and fall (9.05 °Bx), with the lowest in N_low (5.7 °Bx) in spring and N_0 (7.35 °Bx) in the fall trial (Table 5). In Swiss chard, the maximum Brix was observed in N_0 in spring (4.86 °Bx) and fall (5.22 °Bx), while the lowest was observed in the N_low treatment during spring (3.92 °Bx) and fall (4.68 °Bx) (Table 5 and Figure 6).
Table 5.
Comparisons of mean Brix (°Bx) of kale and Swiss chard leaves per tower in different nitrogen treatments (spring and fall trial 2023). Statistical significance among treatments and crops was assessed using ANOVA followed by Tukey’s HSD post hoc test (α = 0.05).
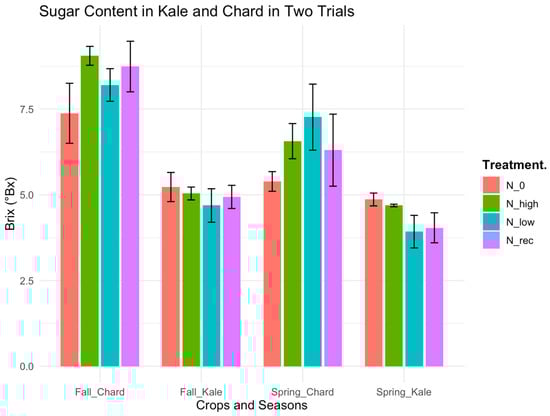
Figure 6.
Sugar content in the leaves of kale and Swiss chard grown under four nitrogen fertilizer treatments, N_0, N_low, N_rec, and N_high, across two seasonal trials (fall and spring) in a vertical farming system. The x-axis shows the crop and season combinations, while the y-axis represents the mean sugar content (Brix (°Bx)). Bars indicate mean values with standard deviation error bars derived from replicate samples within each treatment group.
3.6. Principal Component Analysis (PCA)
PCA was performed to evaluate the variation in plant traits under different nitrogen treatments, N_0, N_low, N_rec, and N_high, based on plant growth parameters such as fresh weight, plant height, number of leaves, SPAD, and Brix (Figure 7, Figure 8, Figure 9 and Figure 10).
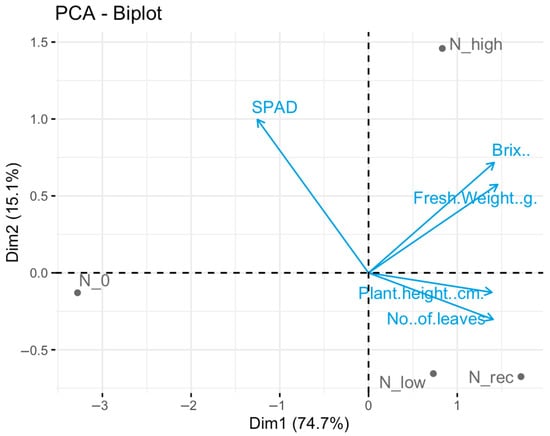
Figure 7.
Principal Component Analysis (PCA) biplot showing the variation in plant parameters of kale under four nitrogen treatments (N_0 = 469.9 ppm, N_low = 1055.3 ppm, N_rec = 1640.9 ppm, and N_high = 2811.3 ppm) during the fall trial. The parameters analyzed included fresh weight, plant height, no. of leaves, SPAD, and Brix. PCA was conducted by using R, and the first two principal components explain 89.9% of total variance. Vectors indicate loading direction and strength for each trait.
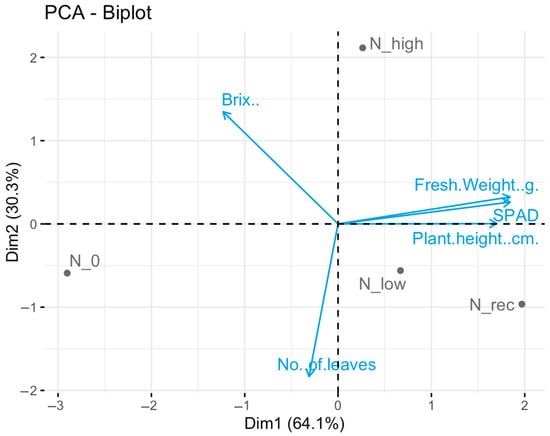
Figure 8.
Principal Component Analysis (PCA) biplot showing the variation in plant parameters of kale under four nitrogen treatments (N_0 = 469.9 ppm, N_low = 1055.3 ppm, N_rec = 1640.9 ppm, and N_high = 2811.3 ppm) during the spring trial. The parameters analyzed included fresh weight, plant height, no. of leaves, SPAD, and Brix. PCA was conducted by using R, and the first two principal components explain 94.4% of total variance. Vectors indicate loading direction and strength for each trait.
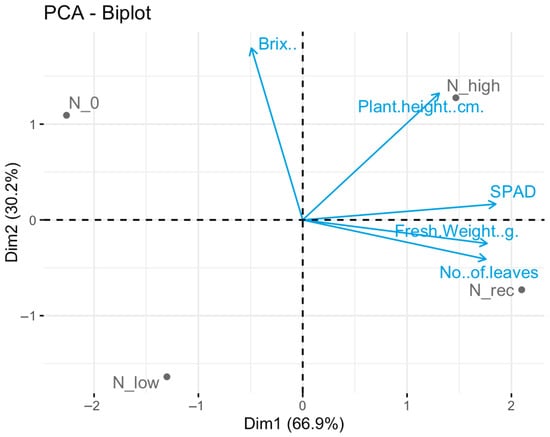
Figure 9.
Principal Component Analysis (PCA) biplot showing the variation in plant parameters of Swiss chard under four nitrogen treatments (N_0 = 469.9 ppm, N_low = 1055.3 ppm, N_rec = 1640.9 ppm, and N_high = 2811.3 ppm) during the fall trial. The parameters analyzed included fresh weight, plant height, no. of leaves, SPAD, and Brix. PCA was conducted by using R, and the first two principal components explain 97.1% of total variance. Vectors indicate loading direction and strength for each trait.

Figure 10.
Principal Component Analysis (PCA) biplot showing the variation in plant parameters of Swiss chard under four nitrogen treatments (N_0 = 469.9 ppm, N_low = 1055.3 ppm, N_rec = 1640.9 ppm, and N_high = 2811.3 ppm) during the spring trial. The parameters analyzed included fresh weight, plant height, no. of leaves, SPAD, and Brix. PCA was conducted by using R, and the first two principal components explain 96.2% of total variance. Vectors indicate loading direction and strength for each trait.
3.6.1. PCA of Kale in Fall Trial
The first two principal components (PCs) explain 89.8% of the total variance in the dataset, with PC1 accounting for 74.7% and PC2 for 15.1% (Figure 7). This indicates that the majority of variation in the measured traits is effectively captured by these two axes. PC1 is strongly positively associated with traits such as Brix, fresh weight, plant height, and no. of leaves, as shown by the long, rightward-pointing vectors. These traits are positively correlated with each other. SPAD is negatively associated with PC1 and shows strong loading in the opposite direction, indicating an inverse relationship with the other traits under analysis. N_high is positioned in the upper right quadrant, indicating high values for Brix, fresh weight, and no. of leaves, consistent with increased biomass and sugar content under high nitrogen. N_rec and N_low cluster relatively close in the lower right quadrant, suggesting moderate trait performance, particularly in terms of vegetative growth traits, though with slightly less vigor than N_high. N_0 is clearly separated in the left quadrant, opposite the direction of the trait vectors. This placement confirms its low performance across most traits, particularly biomass, height, and leaf number, and is likely indicative of nitrogen deficiency. Mean values of each parameter are presented in a bar graph (Figure 2, Figure 3, Figure 4 and Figure 5).
3.6.2. PCA of Kale in Spring Trial
The first two principal components explain a cumulative 94.4% of the total variance, with PC1 accounting for 64.1% and PC2 for 30.3% (Figure 8). This highly explained variance confirms that the PCA effectively captures the main patterns of trait variability across treatments. PC1 (Dim1) is primarily driven by plant height, SPAD, and fresh weight, all showing strong positive loadings in the same direction. This indicates that these three traits are positively correlated and largely responsible for differentiating samples along the horizontal axis. Brix contributes most strongly to PC2, with a large loading in the upward direction, suggesting that its variation is relatively independent of the other traits. The no. of leaves loads strongly downward along PC2, indicating a negative correlation with Brix and a different response pattern from SPAD or fresh weight. The mean values of each parameter are presented in a bar graph (Figure 2, Figure 3, Figure 4 and Figure 5).
The treatment positioning of N_high is located in the upper right quadrant, closely aligned with high SPAD, fresh weight, and Brix values. This implies that high nitrogen levels enhance all measured traits, with the strongest influence on photosynthetic capacity and soluble solids. N_rec is in the lower right quadrant, suggesting strong growth (due to proximity to fresh weight and plant height) but slightly lower Brix than N_high. N_low clusters near N_rec, suggesting a similar trend but with lower magnitude for the traits. N_0 is distinctly separated on the far-left side of PC1, negatively associated with all measured traits, confirming poor performance under nitrogen deficiency. This PCA highlights clear separation between nitrogen treatments and shows that nitrogen availability positively influences biomass production, plant height, and chlorophyll content. Notably, the N_rec treatment performs similarly to N_high in terms of vegetative growth, suggesting it may be a more resource-efficient alternative without major compromises in plant performance.
3.6.3. PCA of Swiss Chard in Fall Trial
The first two principal components explain 96.2% of the total variation. PC1 (Dim1) accounts for 59%. PC2 (Dim2) accounts for 37.2% (Figure 9). This confirms that the biplot captures nearly all the variability in the dataset, making it a reliable representation of trait–treatment relationships. Fresh weight, SPAD, plant height, and no. of leaves load strongly on PC1, all in the positive direction, suggesting that they are positively correlated and mainly influenced by nitrogen input. Brix loads predominantly on PC2, nearly orthogonal to PC1 traits, indicating that sugar content responds independently of biomass or chlorophyll traits. N_high is in the upper right quadrant, aligned with plant height and fresh weight, suggesting enhanced growth under high nitrogen availability. N_rec lies more in the direction of SPAD and no. of leaves, indicating good vegetative performance and efficient photosynthetic capacity. N_low is located far from all trait vectors in the lower left quadrant, indicating overall poor performance across measured traits. N_0 is positioned in the upper left quadrant, aligned more closely with Brix, suggesting higher sugar concentration despite low growth and chlorophyll indices. This PCA clearly illustrates how nitrogen input influences different plant traits; N_high results in the strongest vegetative growth. N_rec promotes efficient physiological performance with good trait balance. N_low underperforms across the board. N_0 triggers elevated Brix levels, likely due to reduced growth, diluting sugar concentration. The mean values of each parameter are presented in a bar graph (Figure 2, Figure 3, Figure 4 and Figure 5).
3.6.4. PCA of Swiss Chard in Spring Trial
The first two principal components explain a combined 97.1% of the variance in the dataset. PC1 (Dim1) explains 66.9%. PC2 (Dim2) accounts for 30.2% (Figure 10). This high cumulative variance indicates strong the explanatory power of the PCA, with Dim1 primarily reflecting vegetative performance and Dim2 contributing additional insight, especially into quality traits. Fresh weight, SPAD, no. of leaves, and plant height load positively on PC1, indicating strong positive correlations among these traits. They collectively represent plant growth and vigor. Brix loads strongly onto PC2 in the positive direction and shows minimal correlations with the other traits, indicating that sugar content varies independently from biomass or chlorophyll levels. N_high is located in the upper right quadrant, closely aligned with plant height and moderately aligned with the other growth-related traits. This placement suggests superior vegetative growth under high nitrogen availability. N_rec falls far to the right, in the direction of SPAD, fresh weight, and no. of leaves, indicating strong overall vegetative growth and chlorophyll content, though slightly lower than N_high. N_low and N_0 are both placed on the left side of PC1, separated from the trait vectors. N_0 is high on PC2 and aligned somewhat with Brix, while N_low is the most negatively loaded treatment overall, suggesting overall poor performance. This PCA underscores the clear separation of nitrogen treatments based on trait expression. Nitrogen fertilization enhances growth (particularly with N_high and N_rec), while the Brix trait follows a more complex pattern, potentially increasing under N stress (N_0), possibly due to osmotic regulation or growth restriction leading to sugar concentration. The mean values of each parameter are presented in a bar graph (Figure 2, Figure 3, Figure 4 and Figure 5).
4. Discussion
The current study aimed to evaluate the influence of various nitrogen rates on the growth parameters and quality traits of kale and Swiss chard across spring and fall trials in 2023. Although most of the results have not shown statistical significance at the 5 percent significance level, the trends and numerical differences across treatments offer preliminary insights into nitrogen response patterns in these crops. However, it is important to interpret these trends with caution due to the lack of statistical significance.
4.1. Fresh Weight Response to Nitrogen Treatments
In kale and Swiss chard, fresh weight did not show statistically significant response to varying nitrogen rates in both research trials. Nevertheless, some numerical differences were noted. In kale, N_rec in spring (688.08 g) and N_high in fall (229.77 g) produced the highest fresh weights. These findings were not statistically confirmed, suggest that nitrogen supplementation may support biomass production compared to N_0. Although the results should be interpreted cautiously, these patterns may hold practical relevance for urban farmers using less sophisticated vertical systems [,]. In urban agriculture, the recommended nitrogen rate (N_rec) may provide a reasonable balance between productivity and sustainability, as highlighted in previous work [,]. Swiss chard exhibited the highest yields under N_high across the seasons, particularly in fall. While not statistically significant, this suggests a potential benefit of nitrogen enrichment, although environmental and ecological risks of excessive nitrogen, such as leaching and emissions, must be considered [].
4.2. Plant Height Trends and Significance
A statistically significant effect of nitrogen rate on plant height was observed in Swiss chard, with the N_high treatment consistently resulting in the tallest plants (44.83 cm in spring and 48.08 cm in fall). Kale did not show any statistical significance in height response, although mean heights were slightly higher in nitrogen-treated plots. These results align with earlier findings that leafy greens like Swiss chard are responsive to nitrogen for vegetative growth [,]. The lack of significance in kale could be attributed to its different growth patterns or nutrient uptake efficiency.
4.3. Number of Leaves per Tower
Statistically significant differences were observed only in the fall trial of Swiss chard, where N_rec produced the highest leaf count (47.25). Although other comparisons did not reach statistical significance, nitrogen-treated plots generally had higher leaf counts; these predictions need to be evaluated in future studies. These trends, particularly in Swiss chard, point to a possible role of nitrogen in promoting foliage, but should be confirmed with future trials.
4.4. Chlorophyll Content (SPAD Readings)
SPAD readings, used to assess the chlorophyll and nitrogen content in leaves, showed a significant treatment effect only in the spring trial of Swiss chard. In this case, N_rec had the highest SPAD values, while N_0 had the lowest. Kale and fall Swiss chard trials did not show significant differences; though numerically, nitrogen treatments tended to increase SPAD values. These trends align with nitrogen’s role in chlorophyll synthesis [], but the lack of consistent statistical significance highlights the need for more controlled studies.
4.5. Leaf Sugar Content (Brix (°Bx))
No significant treatment effects were detected for Brix in either crop across seasons. Despite this, numerical data revealed some interesting numerical patterns. In kale, N_high consistently resulted in the highest Brix values. Conversely, Swiss chard showed the highest Brix values in the N_0 treatments across both trials. Although the results were not statistically significant, increased Brix values under high nitrogen in kale could reflect changes in metabolic activity under nitrogen enrichment []. Without statistical significance, no firm conclusions can be drawn, and future research is needed to explore the physiological responses in these crops.
4.6. Variations in Plant Growth Parameters by Principal Component Analysis (PCA)
PCA revealed the variation in parameter deviation with various nitrogen treatments. In the fall trial of kale, high nitrogen availability (N_high) significantly enhanced plant productivity and quality (as seen in Brix and fresh weight). N_rec and N_low maintained moderate performances, potentially representing efficient or sustainable nitrogen use without the penalties of full deficiency. N_0 severely limited growth and quality traits, justifying the need for nitrogen fertilization. In the spring trial of kale, the strong positive correlations between SPAD, fresh weight, and plant height suggest that nitrogen directly promotes photosynthetic efficiency and biomass accumulation. Brix, though positively influenced by N, showed a more nuanced response, peaking with N_high but not tightly correlated with growth metrics. This could indicate a physiological trade-off between sugar accumulation and vegetative growth. The number of leaves behaved differently from the other traits, with its vector nearly orthogonal to the others, suggesting that leaf count may not be a reliable proxy for biomass or quality in this context.
In the fall trial of Swiss chard, the tight clustering of growth traits (height, fresh weight, and no. of leaves) along PC1 highlights nitrogen’s strong role in boosting vegetative performance. SPAD also correlated with growth traits but leaned more toward PC2, suggesting some variability in how nitrogen affects chlorophyll content across treatments. Brix showed unique behavior, being the most positively aligned with N_0. This may be due to sugar accumulation resulting from restricted vegetative growth, a typical stress response. In the spring trial of Swiss chard, N_high supported the maximal plant height and respectable levels of SPAD and biomass, reinforcing the positive role of abundant nitrogen. N_rec was nearly as effective as N_high for enhancing chlorophyll content and leaf production, indicating a good balance of input and output efficiency. N_0, while lacking in growth performance, showed positive alignment with Brix, suggesting a possible compensatory mechanism where plants allocate more sugars under nutrient stress. N_low showed poor performance across all traits, suggesting it may be insufficient to support both growth and sugar production.
The significant differences between groups, particularly the clear separation of N_high and N_0 from N_low and N_rec, can be attributed to how nitrogen availability directly regulates plant growth and physiological responses. N_high provides abundant nitrogen, which strongly drives biomass accumulation, chlorophyll synthesis, and photosynthetic activity, resulting in significantly higher fresh weight and quality traits compared to moderate treatments. In contrast, N_0, representing complete nitrogen deficiency, severely restricts vegetative growth and reduces chlorophyll content, producing the lowest fresh weight among treatments. Meanwhile, N_low and N_rec supply enough nitrogen to support moderate-to-optimal growth without the excesses of N_high or the severe limitations of N_0. This explains why N_low and N_rec often clustered together in productivity metrics, balancing plant performance with more efficient fertilizer use, whereas N_high and N_0 occupied opposite extremes due to their contrasting effects on nitrogen availability.
4.7. Future Research Directions
While this study provides critical insights into nitrogen management in vertical farming systems, several avenues for future research remain, such as exploring the interaction of nitrogen rates with other environmental variables, such as light intensity and humidity, to optimize resource use efficiency under varying climatic conditions [,]. Although statistically significant results were limited, observed numerical trends suggest nitrogen fertilizer application, specifically with N_rec and N_high rates, may influence growth parameters such as biomass, plant height, and chlorophyll content. This study had the limitation of employing two replications, but each replication had 256 plants per crop. Future studies can use more replications to achieve statistical stability and conclude solid implications, as well as to evaluate the economic feasibility of nitrogen management strategies in urban vertical farming systems, considering both short-term yield gains and long-term sustainability []. Although both 6-12-28 (N-P-K) and 15-0-0 (N-P-K) were used in all treatments, only the nitrogen content from 15-0-0 (N-P-K) was altered, while 6-12-28 fertilizer remained constant to prevent changes in phosphorus and potassium levels in all the treatments. While the high tunnel provided a protected environment, it lacked active climate control. As a result, environmental variables such as temperature and humidity likely fluctuated over time and could have affected plant growth and treatment efficacy, and more extensive studies on this aspect needed to be explored by collecting climatic conditions in the high tunnel. However, because all treatments were subjected to the same conditions, we expect any environmental influence to have been evenly distributed across replicates. Nevertheless, future studies under controlled conditions are recommended to isolate treatment effects more precisely.
5. Conclusions
This study explored the effects of varying nitrogen rates on the growth and quality parameters of kale and Swiss chard across two trials. While most parameters did not exhibit statistically significant differences at the level of 5 percent, consistent numerical trends highlighted the influence of nitrogen fertilizer application, particularly at N_rec and N_high application rates, which may positively influence fresh weight, plant height, number of leaves, and chlorophyll content. PCA revealed the variations among the plant growth parameters relative to nitrogen treatments, which can be referred to when studying the interactions among the treatments and parameters. However, the N_high treatment displayed high nitrogen input, which may not be environmentally sustainable, though no plant toxicity was reported in plants. While some metrics such as height and chlorophyll content appeared numerically higher in Swiss chard, the data do not offer strong statistical support for concluding that Swiss chard showed more improvement than kale. Therefore, any crop-specific recommendations should be made cautiously and supported by further research. These findings underscore the importance of strategic nitrogen management in optimizing leafy green production, especially in vertical farming systems. Future research may incorporate larger sample sizes, a great range of nitrogen treatments, and additional physiological measurements such as nutrient use efficiency and metabolic profiling to better understand nitrogen dynamics and guide sustainable fertilization strategies for organic vegetable production.
Author Contributions
Conceptualization, D.N.; methodology, D.N.; software, A.J. and S.P.N.; validation, D.N., A.J. and S.P.N.; formal analysis, A.J. and S.P.N.; investigation, A.J., S.P.N., A.W. and S.C.; resources, D.N. and A.W.; data curation, D.N., A.J. and S.P.N.; writing—original draft preparation, A.J. and S.P.N.; writing—review and editing, D.N., S.P.N. and A.W.; visualization, D.N., S.P.N. and A.W.; supervision, D.N. and A.W.; project administration, D.N.; funding acquisition, D.N. All authors have read and agreed to the published version of the manuscript.
Funding
Funding for the study was provided by the Natural Resources and Conservation Service (NRCS) to Dilip Nandwani.
Data Availability Statement
Data are stored in the institutional lab and computer on the main campus.
Conflicts of Interest
The authors declare no conflict of interest.
References
- Eigenbrod, C.; Gruda, N. Urban Vegetable for Food Security in Cities. A Review. Agron. Sustain. Dev. 2015, 35, 483–498. [Google Scholar] [CrossRef]
- Al-Kodmany, K. The Vertical Farm: A Review of Developments and Implications for the Vertical City. Buildings 2018, 8, 24. [Google Scholar] [CrossRef]
- Despommier, D. The Vertical Farm: Feeding the World in the 21st Century; Macmillan: New York, NY, USA, 2011. [Google Scholar]
- Kozai, T.; Niu, G.; Takagaki, M. (Eds.) Plant Factory: An Indoor Vertical Farming System for Efficient Quality Food Production; Academic Press: Cambridge, MA, USA, 2019. [Google Scholar]
- Al-Chalabi, M. Vertical Farming: Skyscraper Sustainability? Sustain. Cities Soc. 2015, 18, 74–77. [Google Scholar] [CrossRef]
- Graamans, L.; Baeza, E.; Van Den Dobbelsteen, A.; Tsafaras, I.; Stanghellini, C. Plant Factories versus Greenhouses: Comparison of Resource Use Efficiency. Agric. Syst. 2018, 160, 31–43. [Google Scholar] [CrossRef]
- Kalaivanan, D. Soilless Culture of Vegetables. In Proceedings of the International Conference INGB, Goa, India, 6–8 November 2019. [Google Scholar]
- Musazura, W. Effect of ABR Effluent Irrigation on Swiss Chard (Beta vulgaris subsp. Cicla) Growth and Nutrient Leaching. Ph.D. Thesis, University of KwaZulu-Natal, Pietermaritzburg, South Africa, 2014. [Google Scholar]
- Avgoustaki, D.; Xydis, G. Indoor Vertical Farming in the Urban Nexus Context: Business Growth and Resource Savings. Sustainability 2020, 12, 1965. [Google Scholar] [CrossRef]
- Kwon, C.; Ediriweera, M.K.; Kim Cho, S. Interplay between Phytochemicals and the Colonic Microbiota. Nutrients 2023, 15, 1989. [Google Scholar] [CrossRef] [PubMed]
- Johnson, M.S.; Lucero, M.E.; Havstad, K.M. Enhancing Nutrient Uptake Efficiency in Hydroponic Systems through the Use of Beneficial Microbes. Agronomy 2020, 10, 389. [Google Scholar]
- Benke, K.; Tomkins, B. Future Food-Production Systems: Vertical Farming and Controlled-Environment Agriculture. Sustain. Sci. Pract. Policy 2017, 13, 13–26. [Google Scholar] [CrossRef]
- Jung, D.H.; Choi, S.; Lee, J. Changes in the Growth, Photosynthesis, and Nitrogen Allocation Characteristics of Hydroponically Grown Lettuce under Different Nitrate Levels in a Nutrient Solution. Hortic. Environ. Biotechnol. 2025, 66, 163–172. [Google Scholar] [CrossRef]
- Thapa, U.; Nandi, S.; Rai, R.; Upadhyay, A. Effect of Nitrogen Levels and Harvest Timing on Growth, Yield and Quality of Lettuce under Floating Hydroponic System. J. Plant Nutr. 2022, 45, 2563–2577. [Google Scholar] [CrossRef]
- Banerjee, C.; Adenaeuer, L. Up, Up and Away! The Economics of Vertical Farming. J. Agric. Stud. 2014, 2, 40–60. [Google Scholar] [CrossRef]
- Kalantari, F.; Tahir, O.M.; Joni, R.A.; Fatemi, E. Opportunities and Challenges in Sustainability of Vertical Farming: A Review. J. Landsc. Ecol. 2018, 11, 35–60. [Google Scholar] [CrossRef]
- Duke University. Economic Viability of Vertical Farming: Overcoming Financial Obstacles to a Greener Future; U.S. Environmental Policy: Washington, DC, USA, 2019. [Google Scholar]
- Balkaya, A.; Yanmaz, R. Promising Kale (Brassica oleracea var. acephala) Populations from Black Sea Region, Turkey. N. Z. J. Crop Hortic. Sci. 2005, 33, 1–7. [Google Scholar] [CrossRef]
- Ninfali, P.; Angelino, D. Nutritional and Functional Potential of Beta vulgaris Cicla and Rubra. Fitoterapia 2013, 89, 188–199. [Google Scholar] [CrossRef] [PubMed]
- Ali, A.; Niu, G.; Masabni, J.; Ferrante, A.; Cocetta, G. Integrated Nutrient Management of Fruits, Vegetables, and Crops through the Use of Biostimulants, Soilless Cultivation, and Traditional and Modern Approaches—A Mini Review. Agriculture 2024, 14, 1330. [Google Scholar] [CrossRef]
- Echer, M.D.M.; Zoz, T.; Rossol, C.D.; Steiner, F.; Castagnara, D.D.; Lana, M.D.C. Densidade de Plantio e Adubação Nitrogenada em Acelga. Hortic. Bras. 2012, 30, 703–707. [Google Scholar] [CrossRef]
- Miceli, A.; Miceli, C. Effect of Nitrogen Fertilization on the Quality of Swiss Chard at Harvest and during Storage as Minimally Processed Produce. J. Food Qual. 2014, 37, 125–134. [Google Scholar] [CrossRef]
- Teuber, O.; Samarappuli, D.; Berti, M. Nitrogen and Sulfur Fertilization in Kale and Swede for Grazing. Agronomy 2020, 10, 619. [Google Scholar] [CrossRef]
- Barickman, T.C.; Kopsell, D.A. Nitrogen Form and Ratio Impact Swiss Chard (Beta vulgaris subsp. cicla) Shoot Tissue Carotenoid and Chlorophyll Concentrations. Sci. Hortic. 2016, 204, 99–105. [Google Scholar] [CrossRef]
Disclaimer/Publisher’s Note: The statements, opinions and data contained in all publications are solely those of the individual author(s) and contributor(s) and not of MDPI and/or the editor(s). MDPI and/or the editor(s) disclaim responsibility for any injury to people or property resulting from any ideas, methods, instructions or products referred to in the content. |
© 2025 by the authors. Licensee MDPI, Basel, Switzerland. This article is an open access article distributed under the terms and conditions of the Creative Commons Attribution (CC BY) license (https://creativecommons.org/licenses/by/4.0/).