Article

Characterization and Expression Profiling of Orphan Genes in Rapeseed (Brassica napus) Provide Insights into Tissue Development and Cold Stress Adaptation

1
School of Agriculture, Jilin Agricultural Science and Technology College, Jilin 132101, China
2
Institute of Vegetables and Flowers, Chinese Academy of Agricultural Sciences, Beijing 100081, China
*
Author to whom correspondence should be addressed.
These authors contributed equally to this work.
Horticulturae 2025, 11(7), 826; https://doi.org/10.3390/horticulturae11070826
Submission received: 8 June 2025 / Revised: 27 June 2025 / Accepted: 10 July 2025 / Published: 11 July 2025
(This article belongs to the Special Issue Genetics and Molecular Breeding of Brassica Crops)

Abstract

Orphan genes (OGs) lack homologs in related species and have been associated with adaptive evolution. However, it is poorly characterized in Brassica napus (rapeseed). This study aims to identify and characterize OGs in rapeseed to evaluate their association with stress adaptation and lineage-specific traits. Through comprehensive comparative genomics analysis, all rapeseed genes were categorized into four distinct evolutionary classes. Furthermore, bioinformatics analyses were carried out to evaluate the structural, evolutionary, and expression dynamics, which were further validated by qRT-PCR analysis of different tissues and in cold stress. In total, 4 B. napus OGs (BnaOGs), 2859 Brassica-specific genes (BSGs), 9650 Cruciferae-specific genes (CSGs), and 94,720 evolutionarily conserved genes (ECGs) were identified. BnaOGs and BSGs indicated shorter sequences, higher GC content, fewer transcription factors, and limited functional annotation compared to ECGs. Similarly, transcriptomic analysis determined the tissue-specific and stress-responsive expression patterns in BnaOGs and BSGs. qRT-PCR validation revealed four BnaOGs and five BSGs from different tissue-specific and cold-responsive expression modules in rapeseed. Overall, this study identified OGs associated with lineage-specific adaptation in rapeseed, potentially related to cold tolerance and phenotypic diversity. The identified expression patterns and structural divergence provide novel insights for breeding stress-resilient varieties.

1. Introduction

Orphan genes (OGs) lack detectable homologs in related species and originate from non-coding sequences by duplication, divergence, or de novo emergence [1,2]. OGs are ubiquitous in all species and serve essential physiological roles; however, the exact molecular mechanisms by which OGs mediate different biological processes remain mainly unknown [3]. It has been observed that OGs have shorter sequences, fewer introns, and lack recognizable domains or motifs, complicating their functional characterization and indicating highly specific expression patterns limited to specific tissues or developmental stages [1]. Although OGs have unique molecular features that distinguish them from conserved genes, they were first identified using comparative genomics, which entails discovering conserved genes shared among numerous species [4]. Recent studies have revealed that OGs are widely distributed across the plant kingdom, including in Brassica rapa [5], Citrus sinensis [6], Coriandrum sativum [7], Medicago sativa [8], and 12 banana species [9]. Furthermore, they are evolutionary pioneers with novel protein space and minimal constraints, offering adaptive potential in dynamic environments, while remaining mechanistically enigmatic but biologically significant [10]. The functional significance of OGs has been increasingly supported by various studies, such as functional genomic analyses have revealed that OGs have diverse biological roles, such as species-specific adaptations [11,12,13,14,15,16], regulation of specialized metabolic pathways [17,18,19] and core cellular processes [20,21,22], and stress responses [23,24,25,26,27]. Although these results demonstrate the functional significance of OGs, their genomic architecture and evolutionary dynamics, particularly regarding innovation mechanisms and adaptive potential across plant lineages, remain insufficiently explored. The genomic diversity and adaptive capability of the economically significant crop rapeseed remain elusive due to the lack of systematic identification and functional characterization of its OGs.
Originating approximately 7500 years ago through natural hybridization between diploid progenitors B. rapa and B. oleracea, B. napus, also known as rapeseed, is a globally significant oilseed crop that contributes 13–16% of vegetable oil production [28,29,30]. Since then, its genetic diversity has increased through introgression from B. rapa and synthetic hybrids. Rapeseed comprises three ecotypes (winter, semi-winter, and spring) that facilitate adaptation to varying latitudes and climates and serve as vegetables, animal feed, biofuel, and nectar-producing plants in addition to their ecological and agricultural uses [31,32]. Other than its oil content, the functional versatility of rapeseed stems from its diverse biochemical composition, which includes flavonoids, lipids, proteins, fiber, and bioactive phytochemicals [33,34]. The nutritional significance of rapeseed’s oil content is its lipid, which is valued for its high levels of unsaturated fatty acids, vitamin E, sterols, and ferulic acid, which collectively promote cardioprotective, anti-inflammatory, and other health-promoting effects [35]. Recently, the whole rapeseed genome sequencing was completed, and a multi-omics database was established, making it easy to identify OGs [36]. Rapeseed’s unique characteristics, including its polyploid origin, varied ecotypes, important nutritional components, and sophisticated genetic resources, make it especially well suited for studying OGs.
Modern rapeseed genetic diversity and adaptive capacity have been shaped by B. rapa introgression and Asian–European hybridization, with progenitor trait introgression accelerating adaptation through genetic load reduction [37]. Rapeseed is being globally cultivated because of its remarkable ecophysiological adaptability to diverse climates, with selective diversification promoting variation in key agronomic traits including winter hardiness, vernalization requirements, and photoperiod-responsive flowering [38]. Cold stress induces intricate physiological and molecular responses in rapeseed, which are critically associated with its growth performance, yield potential, and geographical adaptation [39,40,41]. Therefore, elucidating the molecular mechanisms of cold resistance in rapeseed, identifying key genes, and developing cold-resistant cultivars are essential strategies for ensuring yield stability in rapeseed production. OGs have been linked with lineage-specific adaptation and persistent sources of evolutionary innovation [1]. Therefore, this study hypothesized that multiple OGs become functionally significant during rapeseed domestication and may promote the development of key agronomic traits and response to stresses, offering promising targets for crop improvement research.
Using a stringent homologous comparison method [7], rapeseed genes were categorized into four classes: B. napus OGs (BnaOGs), Brassica-specific genes (BSGs), Cruciferae-specific genes (CSGs), and evolutionary-conserved genes (ECGs). Moreover, transcriptome sequencing and qRT-PCR analysis were carried out to systematically identify the expression patterns of BnaOGs and BSGs in multiple tissues and cold stress conditions, providing a basis for elucidating OG functions in rapeseed.

2. Materials and Methods

2.1. Database Retrieval

The sequences of B. napus ZS11v0 were retrieved from the rapeseed multi-omics database (BnIR, https://yanglab.hzau.edu.cn/BnIR/) in 10 November 2024. All genomes were downloaded from Phytozome (https://phytozome-next.jgi.doe.gov/ (accessed on 11 November 2024)), the Brassica database (BRAD, http://brassicadb.cn/#/ (accessed on 11 November 2024)), and BnIR in 12 November 2024. Other databases were used following established procedures [7] and analysis was conducted from December 2024 to January 2025.

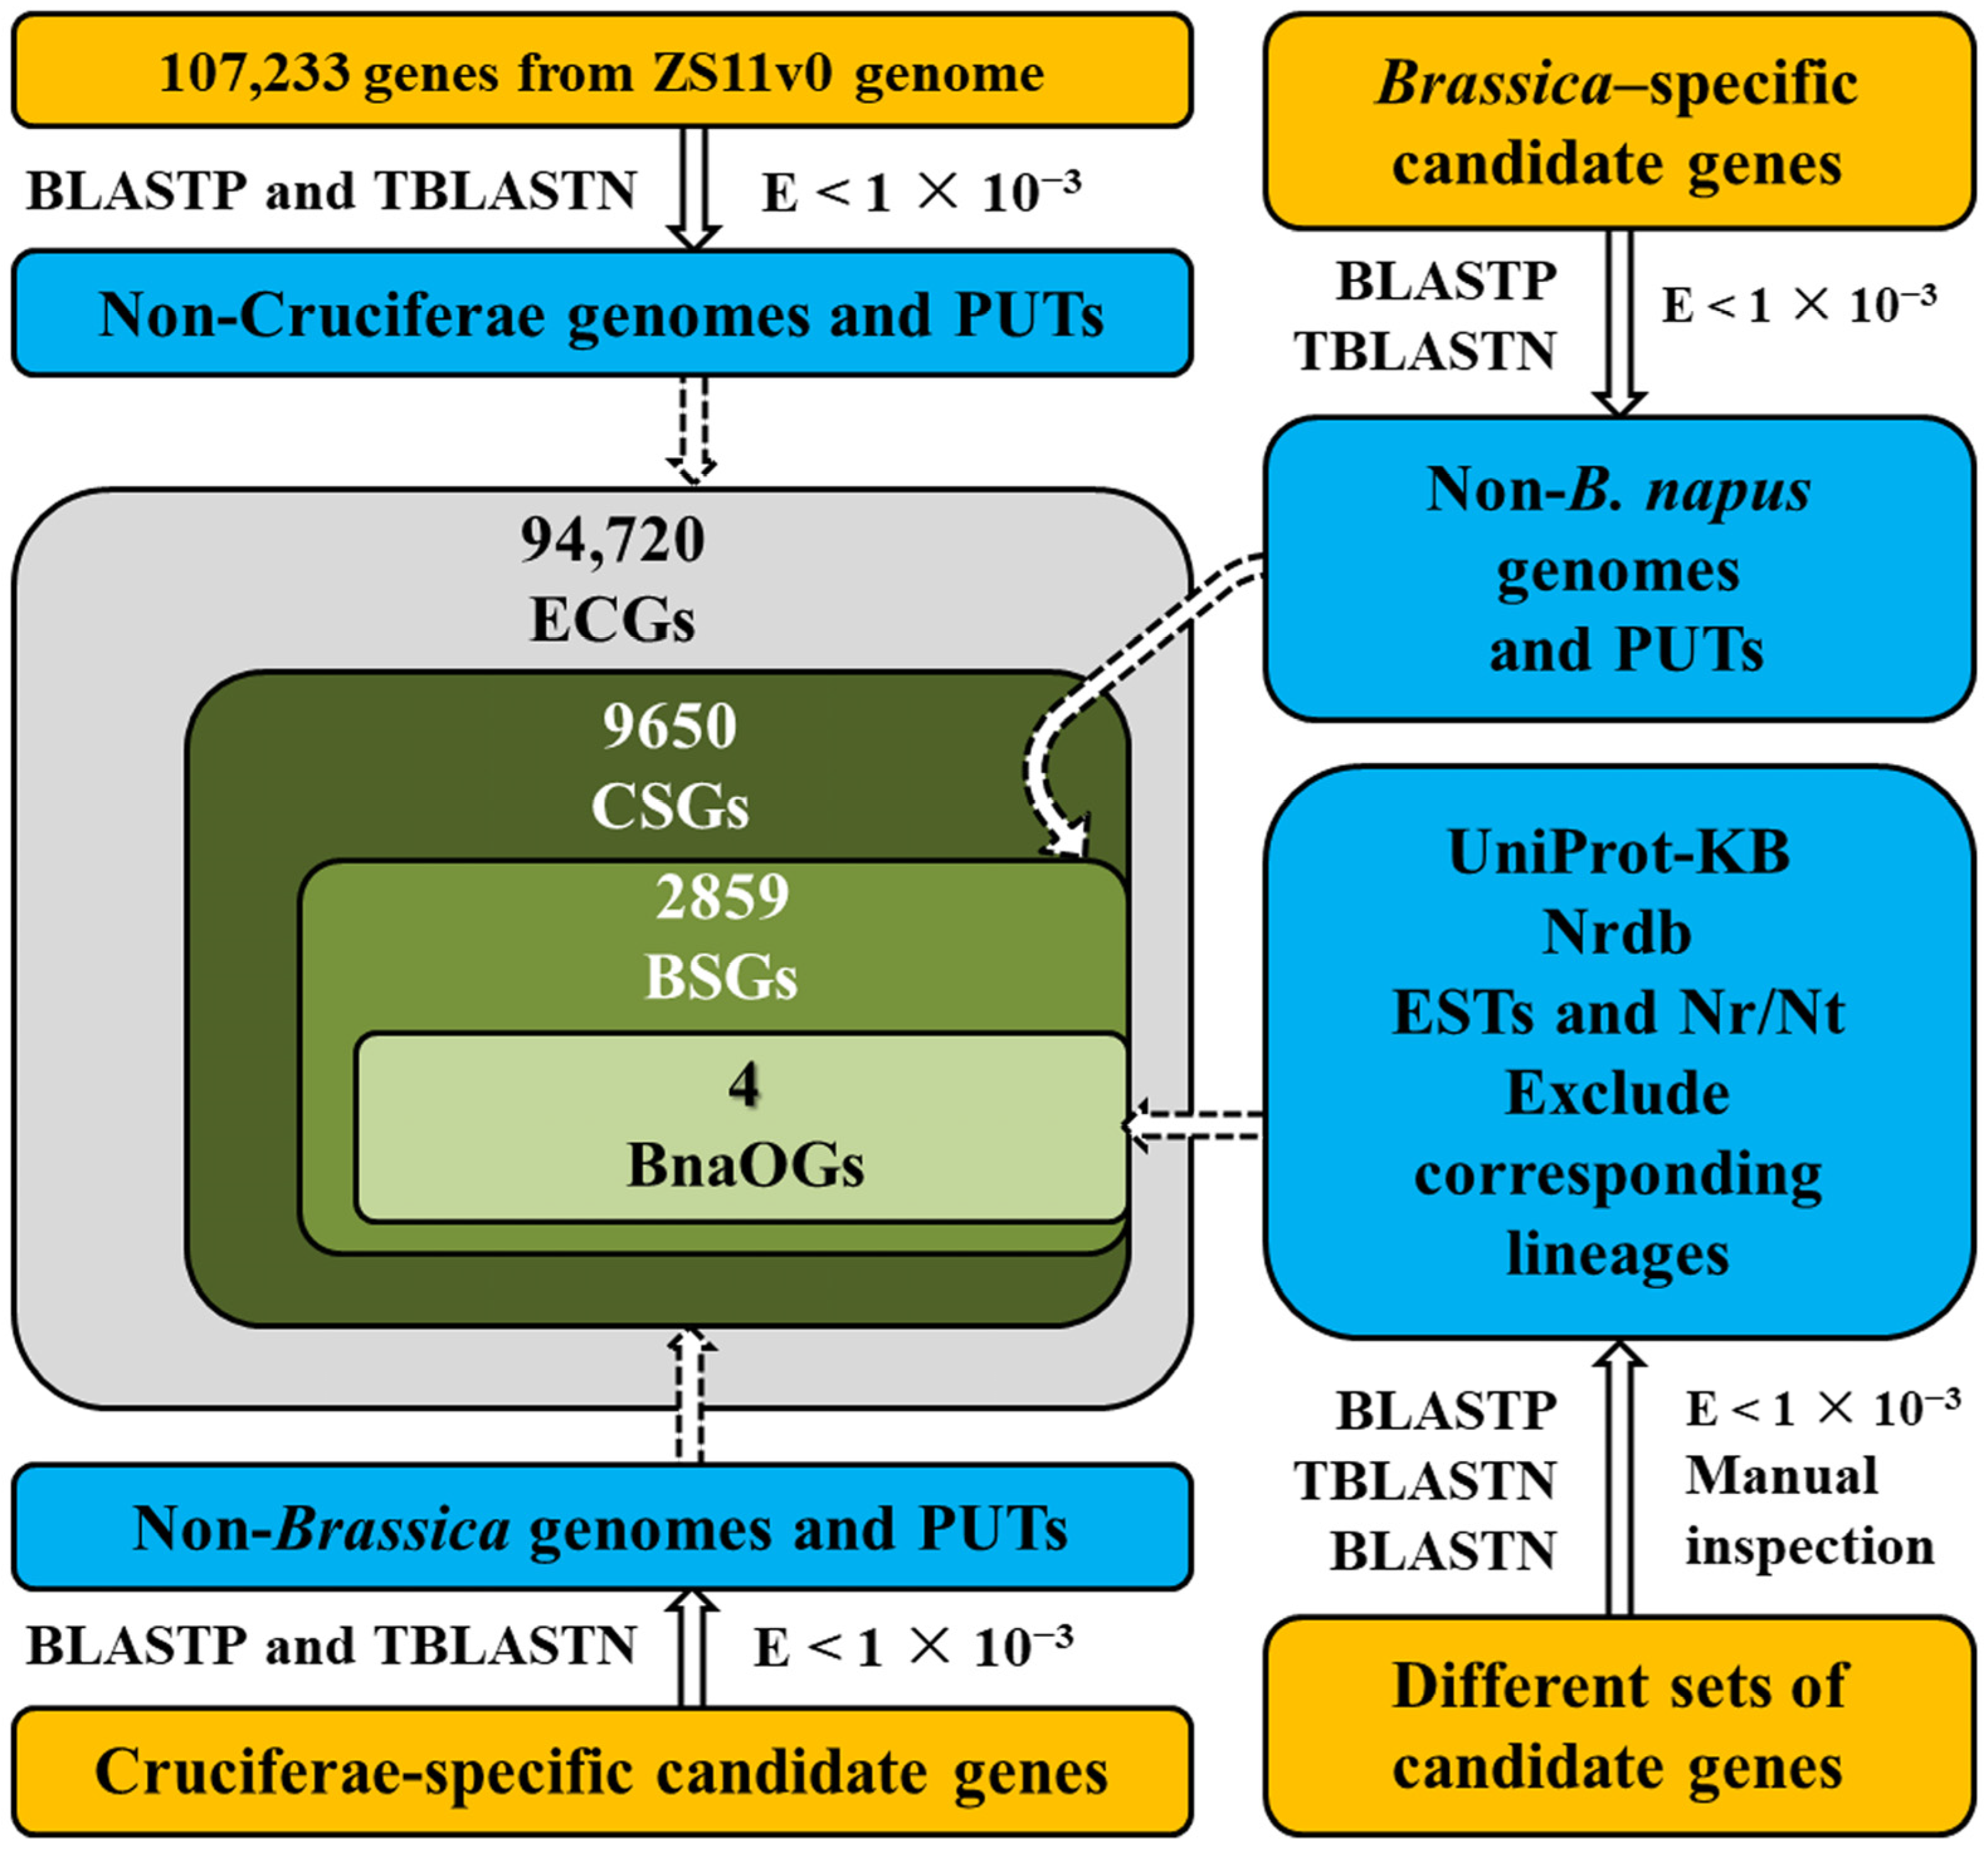
2.2. Homology Screening and Classification

Homology screening was carried out by following previously published protocols with an E < 1 × 10⁻³ [7]. The genes were classified into four groups: BnaOGs, BSGs, CSGs, and ECGs. BnaOGs represented genes exclusively in B. napus, BSGs comprised at least one homolog in other Brassica species, excluding rapeseed, CSGs had at least one homolog in Cruciferae species other than the Brassica genus, and ECGs had at least one homologous sequence other than the Cruciferae family.

2.3. Bioinformatic Characterization

Different genes’ chromosomal distribution data were obtained from the BnIR. Furthermore, the length of the coding sequence (CDS) and protein, the GC content, and the AT/GC ratio of CDS were analyzed. Transcription factors (TFs) were predicted within different gene sets on BnIR. Moreover, the protein-conserved domains were predicted via the PfamScan online tool of the Majorbio Cloud Platform (https://cloud.majorbio.com/page/tools/ (accessed on 15 January 2025)). Further, Coding Potential Calculator 2 (CPC2, http://cpc2.cbi.pku.edu.cn (accessed on 18 January 2025)) was employed to assess protein-coding potential. Subcellular localization prediction was analyzed using the MultiLoc online tool v2.0 at the Majorbio Cloud Platform.

2.4. Functional Annotation and Expression Profiling

Functional annotation of different gene categories was performed at BnIR. Transcriptomic analysis of BnaOGs and BSGs was performed based on the RNA-seq data of the BnIR. RNA-seq data analysis was conducted according to a previously established bioinformatics protocol [7]. Visualization of expression patterns was performed with TBtools-II software v2.310 [42].

2.5. Sampling and qRT-PCR Analysis

The rapeseed variety ZS11 (B. napus) seeds were purchased from the Wuhan Zhongyou Seed Industry Technology Co., Ltd. (Wuhan, China) and cultivated under long-day conditions (16 h light/8 h dark photoperiod) at a constant temperature of 25 °C and 60% relative humidity. After 4 weeks, root, stem, leaf, petiole, and shoot apex were harvested with 3 biological replicates of 10 plants each. These 4-week-old rapeseed plants were then subjected to cold stress at 4 °C. The 4 °C treatment temperature was selected based on established protocols in rapeseed cold stress research [43]. Subsequently, leaf tissues were sampled directly upon completion of each cold treatment interval: CK (0 h, control), C1 (2 h), C2 (4 h), C3 (8 h), C4 (12 h), C5 (24 h), and C6 (48 h), leaf tissues were collected with three biological replicates (3 plants/replicate). All collected samples were immediately flash-frozen in liquid nitrogen and stored at −80 °C for further analysis. cDNA synthesis, RNA extraction, and qRT-PCR were carried out as previously described [7]. The internal controls for qRT-PCR analysis were the BnaPPR and BnaGDI1 genes [44]. Relative expression was determined via the 2−ΔΔCt method [45]. All primer sequences used in this study are provided in Table 1.

2.6. Statistical Analysis and Data Visualization

The qRT-PCR data were subjected to a one-way analysis of variance (ANOVA) followed by Duncan’s multiple comparison test. All analyses were carried out using IBM SPSS Statistics software (v26.0), and data are presented as the mean ± standard error (SE). For graphical representations, GraphPad Prism (v8.0.2) and TBtools-II (v2.310) software were employed.

3. Results

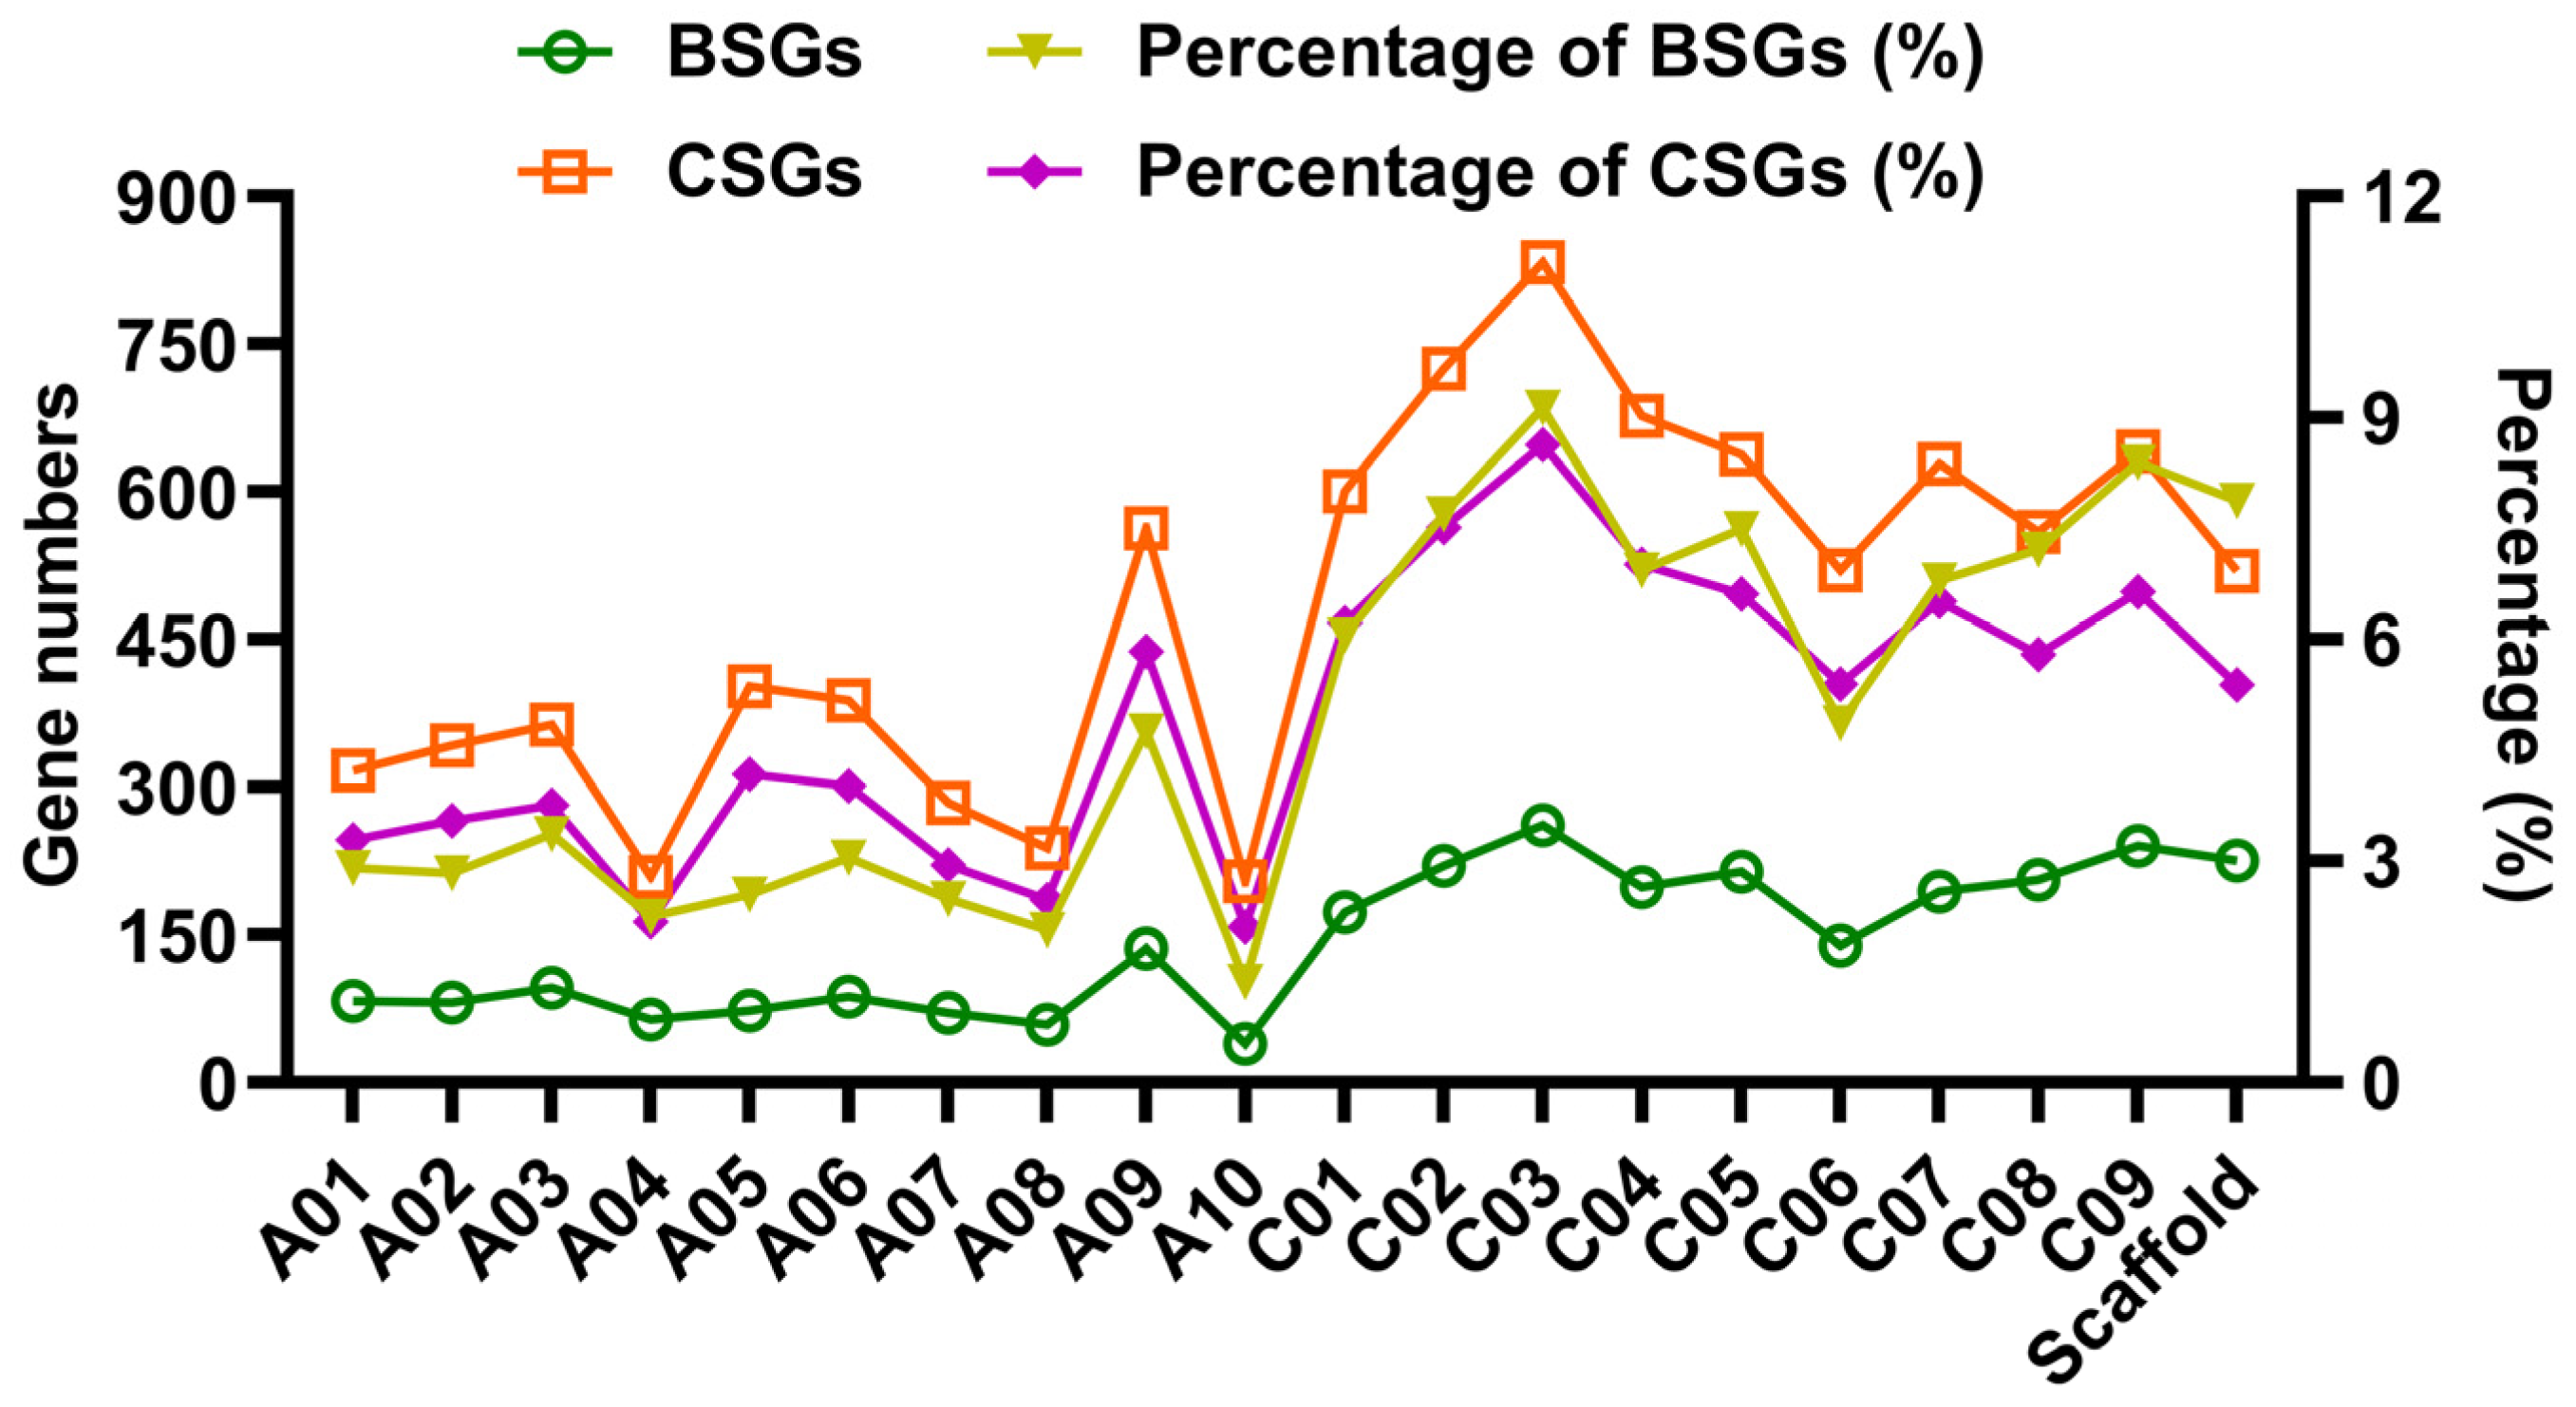
3.1. Identification and Classification of OGs in Rapeseed

A stringent manual inspection approach integrating transcriptomic and plant genomic sequence data was employed to screen BnaOGs, BSGs, CSGs, and ECGs. Furthermore, 107,233 rapeseed genes were identified and classified from the ZS11v0 genome using BLASTP, TBLASTN, and BLASTN (v2.16.0) (E < 1 × 10⁻³). The comparative genomic analysis against genomes and PlantGDB-generated unique transcripts (PUTs) revealed candidate BnaOGs, BSGs, CSGs, and ECGs by carefully excluding sequences from corresponding lineages (Figure 1). Moreover, to improve identification accuracy and reduce false positives, candidate BnaOGs, BSGs, and CSGs were manually validated against multiple databases, including UniProt Knowledgebase (UniProt-KB), non-redundant protein database (Nrdb), Expressed Sequence Tag (EST), and Nr/Nt databases. Comprehensive screening identified and classified the gene sets into 4 categories: 4 BnaOGs, 2859 BSGs, 9650 CSGs, and 94,720 ECGs.
The chromosomal distribution and proportional representation of only BSGs and CSGs were examined, and BnaOGs were excluded due to their limited number (Figure 2). Chromosomal distribution analysis demonstrated that BSGs and CSGs maintained relatively uniform distribution patterns across all 19 chromosomes, with mean proportions of 4.85% and 4.98%, respectively. Furthermore, the comparative analysis indicated variation in gene distribution, with chromosome C03 containing the maximal concentrations of BSGs (9.13%) and CSGs (8.63%), contrasting sharply with the minimal proportions found on chromosome A10 (1.36% and 2.11%, respectively). This distribution pattern suggests that longer chromosomes harbor greater numbers of these OGs. Moreover, unassembled scaffold regions had 225 BSGs (7.87%) and 519 CSGs (5.38%), highlighting that these OGs may reside in structurally complex genomic regions containing repetitive elements or structural variations that challenge chromosome-scale assembly.

3.2. Structural and Evolutionary Divergence of Different Gene Categories

The structural and evolutionary features of different gene categories were systematically characterized through multiple computational analyses, including sequence length distribution, GC content variation, predictive assessments of TFs, domain architecture, coding potential, and subcellular localization. The results indicated that the average CDS and protein lengths of BnaOGs, BSGs, and CSGs were substantially shorter than those of ECGs (Figure 3A). Furthermore, BnaOGs had the highest GC content (56.19%) and lowest AT/GC ratio (0.84), suggesting a strong GC bias (Figure 3B), whereas BSGs (46.80%), CSGs (45.45%), and ECGs (46.67%) indicated relatively balanced GC/AT distributions, with AT/GC ratios exceeding 1. Moreover, CSGs had the most pronounced AT preference (AT/GC ratio = 1.23), followed by BSGs (1.19) and ECGs (1.16). Moreover, TFs analysis revealed significant categorical differences, with ECGs comprising the highest TF numbers (5453) and proportion (5.76%), followed by minimal representation in CSGs (2, 0.02%) and complete absence in both BSGs and BnaOGs (Figure 3C). These patterns suggest strong evolutionary conservation of TF-encoding potential within ECGs and near-complete exclusion from other OG classes.
The prediction of protein domain showed a graded distribution, with ECGs indicating the highest domain content (70,901 genes, 74.85%), followed by CSGs (376, 3.90%), BSGs (1, 0.03%), and complete absence in BnaOGs (Figure 3D). This hierarchical distribution pattern indicates significant functional divergence and specific evolutionary trajectories between these gene classes. Further, the coding potential analysis revealed that BnaOGs (75.00%) and BSGs (74.01%) comprised a higher proportion of non-coding genes, whereas CSGs (53.80%) and ECGs (91.15%) were enriched in coding genes (Figure 3E). Subcellular localization prediction revealed distinct compartmentalization patterns across gene categories (Figure 3F). Moreover, BnaOGs showed marked specialization, with 75% cytoplasmic and 25% ER localization. BSGs and CSGs also indicated similar distribution patterns, with predominant localization in the cytoplasm (48.79–55.88%) and extracellular (15.77–16.55%), with minor organellar components. However, ECGs showed the most diversified localization, with substantial cytoplasmic representation (46.53%), along with significant nuclear (10.27%), chloroplast (11.28%), and other organellar localizations, which were absent in other gene categories. Stepwise acquisition of organellar targeting signatures from BnaOGs to ECGs may mirror the evolutionary development of subcellular functional specialization. These findings highlighted the structural and evolutionary divergence of BnaOGs, BSGs, and CSGs relative to ECGs.

3.3. Functional Annotation of Different Gene Categories

To assess the functional characterization and evolutionary divergence of various gene categories (BnaOGs, BSGs, CSGs, and ECGs), the functional annotation coverage of these gene categories was comprehensively compared across four major databases (GO, KEGG, SwissProt, and NR). Functional annotation analysis revealed a progressive increase in characterization levels across different gene categories (Figure 4A). Furthermore, BnaOGs were not annotated in all four databases, and only 29 BSGs showed minimal functional characterization (1.01%) (Figure 4B). Moreover, 2264 CSGs showed intermediate annotation levels (23.46%) (Figure 4C), while 76,371 ECGs had substantially higher functional assignment rates (80.63%) (Figure 4D), indicating that it was the best-characterized group in this analysis. The exceptional ECGs annotation coverage suggests that these genes represent well-characterized functional elements. The near-zero annotation of BSGs and BnaOGs could indicate non-canonical biological roles or novel functions that are not currently represented in databases. These results may reflect fundamental differences in evolutionary origin and functional importance among these gene categories.

3.4. Dynamic Expression Patterns of BnaOGs During Different Tissues and Stress Adaptation

To elucidate the potential adaptive functions of BnaOGs, the expression dynamics of four BnaOGs were systematically analyzed in critical tissues and during stress responses. RNA-seq data of BnIR in different tissues and stress-related treatments were used to detect the expression patterns of four BnaOGs. Of the identified BnaOGs, BnaC09G0092200ZS (BnaOG4) showed high transcript abundance (average FPKM > 5 across tissues), while BnaC02G0325900ZS (BnaOG2) indicated moderate expression (average FPKM > 1), whereas the remaining BnaOGs, BnaC01G0509900ZS (BnaOG1) and BnaC03G0392700ZS (BnaOG3) maintained near-undetectable levels (Figure 5A and Table S1). Furthermore, under different stress conditions, the BnaOGs indicated distinct expression patterns (Figure 5B); BnaOG3 was transcriptionally silent, BnaOG4 maintained constitutively high expression (average FPKM > 5), BnaOG2 showed constitutive basal expression (average FPKM < 1), and BnaOG1 had marked stress-responsive induction (average FPKM > 1), indicating significant upregulation under salt, drought, heat, freezing, and cold stresses (Figure 5B and Table S1). The data revealed that the four BnaOGs had characteristic functional specializations, where BnaOG4 showed constitutive high expression patterns, suggesting housekeeping roles in fundamental metabolic processes. BnaOG1 may function as a multi-stress responder, indicating significant transcriptional induction under diverse abiotic stresses, whereas BnaOG3 remained transcriptionally silent, potentially indicating pseudogenization. Overall, these results validated that BnaOGs’ functional diversification in coordinating developmental programs and adaptive responses in rapeseed is mediated by expression partitioning.

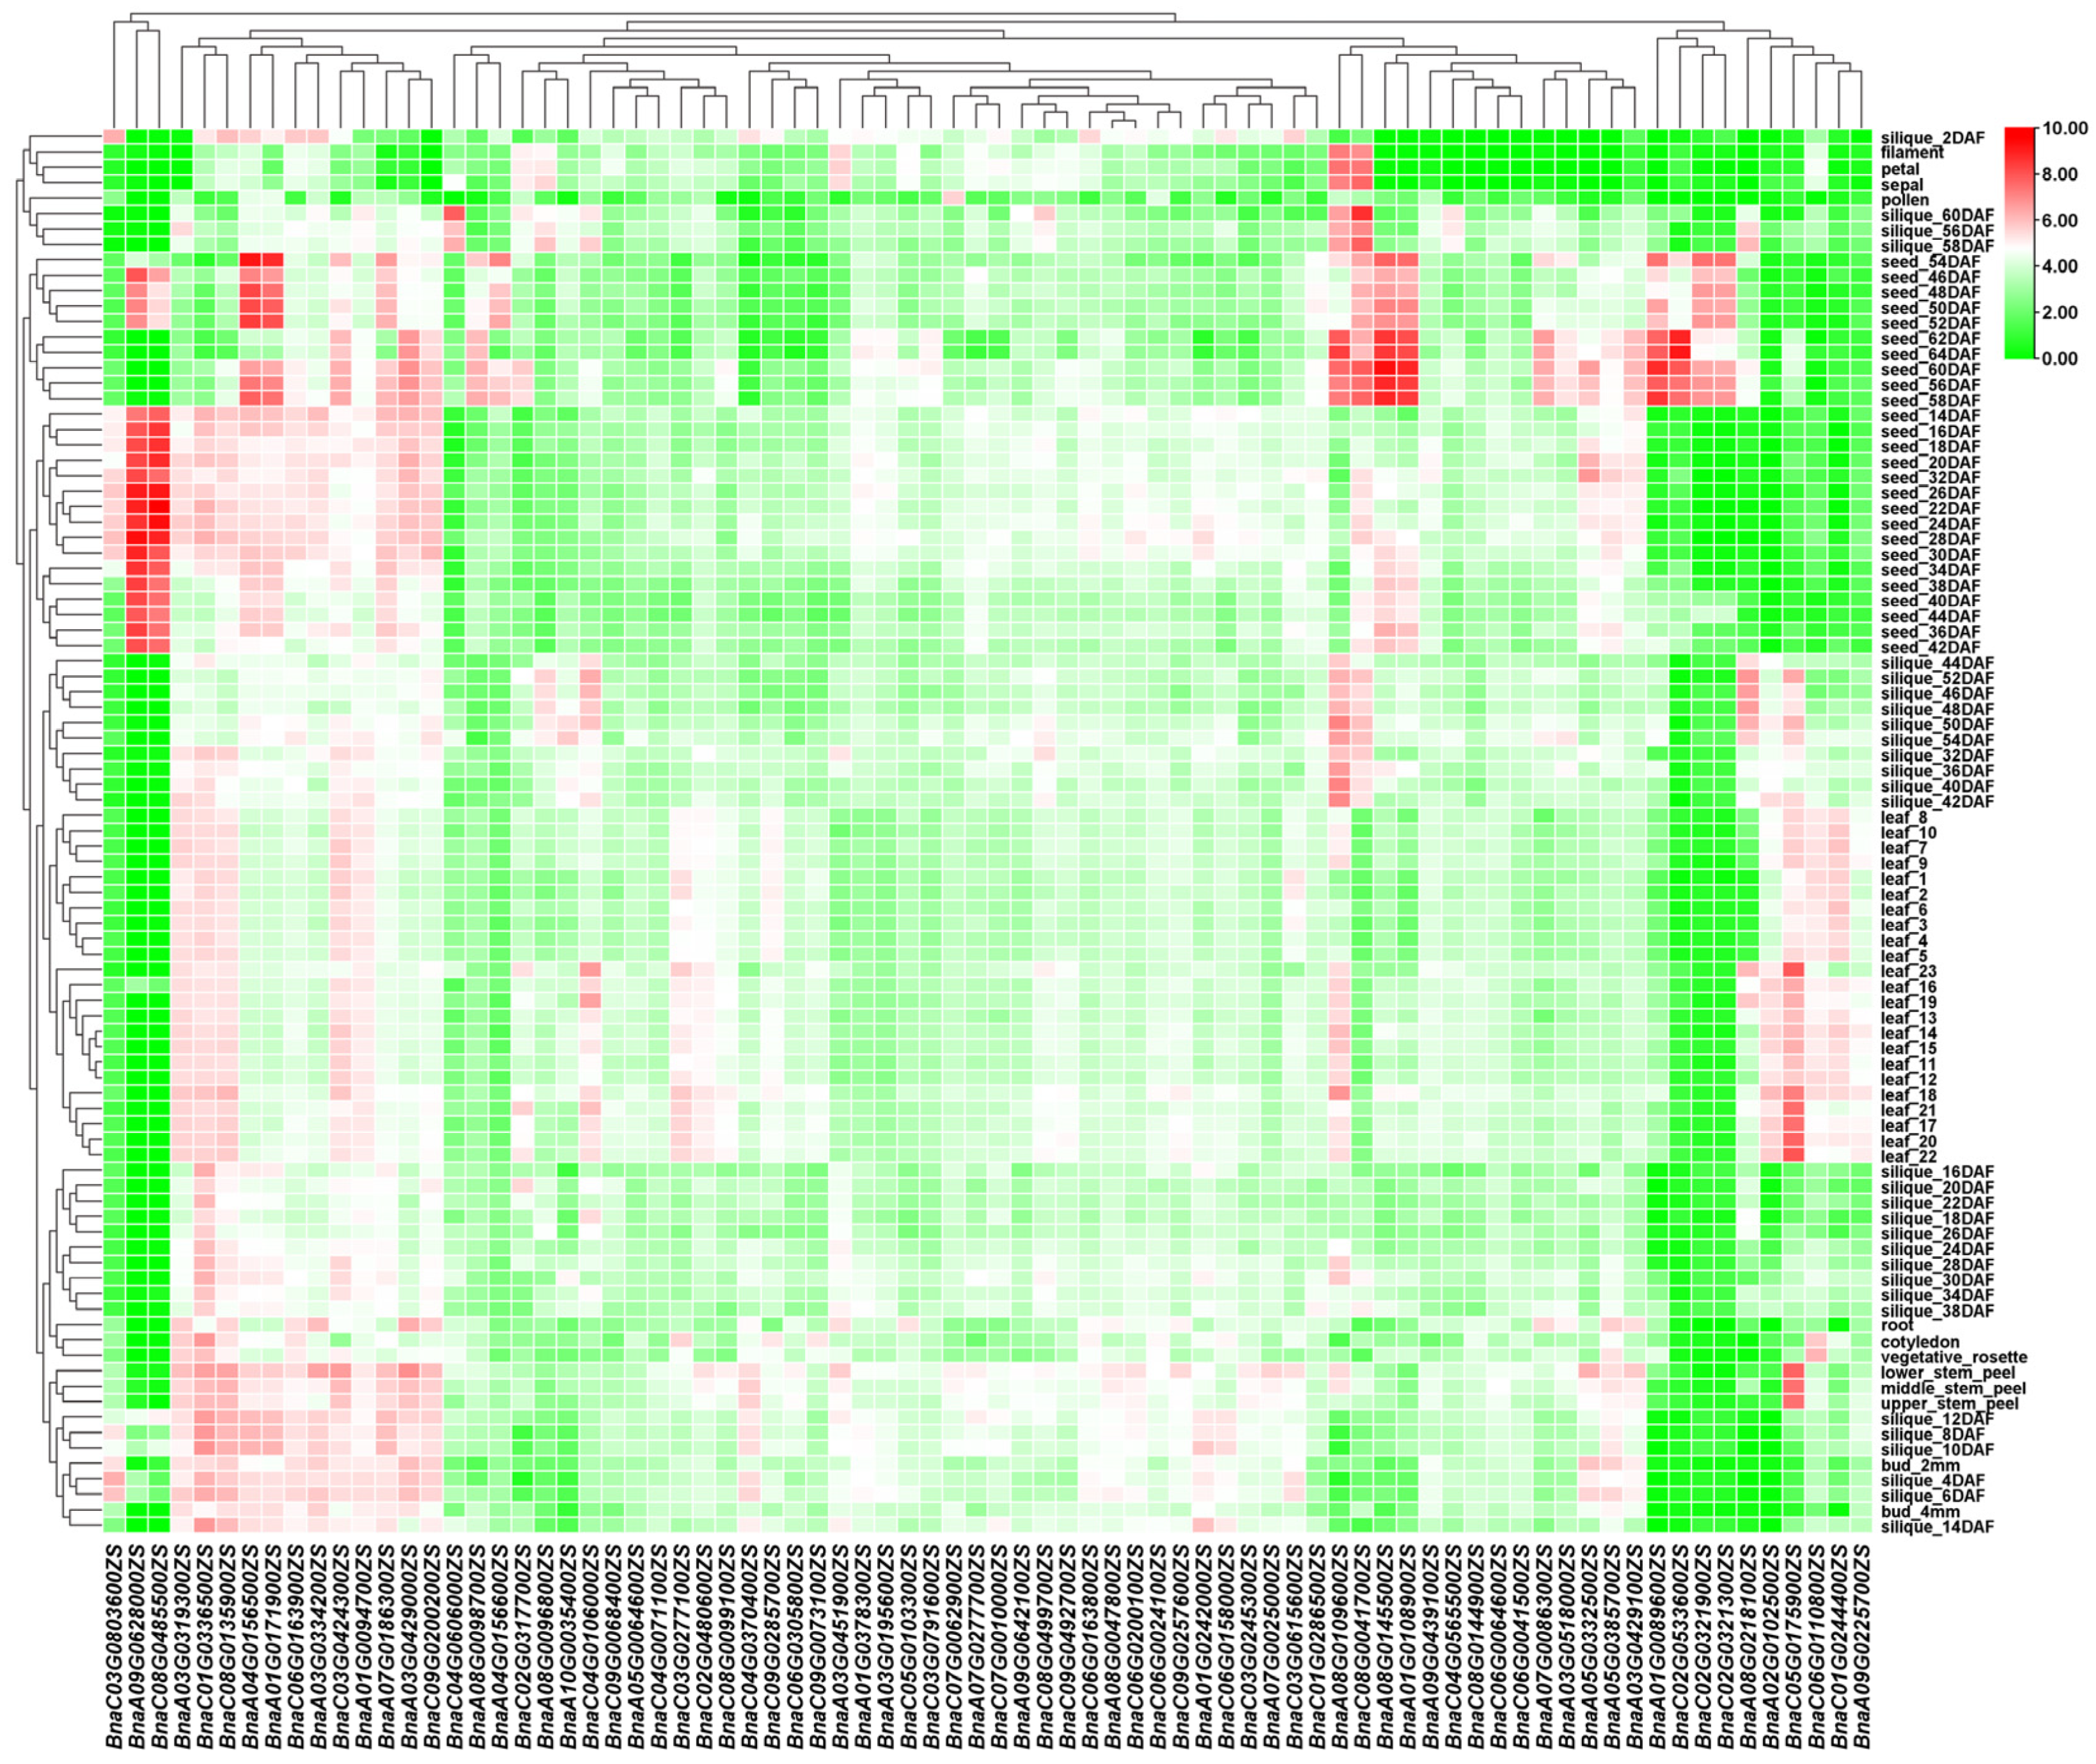
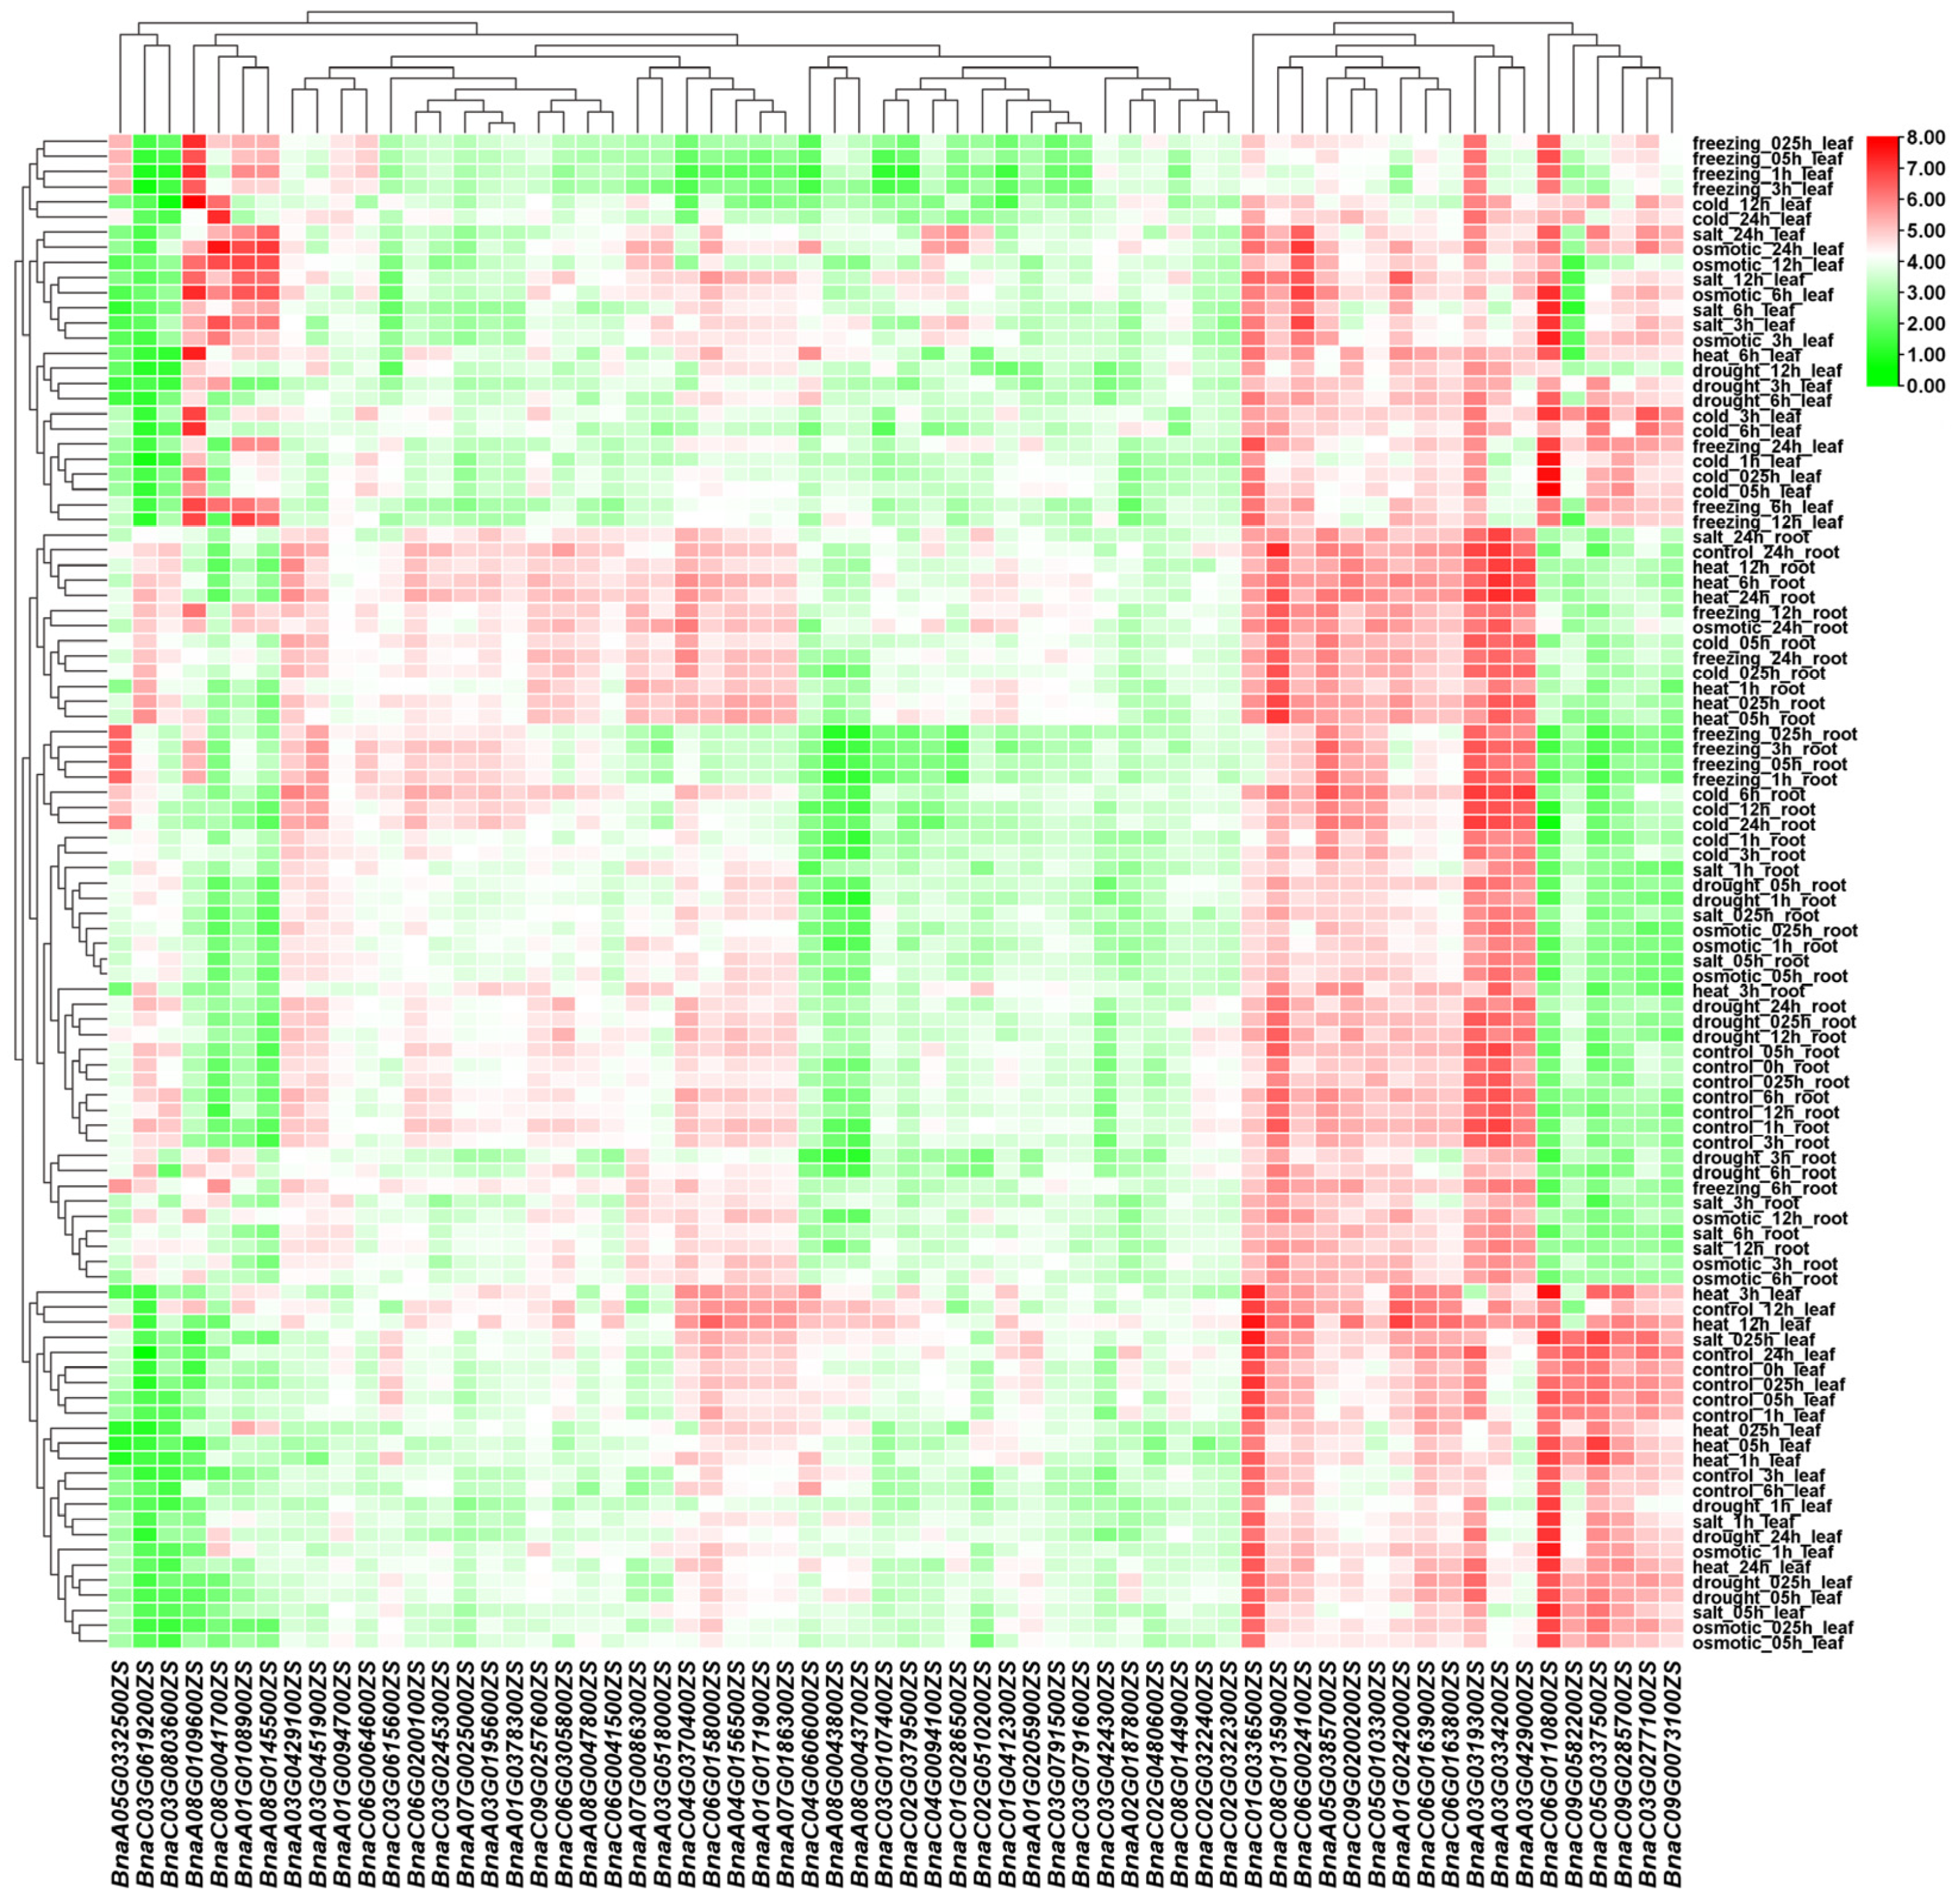
3.5. Tissue-Specific and Stress-Responsive Expression Profiles of BSGs

Based on the phylogenetic identification of BSGs, it was hypothesized that these BSGs have distinct tissue-specific expression patterns and stress-responsive regulation, which was investigated by comprehensive transcriptomic profiling. Transcriptomic analysis of 2637 BSGs (excluding scaffold regions) identified 1984 genes (75.24%) with detectable expression (average FPKM > 0), 334 BSGs with moderate expression (average FPKM ≥ 2), and 78 BSGs with high expression levels (average FPKM ≥ 10) (Figure 6 and Table S2). The expression analysis of 2637 BSGs across multiple stress conditions identified 2338 genes with no or low expression (average FPKM < 2), 299 BSGs with constitutive expression (average FPKM ≥ 2), and 64 highly expressed genes (average FPKM ≥ 10) (Figure 7 and Table S3). Transcriptome analysis identified 2170 expressed BSGs (average FPKM > 0), comprising 294 tissue-specific, 186 stress-responsive, and 1690 constitutively expressed genes in different tissues or stress conditions. These findings suggest that different BSGs have tissue-specific or stress-responsive expression patterns, whereas, in rapeseed, many BSGs are transcriptionally silent or minimally expressed, indicating their potential roles in uncharacterized tissues, distinct developmental phases, or untested stress conditions.

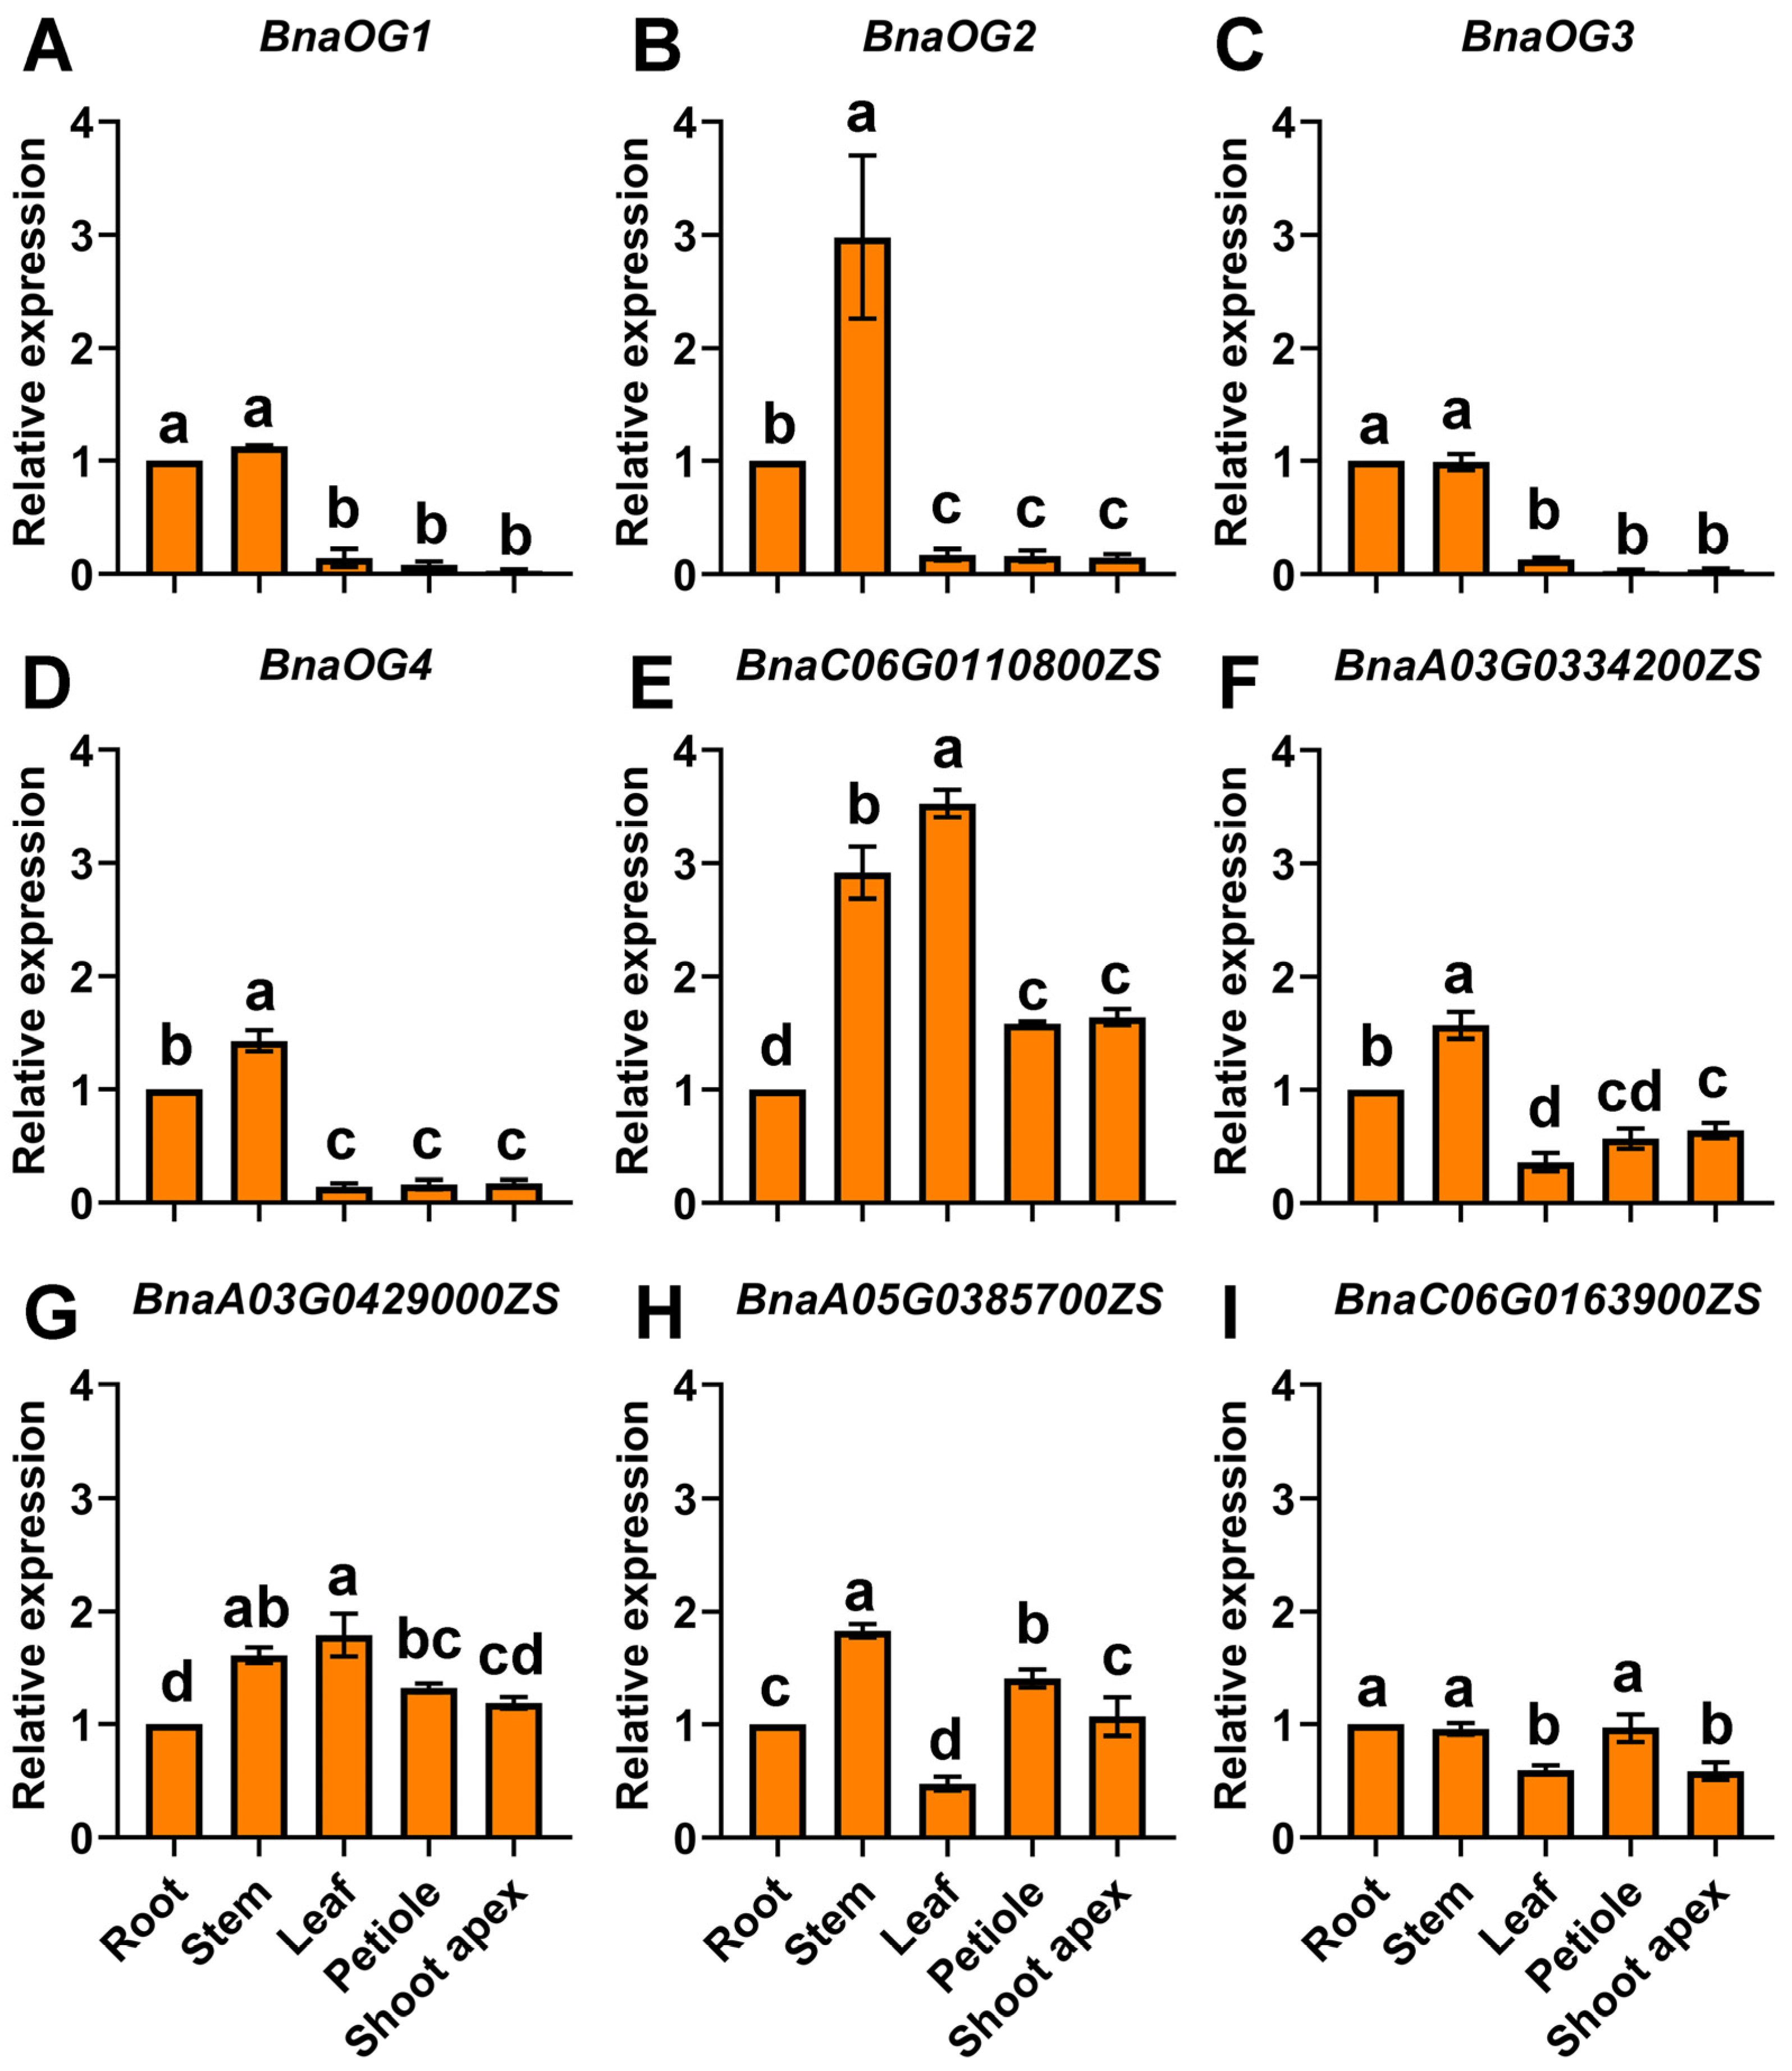
3.6. Tissue-Specific Expression of BnaOGs and Core BSGs

The expression patterns of four BnaOGs and five BSGs indicated significant tissue-specific variation in five major plant tissues during the seedling stage (Figure 8). Furthermore, BnaOG1 and BnaOG3 had markedly similar tissue-specific expression profiles, with predominant expression in root and stem tissues, while substantially reduced expression in other organs. Transcriptional analysis indicated that BnaOG2, BnaOG4, and BnaA03G0334200ZS had markedly similar expression patterns, with predominant accumulation in stem and root tissues relative to other organs. BnaC06G0110800ZS and BnaA03G0429000ZS indicated increased expression in leaf and stem tissues, and BnaA05G0385700ZS was upregulated in stems and petioles. Comparatively, BnaC06G0163900ZS showed a characteristic root-stem-petiole enriched pattern with stable high expression in roots, stems, and petioles but significantly lower levels in leaves and shoot apex. These findings showed specific expression patterns of BnaOGs and BSGs in different tissues, suggesting that subsequent functional specialization may induce complex tissue-specific regulatory pathways in rapeseed.

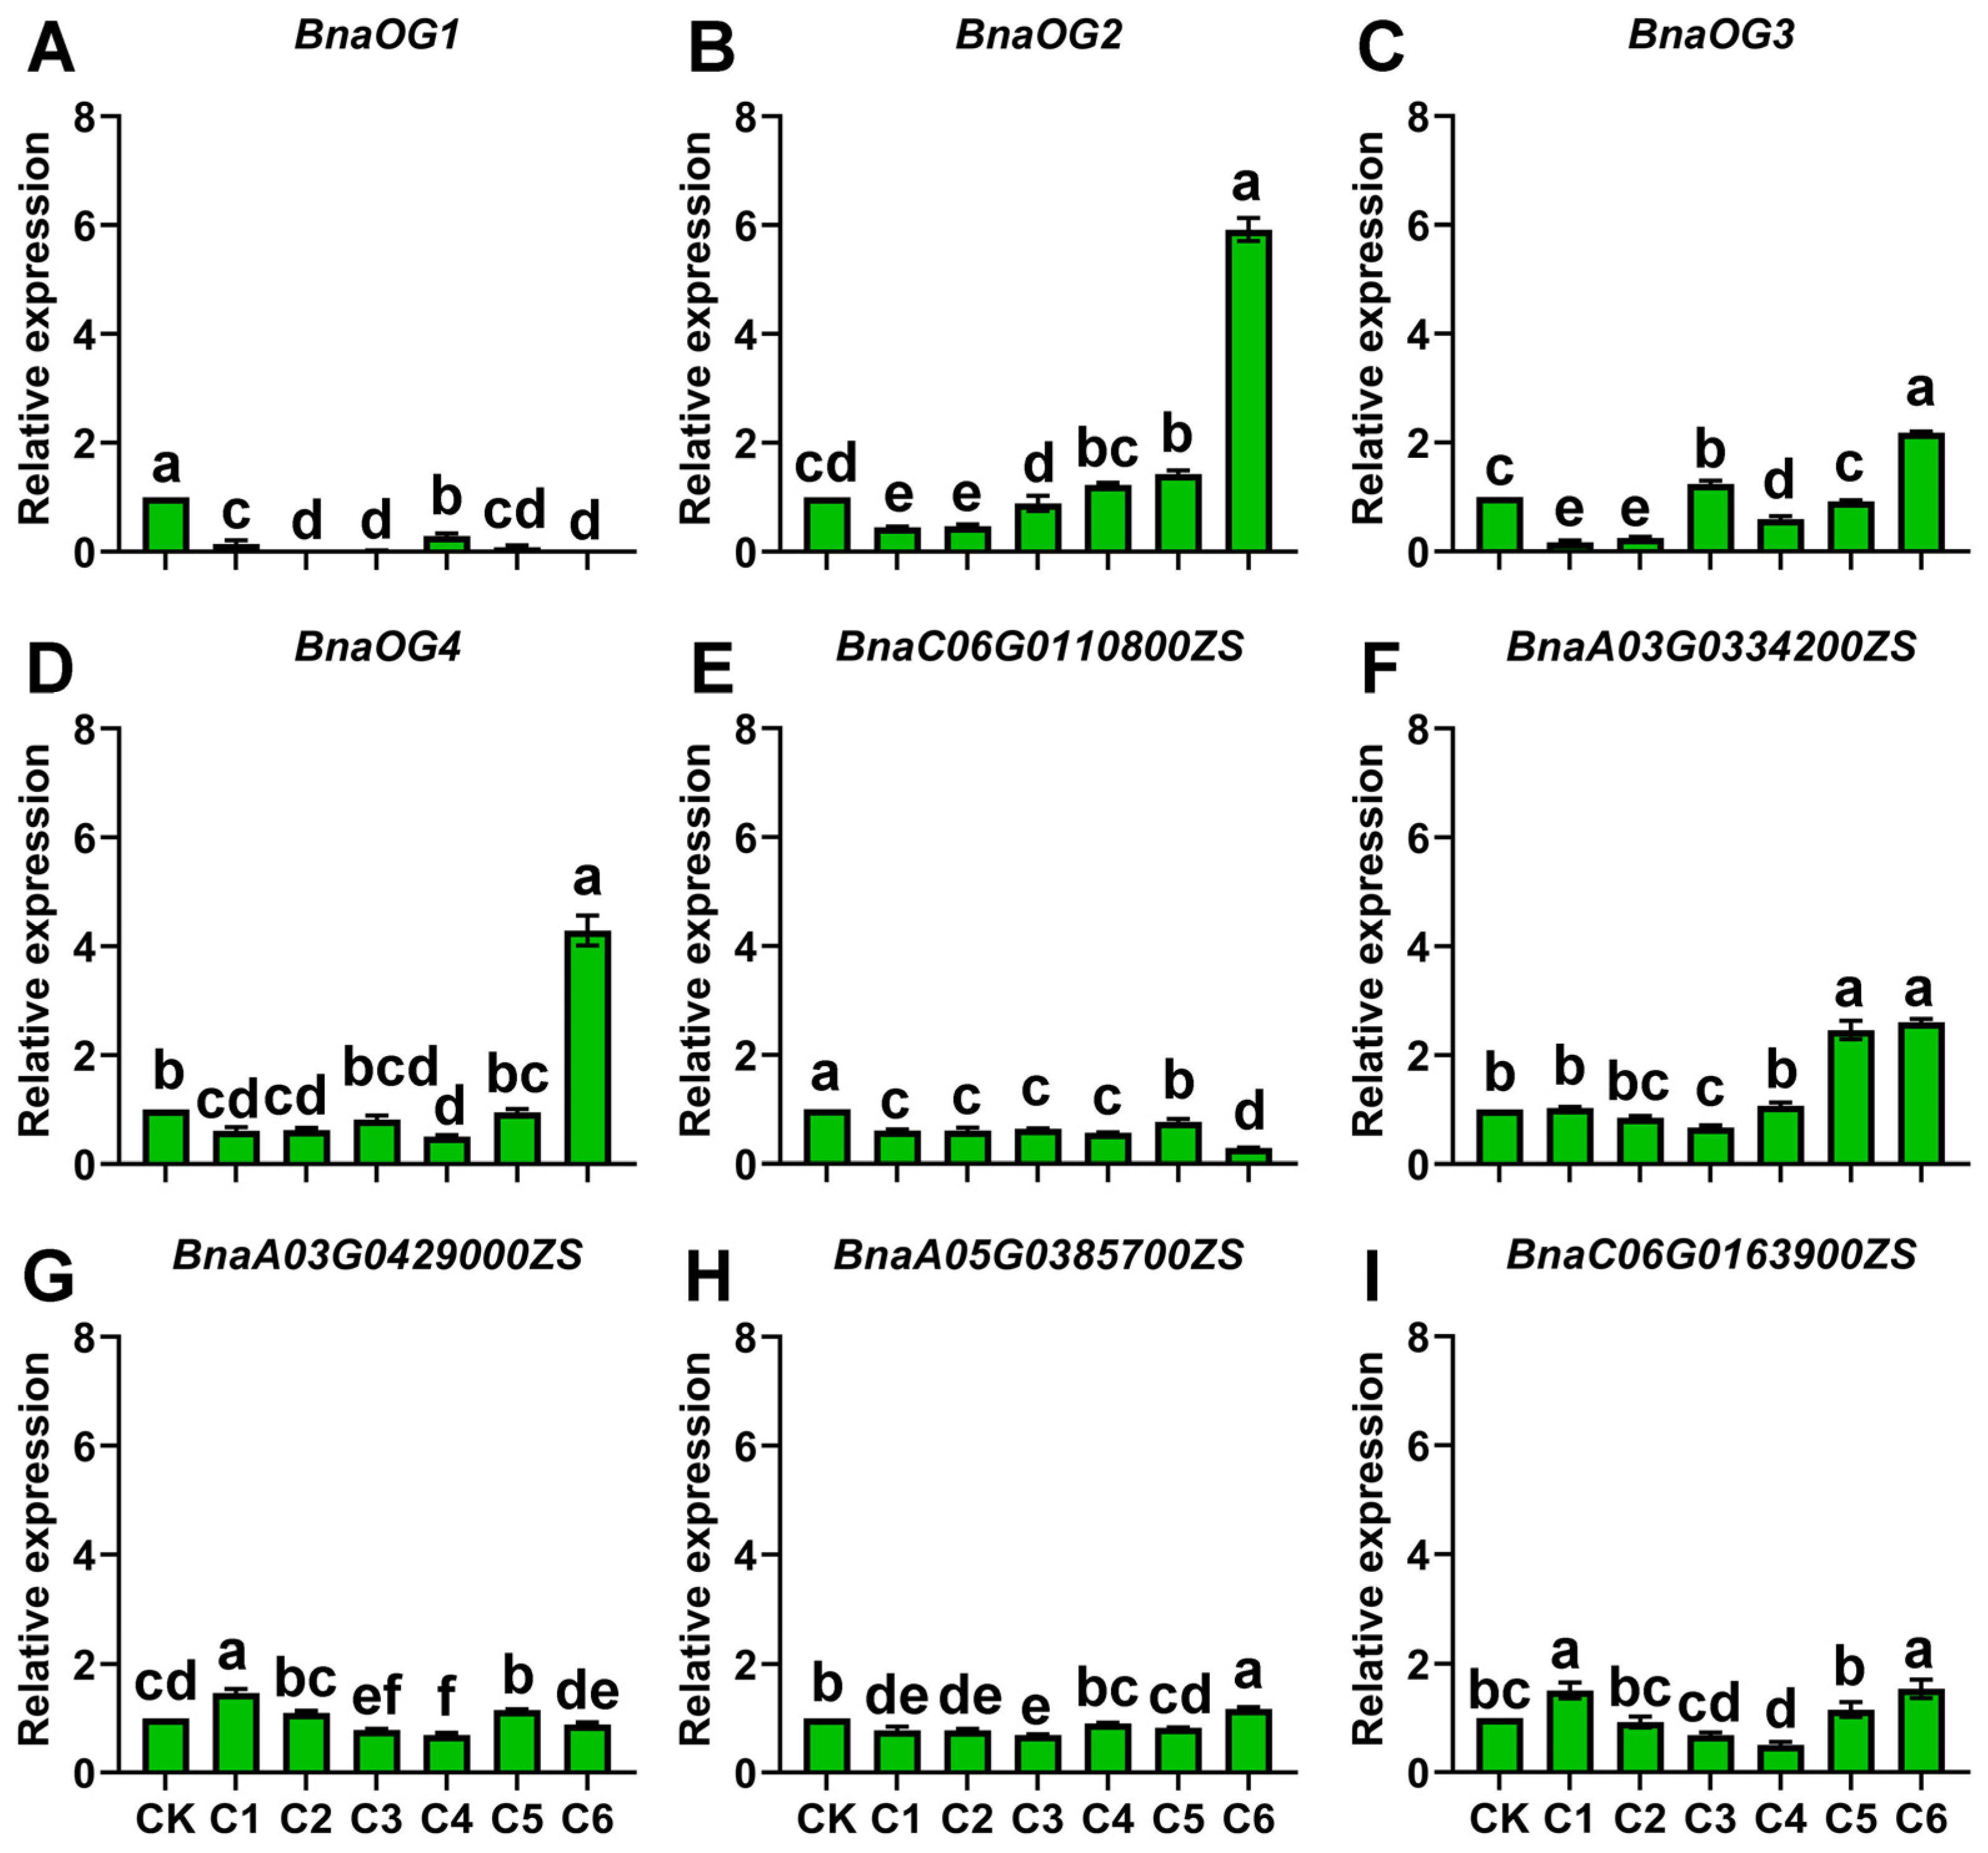
3.7. Cold-Responsive Expression of BnaOGs and Core BSGs

qRT-PCR analysis uncovered distinct regulatory patterns governing the expression dynamics of four BnaOGs and five BSGs under cold stress (Figure 9). BnaOG1 and BnaC06G0110800ZS indicated significant downregulation throughout the stress treatment, suggesting potential roles in stress avoidance or growth regulation. Whereas BnaOG2, BnaOG4, BnaA03G0334200ZS, and BnaA05G0385700ZS established a coordinated late-responsive module, indicating peak expression during advanced stress stages, highlighting adaptation-related functions. BnaA03G0429000ZS and BnaC06G0163900ZS had sustained activation during both early and late stress stages, whereas BnaOG3 showed a unique intermediate response pattern with specific induction during middle-to-late treatment stages. These OGs form an elaborate regulatory framework that modulates environmental responses in rapeseed, with distinct expression modules responding to specific stress stimuli while maintaining coordinated network functionality. The identified OGs provide novel gene targets for comprehending stress adaptation and genetic enhancement of stress tolerance in this agriculturally important crop.

4. Discussion

Several studies have indicated that OGs perform diverse and essential biological functions, such as mediating critical stress responses against abiotic and biotic challenges [13,46,47,48], modulating metabolic networks [17,19], mediating the development of species-specific characteristics [14,15,16,21]. Therefore, OGs screening and identification may provide new gene targets for rapeseed breeding. Our comparative analysis revealed distinct evolutionary categories: 4 BnaOGs (0.004%), 2859 BSGs (~3%), 9650 CSGs (~9%), and 94,720 ECGs (Figure 1). These findings revealed that various gene sets are directly related to their category and the number of aligned genomes, consistent with the data observed in B. rapa [5] and coriander [7]. This study identified only four BnaOGs, which may reflect the rapid expansion of genome sequencing efforts and ongoing improvements in genomic databases, which reduce the pool of candidate OGs. Recently, a study revealed that the percentage of OGs in Musa itinerans (0.4%) and M. textilis (0.5%) was relatively low [9]. Another study identified 37 recently originated OGs (0.066%) in the rice (Nipponbare) genome [2]. These findings provide experimental support for the data acquired in the current study and offer a genomic basis for identifying novel target genes that may contribute to rapeseed improvement.
This study revealed significant structural and evolutionary divergence between BnaOGs, BSGs, CSGs, and ECGs. These variations are consistent with their proposed biological functions; OGs promote lineage-specific adaptations, whereas ECGs preserve vital cellular functions. Furthermore, OGs contribute substantially to functional and phenotypic diversity via their multifunctional nature and rapid evolutionary dynamics [49]. Compared to ECGs, the chromosomal distribution of rapeseed OGs significantly correlates with chromosome length; distinct gene categories have shorter chromosomes and a higher proportion of non-coding genes (Figure 2 and Figure 3), consistent with the previous data of B. rapa [5] and coriander [7]. Several evolutionary genomic studies have shown that OGs evolve significantly faster than ancient or widely conserved genes [50]. However, OGs’ functions remain largely uncharacterized, and the identification of their structural domains remains challenging [1,51]. In line with these results, our study revealed that the majority of rapeseed OGs lacked TFs annotations, and only a limited subset of OGs contained identifiable functional domains, and these genes generally displayed reduced functional annotation coverage (Figure 3 and Figure 4). These findings revealed significant structural and evolutionary differences between OGs and conserved genes, confirming that they may drive lineage-specific adaptations.
Compared to other taxa, the functional characterization of OGs in plants has advanced slowly, partly because it is challenging to identify their biological roles via traditional comparative genomic techniques [52]. Therefore, expression pattern analysis is a relatively effective approach for predicting gene function, particularly for OGs lacking detectable homologs. Here, the transcriptome and qRT-PCR analysis revealed that different BnaOGs and BSGs had tissue-specific or stress-responsive expression patterns. Furthermore, many BSGs in rapeseed remained transcriptionally silent or showed minimal expression. Compared with ECGs, OGs had greater tissue specificity, lower expression levels, and reduced average transcription rates [1]. Although several BSGs showed low basal expression in normal tissues, they were significantly upregulated under multiple stress conditions (Figure 6 and Figure 7). Consistently, many OGs in B. rapa had reduced expression levels in normal tissues but were also induced by Plasmodiophora brassicae [5]. Our analysis revealed distinct tissue-specific expression profiles and differential cold responsiveness between BnaOGs and core BSGs, reflecting their divergent evolutionary trajectories and functional specialization (Figure 8 and Figure 9). The cold-responsive upregulation of OGs further validates their association with tissue-specific signal transduction or transport mechanisms critical for cold tolerance. These OGs potentially relate their rapid evolutionary divergence to acquire agronomically relevant stress resilience in rapeseed. In Physcomitrella patens, the relative OGs abundance increased significantly to 20% during the early transcriptomic response, highlighting that the early cold response that occurs via unknown acclimation processes might be species- or lineage-specific [53]. A study revealed that under normal conditions, five coriander OGs generally exhibited distinct expression patterns; however, their expression increases significantly under cold stress [7]. The rapid response and activation of BnaOGs and core BSGs strongly supports their specialized function in the early alarm phase, aligning with the phased response model established in prior research [54]. These results support the findings of this study, suggesting that strong stress specificity is a key characteristic of OGs, offering new targets for precision breeding of cold-tolerant varieties. Further research is needed to elucidate the functional contributions of these OGs to cold stress signaling and adaptation mechanisms.

5. Conclusions

This study provides comprehensive genomic and functional characterization of OGs in rapeseed, revealing their crucial roles in evolutionary innovation and stress adaptation. Through systematic comparative genomics, we demonstrate that rapeseed OGs exhibit distinct structural and regulatory features compared to ECGs. The differential expression patterns of OGs across tissues and stress conditions highlight their functional diversification in developmental processes and environmental adaptation. These findings substantially advance our understanding of genetic novelty in plants by establishing a genomic framework for OG-mediated adaptation in rapeseed, thereby unlocking innovative strategies for developing climate-resilient and sustainable crops. Future research should focus on the functional characterization of the four identified BnaOGs and core BSGs through multi-omics approaches and CRISPR-based validation to investigate their potential roles in agronomic trait formation and stress adaptation in rapeseed. Moreover, the regulatory networks associating OGs with conserved stress pathways should be comprehensively studied to deepen our understanding of rapeseed’s adaptive evolution.

Supplementary Materials

The following supporting information can be downloaded at: https://www.mdpi.com/article/10.3390/horticulturae11070826/s1, Table S1: FPKM values of four BrOGs in different tissues and during stress in rapeseed. Table S2: FPKM values of core BSGs across different rapeseed tissues. Table S3: FPKM values of core BSGs under different stress conditions in rapeseed.

Author Contributions

Conceptualization, M.J.; methodology, H.L. and Y.Z.; software, B.W. and K.L.; validation, H.L. and M.J.; formal analysis, H.L. and K.L.; investigation, H.L. and Y.Z.; resources, B.W. and M.J.; data curation, H.L. and Y.Z.; writing—original draft preparation, H.L.; writing—review and editing, M.J.; visualization, H.L. and Y.Z.; supervision, M.J.; project administration, M.J.; funding acquisition, M.J. All authors have read and agreed to the published version of the manuscript.

Funding

This research was funded by the Science and Technology Development Plan Project of Jilin Province, grant number 20250102320JC.

Data Availability Statement

The original contributions presented in this study are included in this article/Supplementary Materials, and no other data were created.

Conflicts of Interest

The authors declare no conflicts of interest.

Abbreviations

The following abbreviations are used in this manuscript:
ANOVAOne-way analysis of variance
BnaOGsB. napus OGs
BSGsBrassica-specific genes
CDSCoding sequence
CSGsCruciferae-specific genes
ECGsEvolutionarily conserved genes
ESTExpressed Sequence Tag
GOGene Ontology
KEGGKyoto Encyclopedia of Genes and Genomes
NrdbNon-redundant protein database
OGsOrphan genes
PUTsPlantGDB-generated unique transcripts
TFsTranscription factors
UniProt-KBUniProt Knowledgebase

References

  1. Jiang, M.; Li, X.; Dong, X.; Zu, Y.; Zhan, Z.; Piao, Z.; Lang, H. Research Advances and Prospects of Orphan Genes in Plants. Front. Plant Sci. 2022, 13, 947129. [Google Scholar] [CrossRef]
  2. Jin, G.H.; Zhou, Y.L.; Yang, H.; Hu, Y.T.; Shi, Y.; Li, L.; Siddique, A.N.; Liu, C.N.; Zhu, A.D.; Zhang, C.J.; et al. Genetic innovations: Transposable element recruitment and de novo formation lead to the birth of orphan genes in the rice genome. J. Syst. Evol. 2019, 59, 341–351. [Google Scholar] [CrossRef]
  3. Fakhar, A.Z.; Liu, J.; Pajerowska-Mukhtar, K.M.; Mukhtar, M.S. The ORFans’ tale: New insights in plant biology. Trends Plant Sci. 2023, 28, 1379–1390. [Google Scholar] [CrossRef]
  4. Fakhar, A.Z.; Liu, J.; Pajerowska-Mukhtar, K.M.; Mukhtar, M.S. The Lost and Found: Unraveling the Functions of Orphan Genes. J. Dev. Biol. 2023, 11, 27. [Google Scholar] [CrossRef]
  5. Jiang, M.; Dong, X.; Lang, H.; Pang, W.; Zhan, Z.; Li, X.; Piao, Z. Mining of Brassica-Specific Genes (BSGs) and Their Induction in Different Developmental Stages and under Plasmodiophora brassicae Stress in Brassica rapa. Int. J. Mol. Sci. 2018, 19, 2064. [Google Scholar] [CrossRef]
  6. Xu, Y.; Wu, G.; Hao, B.; Chen, L.; Deng, X.; Xu, Q. Identification, characterization and expression analysis of lineage-specific genes within sweet orange (Citrus sinensis). BMC Genomics 2015, 16, 995. [Google Scholar] [CrossRef]
  7. Zhang, M.; Zhu, M.; Lang, H.; Wang, W.; Li, X.; Jiang, M. Genome-Wide Identification, Characterization, and Expression Analysis of Orphan Genes Within Coriander. Plants 2025, 14, 778. [Google Scholar] [CrossRef]
  8. Ma, Y.; Zhai, Q.; Liu, Z.; Liu, W. Genome-wide identification and characterization of alfalfa-specific genes in drought stress tolerance. Plant Physiol. Bioch. 2025, 220, 109474. [Google Scholar] [CrossRef]
  9. Ren, Q.; Lim, Y.-Y.; Teo, C.H. Genome-wide identification and expression analysis of orphan genes in twelve Musa (sub) species. 3 Biotech 2025, 15, 41. [Google Scholar] [CrossRef]
  10. Arendsee, Z.W.; Li, L.; Wurtele, E.S. Coming of age: Orphan genes in plants. Trends Plant Sci. 2014, 19, 698–708. [Google Scholar] [CrossRef]
  11. Feyissa, B.A.; de Becker, E.M.; Salesse-Smith, C.E.; Shu, M.; Zhang, J.; Yates, T.B.; Xie, M.; De, K.; Gotarkar, D.; Chen, M.S.S.; et al. An orphan gene BOOSTER enhances photosynthetic efficiency and plant productivity. Dev. Cell 2025, 60, 723–734.e727. [Google Scholar] [CrossRef]
  12. Zu, Y.; Jiang, M.; Zhan, Z.; Li, X.; Piao, Z. Orphan gene BR2 positively regulates bolting resistance through the vernalization pathway in Chinese cabbage. Hortic. Res. 2024, 11, uhae216. [Google Scholar] [CrossRef]
  13. Jiang, M.; Zhan, Z.; Li, X.; Piao, Z. Construction and evaluation of Brassica rapa orphan genes overexpression library. Front. Plant Sci. 2025, 16, 1532449. [Google Scholar] [CrossRef]
  14. Jiang, M.; Zhang, Y.; Yang, X.; Li, X.; Lang, H. Brassica rapa orphan gene BR1 delays flowering time in Arabidopsis. Front. Plant Sci. 2023, 14, 1135684. [Google Scholar] [CrossRef]
  15. Wang, D.-H.; Xu, Z.-H.; Bai, S.-N. OsFON879, an orphan gene, regulates floral organ homeostasis in rice. Plant Biotechnol. J. 2025, 23, 2888–2890. [Google Scholar] [CrossRef]
  16. Zhang, Y.; Jiang, M.; Sun, S.; Zhan, Z.; Li, X.; Piao, Z. Chinese cabbage orphan gene BR3 confers bolting resistance to Arabidopsis through the gibberellin pathway. Front. Plant Sci. 2025, 15, 1518962. [Google Scholar] [CrossRef]
  17. Jiang, M.; Zhan, Z.; Li, H.; Dong, X.; Cheng, F.; Piao, Z. Brassica rapa orphan genes largely affect soluble sugar metabolism. Hortic. Res. 2020, 7, 181. [Google Scholar] [CrossRef]
  18. Li, L.; Wurtele, E.S. The QQS orphan gene of Arabidopsis modulates carbon and nitrogen allocation in soybean. Plant Biotechnol. J. 2015, 13, 177–187. [Google Scholar] [CrossRef]
  19. Li, L.; Zheng, W.; Zhu, Y.; Ye, H.; Tang, B.; Arendsee, Z.W.; Jones, D.; Li, R.; Ortiz, D.; Zhao, X.; et al. QQS orphan gene regulates carbon and nitrogen partitioning across species via NF-YC interactions. Proc. Natl. Acad. Sci. USA 2015, 112, 14734–14739. [Google Scholar] [CrossRef]
  20. Cui, X.; Lv, Y.; Chen, M.; Nikoloski, Z.; Twell, D.; Zhang, D. Young Genes out of the Male: An Insight from Evolutionary Age Analysis of the Pollen Transcriptome. Mol. Plant 2015, 8, 935–945. [Google Scholar] [CrossRef]
  21. Ni, F.; Qi, J.; Hao, Q.; Lyu, B.; Luo, M.C.; Wang, Y.; Chen, F.; Wang, S.; Zhang, C.; Epstein, L.; et al. Wheat Ms2 encodes for an orphan protein that confers male sterility in grass species. Nat. Commun. 2017, 8, 15121. [Google Scholar] [CrossRef]
  22. Dossa, K.; Zhou, R.; Li, D.; Liu, A.; Qin, L.; Mmadi, M.A.; Su, R.; Zhang, Y.; Wang, J.; Gao, Y.; et al. A novel motif in the 5′-UTR of an orphan gene ‘Big Root Biomass’ modulates root biomass in sesame. Plant Biotechnol. J. 2021, 19, 1065–1079. [Google Scholar] [CrossRef]
  23. Cardoso-Silva, C.B.; Aono, A.H.; Mancini, M.C.; Sforça, D.A.; da Silva, C.C.; Pinto, L.R.; Adams, K.L.; de Souza, A.P. Taxonomically Restricted Genes Are Associated With Responses to Biotic and Abiotic Stresses in Sugarcane (Saccharum spp.). Front. Plant Sci. 2022, 13, 923069. [Google Scholar] [CrossRef]
  24. Perochon, A.; Jianguang, J.; Kahla, A.; Arunachalam, C.; Scofield, S.R.; Bowden, S.; Wallington, E.; Doohan, F.M. TaFROG Encodes a Pooideae Orphan Protein That Interacts with SnRK1 and Enhances Resistance to the Mycotoxigenic Fungus Fusarium graminearum. Plant Physiol. 2015, 169, 2895–2906. [Google Scholar] [CrossRef]
  25. Jiang, C.; Hei, R.; Yang, Y.; Zhang, S.; Wang, Q.; Wang, W.; Zhang, Q.; Yan, M.; Zhu, G.; Huang, P. An orphan protein of Fusarium graminearum modulates host immunity by mediating proteasomal degradation of TaSnRK1α. Nat. Commun. 2020, 11, 1–13. [Google Scholar] [CrossRef]
  26. Fang, H.; Shen, S.; Wang, D.; Zhang, F.; Zhang, C.; Wang, Z.; Zhou, Q.; Wang, R.; Tao, H.; He, F.; et al. A monocot-specific hydroxycinnamoylputrescine gene cluster contributes to immunity and cell death in rice. Sci. Bull. 2021, 66, 2381–2393. [Google Scholar] [CrossRef]
  27. Brennan, C.J.; Zhou, B.; Benbow, H.R.; Ajaz, S.; Karki, S.J.; Hehir, J.G.; O’Driscoll, A.; Feechan, A.; Mullins, E.; Doohan, F.M. Taxonomically Restricted Wheat Genes Interact With Small Secreted Fungal Proteins and Enhance Resistance to Septoria tritici Blotch Disease. Front. Plant Sci. 2020, 11, 433. [Google Scholar] [CrossRef]
  28. Song, J.M.; Guan, Z.; Hu, J.; Guo, C.; Yang, Z.; Wang, S.; Liu, D.; Wang, B.; Lu, S.; Zhou, R.; et al. Eight high-quality genomes reveal pan-genome architecture and ecotype differentiation of Brassica napus. Nat. Plants 2020, 6, 34–45. [Google Scholar] [CrossRef]
  29. Lu, K.; Wei, L.; Li, X.; Wang, Y.; Wu, J.; Liu, M.; Zhang, C.; Chen, Z.; Xiao, Z.; Jian, H.; et al. Whole-genome resequencing reveals Brassica napus origin and genetic loci involved in its improvement. Nat. Commun. 2019, 10, 1154. [Google Scholar] [CrossRef]
  30. Tan, Z.; Han, X.; Dai, C.; Lu, S.; He, H.; Yao, X.; Chen, P.; Yang, C.; Zhao, L.; Yang, Q.Y.; et al. Functional genomics of Brassica napus: Progresses, challenges, and perspectives. J Integr. Plant Biol. 2024, 66, 484–509. [Google Scholar] [CrossRef]
  31. Wu, D.; Liang, Z.; Yan, T.; Xu, Y.; Xuan, L.; Tang, J.; Zhou, G.; Lohwasser, U.; Hua, S.; Wang, H.; et al. Whole-Genome Resequencing of a Worldwide Collection of Rapeseed Accessions Reveals the Genetic Basis of Ecotype Divergence. Mol. Plant 2019, 12, 30–43. [Google Scholar] [CrossRef] [PubMed]
  32. Gu, J.; Guan, Z.; Jiao, Y.; Liu, K.; Hong, D. The story of a decade: Genomics, functional genomics, and molecular breeding in Brassica napus. Plant Commun. 2024, 5, 100884. [Google Scholar] [CrossRef] [PubMed]
  33. Zhang, Y.; Xiao, H.; Lv, X.; Wang, D.; Chen, H.; Wei, F. Comprehensive review of composition distribution and advances in profiling of phenolic compounds in oilseeds. Front. Nutr. 2022, 9, 1044871. [Google Scholar] [CrossRef] [PubMed]
  34. Chen, Y.Y.; Lu, H.Q.; Jiang, K.X.; Wang, Y.R.; Wang, Y.P.; Jiang, J.J. The Flavonoid Biosynthesis and Regulation in Brassica napus: A Review. Int. J. Mol. Sci. 2022, 24, 357. [Google Scholar] [CrossRef]
  35. Shen, J.; Liu, Y.; Wang, X.; Bai, J.; Lin, L.; Luo, F.; Zhong, H. A Comprehensive Review of Health-Benefiting Components in Rapeseed Oil. Nutrients 2023, 15, 999. [Google Scholar] [CrossRef]
  36. Yang, Z.; Wang, S.; Wei, L.; Huang, Y.; Liu, D.; Jia, Y.; Luo, C.; Lin, Y.; Liang, C.; Hu, Y.; et al. BnIR: A multi-omics database with various tools for Brassica napus research and breeding. Mol. Plant 2023, 16, 775–789. [Google Scholar] [CrossRef]
  37. Zou, J.; Mao, L.; Qiu, J.; Wang, M.; Jia, L.; Wu, D.; He, Z.; Chen, M.; Shen, Y.; Shen, E.; et al. Genome-wide selection footprints and deleterious variations in young Asian allotetraploid rapeseed. Plant Biotechnol. J. 2019, 17, 1998–2010. [Google Scholar] [CrossRef]
  38. Sun, F.; Fan, G.; Hu, Q.; Zhou, Y.; Guan, M.; Tong, C.; Li, J.; Du, D.; Qi, C.; Jiang, L.; et al. The high-quality genome of Brassica napus cultivar ‘ZS11’ reveals the introgression history in semi-winter morphotype. Plant J. 2017, 92, 452–468. [Google Scholar] [CrossRef]
  39. Jiang, J.; Li, R.; Wang, K.; Xu, Y.; Lu, H.; Zhang, D. Combined Bulked Segregant Analysis-Sequencing and Transcriptome Analysis to Identify Candidate Genes Associated with Cold Stress in Brassica napus L. Int. J. Mol. Sci. 2025, 26, 1148. [Google Scholar] [CrossRef]
  40. Liu, X.; Wang, T.; Ruan, Y.; Xie, X.; Tan, C.; Guo, Y.; Li, B.; Qu, L.; Deng, L.; Li, M.; et al. Comparative Metabolome and Transcriptome Analysis of Rapeseed (Brassica napus L.) Cotyledons in Response to Cold Stress. Plants 2024, 13, 2212. [Google Scholar] [CrossRef]
  41. Waseem, M.; Peng, J.; Basharat, S.; Peng, Q.; Li, Y.; Yang, G.; Cheng, S.; Liu, P. A comprehensive analysis of transcriptomic data for comparison of cold tolerance in two Brassica napus genotypes. Physiol. Plant 2024, 176, e14213. [Google Scholar] [CrossRef] [PubMed]
  42. Chen, C.; Wu, Y.; Li, J.; Wang, X.; Zeng, Z.; Xu, J.; Liu, Y.; Feng, J.; Chen, H.; He, Y.; et al. TBtools-II: A “one for all, all for one” bioinformatics platform for biological big-data mining. Mol. Plant 2023, 16, 1733–1742. [Google Scholar] [CrossRef] [PubMed]
  43. Raza, A.; Su, W.; Hussain, M.A.; Mehmood, S.S.; Zhang, X.; Cheng, Y.; Zou, X.; Lv, Y. Integrated Analysis of Metabolome and Transcriptome Reveals Insights for Cold Tolerance in Rapeseed (Brassica napus L.). Front. Plant Sci. 2021, 12, 721681. [Google Scholar] [CrossRef] [PubMed]
  44. Yang, H.; Liu, J.; Huang, S.; Guo, T.; Deng, L.; Hua, W. Selection and evaluation of novel reference genes for quantitative reverse transcription PCR (qRT-PCR) based on genome and transcriptome data in Brassica napus L. Gene 2014, 538, 113–122. [Google Scholar] [CrossRef]
  45. Livak, K.J.; Schmittgen, T.D. Analysis of Relative Gene Expression Data Using Real-Time Quantitative PCR and the 2−ΔΔCT Method. Methods 2001, 25, 402–408. [Google Scholar] [CrossRef]
  46. Dong, X.-M.; Pu, X.-J.; Zhou, S.-Z.; Li, P.; Luo, T.; Chen, Z.-X.; Chen, S.-L.; Liu, L. Orphan gene PpARDT positively involved in drought tolerance potentially by enhancing ABA response in Physcomitrium (Physcomitrella) patens. Plant Sci. 2022, 319, 111222. [Google Scholar] [CrossRef]
  47. Li, G.; Wu, X.; Hu, Y.; Muñoz-Amatriaín, M.; Luo, J.; Zhou, W.; Wang, B.; Wang, Y.; Wu, X.; Huang, L.; et al. Orphan genes are involved in drought adaptations and ecoclimatic-oriented selections in domesticated cowpea. J. Exp. Bot. 2019, 70, 3101–3110. [Google Scholar] [CrossRef]
  48. Jin, G.-T.; Xu, Y.-C.; Hou, X.-H.; Jiang, J.; Li, X.-X.; Xiao, J.-H.; Bian, Y.-T.; Gong, Y.-B.; Wang, M.-Y.; Zhang, Z.-Q.; et al. A de novo Gene Promotes Seed Germination Under Drought Stress in Arabidopsis. Mol. Biol. Evol. 2025, 42, msae262. [Google Scholar] [CrossRef]
  49. Cheng, L.; Han, Q.; Hao, Y.; Qiao, Z.; Li, M.; Liu, D.; Yin, H.; Li, T.; Long, W.; Luo, S.; et al. Genome assembly of Stewartia sinensis reveals origin and evolution of orphan genes in Theaceae. Commun. Biol. 2025, 8, 354. [Google Scholar] [CrossRef]
  50. Cai, J.J.; Petrov, D.A. Relaxed purifying selection and possibly high rate of adaptation in primate lineage-specific genes. Genome Biol. Evol. 2010, 2, 393–409. [Google Scholar] [CrossRef]
  51. Lin, H.; Moghe, G.; Ouyang, S.; Iezzoni, A.; Shiu, S.H.; Gu, X.; Buell, C.R. Comparative analyses reveal distinct sets of lineage-specific genes within Arabidopsis thaliana. BMC Evol. Biol. 2010, 10, 41. [Google Scholar] [CrossRef] [PubMed]
  52. Moon, H.; Jeong, A.R.; Kwon, O.-K.; Park, C.-J. Oryza-Specific Orphan Protein Triggers Enhanced Resistance to Xanthomonas oryzae pv. oryzae in Rice. Front. Plant Sci. 2022, 13, 859375. [Google Scholar] [CrossRef] [PubMed]
  53. Beike, A.K.; Lang, D.; Zimmer, A.D.; Wüst, F.; Trautmann, D.; Wiedemann, G.; Beyer, P.; Decker, E.L.; Reski, R. Insights from the cold transcriptome of Physcomitrella patens: Global specialization pattern of conserved transcriptional regulators and identification of orphan genes involved in cold acclimation. New Phytol. 2015, 205, 869–881. [Google Scholar] [CrossRef] [PubMed]
  54. Kosová, K.; Vítámvás, P.; Urban, M.O.; Klíma, M.; Roy, A.; Prášil, I.T. Biological Networks Underlying Abiotic Stress Tolerance in Temperate Crops--A Proteomic Perspective. Int. J. Mol. Sci. 2015, 16, 20913–20942. [Google Scholar] [CrossRef]
Figure 1. Schematic workflow of identifying BnaOGs, BSGs, CSGs, and ECGs in the rapeseed genome. The comparative genomic analysis was carried out based on the PlantGDB-generated unique transcripts (PUTs), the non-redundant protein database (Nrdb), the Expressed Sequence Tag (EST), and the Nr/Nt databases. Yellow boxes highlight candidate rapeseed genes classified as BnaOGs, BSGs, CSGs, and ECGs, while blue boxes represent reference databases and exclusion sets used to filter out sequences from corresponding lineages.
Horticulturae 11 00826 g001
Figure 2. Chromosomal distribution patterns of BSGs and CSGs in rapeseed. The plot shows their distribution across all 19 chromosomes and scaffolds (x-axis). The gene numbers (left y-axis; BSGs: green circles, CSGs: orange squares) and relative percentages (right y-axis; BSGs: yellow triangles, CSGs: purple diamonds) are displayed on dual axes.
Horticulturae 11 00826 g002
Figure 3. Structural and evolutionary divergence of different gene categories. (A) The comparison of CDS length (left y-axis, purple triangles) and protein length (right y-axis, green circles) of each gene category. (B) GC content (left y-axis, purple triangles) and AT/GC ratio (right y-axis, green circles) illustrate compositional differences. (C) Prediction of TFs. Green circles on the left y-axis indicate TF counts, whereas purple squares on the right y-axis depict percentages. (D) Prediction of domain architecture. Gene counts containing functional domains (left y-axis, green solid circles) and their percentage (right y-axis, purple triangles) are presented. (E) Gene coding potential prediction. Coding capacity was indicated by gene numbers (left y-axis: coding genes, green circles; non-coding genes, pink triangles) and their percentage (right y-axis: coding genes, blue squares; non-coding genes, purple triangles). (F) Prediction of subcellular localization. Distinct markers represent BnaOGs (purple triangles), BSGs (green circles), CSGs (yellow crosses), and ECGs (black squares) across cellular compartments (x-axis).
Horticulturae 11 00826 g003
Figure 4. Comprehensive functional annotation of different gene categories across different databases. (A) Annotation percentage of gene categories in multiple databases. Different colors represent different databases. VN diagrams indicate functional annotation of (B) BSGs, (C) CSGs, and (D) ECGs via different databases, including Gene Ontology (GO), Kyoto Encyclopedia of Genes and Genomes (KEGG), SwissProt, and NR.
Horticulturae 11 00826 g004
Figure 5. Expression patterns of BnaOGs in different tissues and during stress in rapeseed. (A) Tissue-specific expression profiles of BnaOGs in rapeseed. Columns and rows represent different tissues and BnaOGs, respectively. FPKM values indicate expression levels. (B) BnaOG expression under various stress conditions in rapeseed. Columns and rows denote different stress treatments and BnaOGs, respectively. FPKM values indicate expression changes. In both heatmaps, red indicates high expression, and green represents low expression. Genes and tissues were clustered based on similar expression patterns.
Horticulturae 11 00826 g005
Figure 6. Expression patterns of core BSGs across different rapeseed tissues. The heatmap displays expression patterns of core BSGs across various rapeseed tissues. Columns represent different BSGs, and rows indicate distinct tissue types. Expression levels are shown as FPKM values, with red and green color gradients denoting high and low expression, respectively. Hierarchical clustering analysis grouped genes and tissues with similar expression patterns.
Horticulturae 11 00826 g006
Figure 7. Expression patterns of core BSGs under different stress conditions in rapeseed. Columns represent different BSGs, and rows indicate distinct stresses. FPKM values indicate expression intensity, with a color continuum ranging from green (minimum expression) to red (maximum detected expression). Co-expressed genes and functionally related tissues were clustered based on their expression profile correlations.
Horticulturae 11 00826 g007
Figure 8. Tissue-specific expression profiles of BnaOGs and core BSGs in rapeseed. Expression patterns of (AD) BnaOGs and (EI) core BSGs across various rapeseed tissues. The y-axis represents relative expression levels normalized to reference genes BnaPPR and BnaGDI1. Data are shown as the mean ± SE (three biological replicates). Lowercase letters above bars denote statistically significant differences (one-way ANOVA, p < 0.05).
Horticulturae 11 00826 g008
Figure 9. Cold stress-responsive expression patterns of BnaOGs and core BSGs in rapeseed. Dynamic expression changes in (AD) BnaOGs and (EI) core BSGs during cold stress exposure. The y-axis represents relative expression levels normalized to the reference genes BnaPPR and BnaGDI1. The x-axis indicates cold stress exposure time. CK represents the untreated control (0 h), while C1-C6 corresponds to 2, 4, 8, 12, 24 h, and 48 h of cold stress treatment, respectively. Data are presented as the mean ± SE (three biological replicates). Lowercase letters above bars indicate statistically significant differences (one-way ANOVA, p < 0.05).
Horticulturae 11 00826 g009
Table 1. Primers used in this study.
Gene IDsForward PrimerReverse Primer
BnaOG1AGAGTGAGGGAGAGAGAGCGTCAGGTCCTCTCCCCCCG
BnaOG2CCCCTTTCCCTTCGATTGAGAACAGTAGCATGGTCACCTTTCCT
BnaOG3ACCAAACATGGGTCATCTCCTCAGGAGAGAGATGGCCCTTTACT
BnaOG4ACCACCAGAGCCTAAACTGATGCTGGTTCTTGTTGCTCGAGTTG
BnaC06G0110800ZSTGTGTTTCTTCCTCCCTCATCTCCAGCAAGAAGACAGGTCAAGA
BnaA03G0334200ZSAGGCGTTGGATTTCCATCTCTTGAGCCAAACACCACTTGAAGAC
BnaA03G0429000ZSAGAGACTAACCCTCCAGAGACCCTCGTTTCTGCCTCTCTCCAAT
BnaA05G0385700ZSTCATTGGAGTGAGGTCTTTCCGAGAGCCACATCTTGATGACGTT
BnaC06G0163900ZSGGCTCAAGGGAGGTGATAGATGCCTTCAAACCGGCAAGAAAGTT
BnaPPRTGGTGTGCGATAAGTGTGAGAGGTGTCCATCTGTTCTTCTTGG
BnaGDI1GAGTCCCTTGCTCGTTTCCTGGCAGTCTCTCCCTCAGAT
Disclaimer/Publisher’s Note: The statements, opinions and data contained in all publications are solely those of the individual author(s) and contributor(s) and not of MDPI and/or the editor(s). MDPI and/or the editor(s) disclaim responsibility for any injury to people or property resulting from any ideas, methods, instructions or products referred to in the content.

