Article

Black Knot Unraveled: Phenotypic Characterization of Disease Resistance in Japanese Plums

by
Chloe Shum
1,
Wendy McFadden-Smith
2,
Walid El Kayal
3 and
Jayasankar Subramanian
1,*
1
Plant Agriculture, Ontario Agricultural College, Vineland Campus, University of Guelph, Guelph, ON N1G 2W1, Canada
2
Ontario Ministry of Agriculture, Food and Agribusiness (OMAFA), 4890 Victoria Avenue North, Vineland Station, ON L0R 2E0, Canada
3
Faculty of Food and Agricultural Sciences, American University of Beirut, Beirut 1107 2020, Lebanon
*
Author to whom correspondence should be addressed.
Horticulturae 2025, 11(5), 482; https://doi.org/10.3390/horticulturae11050482
Submission received: 25 March 2025 / Revised: 25 April 2025 / Accepted: 29 April 2025 / Published: 30 April 2025
(This article belongs to the Section Plant Pathology and Disease Management (PPDM))

Abstract

:
Black knot (BK) disease, caused by Apiosporina morbosa (Schwein.) v. Arx, significantly afflicts Japanese plums (Prunus salicina L.), resulting in substantial economic losses due to its destructive invasion of branches and trunks. Phenotyping for disease severity is critical to understanding resistance and susceptibility across diverse genotypes. In this study, 200 Japanese plum trees from a mixed lineage breeding program were phenotyped for BK severity using a rating scale from 0 to 5. Trees were rated by two independent raters and repeated on a second day, in early spring 2023, before leaf emergence, for peak visibility. The rating system was designed to capture varying levels of infection, with 0 representing no symptoms and 5 indicating severe infection with major effects to the tree’s overall health. Compared to data from 2015 and 2018, there was a noticeable increase in the number of heavily diseased trees relative to symptom-free trees. In 2023, the proportion of completely resistant trees remained the same as in 2018, suggesting true resistance. Median scores were calculated from four independent ratings per tree, comprised of two individuals on two different days, minimizing individual biases. Additionally, inter-rater reliability was assessed using the weighted Kappa statistic, which yielded a value of 0.903, indicating strong agreement between raters. This phenotypic assessment provides a robust dataset for correlation with genetic markers and supports further breeding efforts aimed at developing BK-resistant cultivars.

Graphical Abstract

1. Introduction

The Japanese plum (Prunus salicina L.) is the most widely produced fresh plum. Due to its long cultivation history of over 3000 years, the genetic diversity is vast [1]. This is evident in the range of colors of the fruit, tree architecture, chilling requirements, ripening timing and disease susceptibility differences among the cultivars. Proper characterization of these traits will greatly aid in generating the data required for genetic improvements.
Phenotyping, the process of observing and measuring an organism’s physical traits, plays a critical role in understanding and managing plant diseases [2]. In the context of plant pathology, phenotyping involves the systematic assessment of plants to identify disease symptoms and quantify disease severity to understand the relationship between host plants and pathogens [3]. This practice is fundamental for breeding disease-resistant plant varieties, developing effective disease management strategies, and ensuring food security. This study sets out to quantify the disease severity of the fungus black knot (BK) Apiosporina morbosa (Schwein.) v. Arx on Japanese plum.
The stages of BK development have been described in detail earlier [4,5]. The life cycle of the BK fungus begins with the release of ascospores during the spring. The peak of ascospore release occurs at 10–27 °C when wetting periods exceed 30 mm of rain [6]. These ascospores are forcibly ejected from mature knots during wet periods and are spread by wind and rain splash to land on susceptible young shoots or wounded areas of Prunus species, particularly plums and tart cherries (Prunus cerasus L.) [7]. Once an ascospore lands on a suitable host, it germinates and penetrates the epidermis, growing internally for up to a year. A light brown swelling at the infection site develops the following spring, growing into a gall covered with the olive-green anamorphic stage (Dibotryon morbosum (Schwein.) Theiss. & Syd.) by the early summer. The gall continues to grow and darken, until it becomes a black mass in the late summer. The fungus overwinters until the following spring, when the pseudothecia matures, and ejects ascospores to repeat the life cycle. The knot will be in a continual cycle of growth and dormancy as it is perennial and eventually impairs the vascular system of the tree, causing blockages.
Human activities, notably the movement of plant materials and inadequate horticultural practices, play a role in the dissemination of BK disease. These activities include improper sanitation of equipment, failure to effectively dispose of infected pruned materials, and use of infected but asymptomatic stock, which all lead to the introduction or spread of the disease [8]. Orchard maintenance is compulsory; however, spores and mycelium can potentially spread via pruners. New cuts on trees also expose the interior of the branch to spores present in the air. If pruned knots or infected branches are not burned or buried, they remain a threat to the rest of the orchard [9]. It was reported that ascospores could still be released four months after removal from the host [6]. Using asymptomatic but infected nursery material which harbor the fungus will also lead to the spread of the disease. Currently, there is no reliable assay that can detect the presence of BK. For this reason, regions without BK have strict import restrictions on Prunus spp. as A. morbosa is on multiple watchlists listed as A1, according to the EPPO Global Database [10]. Currently the distribution of BK remains in North America, covering Canada, the United States of America, and Mexico [11].
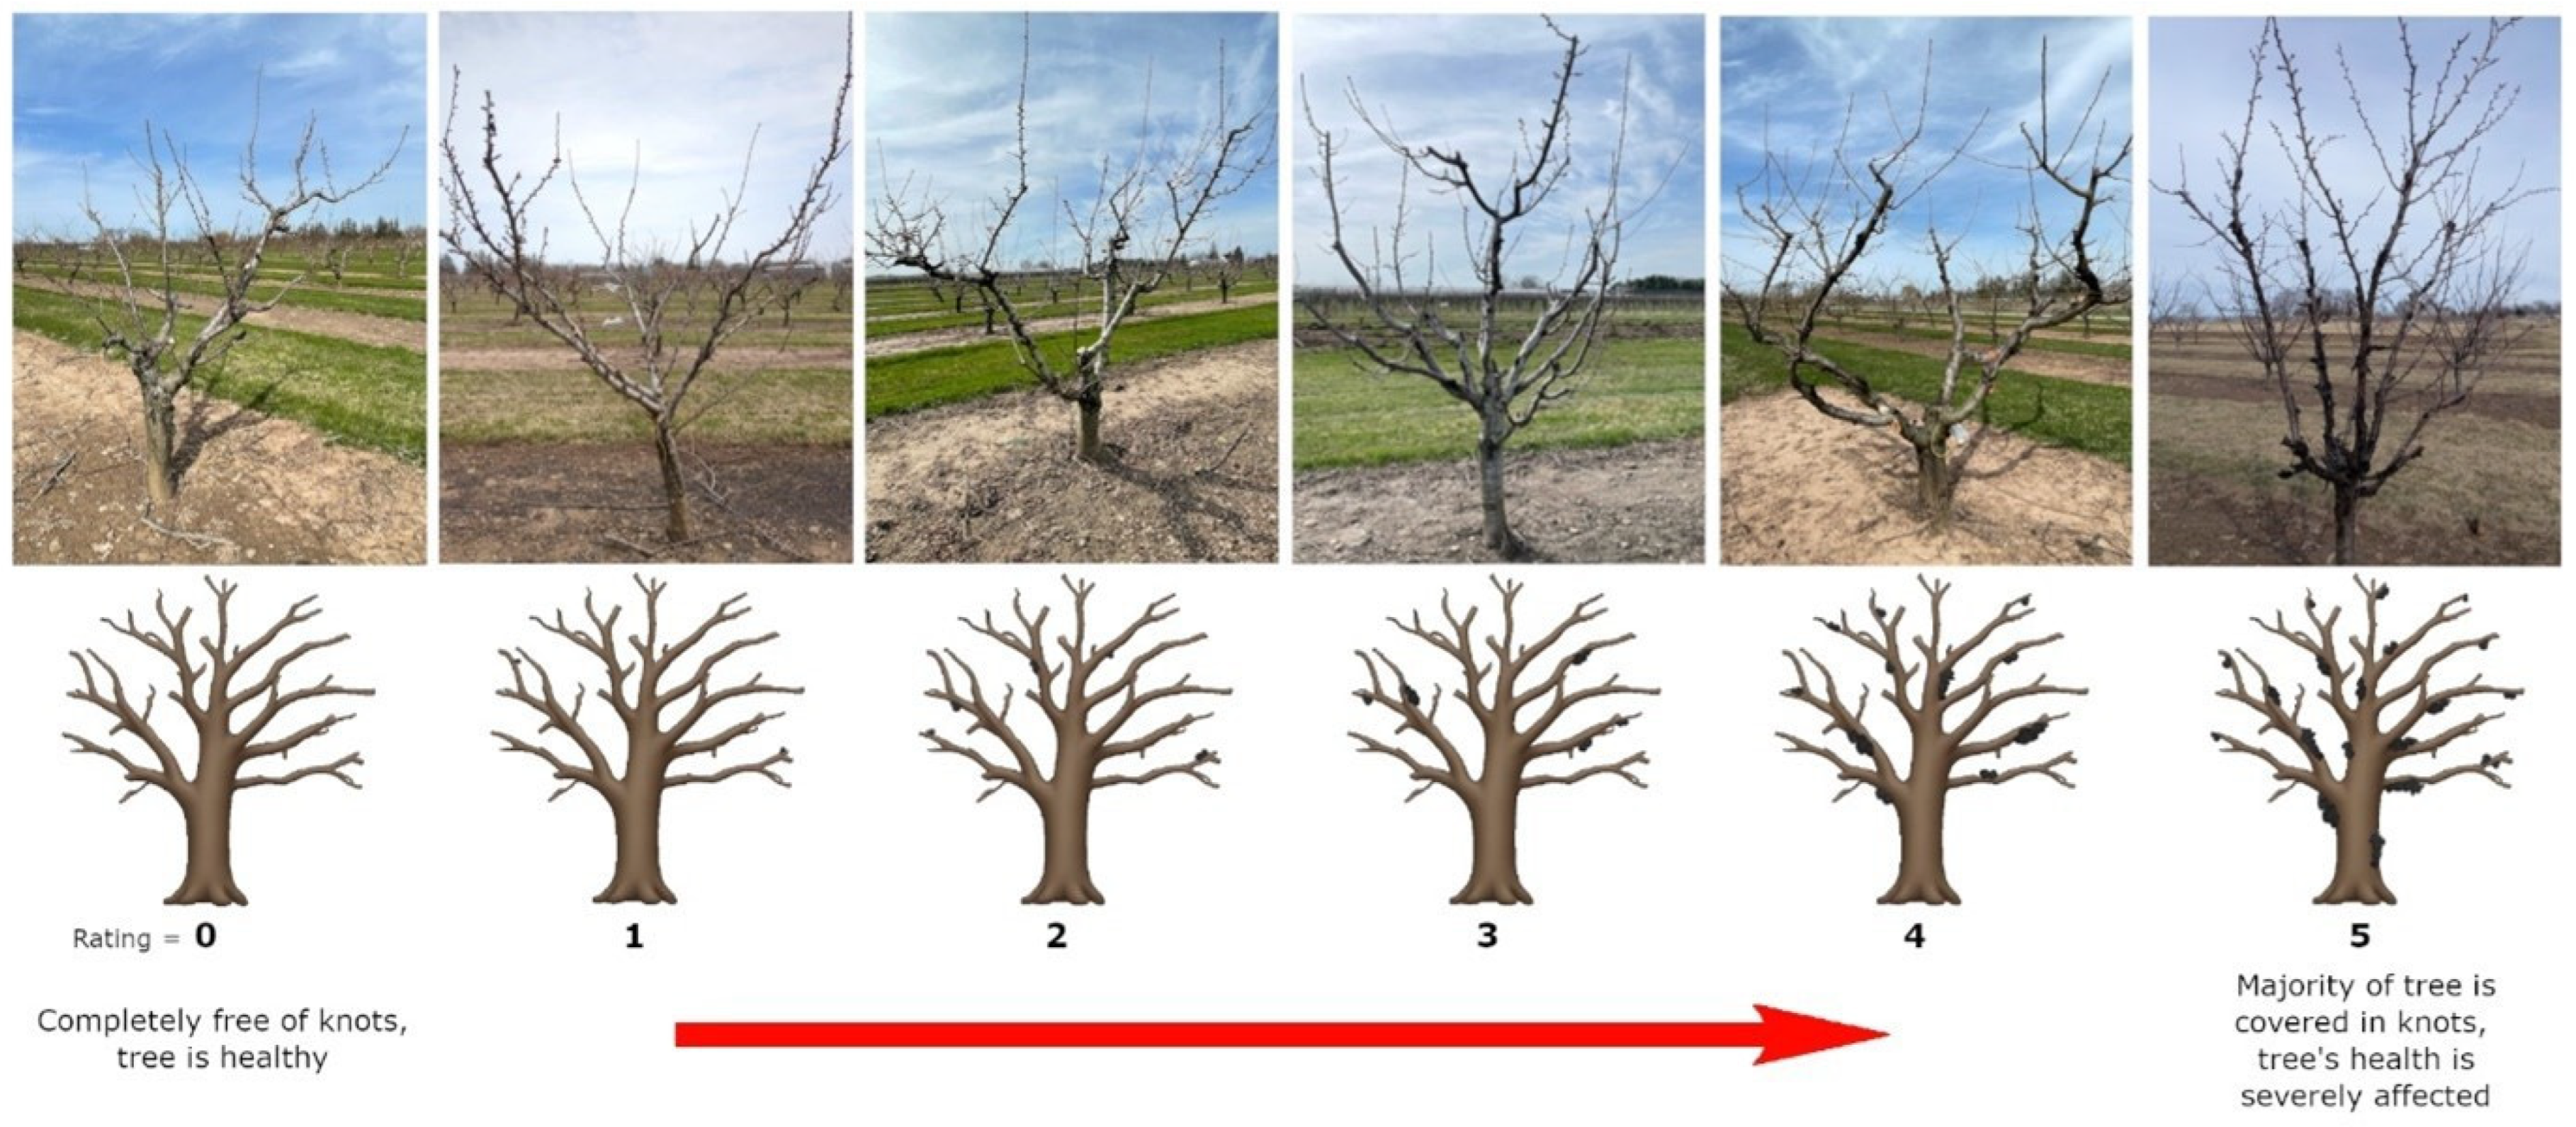
Phenotyping diseases on trees presents a unique set of challenges that differ significantly from those encountered with smaller plants or crops. The complexities arise from the size, structure, and longevity of trees, as well as the multifaceted nature of tree–pathogen interactions. The sheer size of the trees poses the first obstacle to overcome. It can be difficult to achieve a comprehensive view of the organism in its entirety, leading to missed sections. Their size also influences the amount of space they require, as they are outdoor crops, which introduces many environmental variabilities in the research. Being perennial organisms, the length of time in which a pathogen completes its life cycle must also be taken into account. Seasonal variations will also affect the growth of both the tree and the pathogen. BK, being a systemic infection, compounds all these difficulties. Random sampling of tree parts is not effective since knots are distributed unevenly over the entire tree. The tree must be viewed holistically, in 360°, and from top to bottom to ensure each knot has been accounted for. This also means that there are currently no technological applications that can aid in quantifying BK.
The only visible symptoms of BK infection are the knots themselves. There is a strong correlation between the number and size of knots, and the severity of infection of each tree, making knot observation the key factor in phenotyping. As the fungus does not directly affect the leaves, fruit, or other visible regions besides the shoots, there are no other physiological markers from which to draw parallels [12]. Therefore, a revised systematic rating system was developed, continuing from previous work [5]. The empirically established route is through germination of an ascospore on the epidermis of a new tender shoot or wounded tissue [7]. Furthermore, hyphae and conidia have been detected through the use of a scanning electron microscope (SEM) in areas of branches distal to knots [4]. This is hypothesized to be another mode of transmission, but infection studies have yet to be carried out.
As the number or size of knots on a branch heightens, other symptoms begin to appear, such as girdling and leaf wilt [8]. This is prevalent in canker-causing diseases, since the combination of the fungal invasion with the plant’s immune system causes abnormal growth of the tissues [13]. Once the fungus has established itself in the host’s tissues upon germination, the plant’s immune system is activated due to its presence. It tries to compartmentalize the fungus by growing callus tissue [14]. However, the fungus is able to colonize the callus tissue over time, turning the protective barrier into an amalgamation of host and fungal cells [15]. The callus tissue is what leads to the girdling, as the xylem and phloem soon become overtaken by dysfunctional cambial cells [15]. They gradually become obstructed so that water and carbon can no longer be transported [4]. This is evident by the periphery of the branch turning yellow and wilting.
BK understanding up to this point has been limited by the lack of a systematic method to characterize the level of infection. It is a necessity for studying the disease and analyzing the relationships between genotypes and their inherent disease resistance. Only after this has been accomplished can BK research branch into new possibilities for genetic improvements.

2. Materials and Methods

2.1. Plant Material

A group of 200 trees maintained at the University of Guelph’s Vineland Research Station, ON, Canada comprised the germplasm used in this study. The population was of mixed lineage, including named cultivars and accessions developed through the breeding program. The trees were chosen based on their diverse range of disease resistance pheno-types established previously by [5]. They were all grown outdoors in the ground and were maintained in a similar fashion. The trees were over two decades old, but for the past ten years, staff were instructed not to selectively prune BK or diseased branches. All branches were pruned evenly regardless of BK incidence. In the last decade, they were naturally infected with BK.

2.2. Using Black Knot Incidence to Phenotype Resistance

In the assessment of BK disease severity in Japanese plum trees, a systematic rating system from 0 to 5 was used. The rating scale was developed by viewing trees with vastly different BK levels. A rating of 0 was set for trees which had no knots, while a rating of 5 was assigned to the most severely affected trees (Figure 1). The gradations in between represented a qualitative progression of increasing severity, with respect to the impact on tree health. This systematic rating system provided a standardized approach for assessing and categorizing BK disease severity in Japanese plum trees:
  • A rating of 0 indicated the complete absence of symptoms, with the tree exhibiting normal health.
  • Trees assigned a rating of 1 exhibited very low severity, characterized by minimal symptoms, with a few small knots occurring sporadically on the tree, while the overall health of the tree remained unaffected.
  • In cases where a rating of 2 was assigned, severity was low, with noticeable symptoms including a greater number of knots observed on several branches; however, the majority of the tree maintained a healthy appearance.
  • A rating of 3 indicated moderate severity, with some medium-sized knots and possibly some large knots, prevalent on multiple branches, signifying a more widespread infection and a slight compromise in the overall health of the tree.
  • Trees with a rating of 4 exhibited high severity, featuring various sized knots on many branches, substantial infection and noticeable stress, impacting the tree’s growth and health.
  • The highest severity rating, 5, designated a severe infection where the tree was heavily affected with an abundance of various sized knots covering the major scaffolds or even the trunk, and the overall health clearly compromised, often accompanied by signs of decline or dieback.
Ratings were conducted in April of 2023, coinciding with the early spring season. This timing was chosen strategically, as it allowed for the assessment of BK disease symptoms before the emergence of foliage, which can obscure the visibility of knots. Early spring also provided a comfortable environment for raters to spend extended periods outdoors, ensuring that the assessment was thorough and accurate. Weather conditions played a big factor in the ability of raters to accurately assess the tree, as the ground surrounding the trees needed to be solid and dry enough for stable movement around the trees during evaluation. Unfortunately, some trees had been pruned heavily before the assessment, so it was important to include the branches with knots on the ground as well.
The system is limited by its subjective nature. Therefore, before the data collection was performed, the second rater was instructed on how to categorize knots by size, differentiate among the severity levels, and asked to conduct a trial round to practice rating. With the results of the preliminary round, the second rater was able to calibrate their ratings, allowing for adjustment so that the ratings could be more alike. Finally, each rater individually rated the 200 trees twice, occurring on separate days. This generated a total of four datasets from which the median per tree could be calculated, as well as the Kappa statistic to test for inter-rater reliability.

2.3. Kappa Statistic

The package ‘irr’ in R version 4.4.1 was used to calculate the Kappa statistic [16,17]. Since the statistic compared the ratings of each assessor, first, a single value had to be generated for each rater. To do this, an average was taken from the two days of each rater, resulting in a single rating per rater for each tree. These ratings were then used to determine the inter-rater variability. The weighted Kappa was calculated, as specified by the ‘squared’ parameter, which utilized the quadratic weights formula [18].
W i j = 1 1 j n 1 2
Equation (1) Weighted Kappa: where i denotes rater 1, j denotes rater 2, and n is the number of categories.

3. Results

3.1. Phenotypic Evaluations

To assess disease severity across 200 trees, a systematic phenotyping strategy was utilized. Each tree was given four individual ratings to enhance accuracy and reduce subjectivity. The median of the four ratings was chosen as the consensus, since taking the average of the counts produced 0.25 gradations, leading to an excessive number of bins and thus a less meaningful interpretation of the data. The distribution of the median ratings can be seen in a violin plot (Figure 2). The shape and width of each violin represents the density of the individual ratings (y-axis) that make up each median value (x-axis). A wider section at a given rating level meant that more trees received that particular rating, while narrower sections indicated the opposite. This plot pooled all the ratings from 200 trees and allowed for a visual comparison of the consistency and variability in ratings around each median value. It revealed patterns in the spread and concentration of ratings across trees.
The ratings closer to the extremes tended to have less variability likely because their symptom presentation was more clearly defined. Upon calculating the median, 0.5 gradations were generated, as seen in the plot. As one would expect, data points that made up the 0.5 bins tended to cluster just above and just below the interval, as seen by the hourglass shape. For instance, the rating of 2.5 had a symmetrical distribution between 2 and 3. Ratings of 1.5, 2.5, and 3.5 had a similar shape as they were composed of the respective adjacent ratings. Closer towards the extremes, ratings of 0.5 and 4.5 displayed a similar shape; however, they were truncated since they had a lower or upper cut-off, respectively. Interestingly, ratings 1, 2, and 3 had a comparable distribution, indicating a small tendency to contain inflated ratings. This means that out of the four total ratings, one or two of the ratings were higher than the final median value. However, the violin plot uncovered instances of underestimation at median rating 5, as the ratings showed a slight tendency to fall below the median. In the case of two trees with ratings of 3, 5, 5, and 5, the median remained 5. This suggested that while the overall consensus leaned towards a rating of 5, there were occasionally lower ratings that pulled the distribution slightly downward. The plot highlights that trees with either very low or very high levels of symptoms were more consistently rated, while trees with intermediate symptoms showed more variability in their ratings.
The range of the four ratings per tree was calculated to determine the variability of ratings (Figure 3). For instance, if the four ratings given to a tree were 0, 1, 2, and 1, the range would be 2. All of these values were tallied up to generate the histogram. This plot was generated to clearly categorize the variance in ratings since a low variability was ideal. It was the optimal way in which the level of differences could be quantified and assessed. The maximum difference between the lowest and highest rating given to a tree was 3, and this accounted for only 4% of the ratings. A range of 0 indicated that all four ratings were in complete accordance with each other, this accounted for 17.5% of the ratings. Indicating low variability, a range of 1 produced the highest proportion of the ratings, resulting in 52% of the counts. Lastly, 26.5% of the ratings per tree had a variation of 2. Interestingly, all eight trees which fell in the category of the highest range, 3, had higher ratings on day 1 compared to day 2 for both raters.

3.2. Low Inter-Rater Variability

To determine the inter-rater variability, the Kappa statistic was implemented. This approach allowed us to quantify if the ratings had consistency while taking into account the possibility for ratings to be the same due to chance. By doing so, the subjective ratings could provide some assurances that they were based on a systematic, repeatable procedure. Additionally, it provided greater confidence that both of the raters followed the methodology closely. The weighted Kappa was chosen since a function of the statistic was that the ratings closer together on the scale were weighted as being in greater agreement than ones farther apart [18]. This weighting system also gave larger penalties to ratings the farther apart they were. This was an important distinction to make, otherwise any disagreement would have been weighed the same, whether it was a 1 versus 2 compared to a 1 versus 3, for example. Small differences in the ratings likely reflected a minute difference in perception of the disease severity, whereas large differences suggested a fundamental disagreement on the disease severity observed. The weighted Kappa resulted in 0.903. This was a fairly high value, meaning that the assessment of each rater was in acceptable accordance with one another. According to McHugh (2012), a score of 0.90 means 81% agreement between the raters [19].

4. Discussion

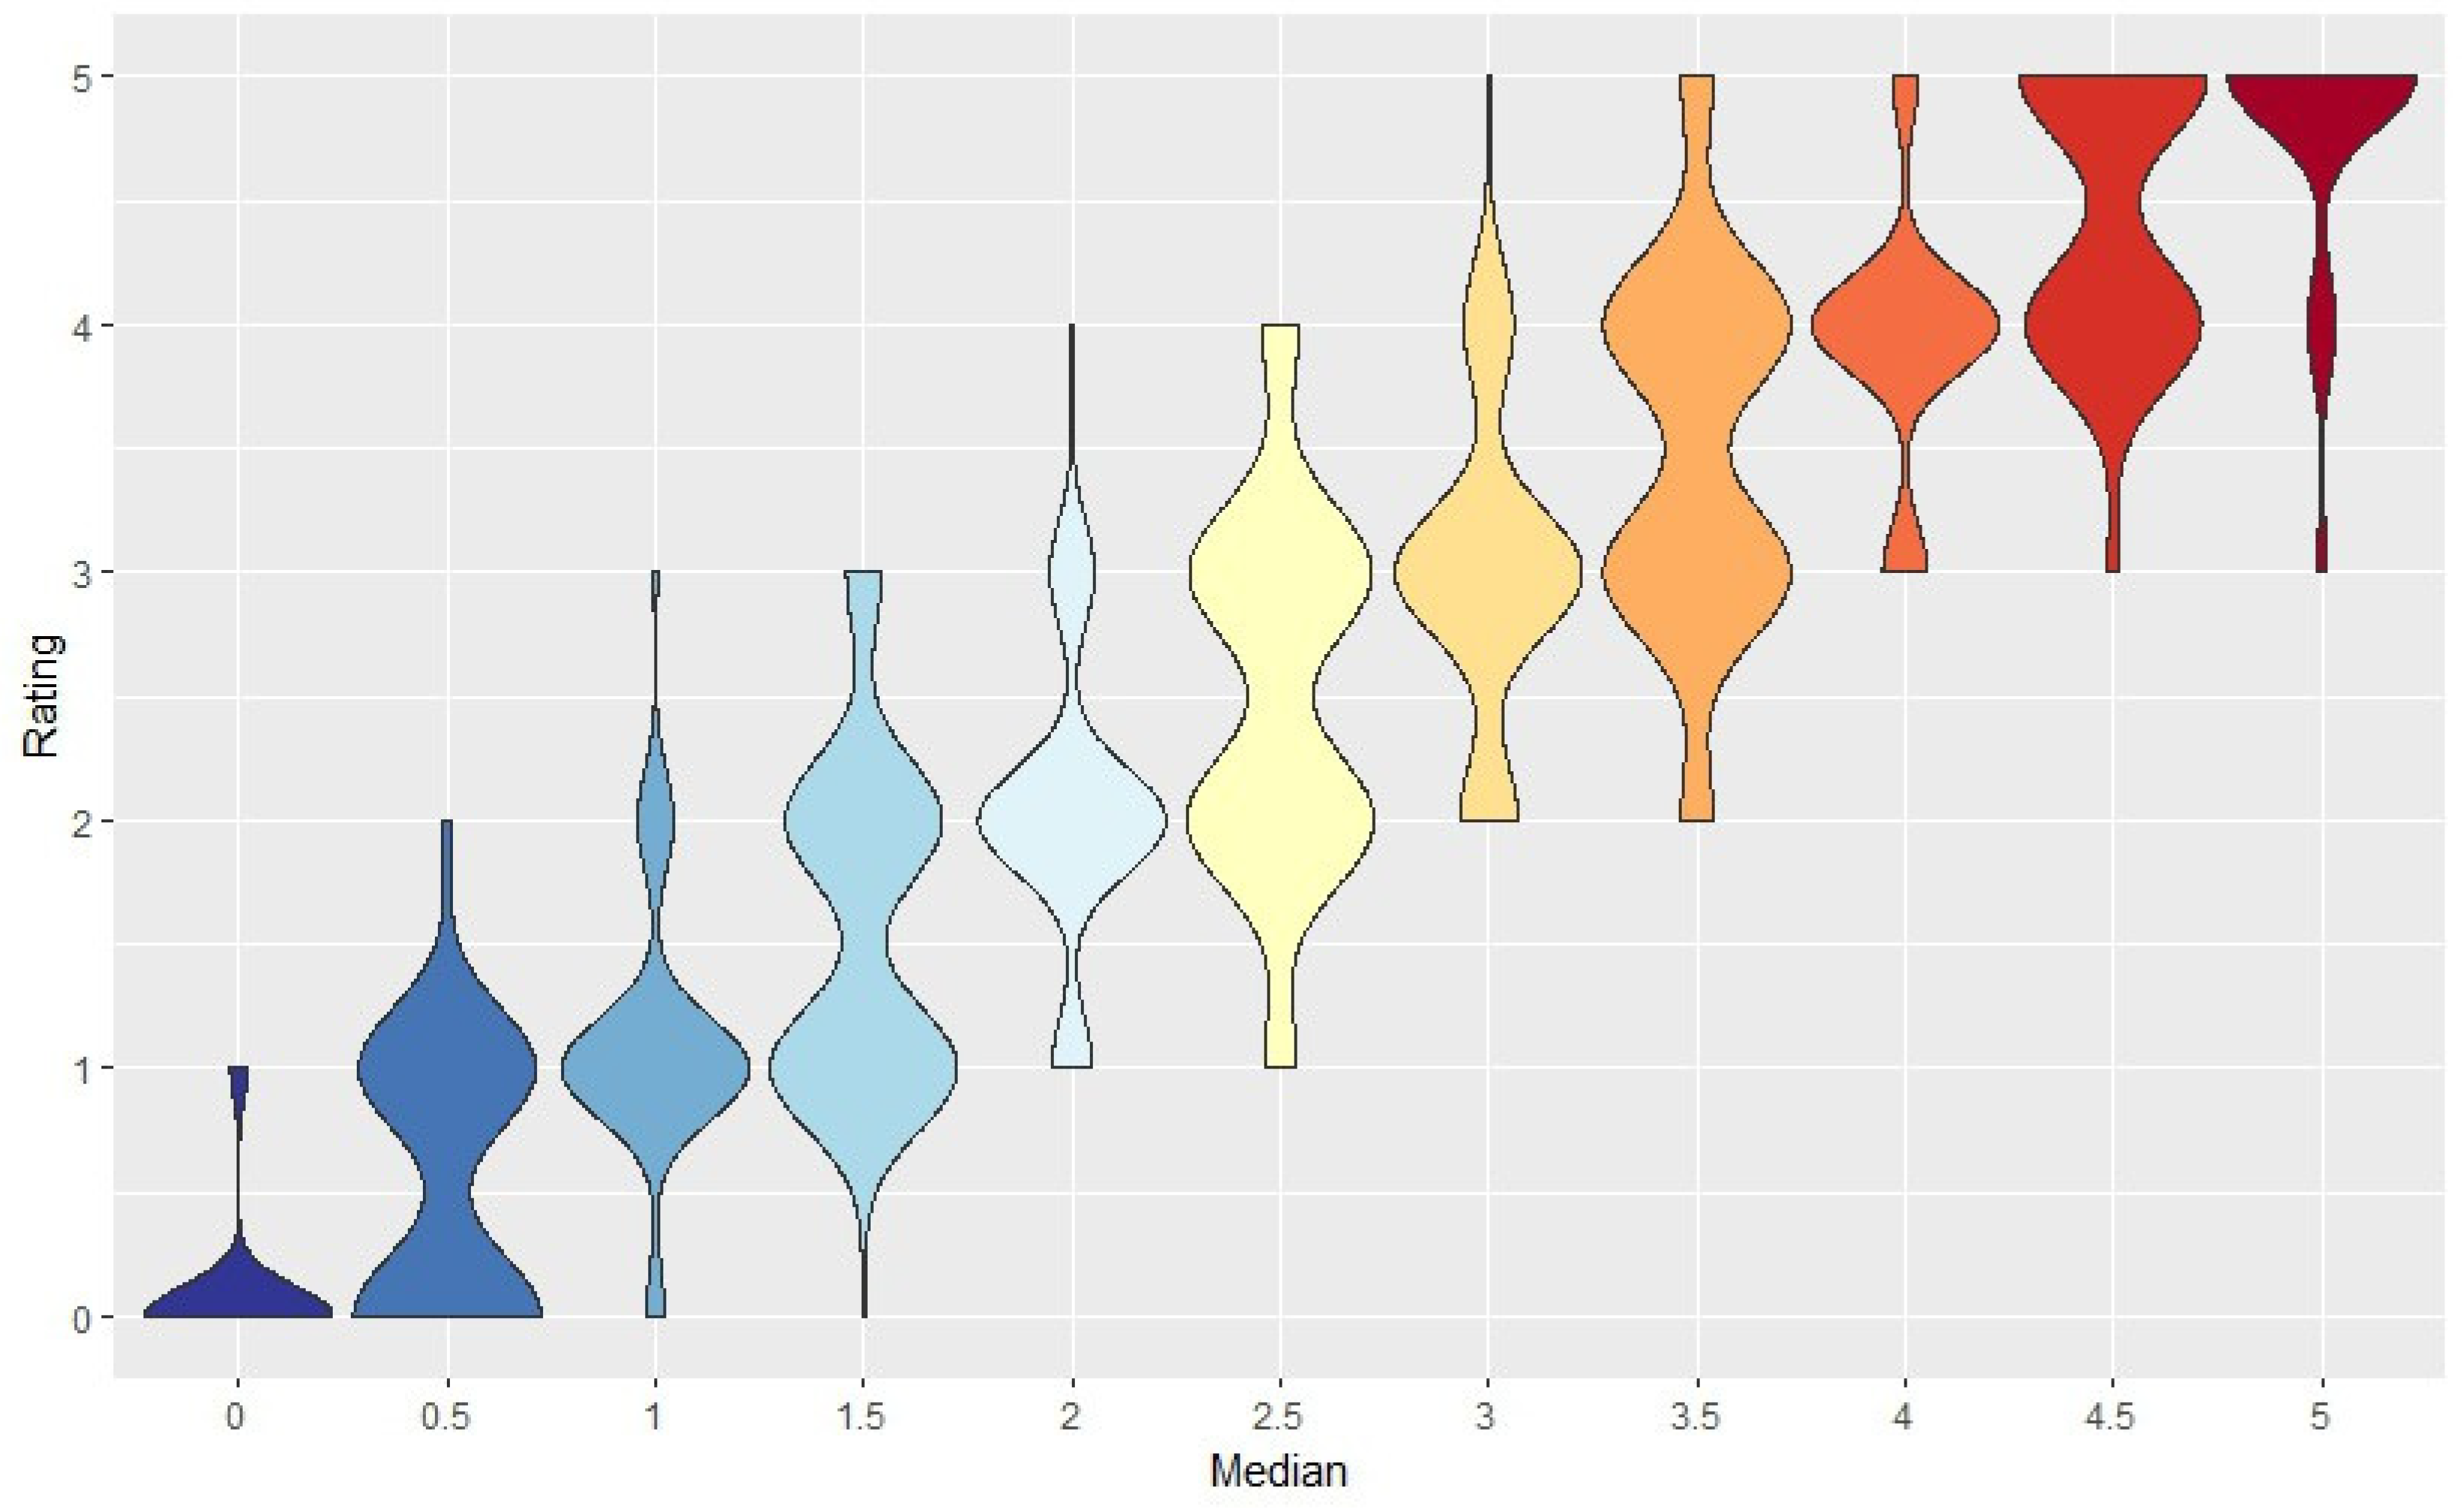
Low variability among the ratings is an important indicator of whether the raters could consistently follow the rating system. It was unsurprising there would be some degree of variability, due to the raters’ experience with BK, visual acuity, and general knowledge of 
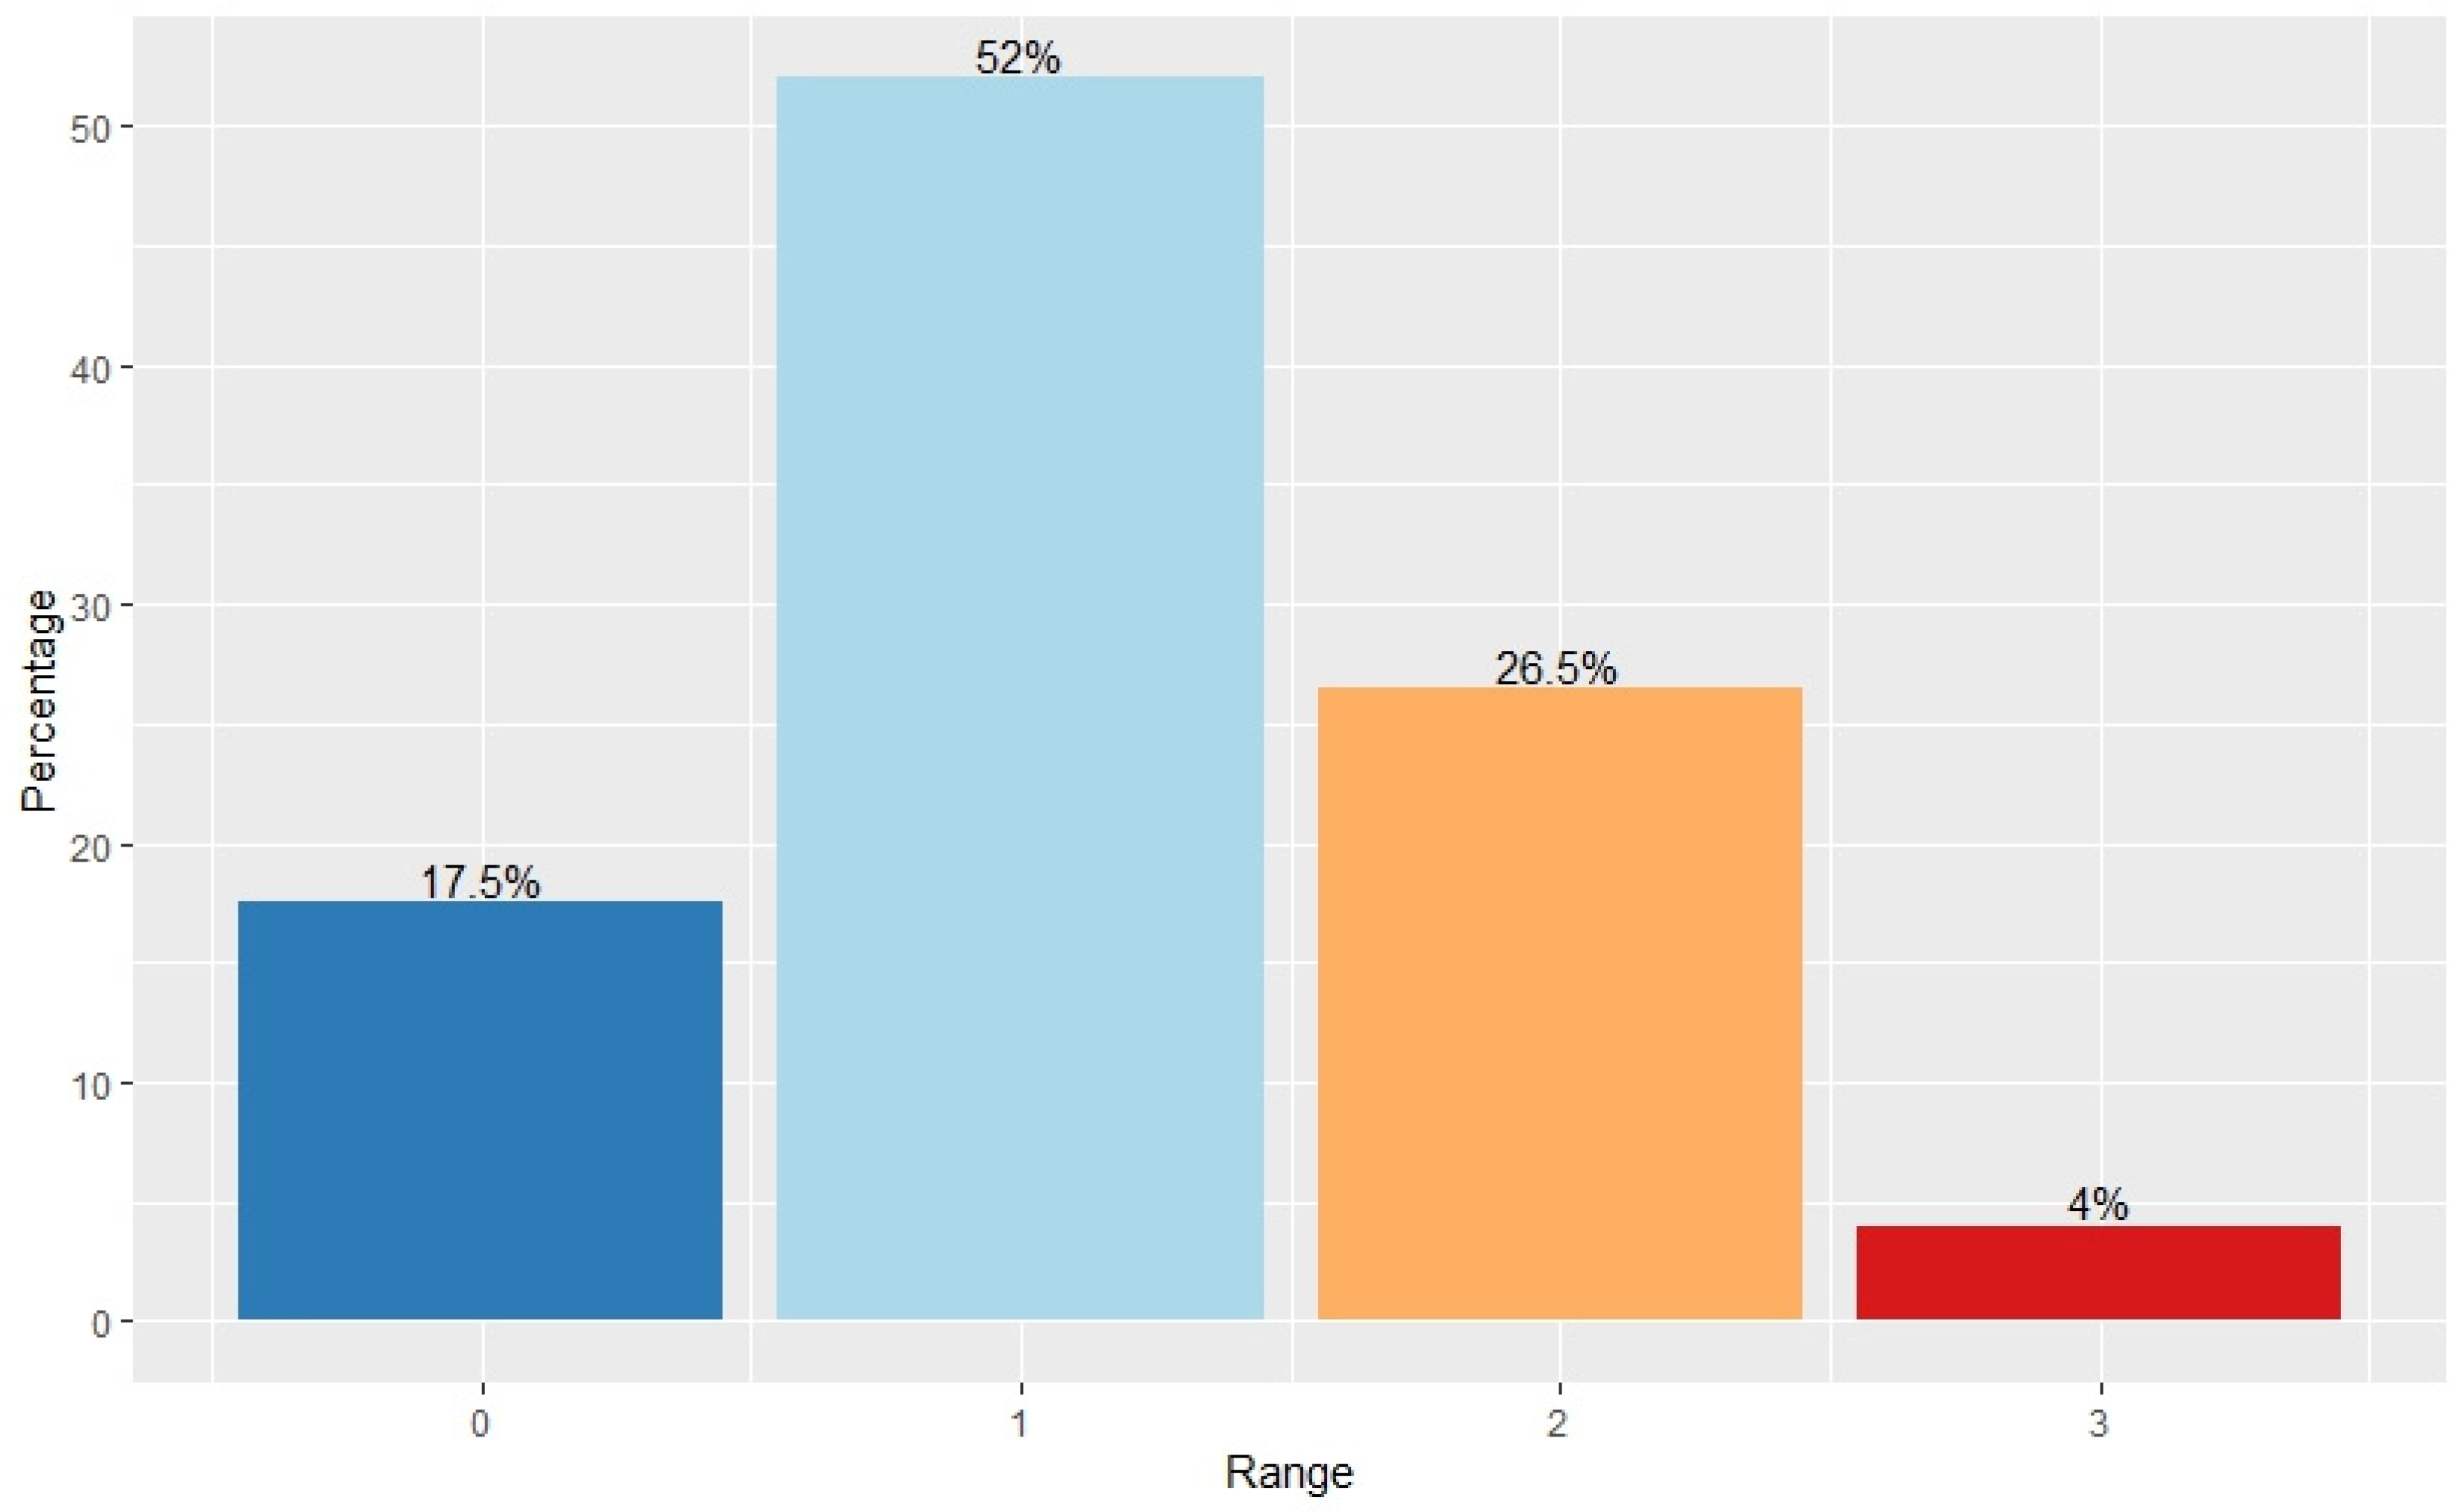
P. salicina tree health. Taking the median of all four ratings eliminated outliers and provided a rating that was based on a consensus. When combining the number of trees that had a range of 0 and 1 in their total counts (Figure 3), this made up 69.5% of all the samples. This meant that of the 200 trees, 139 had a maximum difference of one between all four ratings. Therefore, the majority of counts fell within the low range, indicting low variability.

4.1. Improvements in the Revised BK Rating System

The main difference between the previous rating system by [5] and the current one is the removal of the formula to determine the overall rating of a specific tree. In brief, each individual knot was given a rating based on its size from 1 to 5 and summed, then the total was divided by the number of knots on the tree. It was flawed because it was unable to differentiate between a tree with few but larger knots, and a tree with many smaller knots. The formula attempted to scale the number of knots per tree, causing misleading conclusions. For example, if a tree had 10 small knots rated as 1, the sum would be 10, and when divided by the number of knots, 10, the final score would be 1. However, if another tree had only 1 small knot rated as 1, the sum would also equate to 1, and dividing by the number of knots, 1, would yield the same final score of 1. In both cases, the final score would be identical, even though one tree had 10 knots, while the other had only 1. This meant the system could not differentiate between a heavily infected tree with many small knots and a minimally infected tree with just one small knot. As a result, the true severity of the infection was not reflected in the final rating, making it difficult to accurately assess and compare tree health based on the number and size of knots.
Additionally, the revised system began at 0, to indicate the absence of knots instead of 1. The tree’s health was also taken into account since the subjectivity of the rating depended on considering the tree as a whole, rather than solely the scaled sum of the knot values. Considering that the previous rating system used a different scale, comparisons being made between the past results and the current work must take this into account. The lower limit of both rating systems representing a knot-free tree served as the first constant. In the previous study, in 2015 and 2018, 20% and 16% of the trees were asymptomatic, respectively. Five years later in 2023, this number dropped significantly to 4%. The most likely explanation was that the environmental conditions were more favorable to A. morbosa during this period. Due to the yearly increase in knots in the orchard, the abundance of A. morbosa ascospores was likely on the rise. This would cause more of the pathogen to spread amongst the trees, since more inoculum was present. On the other hand, due to the atypical climate conditions in the previous years, this could have caused more favorable conditions for the fungus to spread and grow, which the tree’s defenses were not equipped to manage. Variations in temperature, humidity, and precipitation could have negatively influenced the tree’s overall health while also providing more favorable conditions to the pathogen. This included harsher winters, wetter springs, and dryer summers, all contributing to larger numbers of infections. The total annual precipitation and average temperatures increased from 2015 and 2018 to 2023 in the area, which correlated to amplified disease prevalence [20]. A rating of 5, which was the upper limit of both scales, could also be reasonably compared. Contrasting to the counts of the lower limit, the number of trees given the highest severity increased from 2015 to 2018, from 0% to 6% but still remained at 6% in 2023. This implied that since there had not been a significant change in the number of highly susceptible trees in the population, the numbers had stabilized. The stabilization of the number of highly susceptible trees suggests that the overall population’s susceptibility had become consistent over the years, rather than suggesting individual trees were becoming more resistant.

4.2. Assessing Agreement with Kappa Statistic

Originally, Kappa scores were developed for the field of psychology. Since many diagnoses cannot be measured in empirical terms and often times there would be observations made by more than one professional, this statistic was developed to generate a way to report the reproducibility/reliability of a judgement. It was specifically designed for nominal scales; however, it was later improved to include scaled ratings, i.e., ordinal data. The Kappa statistic is superior to taking a simple calculation on percent agreement as it takes into the account the possibility of the consensus occurring by chance [21]. Kappa scores are expressed as −1 to 1. A negative score signifies that the raters are in high disagreement with each other. A score of 1 indicates complete agreement, while 0 indicates agreement is only based on chance [22].

4.3. Challenges with Visual Rating Systems

As noted, all eight of the trees with a difference of three across all four ratings consistently had higher ratings from both raters on the first day. Although this high level of variance accounted for the smallest proportion of all trees, it could be deduced that trees with a medium overall rating, were more prone to rating fluctuations, as seen from the majority of these trees having a median rating between 2.5 and 3.5. This pattern suggests that external factors, including environmental conditions and observer biases, may have influenced the assessments. The fact that the first-day ratings were higher could indicate that the raters were initially less familiar with both the disease symptoms and rating system, leading to more cautious and severe scoring. Additionally, the weather conditions such as lack of cloud cover and direct sunlight may have also played a role in making the knots more pronounced and obvious, as opposed to having them more easily mistaken as injury or the previous season’s dried and darkened plums.
Visual rating systems do not have the highest precision; however, for diseases like BK, options are scarce. With the help of machine learning and sensor-based image systems, we attempted to ascertain whether we could train a computer model to quantify the knots on a tree to improve the accuracy of the ratings. This included using a high-definition red, green, and blue (RGB) camera and a depth camera to generate a three-dimensional (3D) image of the tree. The plan was to manually select the knots on a sample set of data and then train an algorithm on detecting knots. With the depth camera, a 3D point cloud could have been generated to calculate the percentage of affected areas. Unfortunately, even with multiple viewpoints of the tree, the resolution was not high enough to differentiate between knots, shadows, or dried fruits. An even more sophisticated system must be implemented to phenotype this difficult disease as the entire tree has to be taken into account. A single missed knot could alter the rating greatly, from 0 to 1.
It is well understood that visual assessment in horticulture poses many limitations. There can be significantly different conclusions due to the results being subject to observer biases. As defined by Johnson et al., bias is the under- or over-estimation of disease due to errors in visual accuracy and diagnosis [23]. When the disease is diagnosed by visual symptoms alone, anything that can affect the perception of the perceivable manifestations of the illness has the potential to alter the prognosis. Regardless of the limitations, visual assessments have been the longstanding method in breeding and cultivation due to their practicality and cost-effectiveness. Factors that may affect the precision of the ratings are the raters’ experience, amount of training, depth of instruction, visual acuity, and sensitivity to outdoor conditions such as light [3]. One obvious drawback is that visual assessments lack the ability to detect asymptomatic plants. This can be especially problematic for diseases such as BK, which have a long inoculation period, in which there could be high disease prevalence in an orchard, but can go undetected for up to two years [6]. Then, a sudden spike of infected trees can erupt, and heavy pruning and fungicides must be implemented to prevent the spread of the disease.
Standard area diagrams (SAD) have been used for over 50 years and have been shown to improve the accuracy of disease phenotyping [24]. SADs are commonly used in plant pathology to provide visual references for quantifying disease severity on leaves or small plant parts. However, they are not applicable for assessing BK disease on whole trees due to several inherent limitations. First, BK disease manifests as galls of varying sizes and numbers across different parts of the tree, including the branches and the trunk, making it challenging to capture this complexity in a two-dimensional diagram. Additionally, the 3D nature of trees and the distribution of knots across a large and often irregular surface area cannot be adequately represented by SADs, which are designed for relatively uniform and flat surfaces like leaves, fruits, or plantlets [25]. Moreover, the severity of BK disease impacts the overall structure and health of the tree, aspects that require a holistic view rather than isolated assessments of discrete areas. As such, subjective phenotyping systems that factor in the total number, size, and distribution of knots, as well as the overall health impact on the tree, are more appropriate for evaluating BK disease severity in whole trees.
Visual inspection of phony peach disease (Xylella fastidiosa subsp. multiplex Schaad) showed high accuracy, 0.914 and 0.816 (experienced vs. inexperienced raters), after confirmation with quantitative polymerase chain reaction (qPCR). Their visual assessment also involved the entire tree; however, their rating system was markedly different, comprising of only the presence or absence of the disease. In this sense, their rating system was much simpler, but the detection of the disease itself was far less obvious compared to BK. The symptoms were difficult to differentiate between stressed trees, so there were both false negatives and false positives [23]. False negatives can be common in BK rating if knots have yet to mature, while false positives are rarer since few other fungi species have a similar presentation of BK in our region.

4.4. Potential to Improve Phenotyping Accuracy

Another approach that could be beneficial in the study of BK is artificial inoculation and assessment. Although infection with BK of plum shoots has yet to be reported in vitro, this could be an important milestone to accomplish in BK research. Many more genotypes could be tested in a small amount of space, while eliminating all other variables such that the growing conditions are virtually indistinguishable. Analysis of the growing lesions could be more easily assessed as they would not have to be conducted outdoors under variable weather and lighting conditions. Growth of the fungus would also not be dependent on the seasons, allowing for ongoing assessment. Lastly, the use of an automated image software would be more easily facilitated. A similar approach was taken by Li et al., (2015) studying bacterial cankers (Pseudomonas syringae Van Hall) on a few Prunus species [26]. They coupled this approach with automated image analysis using neural networks to recognize the patterns. However, the application of this in BK research may pose certain problems as the susceptibility in vitro may not reflect the true phenotype in the field.

5. Conclusions

The phenotyping of BK in Japanese plum is a challenging study, yet we were able to generate an acceptable, reproducible system of evaluation which produced data that could be successfully used for other experiments. Visual assessments will always inherently contain human error. Replicated observations by multiple raters over different times is an attempt to minimize and understand the variability. As per the high Kappa score of 0.903, the method described proved to have high reproducibility. The 200 trees genotyped in this research serve as the basis for the subsequent genomic and metabolomic studies.

Author Contributions

Conceptualization, J.S.; methodology, W.M.-S. and C.S.; validation, C.S.; formal analysis, C.S.; investigation, C.S., J.S.; resources, J.S.; data curation, C.S.; writing—original draft preparation, C.S.; writing—review and editing, J.S., W.M.-S. and C.S.; visualization, C.S.; supervision, J.S.; project administration, J.S., W.E.K.; funding acquisition, J.S. All authors have read and agreed to the published version of the manuscript.

Funding

The project was funded by grants from Ontario Ministry of Food, Agriculture and Rural Affairs (OMAFRA), Ontario Tender Fruit Marketing Board and Niagara Peninsula Fruit and Vegetable Growers Association to J.S. (UofG2015-2410) and a number of Ontario Agricultural College Scholarships to C.S.

Data Availability Statement

The authors confirm that data generated in this study are available in the manuscript.

Acknowledgments

The work would not be possible without the help and hard work of the farm crew at Vineland Research and Innovation, led by Michael Josiak. A special thanks to Duong (Robin) Nguyen for undergoing training and partaking in disease severity ratings. We appreciate the time and effort that David Weales and Matt Veres from the University of Guelph’s Engineering Department dedicated to exploring the feasibility of developing an automated rating system. We dedicate this work to the memory of Ms Rattandeep Gill, who started the work in black knot research, but left us in July 2024.

Conflicts of Interest

The authors declare no conflicts of interest.

Abbreviations

The following abbreviations are used in this manuscript:
BKBlack Knot
DSRDisease Severity Rating
LiDARLight Detection And Ranging
qPCRQuantitative Polymerase Chain Reaction
RGBRed, Green, and Blue
SADStandard Area Diagram
SEMScanning Electron Microscope

References

  1. Liu, W. Plum Production in China. Acta Hortic. 2007, 734, 89–92. [Google Scholar] [CrossRef]
  2. Cobb, J.N.; DeClerck, G.; Greenberg, A.; Clark, R.; McCouch, S. Next-Generation Phenotyping: Requirements and Strategies for Enhancing Our Understanding of Genotype–Phenotype Relationships and Its Relevance to Crop Improvement. Theor. Appl. Genet. 2013, 126, 867–887. [Google Scholar] [CrossRef] [PubMed]
  3. Bock, C.H.; Barbedo, J.G.A.; Del Ponte, E.M.; Bohnenkamp, D.; Mahlein, A.-K. From Visual Estimates to Fully Automated Sensor-Based Measurements of Plant Disease Severity: Status and Challenges for Improving Accuracy. Phytopathol. Res. 2020, 2, 9. [Google Scholar] [CrossRef]
  4. El Kayal, W.; Chamas, Z.; El-Sharkawy, I.; Subramanian, J. Comparative Anatomical Responses of Tolerant and Susceptible European Plum Varieties to Black Knot Disease. Plant Dis. 2021, 105, 3244–3249. [Google Scholar] [CrossRef] [PubMed]
  5. Shinde, R. Identification of Black Knot Resistance in Plums Using a Multipronged Approach. Ph.D. Thesis, University of Guelph, Guelph, ON, Canada, 2023. Available online: https://atrium.lib.uoguelph.ca/items/27bd2b2d-b80c-491f-8143-9db893f73597 (accessed on 5 May 2024).
  6. Northover, J.; McFadden-Smith, W. Control and Epidemiology of Apiosporina Morbosa of Plum and Sour Cherry. Can. J. Plant Pathol. 1995, 17, 57–68. [Google Scholar] [CrossRef]
  7. Koch, L. Investigations on the Black Knot of Plums and Cherries, III. Symptomatology, Life History, and Cultural Studies of Dibotryon morbosum (Sch.) T. and S. Can. J. Plant Pathol. 2006, 28, S92–S108. [Google Scholar] [CrossRef]
  8. Ontario Ministry of Agriculture. Food and Rural Affairs Ontario Crop IPM-Plums. 2024. Available online: https://cropipm.omafra.gov.on.ca/en-ca/crops/plums/diseases/66f25c80-1c78-4ec1-8aba-f2c79f5f1dbd (accessed on 10 October 2024).
  9. Snover, K.; Arneson, P. Black Knot. Plant Health Instr. 2002, 2. [Google Scholar] [CrossRef]
  10. EPPO Global Database. Apiosporina morbosa (DIBOMO) [Dataset]. Available online: https://gd.eppo.int/taxon/DIBOMO/categorization (accessed on 3 June 2024).
  11. EFSA Panel on Plant Health (PLH); Jeger, M.; Bragard, C.; Caffier, D.; Candresse, T.; Chatzivassiliou, E.; Dehnen-Schmutz, K.; Gilioli, G.; Grégoire, J.; Miret, J.A.J.; et al. Pest Categorisation of Apiosporina morbosa. EFSA J. 2018, 16, e05244. [Google Scholar] [CrossRef] [PubMed]
  12. Wilcox, W.F. Black Knot of Plums, 6th ed.; Cornell Cooperative Extensions: Ithaca, NY, USA, 1992. [Google Scholar]
  13. Moorman, G. Cankers of Hardwood Deciduous Trees. 2023. Available online: https://extension.psu.edu/cankers-of-hardwood-deciduous-trees (accessed on 17 July 2024).
  14. Smith, K.T. Whither Compartmentalization of Decay in Trees? A Commentary on: ‘Using the CODIT Model to Explain Secondary Metabolites of Xylem in Defence Systems of Temperate Trees against Decay Fungi’. Ann. Bot. 2020, 125, iv–vi. [Google Scholar] [CrossRef] [PubMed]
  15. Wainwright, S. Developmental Morphology of the Black Knot Pathogen on Plum. Phytopathology 1970, 60, 1238–1244. [Google Scholar] [CrossRef]
  16. Gamer, M.; Lemon, J.; Singh, I. Irr: Various Coefficients of Interrater Reliability and Agreement. 2019. Available online: https://cran.r-project.org/web/packages/irr/index.html (accessed on 21 March 2024).
  17. R Core Team. Version 4.4.1 R: A Language and Environment for Statistical Computing; R Core Team: Vienna, Austria, 2021. [Google Scholar]
  18. Fleiss, J.L.; Cohen, J. The Equivalence of Weighted Kappa and the Intraclass Correlation Coefficient as Measures of Reliability. Educ. Psychol. Meas. 1973, 33, 613–619. [Google Scholar] [CrossRef]
  19. McHugh, M.L. Interrater Reliability: The Kappa Statistic. Biochem. Med. 2012, 22, 276–282. [Google Scholar] [CrossRef]
  20. National Climatic Data Center. Global Summary of the Year Station Details: Welland Pelham, CA, GHCND: CA006139449|Climate Data Online (CDO) [Dataset]. 2024. Available online: https://www.ncei.noaa.gov/cdo-web/datasets/GSOY/stations/GHCND:CA006139449/detail (accessed on 8 September 2024).
  21. Cohen, J. A Coefficient of Agreement for Nominal Scales. Educ. Psychol. Meas. 1960, 20, 37–46. [Google Scholar] [CrossRef]
  22. Ensrud, K.E. Methods in Studies of Osteoporosis; Dempster, D.W., Cauley, J.A., Bouxsein, M.L., Cosman, F., Eds.; Academic Press: Cambridge, MA, USA, 2021; pp. 381–403. [Google Scholar]
  23. Johnson, K.A.; Brannen, P.M.; Chen, C.; Bock, C.H. Visual Assessment of Phony Peach Disease: Evaluating Rater Accuracy and Reliability. Plant Dis. 2024, 108, 930–940. [Google Scholar] [CrossRef] [PubMed]
  24. Clive, J. An Illustrated Series of Assessment Keys for Plant Diseases, Their Preparation and Usage. Can. Plant Dis. Surv. 1971, 51, 39–65. [Google Scholar]
  25. Del Ponte, E.M.; Pethybridge, S.J.; Bock, C.H.; Michereff, S.J.; Machado, F.J.; Spolti, P. Standard Area Diagrams for Aiding Severity Estimation: Scientometrics, Pathosystems, and Methodological Trends in the Last 25 Years. Phytopathology 2017, 107, 1161–1174. [Google Scholar] [CrossRef] [PubMed]
  26. Li, B.; Hulin, M.T.; Brain, P.; Mansfield, J.W.; Jackson, R.W.; Harrison, R.J. Rapid, Automated Detection of Stem Canker Symptoms in Woody Perennials Using Artificial Neural Network Analysis. Plant Methods 2015, 11, 57. [Google Scholar] [CrossRef] [PubMed]
Figure 1. Pictograph of rating system with Prunus salicina trees of increasing disease severity ratings (DSR) as denoted by numbers under the trees. Animation adapted from: A bare tree with no leaves ©minwoo CC BY-ND 4.0.
Horticulturae 11 00482 g001
Figure 2. Violin plot showing the distribution of ratings on Prunus salicina sample population (n = 200), sorted by the median rating, with a rating of 0 indicating no visible symptoms, and 5 indicating the highest disease severity. Cooler colors denote a lower median score, while warmer colors refer to a higher score. Each tree was separately rated (n = 4), by two different people over a two-day period.
Horticulturae 11 00482 g002
Figure 3. A histogram depicting the ranges for all trees (n = 200) shown as a percentage. The lowest rating was subtracted from the highest rating from the 4 total ratings per tree, to assess the range. The proportion of total counts at a given range is shown. Cooler colors indicate a lower range, warmer colors indicate a higher range.
Horticulturae 11 00482 g003
Disclaimer/Publisher’s Note: The statements, opinions and data contained in all publications are solely those of the individual author(s) and contributor(s) and not of MDPI and/or the editor(s). MDPI and/or the editor(s) disclaim responsibility for any injury to people or property resulting from any ideas, methods, instructions or products referred to in the content.

