Article

Characterizing the Endophytic Microbiome and Microbial Functional Assemblages Associated with Fengtang Plum (Prunus salicina Lindl.) Development and Resistance

1
Department of Food Science and Engineering, Guiyang University, 103 Jianlongdong Road, Guiyang 550005, China
2
Guizhou Key Laboratory of New Quality Processing and Storage of Ecological Specialty Food, Guiyang 550005, China
*
Author to whom correspondence should be addressed.
Horticulturae 2025, 11(5), 483; https://doi.org/10.3390/horticulturae11050483
Submission received: 31 March 2025 / Revised: 24 April 2025 / Accepted: 25 April 2025 / Published: 30 April 2025
(This article belongs to the Section Postharvest Biology, Quality, Safety, and Technology)

Abstract

:
Fengtang plum, a novel cultivar recently developed in China, has gained huge popularity due to its large fruit size, crisp sweetness, distinctive aroma, and notable resistance to brown rot caused by Monilinia spp. To investigate microbial community dynamics during fruit development, we analyzed samples from three phenological stages: fruit-setting (BSP1), veraison (BSP2), and maturity (BSP3). Our results demonstrated stage-specific microbial succession patterns: alpha diversity indices (observed species, ACE, PD_whole_tree) significantly increased at BSP2/BSP3 versus BSP1, accompanied by diverging Shannon index trends between bacteria (progressive enhancement) and fungi (stage-dependent reduction). Bacterial communities maintained Proteobacteria and Firmicutes dominance while accumulating low-abundance species (18.06–61.84%), whereas Ascomycota constituted the persistent fungal phylum with Trichoderma, reaching 95.91% dominance at BSP3. Community differentiation primarily arose from stage-specific bacteria Ralstonia, Brevundimonas, and Limnobacter, and dominant fungi Trichoderma and Cladosporium. Bacterial metabolic shifts were predicted to transition from basic energy production to complex organic/aromatic compound utilization, contrasting with fungal transitions from pathogen–saprophyte competition to saprophytic dominance. While the enrichment of Lactobacillus and Trichoderma during mid-to-late stages may suggest potential associations with aromatic compound production and fungal pathogen resistance, these hypotheses require validation through targeted metabolomics and pathogen challenge experiments. This study elucidates microbial community succession patterns during Fengtang plum development; notably, functional predictions were inferred from 16S/ITS sequencing data rather than direct metagenomic or metatranscriptomic analyses, thus limiting mechanistic interpretations, though future work integrating multi-omics approaches would strengthen functional insights.

1. Introduction

Fruits harbor a considerable number of various epiphytic and endophytic microorganisms that coevolve with their hosts in environment for a long time [1]. Spatiotemporal analyses reveal fruits’ microbiome variations across phenological stages, influenced by tissue type, cultivar genetics, and biogeography [2,3,4]. For instance, seasonal shifts in endophytic bacterial communities of mulberry cultivars revealed higher operational taxonomic units (OTUs), α-diversity, and community complexity in spring (dominated by Methylobacterium [Proteobacteria] and Actinobacteria) compared with in autumn (enriched with Pantoea and Pseudomonas [Proteobacteria]), with seasonality driving β-diversity clustering more prominently than the host cultivar [3]. Similarly, tissue-specific microbial partitioning was observed in Citrus reticulata cv. Chachiensis, where 16S rRNA sequencing of 60 soil, root, leaf, and phloem samples (>2.5 million sequences) identified Proteobacteria, Actinobacteria, and Acidobacteria as dominant phyla, validated by multivariate analyses (PCoA, CAP, Anosim, MRPP) [4]. Postharvest studies further highlighted fruit-type specificity, and peaches exhibited the highest bacterial richness among apples, peaches, and oranges, with harvest time significantly altering diversity in peaches and oranges (but not apples) through species replacement (70% nestedness in apples vs. balanced replacement nesting in others) [5].
These microbial shifts create ecological windows for pathogen invasion [6,7], while commensal populations may exert protective effects through competitive exclusion [8,9,10]. For example, under salt stress, the rhizosphere microbiota of salt-tolerant grapevine rootstock 101-14 showed greater structural shifts (seven enriched phyla, including Planctomycetes) compared with sensitive 5BB (four phyla). Metagenomic profiling revealed 101-14 specific enrichment of sulfur metabolism (cysNC, sat genes) and chemotaxis pathways, whereas 5BB upregulated translation-related functions, underscoring the dual role of microbiota composition and function in stress adaptation [9]. Field application of yeast Metschnikowia fructicola increased strawberry bacterial diversity, altered community structure, and enriched potentially beneficial genera (Methylobacterium, Sphingomonas, Rhizobium, Bacillus) [11].
Notably, microbial consortia contributed to fruit quality parameters, including aroma biosynthesis and metabolite profiles [12,13,14]. During coffee wet fermentation, 64 bacterial and 59 fungal/yeast genera were involved, with dominant yeasts and lactic acid bacteria significantly correlating with aromatic compounds (e.g., linalool) and health-related metabolites [15]. Similarly, cultivation methods shaped tomato flavor profiles. Soil-grown tomatoes accumulated higher sugars and “green” volatiles linked to Bacillus, while hydroponic systems favored acidity and “sweet/floral” notes associated with distinct microbiota, illustrating substrate-dependent microbial regulation of fruit chemistry [16].
Plums (Prunus genus, Rosaceae family) originated across Eurasia and the Americas [17]. Fengtang plum (Prunus salicina var. Fengtang), a newly developed diploid cultivar from Zhenning County, Guizhou Province, China [18], has gained remarkable commercial success since 2017 due to its unique organoleptic characteristics—crisp texture, honey-like sweetness, and distinctive aromatic profile. This cultivar’s planting area in Guizhou reached 53,000 ha in 2023, reflecting its high market demand [19]. Despite being a climacteric fruit with vigorous postharvest metabolism prone to softening, Fengtang plum exhibits atypical resistance to brown rot fungi Monilinia spp. compared with other stone fruit [20,21]. The microbial communities of plum fruits exhibit dynamic shifts across developmental stages and cultivars. Studies on “President” and “Stanley” cultivars revealed early dominance by Microbacterium (13.86%) and Curtobacterium (19.88%), transitioning to Pseudomonas (15.06%) and Clavibacter (12.65%) at maturity, collectively accounting for 61.45% of isolates across four stages; minor genera included Enterobacter (5.42%) and Pantoea (4.22%) [22]. In Serbian cultivars (Požegača, Ranka, etc.), metagenomic analysis of leaves and fruits during early (May) and late (July) maturation identified Methylobacterium, Sphingomonas, and Hymenobacter as dominant genera, while culturable methods predominantly isolated pseudomonads (Pseudomonas syringae, P. graminis) [23]. Analysis of three mature plum fruits (YHL, BTL, YUL) from Inner Mongolia showed bacterial dominance by Proteobacteria (highest abundance), with key genera including Sphingomonas, Pantoea, and Pseudomonas; fungal communities were dominated by Ascomycota, featuring Mortierella, Fusarium, and Aspergillus, with distinct dominant genera across samples (e.g., Mortierella in BTS) [24]. These findings highlight that the plum microbiota composition is shaped by developmental phases, cultivar specificity, and geographical factors, with core genera (e.g., Pseudomonas, Methylobacterium) potentially influencing fruit health and quality.
The interaction between the newly cultivated Fengtang plum genotype and the distinctive river valley ecotype of Zhenning (mean growth temperature: 20–30 °C; diurnal ΔT ≥ 10 °C; precipitation < 30% RH) may drive the formation of a terroir-specific endophyte microbiome. In this study, we characterized the richness, diversity, composition, and functional trajectories of Fengtang plum’s bacterial and fungal community during setting, veraison, and maturity stages, and discovered insights into bacterial or fungal species associated with its exceptional flavor development and disease resistance. Our findings will establish a foundation for understanding the microbiome-mediated quality formation in this economically significant cultivar.

2. Materials and Methods

2.1. Sample Collection

Fengtang plum samples were collected from Liuma Town (25.967° N, 105.783° E), Zhenning Buyi and Miao Autonomous County, Anshun City, China, from April to June 2024. Samples were collected at three phenological stages: fruit set period (BSP1; 2 weeks after petal fall, 2 WAPF), veraison stage (BSP2; 8 WAPF), and commercial maturation stage (BSP3; 14 WAPF). For each phenological stage (BSP1-BSP3), triplicate biological replicates were established by randomly collecting 30 fruits per orchard from 3 independent orchards under identical horticultural management, yielding a total of 270 samples for 3 stages (3 stages × 3 orchards × 30 fruits). Three independent orchards where no fungicides had been applied in the year prior to harvest were selected. In each orchard, sampling was conducted at vertical and horizontal intervals of 20 trees. From each selected tree, 10 fruits were randomly picked, resulting in a total collection of 200 fruits per orchard. The collected fruits from each orchard were separately packed into bags for transportation. After collection, 10 fruits were randomly selected from each orchard, from which sequencing samples were excised for analysis. Each harvesting session was conducted between 9:00 and 10:00 AM on sunny days.

2.2. Sample Processing and DNA Extraction

Fengtang plum fruit was subjected to 75% ethanol(Sinopharm Chemical Reagent Co. Ltd., Shanghai, China) (v/v) for 2 min, 3% sodium hypochlorite(Sinopharm Chemical Reagent Co. Ltd., Shanghai, China) for 5 min, and sterile distilled water 3× for surface sterilization. Fruit flesh was aseptically dissected into uniform slices (5 mm × 5 mm × 2 mm) and transferred into 50 mL sterile centrifuge tubes containing 20 mL of phosphate-buffered saline (PBS, pH 7.4) (Sinopharm Chemical Reagent Co. Ltd., Shanghai, China). The samples were homogenized by gentle agitation at 150 rpm for 15 min using an orbital shaker (Thermo Scientific, Waltham, MA, USA) at 25 °C. Following tissue removal under sterile conditions, the resulting microbial suspension was centrifuged at 8000× g for 10 min at 4 °C to pellet microbial cells. Total genomic DNA was extracted from the microbial pellet using the DNeasy PowerSoil Pro Kit (Qiagen, Hilden, Germany) following the manufacturer’s protocol.

2.3. Library Preparation and 16s/ITS Sequencing

The hypervariable regions of bacterial 16S rRNA genes (V3–V4) and fungal ITS regions (ITS1-ITS2) were amplified using region-specific primers (16S: 341F/806R [25]; ITS: ITS1F/ITS2 [26]) with Illumina adapters [27]. The PCR amplification was performed with the following protocol: initial denaturation at 98 °C for 1 min, followed by 30 cycles of denaturation at 98 °C for 10 s, primer annealing at 50 °C for 30 s, and extension at 72 °C for 30 s, culminating in a final extension step at 72 °C for 5 min before indefinite holding at 4 °C. PCR products were quantified using a Qubit 4.0 Fluorometer (Thermo Scientific, Waltham, MA, USA) and quality-checked via capillary electrophoresis on a Qsep400 Bio-Fragment Analyzer (BiOptic, New Taipei City, Taiwan). Equimolar amounts of purified amplicons were pooled and sequenced on Illumina NovaSeq PE250 Sequencing Platform (Illumina, San Diego, CA, USA) [28].

2.4. Data Analysis

Raw reads were demultiplexed by truncating barcode and primer sequences. FLASH v1.2.11 (http://ccb.jhu.edu/software/FLASH/, accessed on 24 April 2025) was used to merge paired-end reads into raw tags [29]. Quality filtering (length trimming, chimera removal) was performed using QIIME v.2.0 (http://qiime.org/scripts/split_libraries_fastq.html, accessed on 24 April 2025) [30], yielding high-quality effective tags (Table A1). Effective tags were clustered into operational taxonomic units (OTUs) at 97% identity using USEARCH 7.0.1 [31]. Representative OTU sequences were annotated against the Ribosomal Database Project (RDP) classifier (bacteria) [32] and UNITE database v8.2 database (fungi) [33], respectively. Taxonomic profiles were analyzed at phylum to species levels. Bacterial species richness approached saturation at 3000 reads per sample, while fungal species richness plateaued at 5000 reads per sample. Based on the effective sequencing depth achieved for all samples, the data robustly captured the microbial community diversity, indicating that the sequencing effort was sufficient to characterize both bacterial and fungal taxa within the studied ecosystems (Figure A1). Alpha diversity analysis was conducted using the Wilcoxon rank-sum test (a non-parametric test) to compare differences in ACE index, Shannon index, observed ASVs, and PD whole tree metrics among groups, with the significance threshold set at p < 0.05 (Bonferroni correction was applied when multiple comparisons were performed). Beta diversity analysis was performed based on Bray–Curtis distance matrices, with the significance threshold set at p < 0.05. The differences in microbial community structures between samples were visualized using principal coordinate analysis (PCoA), and the statistical significance differences (p < 0.05) was assessed by PERMANOVA (Adonis test). Bacterial and fungal ecological functions were predicted via the FAPROTAX [34] and FunGuild [35] database.

3. Results

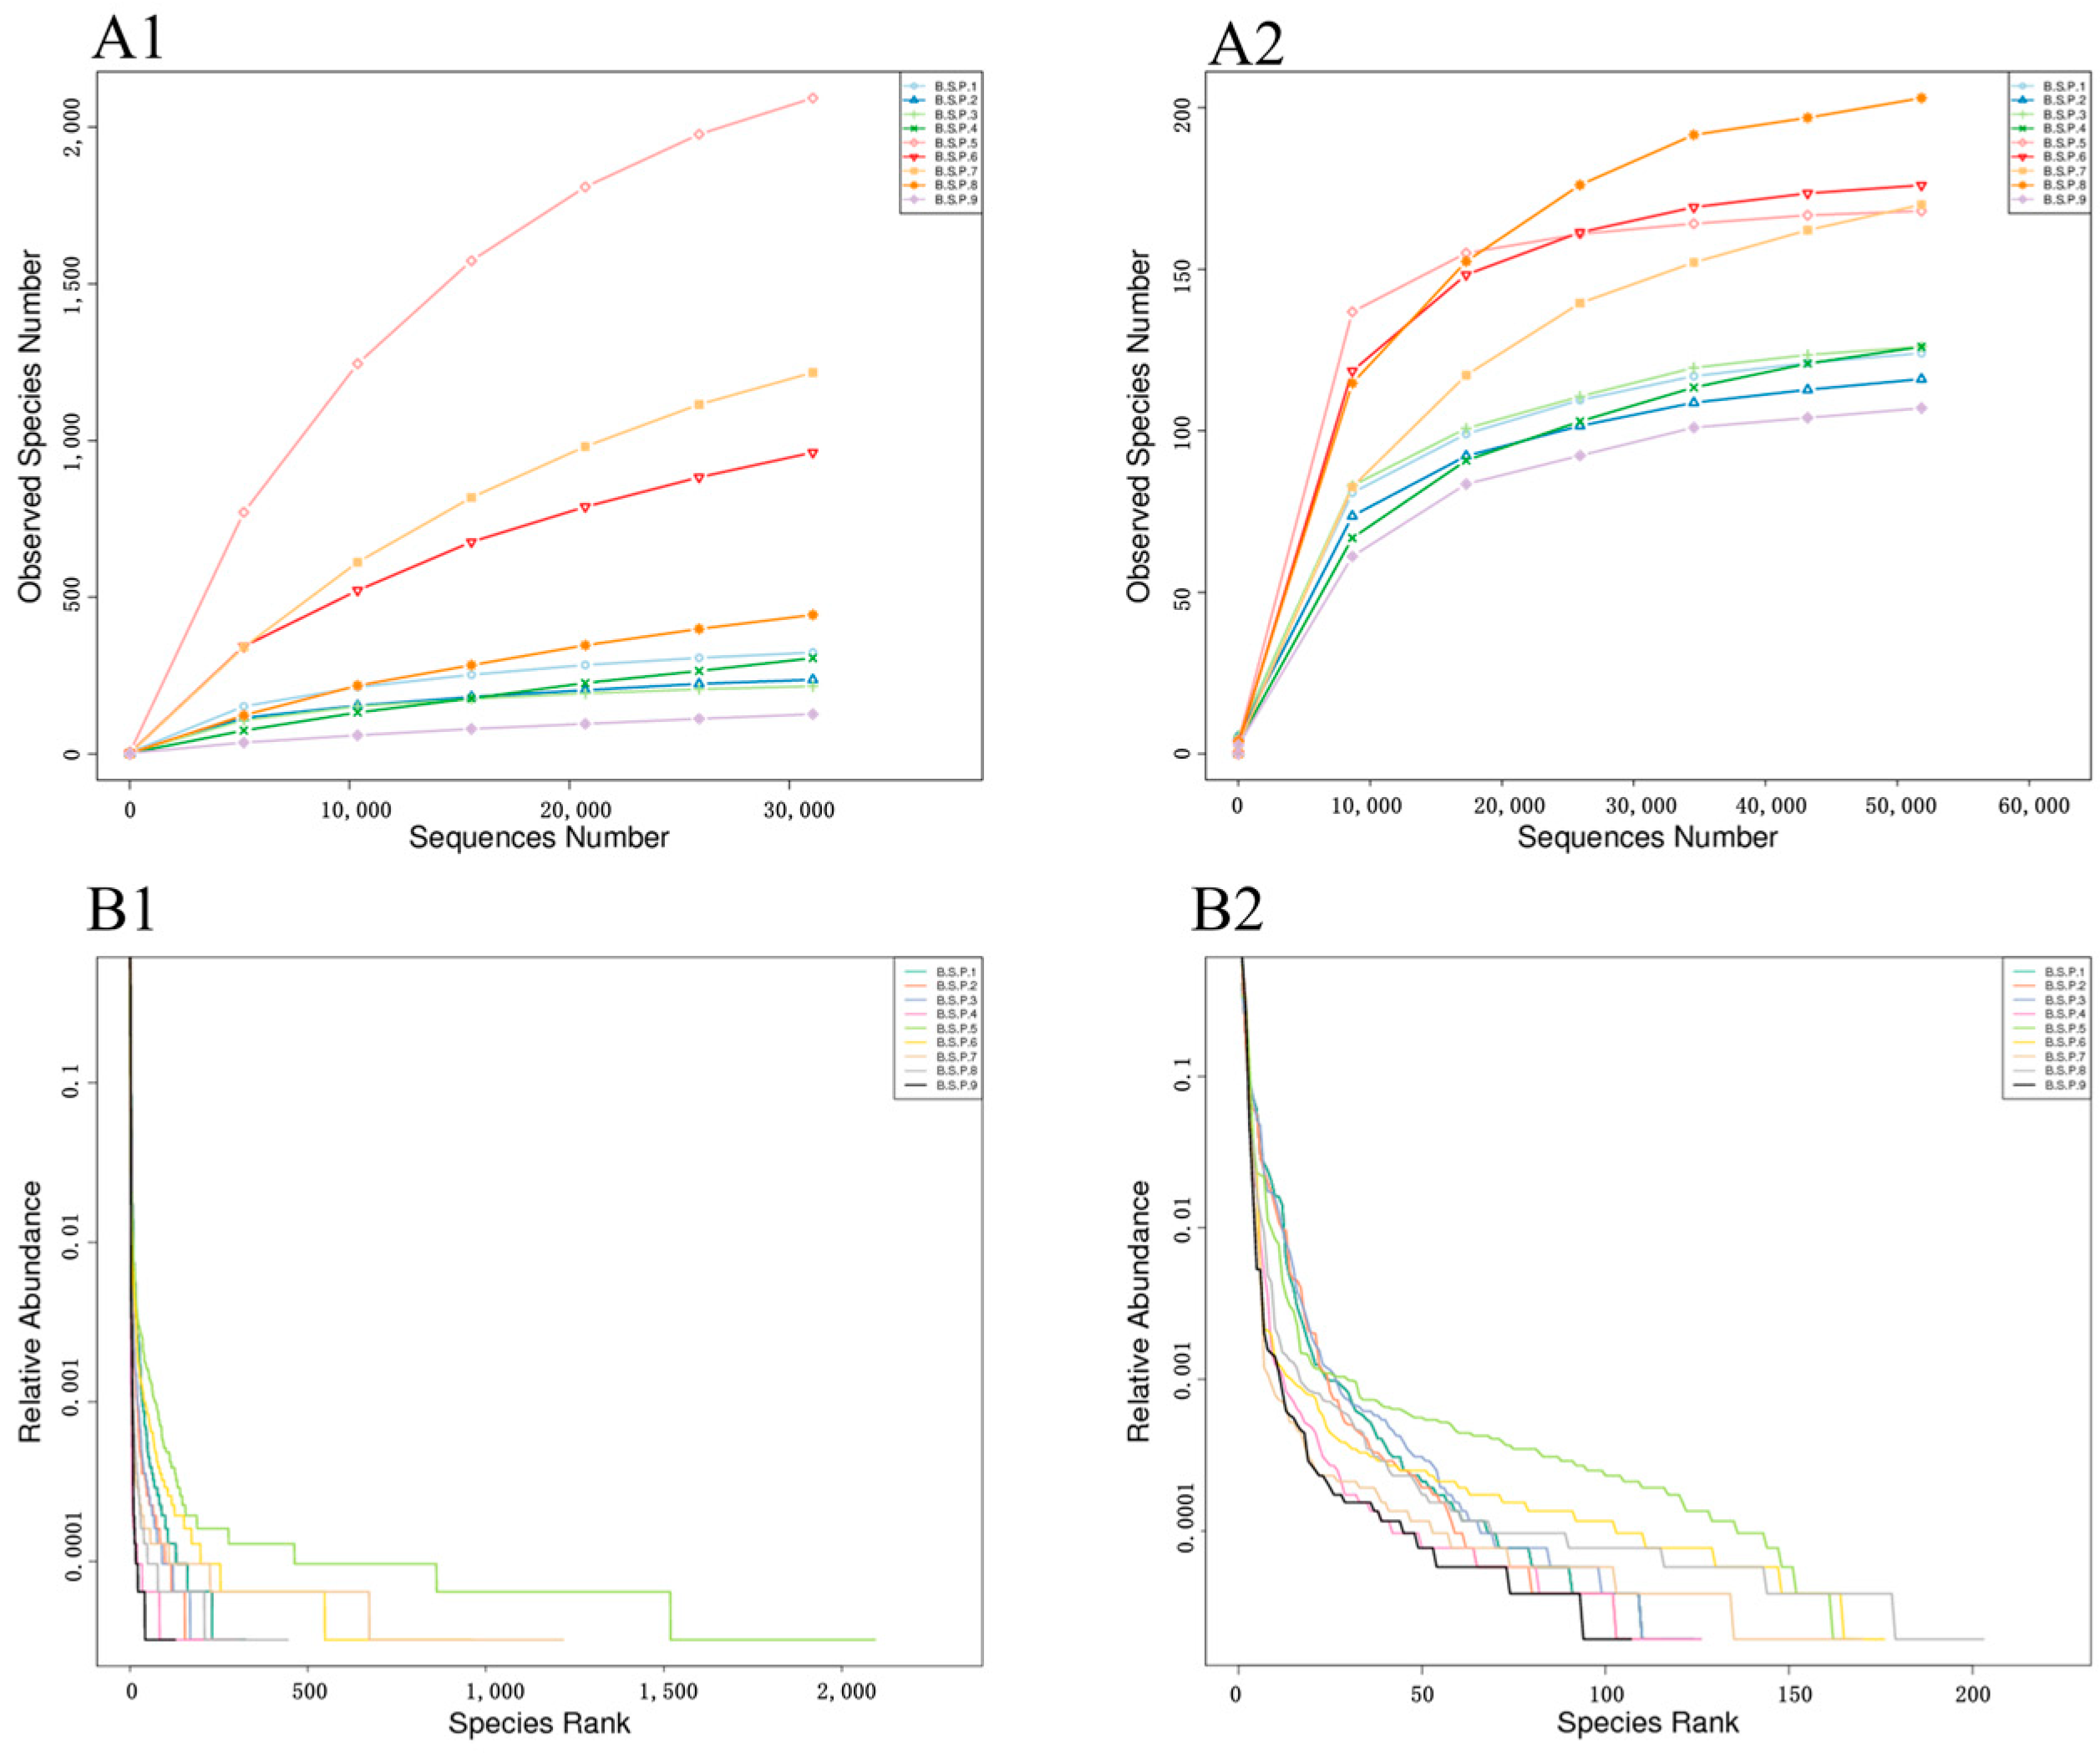
3.1. Diversity of Endophytic Microbial Communities in Fengtang Plum at Different Developmental Stages

Compared with the fruit-setting stage (BSP1), the species richness (Figure 1(A1,B1)), estimated total species abundance (Figure 1(A3,B3)), and phylogenetic diversity (Figure 1(A4,B4)) of microbial communities (bacteria and fungi) in mid- and late-stage fruits (BSP2/BSP3) increased with fruit development (p < 0.05). The evenness of endophytic bacterial communities (Figure 1(A2)) also increased during fruit development. However, unexpectedly, the evenness of endophytic fungal communities decreased (p < 0.05) (Figure 1(B2)). Additionally, no significant differences in microbial diversity were observed between BSP2 and BSP3 (p > 0.05).

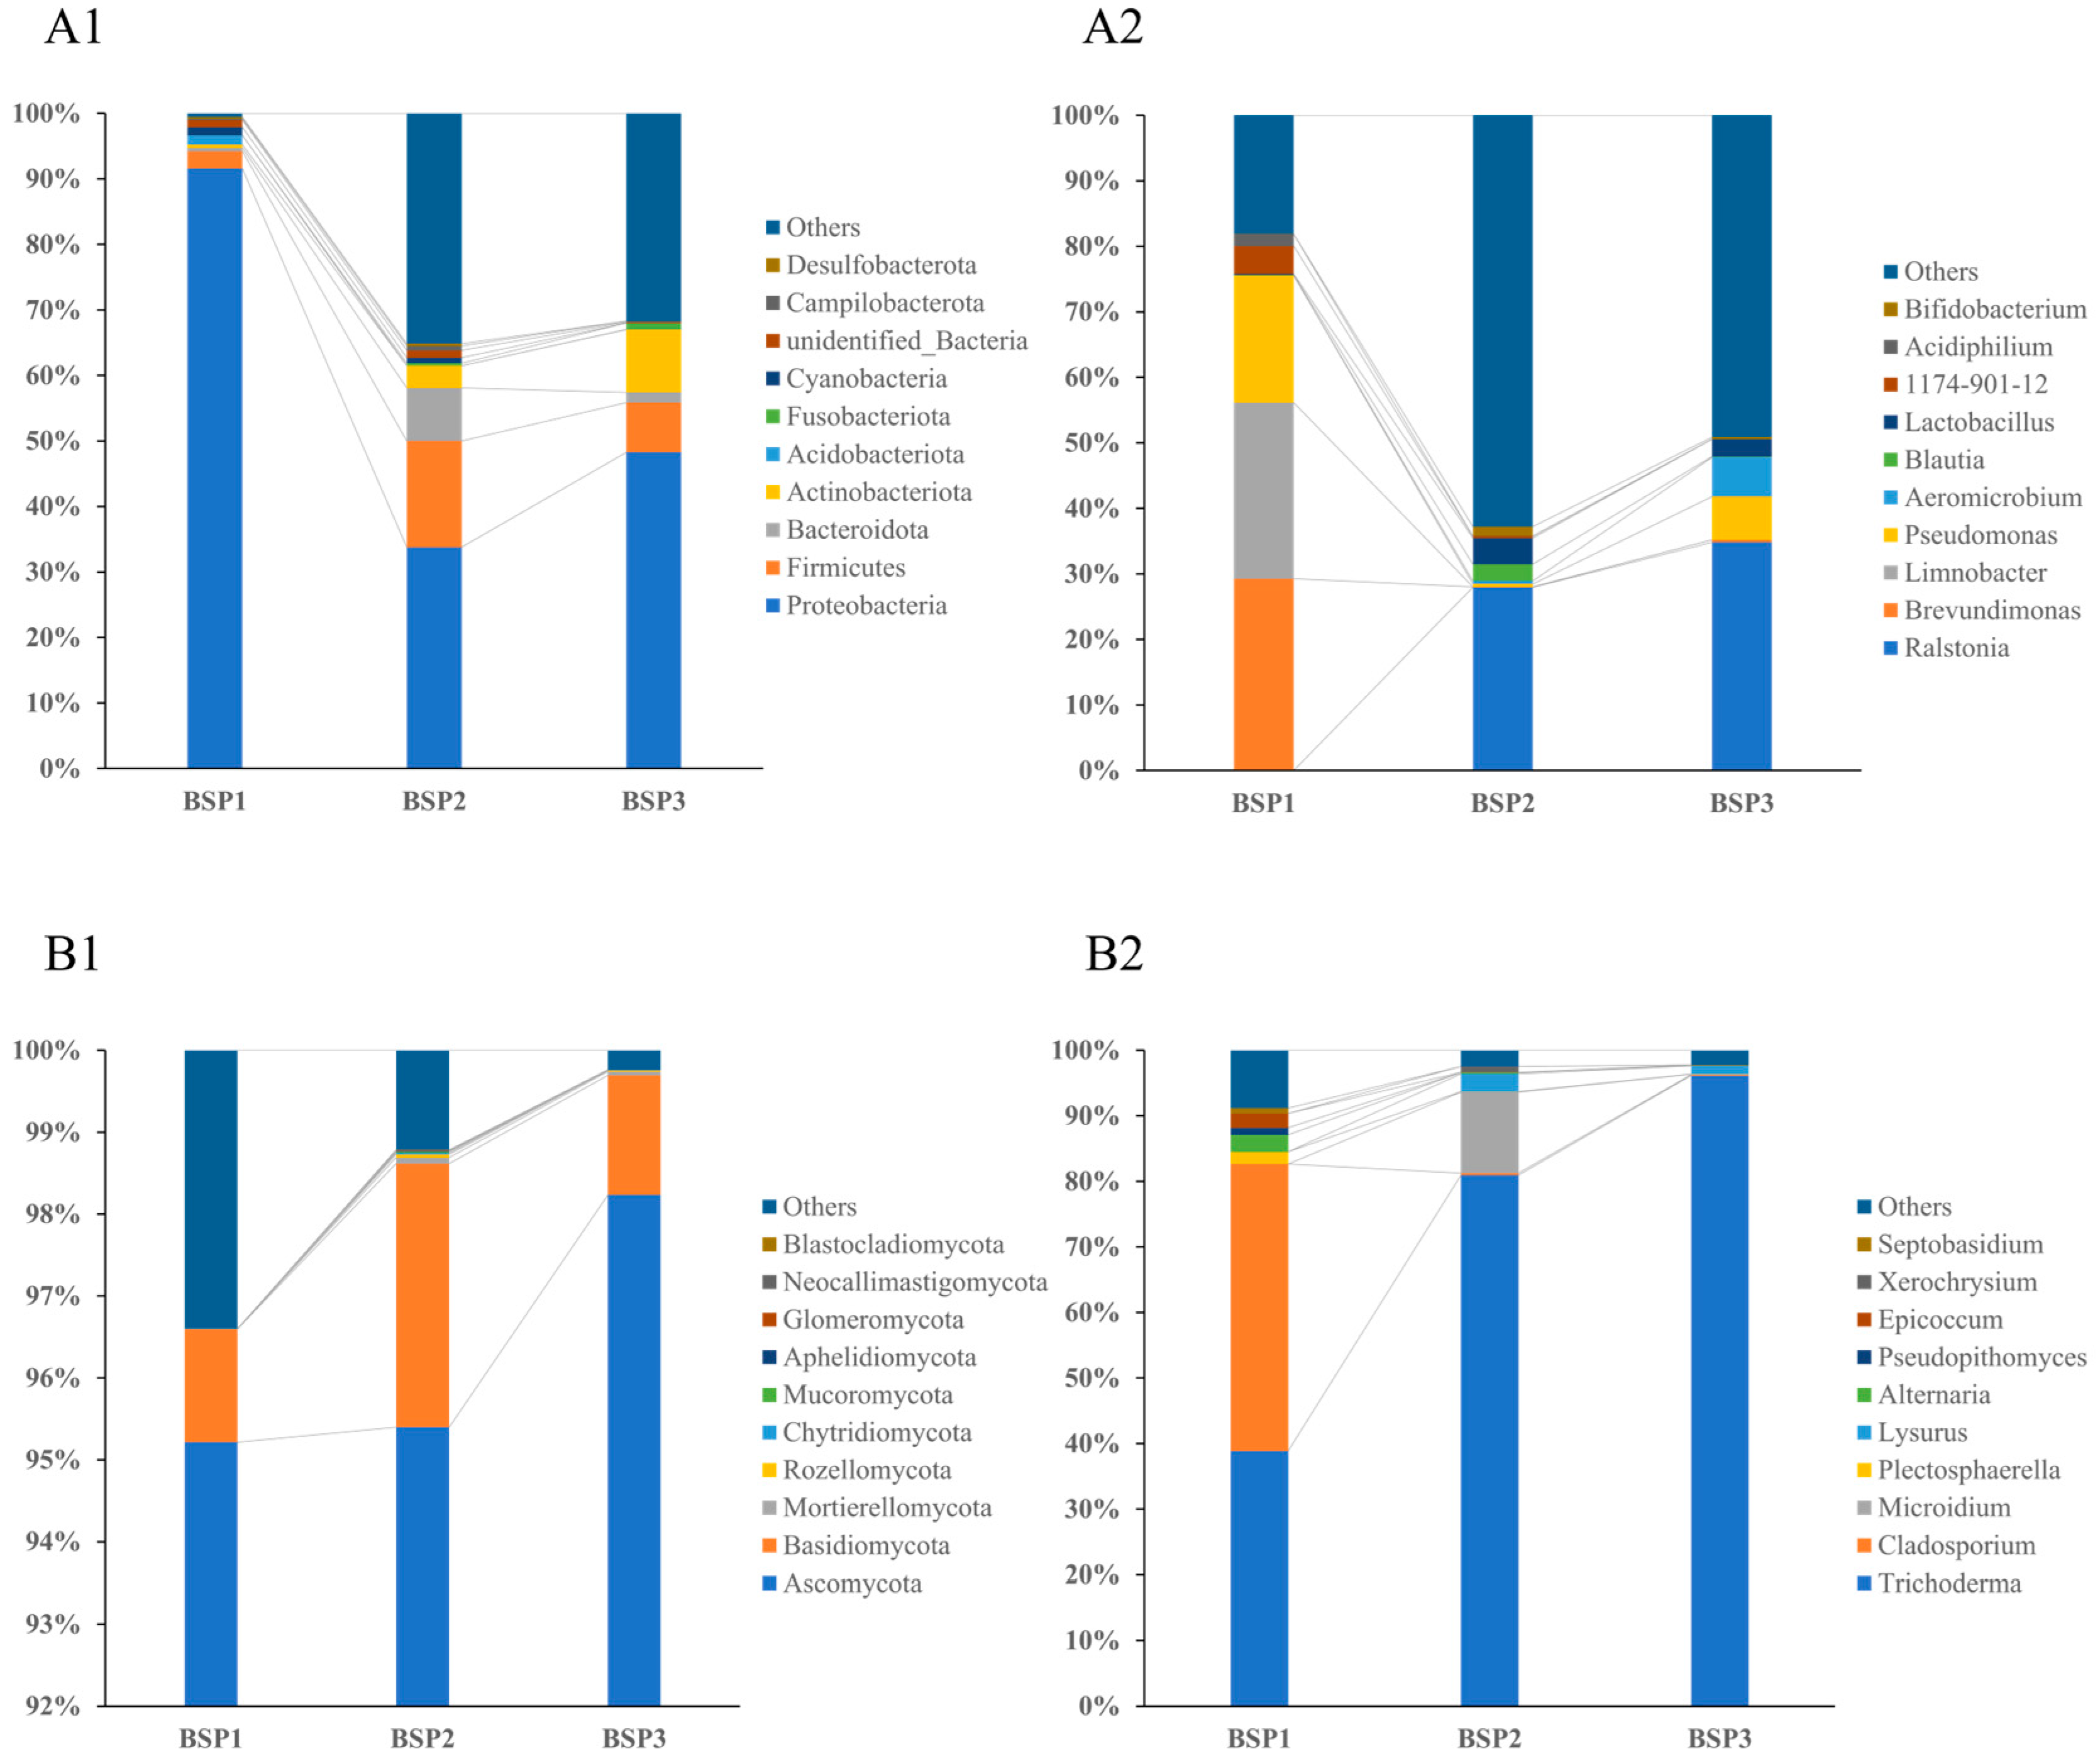
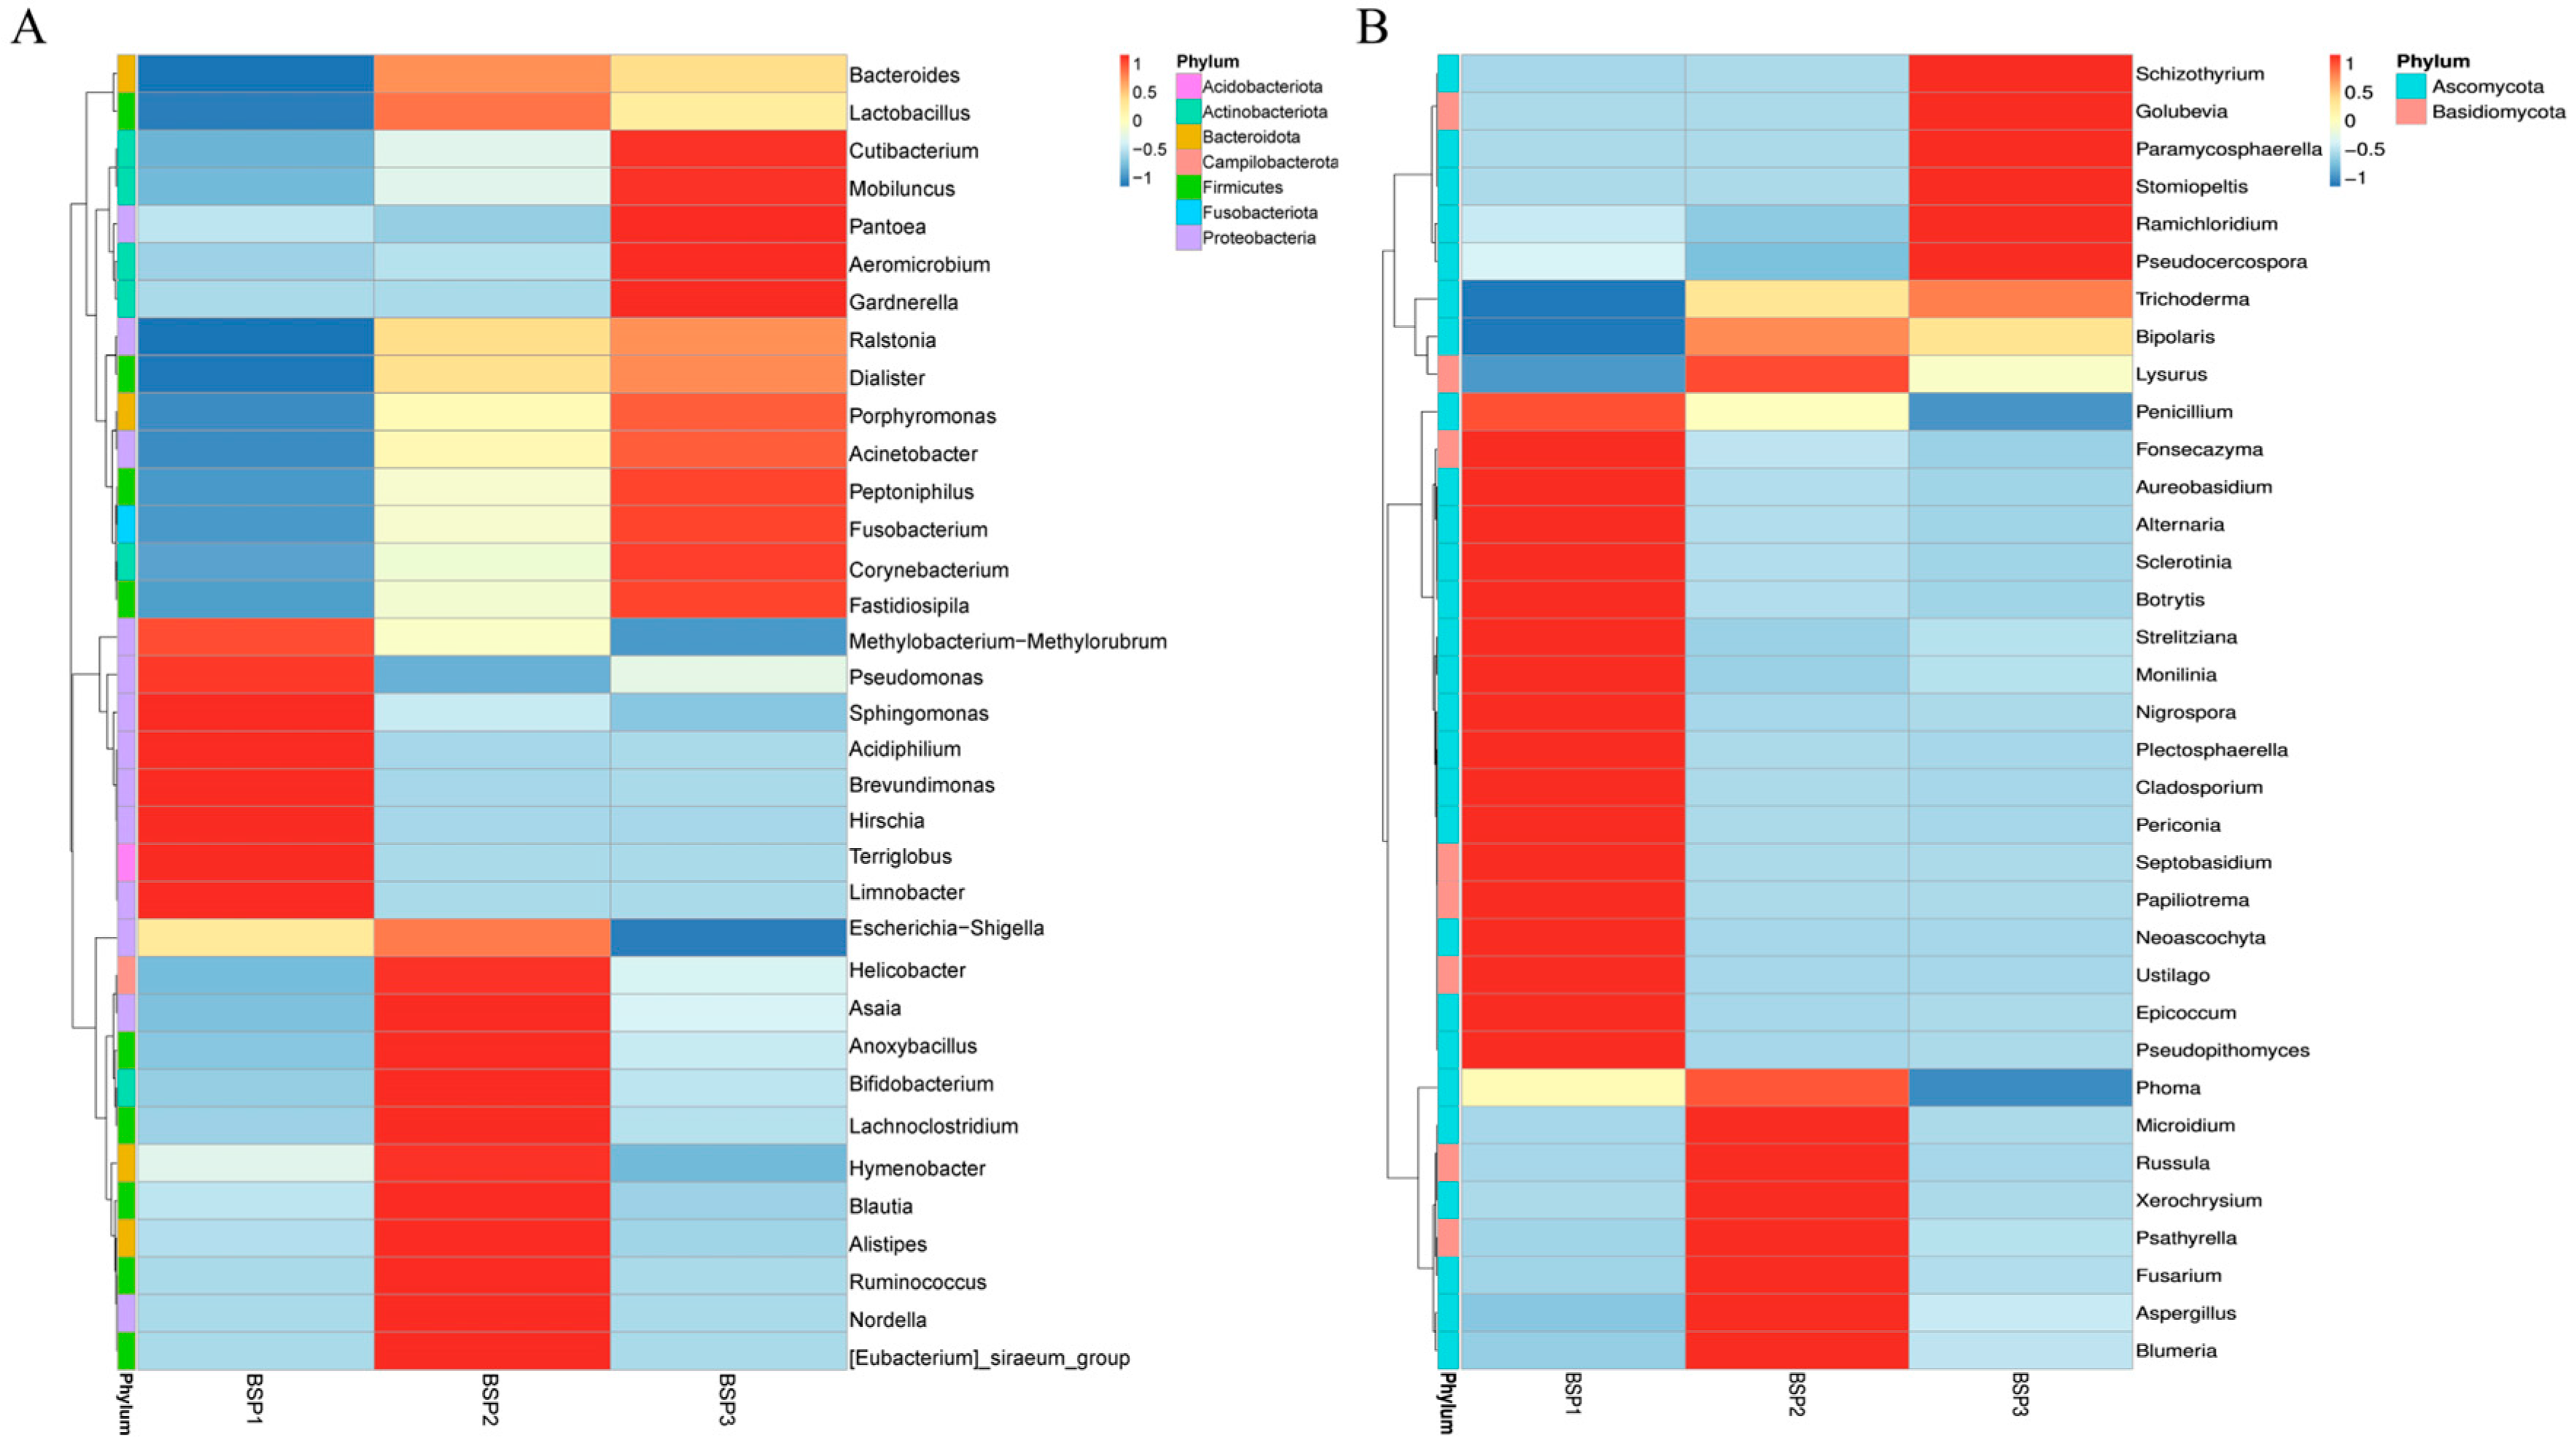
3.2. Composition of Endophytic Microbial Communities in Fengtang Plum at Different Developmental Stages

A total of 4790 operational taxonomic units (OTUs) were identified through 16S rRNA gene sequencing. Among these, 952 OTUs (19.87%) were successfully annotated to the reference database, while the remaining 80.13% could not be classified, highlighting the presence of a substantial proportion of uncharacterized bacterial communities within Fengtang plum fruits. The bacterial community was predominantly composed of four phyla: Proteobacteria, Firmicutes, Actinobacteriota, and Bacteroidota (Figure 2(A1)). At the BSP1 stage, the most abundant genera within Proteobacteria included Brevundimonas (30.74%), Limnobacter (28.07%), and Pseudomonas (20.09%). During the BSP2 stage, the community shifted, with Ralstonia (27.05%), Lactobacillus (3.98%), and Blautia (2.67%) emerging as dominant taxa. By the BSP3 stage, Ralstonia (34.73%), Pseudomonas (6.42%), and Blautia (6.10%) were the most prevalent. Notably, the cumulative abundance of low-abundance bacterial genera increased progressively, accounting for 18.06%, 61.84%, and 49.20% at the BSP1, BSP2, and BSP3 stages, respectively, suggesting a diversification of the bacterial community as the fruit developed (Figure 2(A2)).
Analysis of ITS sequencing data revealed 637 OTUs, of which 612 (96.08%) were successfully annotated. The fungal community was overwhelmingly dominated by the phylum Ascomycota across all developmental stages (Figure 2(B1)), with relative abundances of 95.21%, 95.41%, and 98.23% at BSP1, BSP2, and BSP3, respectively. At the BSP1 stage, the dominant fungal genera included Cladosporium (43.41%), Trichoderma (38.50%), and Alternaria (2.56%). By the BSP2 stage, Trichoderma (80.21%), Microidium (3.98%), and Lysurus (2.68%) were the most prevalent. At the BSP3 stage, Trichoderma (95.91%) and Lysurus (1.24%) remained dominant, with all taxa belonging to Ascomycota (Figure 2(B2)).
Heatmap analysis of the top 35 abundant endophytic microorganisms revealed three distinct clusters corresponding to the three developmental stages (BSP1-BSP3) of Fengtang plum fruits, confirming developmental stage-dependent assembly of the endophytic microbiota (Figure 3). In the bacterial community, BSP1-enriched was dominated by early colonizing genera such as Methylobacterium−Methylorubrum, Pseudomonas, Sphingomonas, Acidiphilium, and Brevundimonas, which collectively accounted for over 75% of the relative abundance, suggesting their potential involvement in establishing initial fruit defense mechanisms. During BSP2, the clusters exhibited a significant shift toward facultative anaerobes, including the Escherichia−Shigella complex, Bifidobacterium, and Lachnoclostridium, with their proliferation potentially linked to microenvironmental adaptation driven by sugar accumulation and reduced oxygen availability. By BSP3, Cluster III showed progressive enrichment of saprophytic and potentially pathogenic taxa such as Cutibacterium, Ralstonia, and Acinetobacter, coinciding with tissue maceration and pericarp degradation during late maturation.
Fungal communities displayed contrasting temporal dynamics, with BSP1-enriched dominated by sporulation-active genera Penicillium and Cladosporium (>82% total abundance), whose volatile metabolites may contribute to early aroma compound synthesis. During BSP2, despite the persistent dominance of Trichoderma (excluded from clustering), wound-associated parasites like Fusarium increased compared with BSP1, likely reflecting niche shifts induced by cuticular microdamage. In BSP3, specialized endophytes such as Schizothyrium and Pseudocercospora exhibited marked proliferation, with their lignocellulolytic enzyme systems potentially facilitating fruit softening through cell wall modification. These stage-specific microbial successions highlight the tight interplay between endophytic community assembly and host physiological transitions during fruit development.

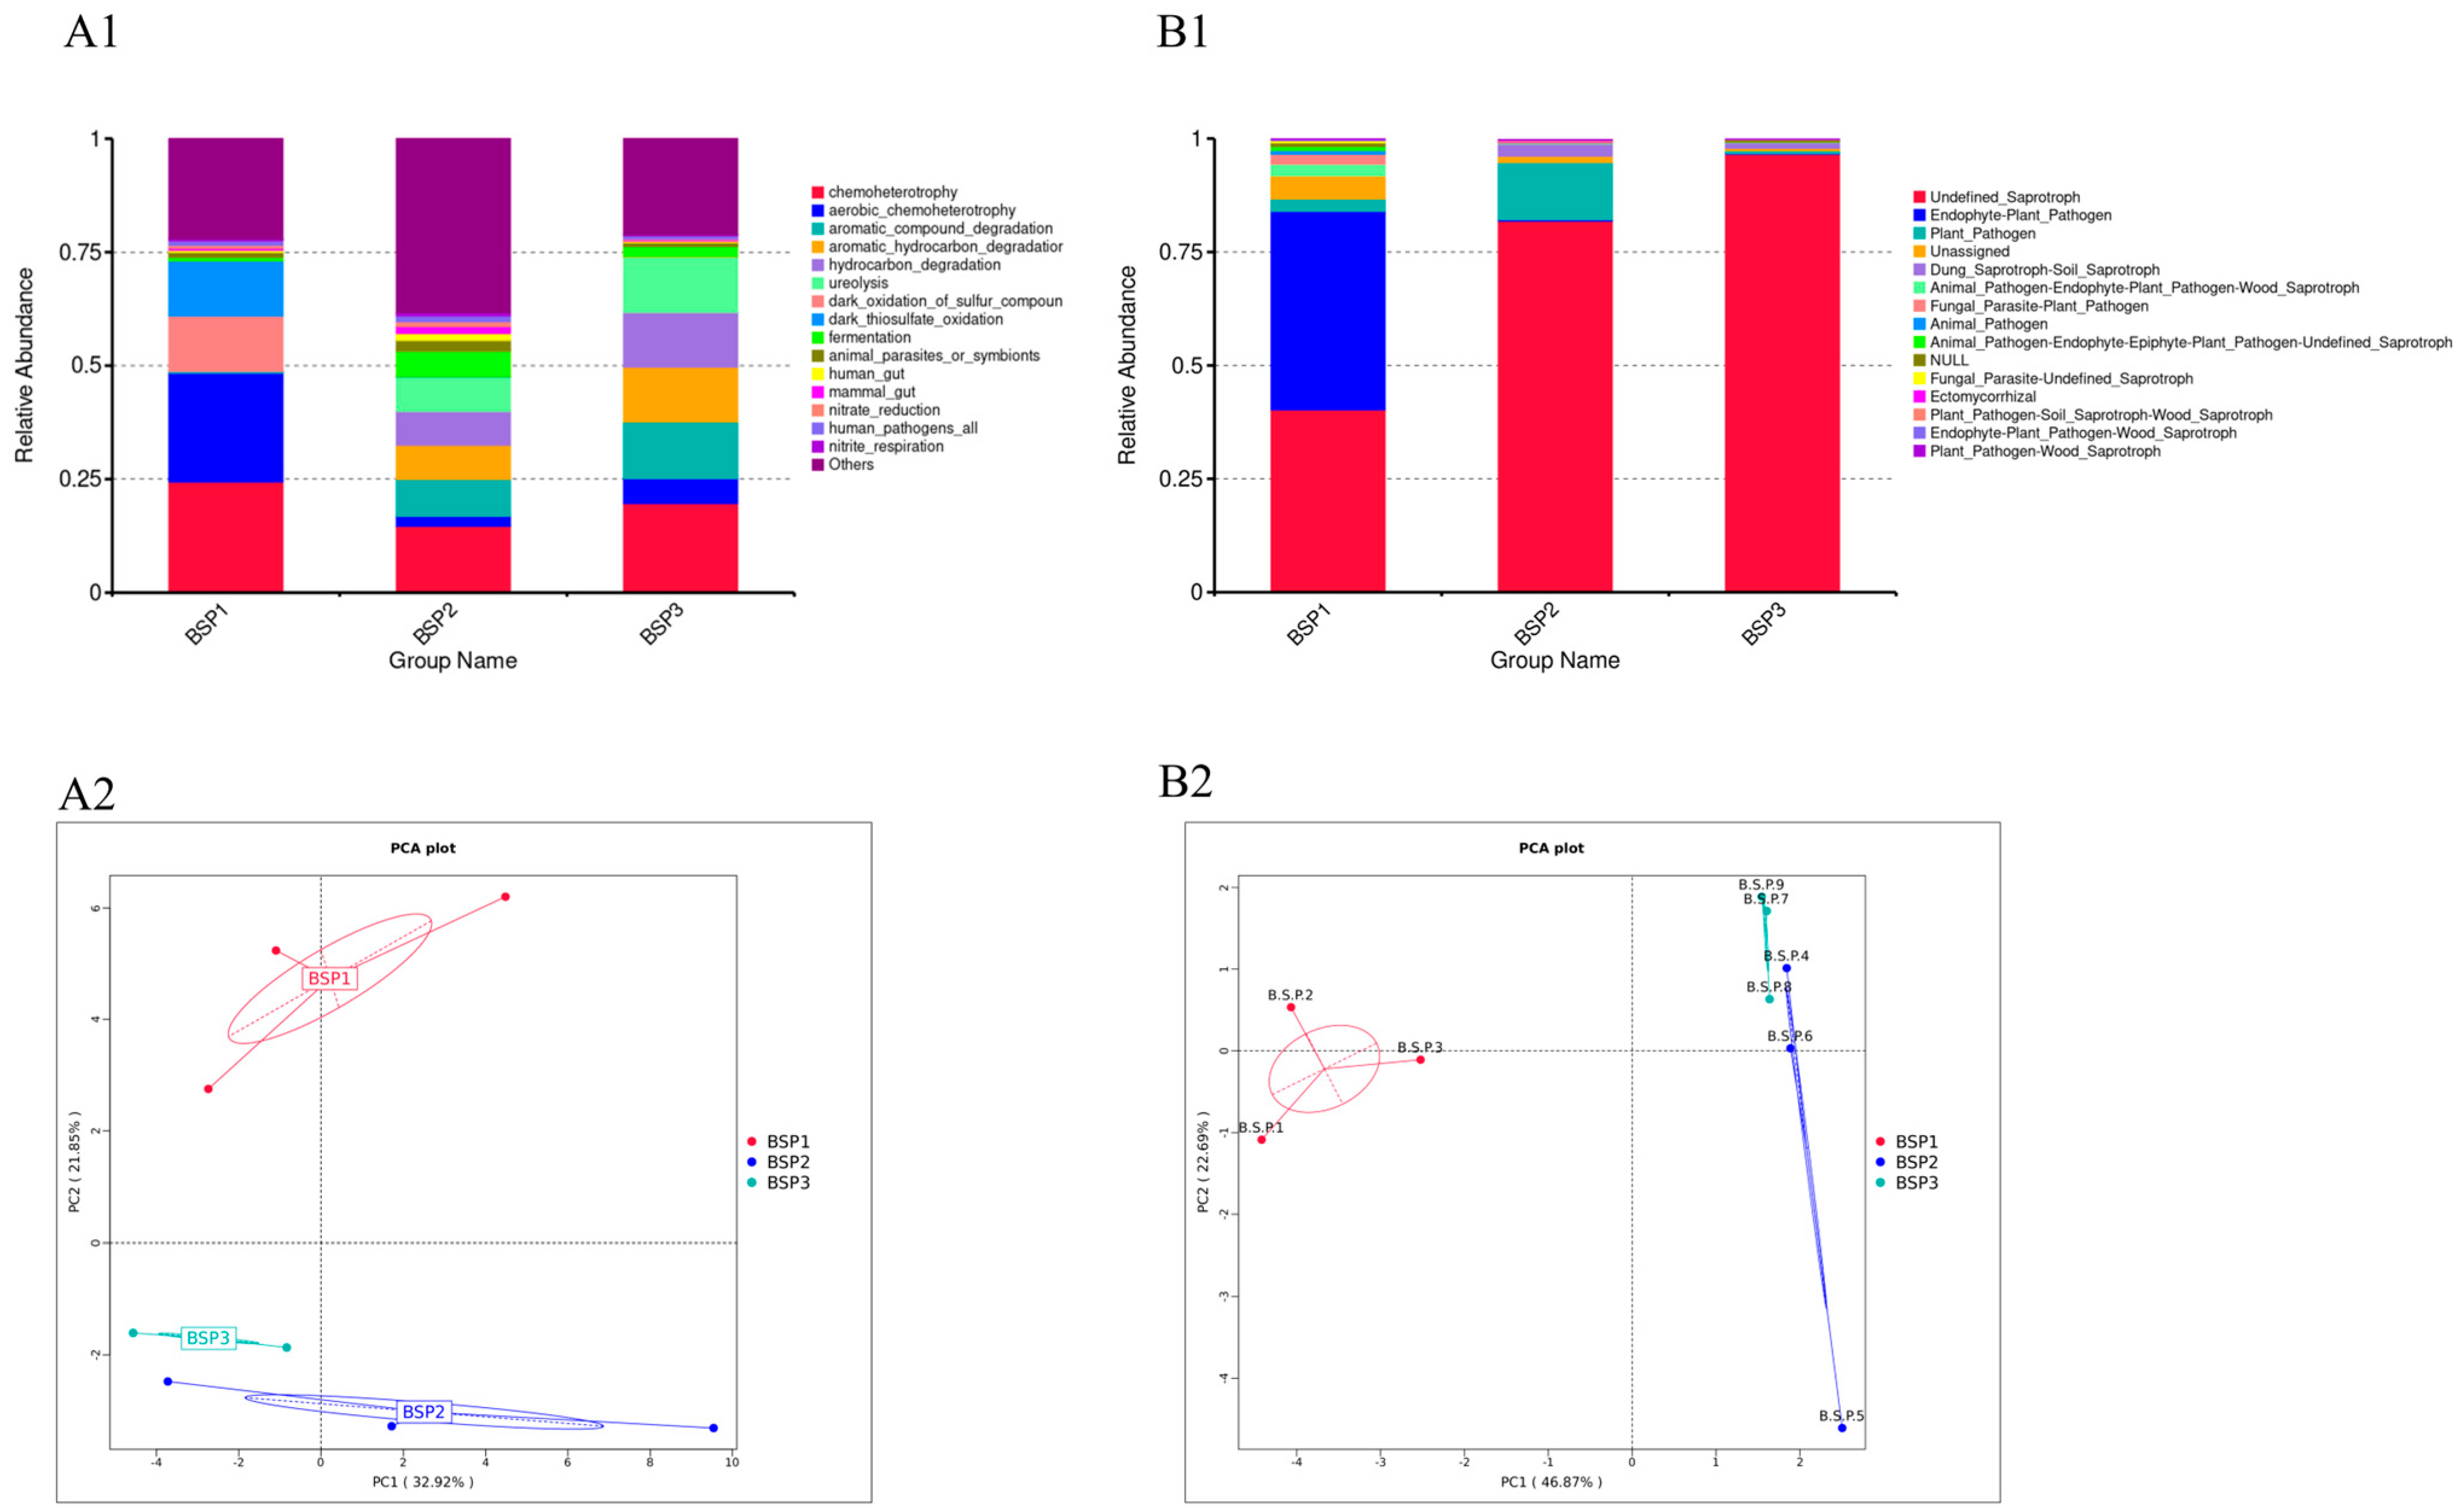
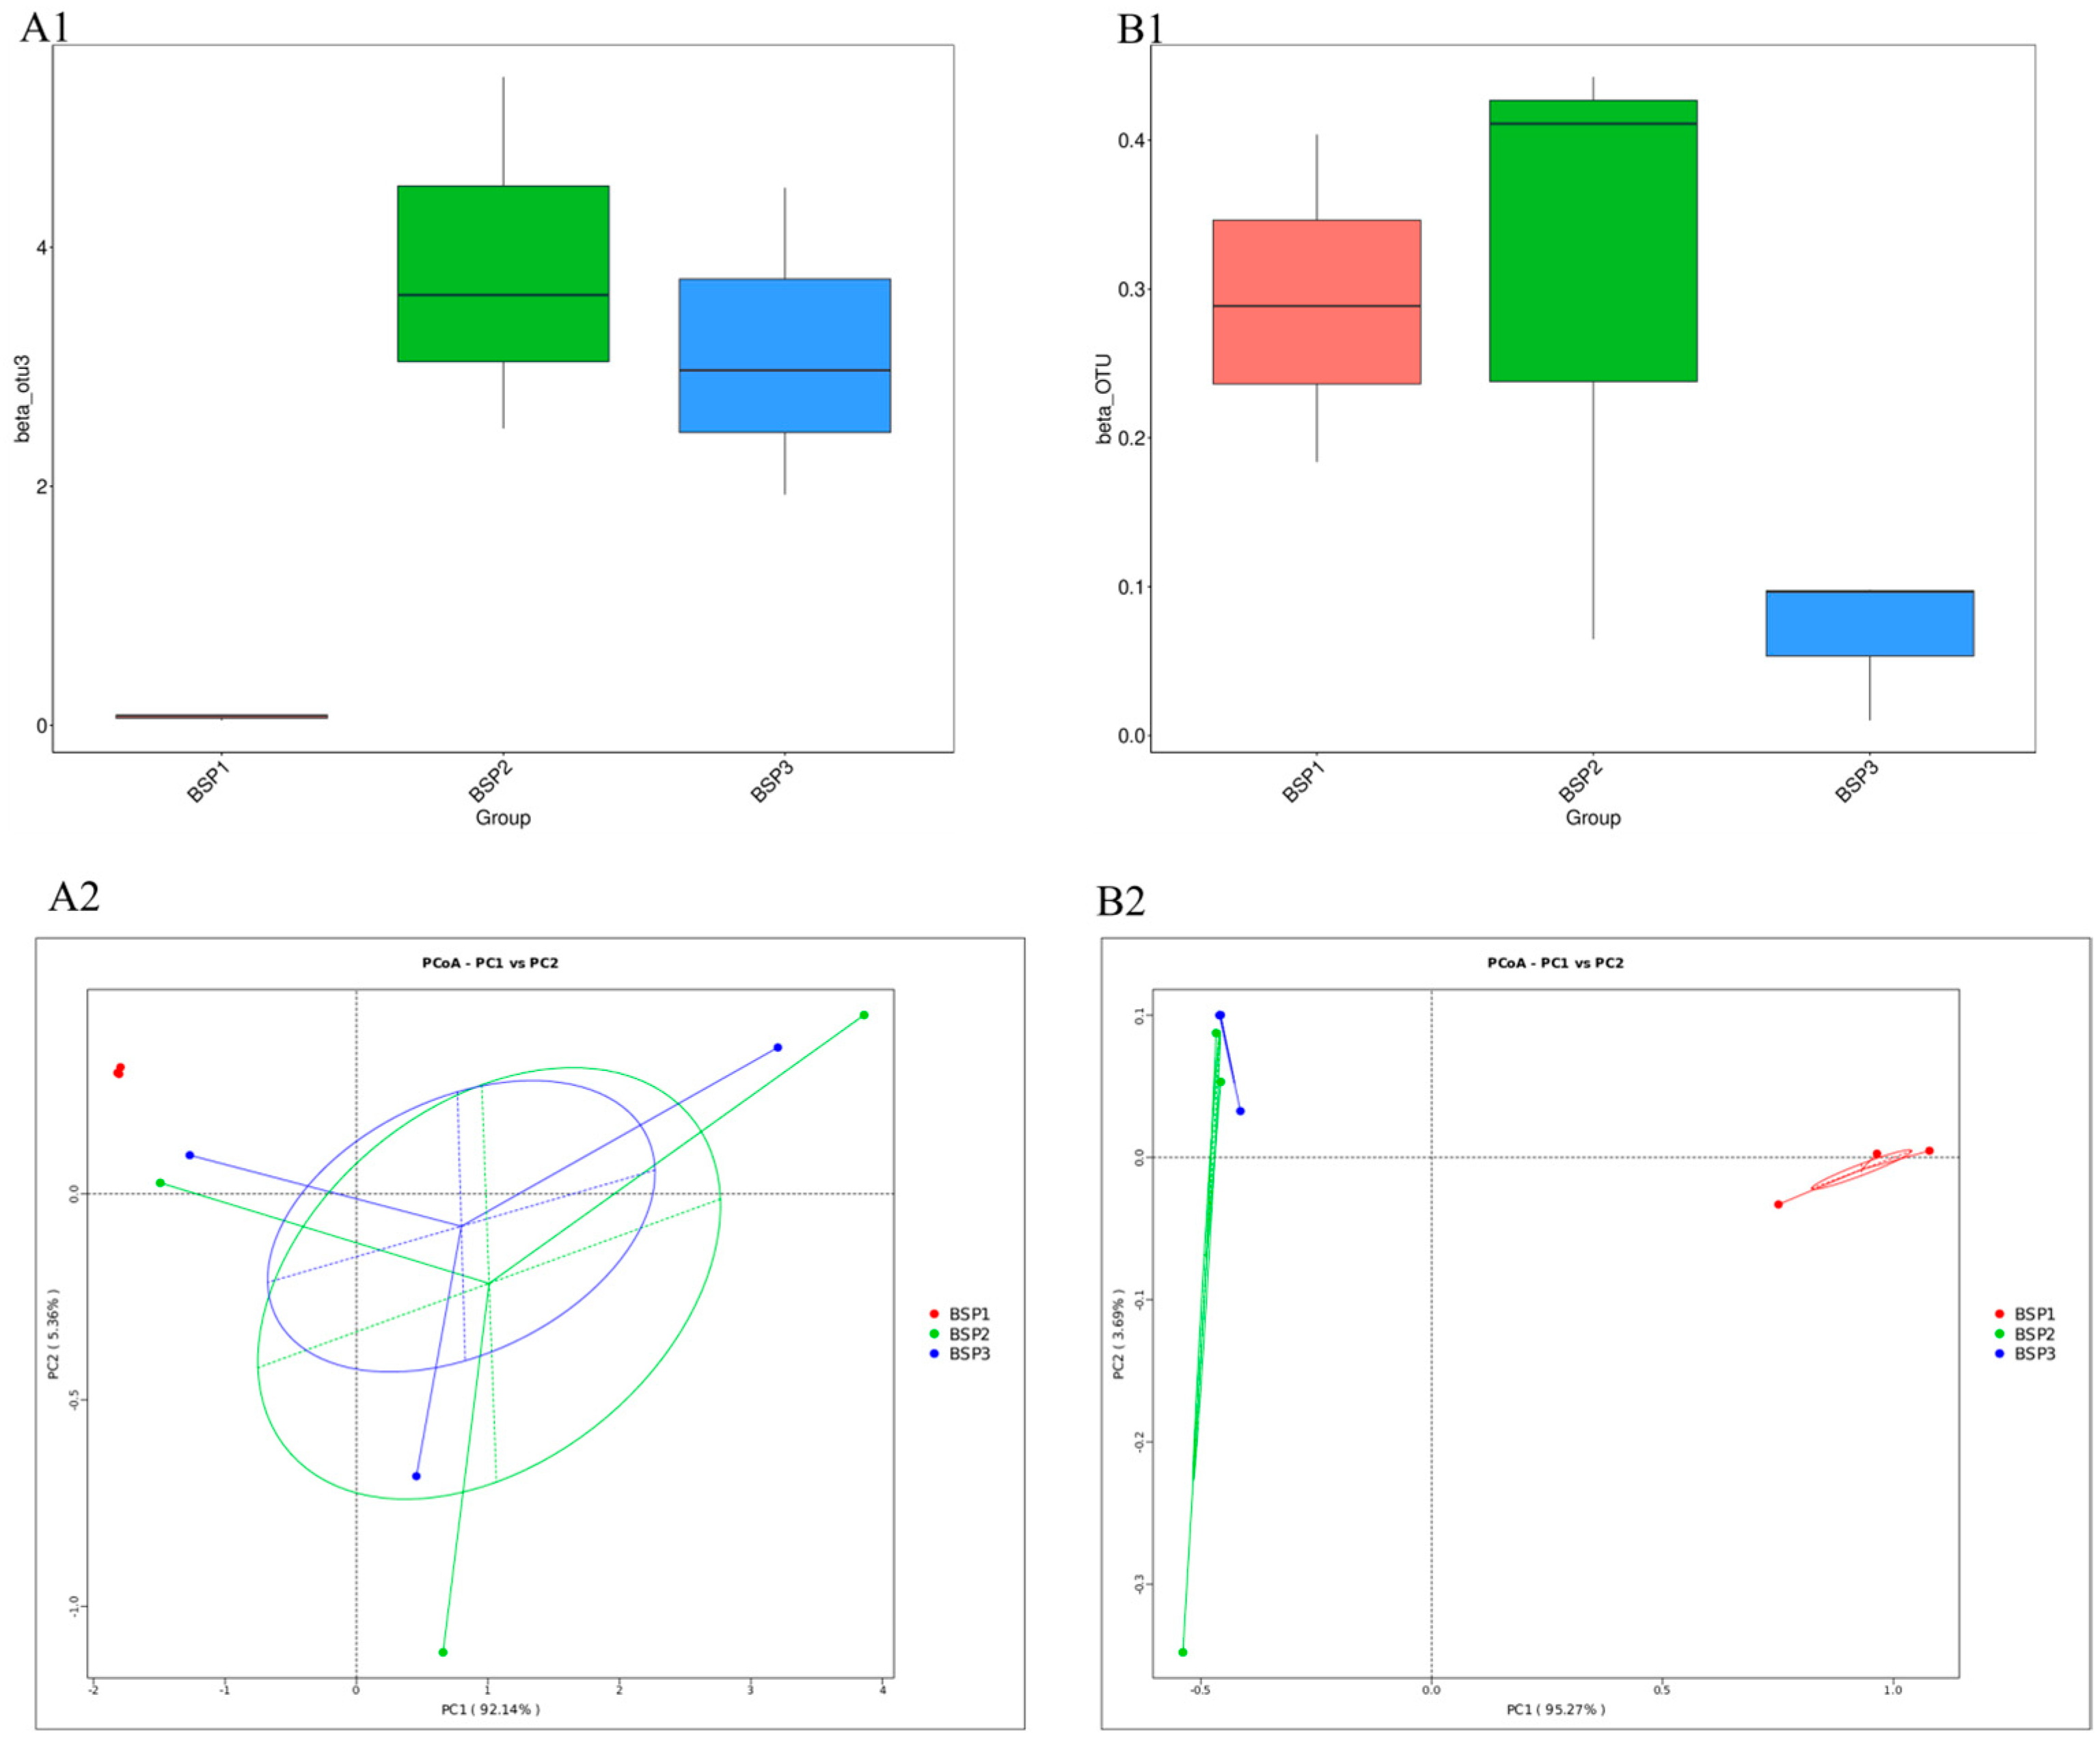
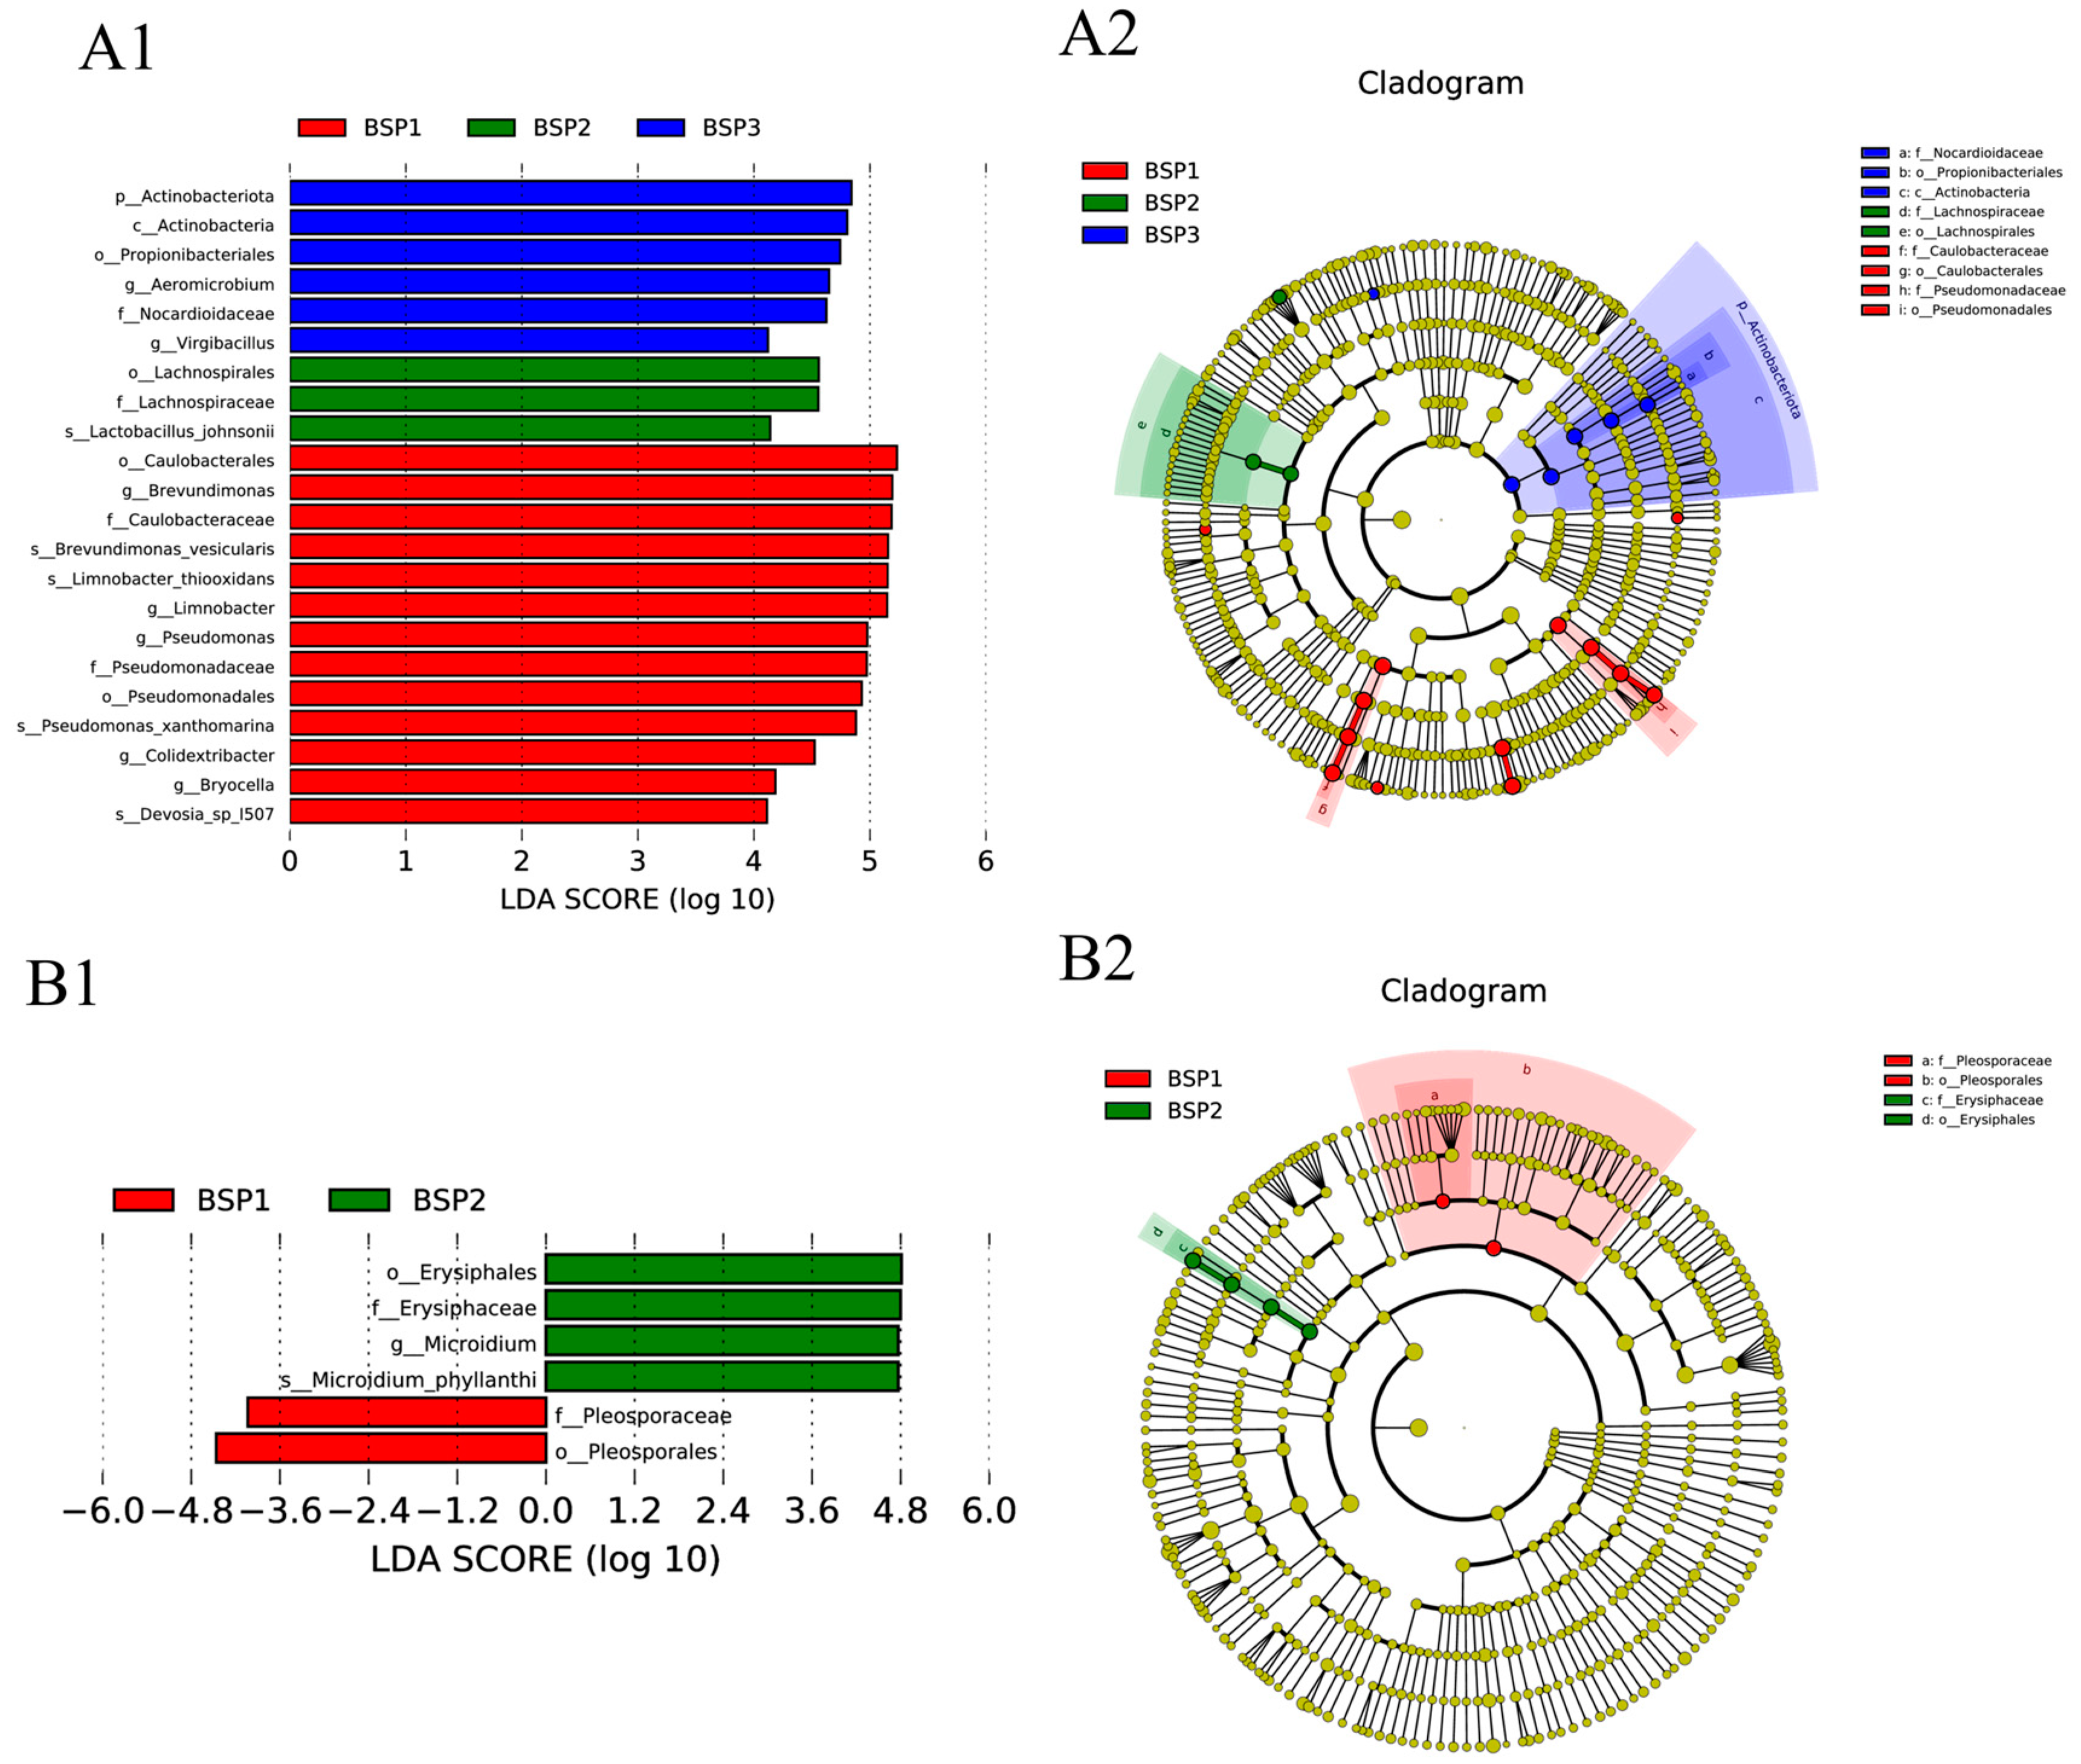
3.3. Structural Differences in Endophytic Microbial Communities in Fengtang Plum at Different Developmental Stages

Beta diversity based on Bray–Curtis indices revealed minimal intra-group variation in bacterial communities at the BSP1 stage. As fruit developed, intra-group variation increased, and significant inter-group differences were observed between BSP1 and BSP2/BSP3 (p < 0.05), while no significant differences were found between BSP2 and BSP3 (p > 0.05) (Figure 4(A1)). PCoA analysis aligned with beta diversity indices, showing that BSP1 samples clustered separately, while BSP2 and BSP3 samples overlapped, indicating minimal variation in microbial community composition during mid- and late-stage fruit development (Figure 4(A2)). In contrast, fungal communities showed no significant inter-group differences across developmental stages (p > 0.05), but intra-group variation initially increased and then decreased, with the smallest variation observed in BSP3 (Figure 4(B1,B2)).
SIMPER analysis was used to identify the contribution of dominant species to community differences. It revealed that, in bacterial communities (Table 1), Ralstonia (enriched in BSP2/BSP3), Brevundimonas (enriched in BSP1), and Limnobacter (enriched in BSP1) contributed 54.79%, 56.02%, and 66.27% to the average differences between BSP1 vs. BSP2, BSP1 vs. BSP3, and BSP2 vs. BSP3, respectively. Additionally, changes in the abundance of Pseudomonas, a dominant species in BSP1, contributed >15% to the differences between BSP1 and other stages. This suggests that the presence or absence of specific species and changes in the relative abundance of dominant species are the primary drivers of structural differences in bacterial communities.
In fungal communities, structural differences were mainly driven by changes in the abundance of dominant species (Table 2), followed by changes in low-abundance species and the presence or absence of specific taxa. The top two dominant genera, Trichoderma and Cladosporium, contributed 39.33%, 38.20%, and 60.89% to the average differences between BSP1 vs. BSP2, BSP1 vs. BSP3, and BSP2 vs. BSP3, respectively. Unique taxa such as Microidium (BSP2) and Lysurus (BSP2/BSP3), along with low-abundance species like Plectosphaerella, also contributed >10% to community differences.
Linear discriminant analysis (LDA) with a threshold of LDA > 4 (when the LDA value exceeds 4, statistically significant and biologically consistent differential features could be identified, which probably effectively distinguish distinct biological conditions) [36], identified key bacterial taxa contributing to taxonomic differences across developmental stages. During the BSP1 stage, Brevundimonas, Limnobacter, Pseudomonas, Colidextribacter, Bryocella, and Devosia I507 emerged as significant biomarkers, highlighting their dominant role in early fruit development. In contrast, the BSP2 stage was characterized by the prominence of Lactobacillus, while the BSP3 stage featured Aeromicrobium and Virgibacillus as distinctive taxa, reflecting the dynamic shifts in bacterial community composition throughout fruit maturation (Figure 5(A1)).
Fungal communities also exhibited stage-specific biomarker patterns. Members of the orders Pleosporales (family Pleosporaceae) and Erysiphales (family Erysiphaceae), particularly the species Microidium phyllanthi, were identified as key contributors to fungal community differentiation (LDA > 4) (Figure 5(B1)). These findings were further corroborated by SIMPER analysis, confirming the robustness of the identified biomarkers in distinguishing developmental stages.
Cladogram visualization revealed clear clustering of differential microbes corresponding to each developmental stage (Figure 5(A2,B2)). The BSP1 stage was marked by the prominence of the Brevundimonas family, Pseudomonas family, and Pleosporales (family Pleosporaceae), which collectively served as robust biomarkers for early fruit development. In the BSP2 stage, the Lachnospiraceae family and Erysiphales (family Erysiphaceae) were identified as defining taxa, underscoring their association with mid-stage fruit maturation. By the BSP3 stage, the Nocardioidaceae family emerged as a distinctive marker, signifying its potential role in late-stage fruit ripening.

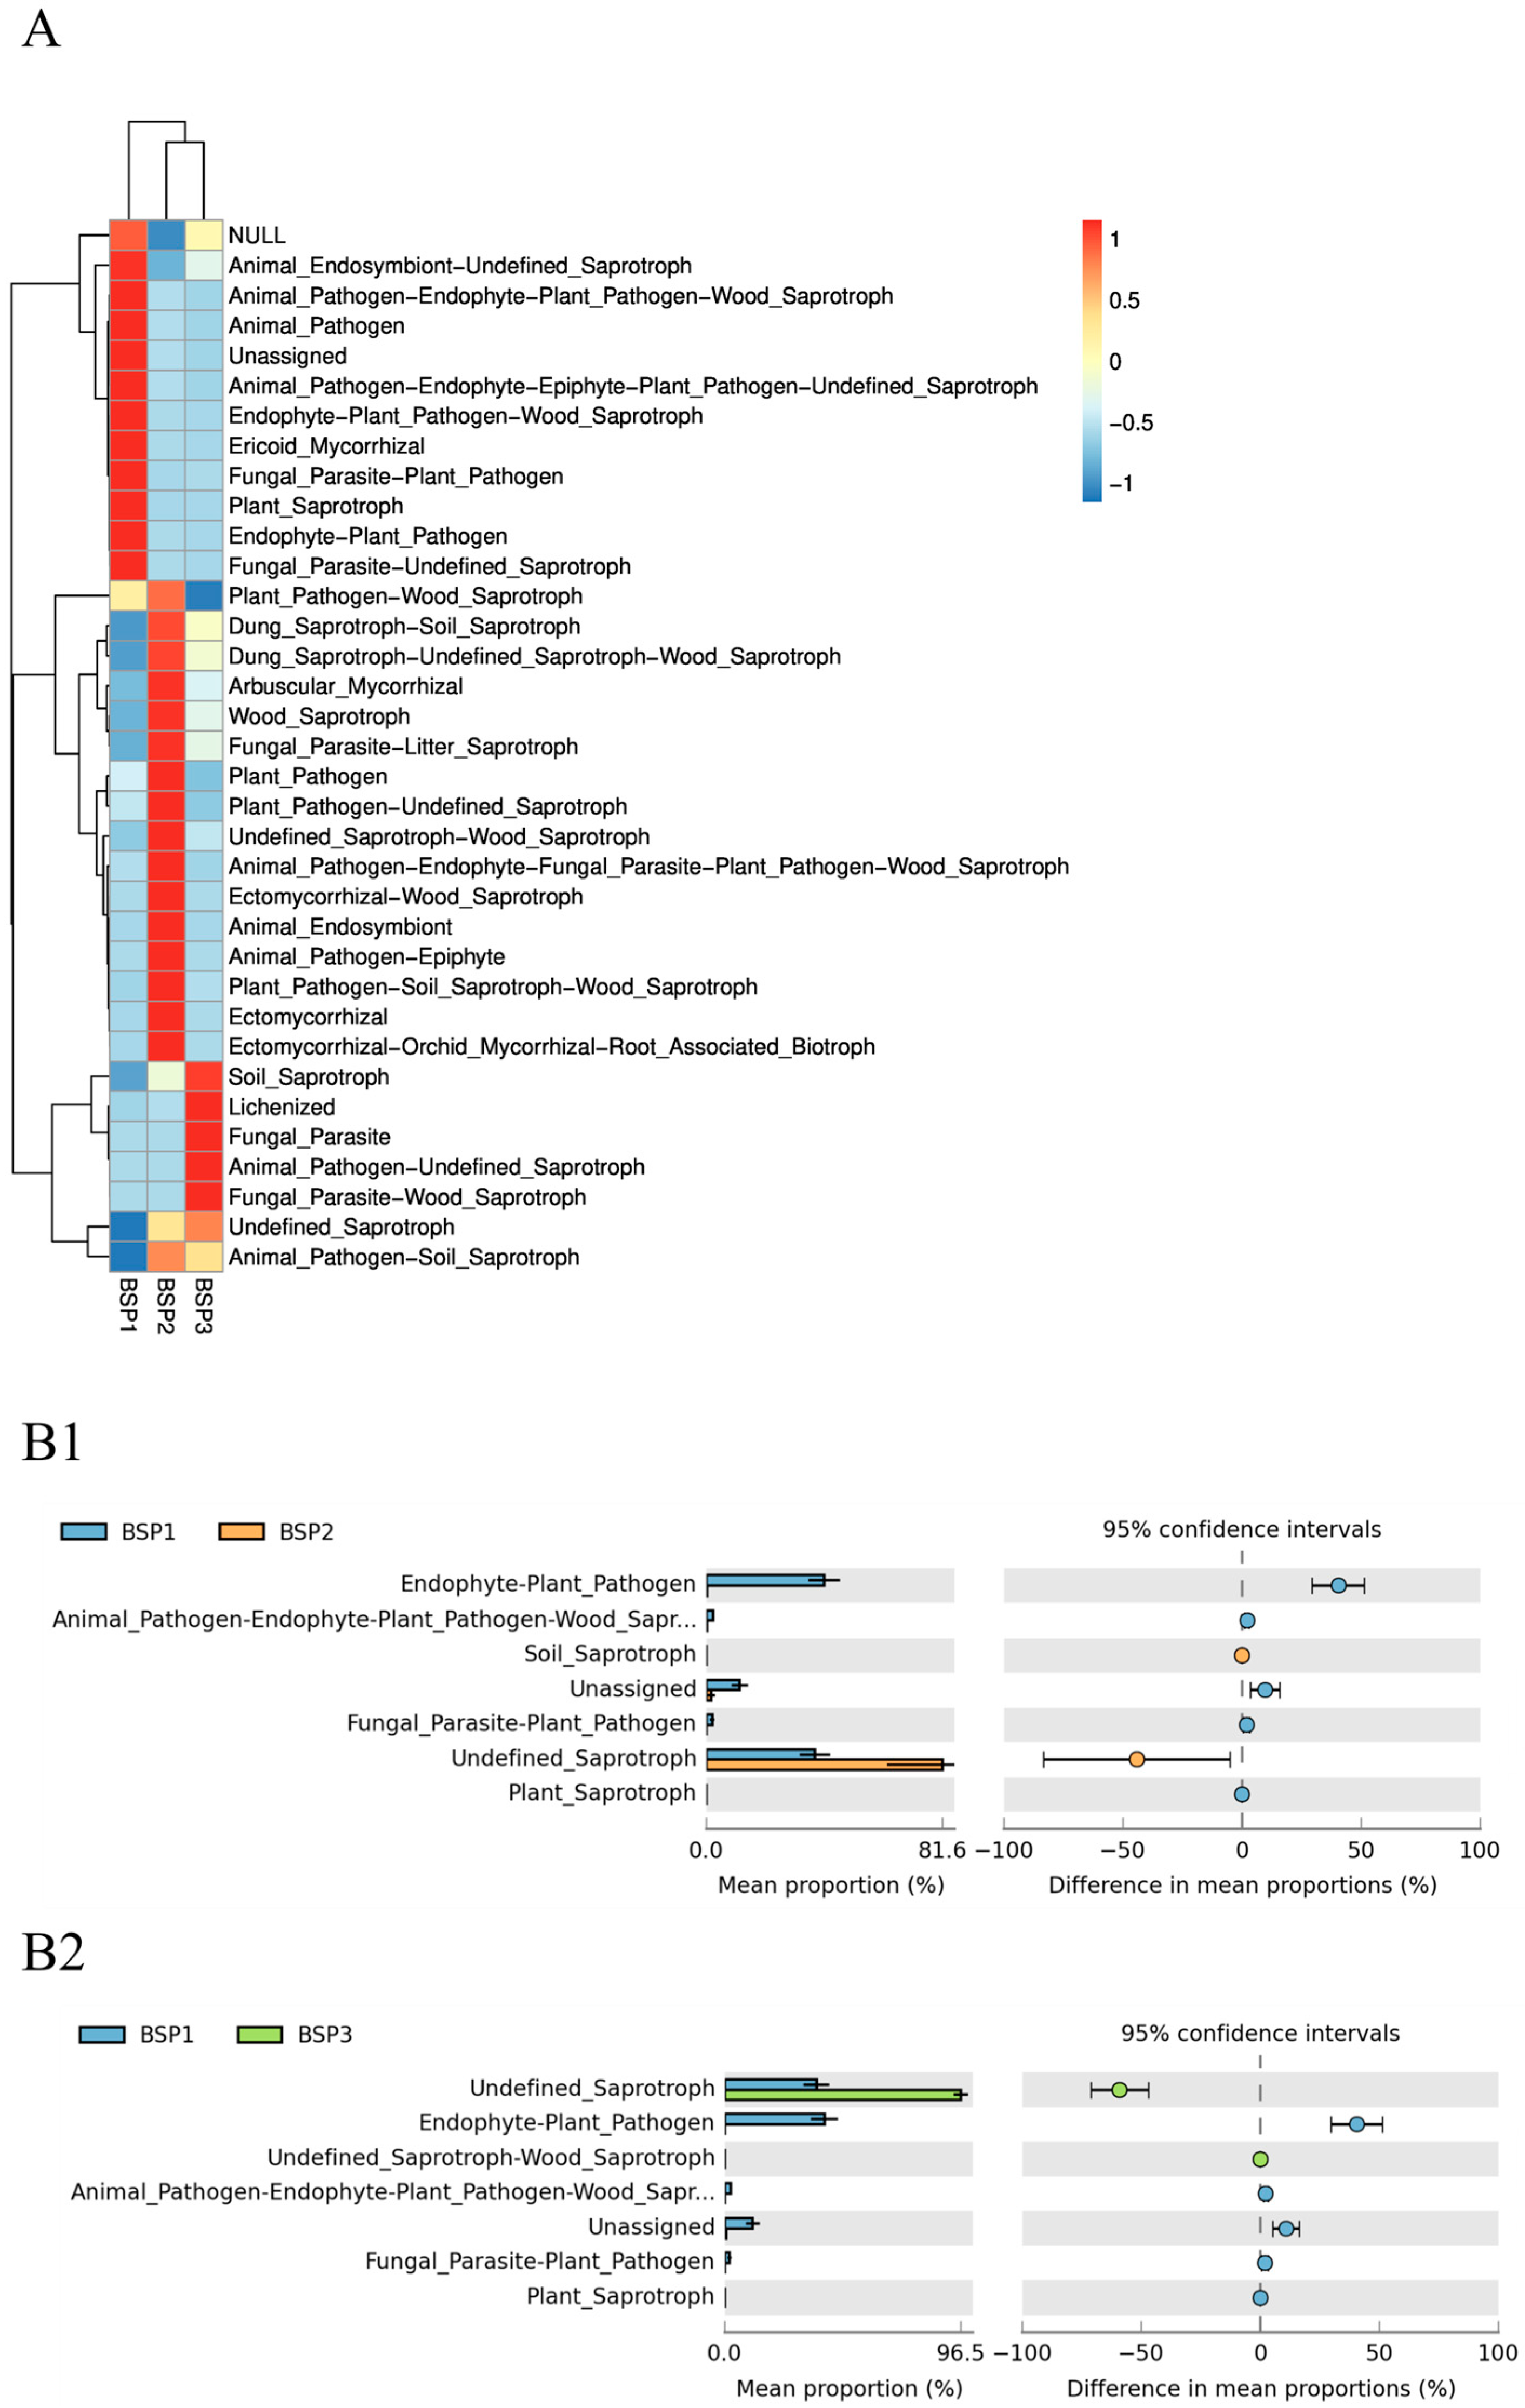
3.4. Functional Prediction of Bacterial Communities in Fengtang Plum at Different Developmental Stages

During the development of Fengtang plum fruits, bacterial community functions exhibited significant stage-specific succession patterns. Based on FAPROTAX functional prediction analysis, the fruit-setting stage (BSP1) was dominated by fundamental energy metabolism, including chemoheterotrophy, aerobic chemoheterotrophy, nitrate reduction, and dark oxidation of sulfur compounds. Chemoheterotrophy and aerobic chemoheterotrophy predominated, facilitating rapid energy acquisition through decomposition of simple organic carbon sources. Concurrently, active nitrate reduction and dark oxidation of sulfur compounds indicated microbial involvement in nitrogen/sulfur cycling regulation while supporting host energy demands. Principal coordinate analysis revealed distinct clustering of BSP1 functional profiles, significantly separated from mid-late developmental stages, with heatmap clustering further demonstrating enrichment of carbon/nitrogen assimilation pathways in this stage.
As fruit development progressed, microbial functions gradually transitioned toward complex organic matter metabolism. During BSP2, chitinolysis and nitrate ammonification showed significant enhancement, potentially improving niche adaptability through fungal cell wall degradation and nitrogen form optimization. By BSP3, aromatic compound degradation and hydrocarbon degradation increased significantly compared with BSP1, accompanied by the activation of ureolysis and lignin degradation functions. Mean proportion analysis indicated functional convergence between BSP2 and B3 stages, suggesting that stabilized microenvironmental parameters during late maturation drove microbial communities toward dynamic equilibrium.
This functional succession pattern closely correlated with physiological changes during fruit development: early stage foundational metabolism supported microbial colonization, mid-stage nitrogen cycle intensification enhanced pathogen resistance, while late-stage functions shifted toward degrading secondary metabolites like terpenes and phenolics, potentially mitigating toxicity and delaying spoilage. The functional contributions of uncharacterized OTUs (80.13%) and cross-stage functional redundancy mechanisms require further investigation through metagenomics to precisely elucidate microbial regulatory networks underlying fruit quality formation.
Fungi functions exhibited the same stage specificity as bacteria communities, and PCoA analysis also segregated functional groups into distinct clusters (Figure 6(B1,B2)), with early stage functions differing markedly from mid- and late-stage functions. Undefined_Saprotroph was the dominant functional group, increasing in relative abundance with fruit development and becoming highly enriched in mature fruits (BSP1: 40.24%, BSP2: 43.80%, BSP3: 96.70%) (Figure 7A). Endophyte–plant–pathogen was prominent in BSP1 (43.80%) but decreased to <1% in BSP2 and BSP3. Plant–pathogen decreased from 43.80% in BSP1 to <1% in later stages. Heatmaps showed that BSP1 was enriched in diverse saprotrophic, pathogenic, and mycorrhizal functions, indicating dynamic antagonism between pathogens and saprotrophs during early colonization. BSP2 was enriched in saprotrophic and pathogen–saprotroph composite functions, with saprotrophs dominating. BSP3 was highly enriched in soil, wood, and undefined saprotrophic functions, with saprotrophs completely dominating the fungal community (Figure 7(B1,B2)).

4. Discussion

Microbial diversity has been widely demonstrated to influence fruit growth, physiological and biochemical metabolism, and disease susceptibility. While numerous studies have explored microbial community dynamics in various fruits pre- and post-harvest, little is known about plum fruit microbiomes. This study focused on changes in bacterial and fungal diversity and composition across different developmental stages of Fengtang plum. We discovered significant differences between early stage and mid-to-late developmental microbial communities in the fruit. Dominant bacterial genera exhibited clear successional patterns across stages, whereas fungal enrichment displayed distinct temporal characteristics divergent from bacterial dynamics. This reveals a stage-dependent assembly pattern of microbial communities during Fengtang plum development. The directional shift in bacterial functions (from basal metabolism to lignin degradation) and cascading reinforcement of fungal saprotrophic activities jointly drive the fruit’s defense-to-ripening transition. Through the synergistic regulation of host epidermal integrity loss and microbial functional redundancy, precise suppression of pathogens and targeted enrichment of ripening-associated degradative microbiota were achieved, establishing a novel microbial dimension for deciphering Fengtang plum fruit quality formation.

4.1. Microbial Diversity and Composition at Different Developmental Stages of Fengtang Plum

At the phylum level, the dominant bacteria across all stages were Proteobacteria, Firmicutes, Actinobacteriota, and Bacteroidota, while the dominant fungi were Ascomycota and Basidiomycota, differing only in relative abundance. At the genus level, enriched microbes at each stage clustered separately on phylogenetic trees, indicating stage-specific microbial community composition. Similar patterns have been observed in date palm (Phoenix dactylifera) [37], grape berries (Vitis vinifera) [38], mango (Mangifera indica) [39], and Coffea canephora [40], where unique endophytic microbial communities were associated with different developmental stages.
In this study, the bacterial community followed a distinct successional sequence, with dominant genera Brevundimonas, Limnobacter, and Pseudomonas being gradually replaced by Ralstonia and Lactobacillus across developmental stages, whereas the fungal enrichment process demonstrated independent temporal specificity. Trichoderma showed a marked increase in relative abundance, escalating from 38.50% to 80.21%, and subsequently climbing to 95.91%, resulting in temporal distribution patterns distinctly different from those of bacterial communities.
A previous study investigating microbial communities in pre-harvest Fengtang plum identified Gammaproteobacteria (primarily Escherichia and Pseudoalteromonas) as the dominant bacterial taxa, with Glomeromycota fungi (Puccinia and Rhizophagus) constituting the predominant fungal population [41]. This reported fungal composition contrasts with the microbial profile observed in our study, where different fungal taxa demonstrated dominance. The fruit microbiome is influenced by multiple factors. Research on Citrus reticulata “Chachi” procured from core (geo-authentic product region) and non-core (non-geo-authentic product region) geographical regions showed that differences in soil environments led to variations in the microbiome [4]. Studies on mulberry fruits across different seasons also demonstrated that seasonal climate factors caused differences in the composition of fruit microbial communities [3]. Similarly, global analyses of apple fruit microbiomes have highlighted the impact of geographical location and farming practices on microbial communities [42]. In addition to microbial shifts, environmental factors such as temperature, relative humidity, and solar radiation are also known to influence plant morphological and phytochemical traits, which may indirectly contribute to cultivar-specific characteristics [43]. Studies on endophytic bacteria in organically farmed apple fruits found that, compared with conventional farming (using chemical pesticides), the population size of endophytic bacteria did not change under organic farming, but the microbial community composition was more diverse [44]. Different parts of organically grown fruits contained several unique microbial taxa [45], suggesting that the application of fungicides may alter the characteristics of the fruit microbiome by affecting microbial balance.
The diversity of Fengtang plum microbial communities was significantly lower at the fruit-setting stage (BSP1) and increased with fruit development. Interestingly, bacterial evenness increased, while fungal evenness decreased. Correspondingly, dominant bacterial abundance decreased, while low-abundance bacteria increased in the mid- and late stages. In contrast, dominant fungi, particularly Trichoderma, accumulated significantly, increasing from 38.5% at BSP1 to 80.21% at BSP2 and 95.91% at BSP3. The explosive proliferation of Trichoderma led to the simplification of the fungal community structure and served as the primary driver of the observed decline in evenness. PCoA analysis confirmed significant differences in bacterial communities between BSP1 and later stages, while fungal communities showed no significant differences. Although numerous studies suggest that a decrease in microbial community evenness can affect microbial disease resistance, Trichoderma has been widely reported as one of the fungi with antagonistic bioactivity against plant pathogens, functioning through multiple mechanisms, including antibiotic production, chitinase enzyme production, niche competition, and induction of host immunity [46]. Field experiments in maize/cabbage rotation systems [47] and Chinese cabbage/cabbage rotation systems [48] have demonstrated that the application of bio-organic fertilizers containing Trichoderma can modify rhizosphere microbial composition, increase the abundance of potentially beneficial bacteria, and improve crop yield and quality. Compared with other plum fruits, Fengtang plum fruits from Zhenning have not been reported to suffer from brown rot caused by Monilinia spp., a globally prevalent disease in stone fruits. This may be related to the high abundance of Trichoderma sp. accumulated during the mid-to-late stages of fruit development, and beneficial changes in the associated bacterial community structure and diversity.

4.2. Corer Microorganisms and Their Potential Functions at Different Developmental Stages of Fengtang Plum

At the fruit-setting stage (BSP1), Brevundimonas, Pseudomonas, and Limnobacter (bacteria) and Cladosporium and Plectosphaerella (fungi) were the primary contributors to differences between stages. Brevundimonas, Limnobacter, and Pseudomonas are known as plant growth-promoting rhizobacteria (PGPR) [49,50,51], involved in nitrogen, phosphorus, zinc, and iron metabolism [52,53], along with sulfur oxidation [54] and carbon [55] metabolism. Functional prediction indicated that BSP1 bacterial functions were dominated by basic metabolism and sulfur oxidation, consistent with community composition. Therefore, by adopting the results of the cladogram analysis, it is reasonable to identify the Brevundimonas family and Pseudomonas family as marker organisms for the fruit-setting stage of Fengtang plum.
In mid and late stages (BSP2/BSP3), Ralstonia and Lactobacillus (bacteria), along with Trichoderma, Microidium, and Lysurus (fungi), were key contributors to differences in microbial communities between the mid-to-late stages and the fruit set stage. Previous studies have shown that dominant bacterial microorganisms during the mid-to-late stages of fruit maturation significantly influence the volatile compounds of fruits. For example, in fingered citron, Halomonas and Actinomycetes were significantly positively correlated with key aromatic compounds [56]. In raspberry fruits, an increased abundance of Lactobacillus and Paenibacillus enhanced the content of norisoprenoids, a type of volatile compound [57]. In this study, microbial functional prediction revealed that during the mid-to-late stages of fruit development, bacterial “aromatic compound degradation” and fungal “saprotrophic nutrition” functions may synergistically decompose secondary metabolites (e.g., phenolics, terpenoids), promoting fruit maturation and the release of aromatic compounds. So, based on previous research findings, we may hypothesize that the enrichment of Lactobacillus during the mid-to-late stages of Fengtang plum fruit development is probably associated with the production of aromatic compounds. The underlying metabolic mechanisms and plant–microbe interactions require further research.
Ralstonia is a pathogen causing bacterial wilt in various plants. Studies have reported that Pseudomonas can induce host defense signals or employ antibiotic strategies to control diseases caused by Ralstonia [58,59]. The antagonistic relationship between Ralstonia and Pseudomonas in microbial communities suggests that the enrichment of Ralstonia during the transition from the fruit set stage to the maturation stage may be a response to the decline of Pseudomonas. The R. solanacearum wild-type strain undergoes a phenotypic conversion (PC), shifting from pathogenic to non-pathogenic in the broth culture, soil, plant, and water extract of the plant [60,61]. Pre-inoculation of PC mutants in Solanum plants has demonstrated protective effects against bacterial wilt disease [62]. Concurrently, Trichoderma asperellum isolates were shown to delay wilt progression, significantly reduce disease incidence, enhance fruit yield, and improve plant growth parameters under field conditions. These effects were mediated through the increased accumulation of total phenolic compounds and salicylic acid, coupled with elevated enzymatic activities of peroxidase, lipoxygenase, and polyphenol oxidase in both tomato and potato plants [63,64]. Since Fengtang plum fruits exhibited Ralstonia accumulation in mid-to-late developmental stages without manifesting bacterial wilt symptoms, this observed resistance could potentially stem from either PC mutant activity alone or synergistic biocontrol interactions between PC mutants and late-stage accumulated Trichoderma. Such antagonistic mechanisms may explain the dissociation between Ralstonia proliferation and disease symptom expression.
In the meantime, LEfSe analysis (LDA > 4) revealed that the bacterial community was characterized by marker taxa in the BSP1 stage, including Brevundimonas (oligotrophic chemoheterotrophic bacteria), Limnobacter (sulfur-oxidizing functional bacteria), and Pseudomonas (nitrate-reducing bacteria), which synergistically drove early carbon, nitrogen, and sulfur cycles, supporting microbial colonization and host energy demands. By the BSP3 stage, the enrichment of Aeromicrobium and Virgibacillus (aromatic-degrading bacteria) was coupled with enhanced hydrocarbon metabolism, accelerating fruit softening and decay. Fungal community succession transitioned from a “pathogen–saprotroph” dynamic equilibrium to saprotrophic dominance. Marker taxa such as the Pleosporaceae family (Alternaria spp.) in BSP1 and the Nocardioidaceae family (lignin-degrading fungi) in BSP3 exhibited abundance shifts consistent with the FUNGuild-predicted surge in saprophytic functions (96.70% in BSP3). Cladogram and SIMPER analyses jointly validated the developmental stage specificity of taxon–function relationships, with Trichoderma emerging as a core hub genus. It suppressed pathogen proliferation through biocontrol activity while driving late-stage organic matter degradation via saprophytic metabolism.

5. Conclusions

This study systematically analyzed the spatiotemporal dynamics of bacterial and fungal communities in Fengtang plum across developmental stages using a multi-stage sampling strategy combined with functional prediction tools (PICRUSt2 and FUNGuild). To our knowledge, this represents the first comprehensive characterization of both structural and functional succession patterns in Fangtang plum-associated microbiomes during fruit maturation. The results revealed stage-specific microbial assemblages. Core microbes at the fruit-setting stage included Brevundimonas, Pseudomonas, and Limnobacter (bacteria) and Cladosporium and Plectosphaerella (fungi). Core microbes in mid and late stages included Ralstonia and Lactobacillus (bacteria) and Trichoderma, Microidium, and Lysurus (fungi). Notably, functional predictions uncovered a critical ecological transition where bacterial roles shifted from primary carbon/nitrogen cycling to specialized secondary metabolite processing, paralleled by fungal functional succession from pathogen–saprotroph competition to saprotrophic dominance.
These findings advance horticultural microbiome research by establishing temporal fingerprints of core taxa driving fruit development and revealing metabolic handover points between bacterial and fungal consortia. Practically, the identified keystone taxa (Lactobacillus and Trichoderma) and their functional signatures provide actionable targets for microbial-based quality enhancement strategies, particularly for optimizing aroma biosynthesis and postharvest preservation. However, limitations in inferring metabolic activity from DNA-based predictions warrant validation through controlled inoculation experiments and transcriptomic profiling. Future research should prioritize multi-omics integration (metabolomics/metagenomics/transcriptomics) to mechanistically unravel microbial contributions to fruit development, while exploring field-applicable microbial amendments for sustainable quality improvement and storability extension.

Author Contributions

Conceptualization, J.L. and R.W.; methodology, J.L.; software, J.L. and Y.S.; validation, J.L. and Y.S.; formal analysis, J.L. and H.L.; investigation, J.L. and R.W.; resources, R.W.; data curation, J.L. and Y.S.; writing—original draft preparation, J.L. and Y.S.; writing—review and editing, J.L.; visualization, Y.S.; supervision, R.W.; project administration, J.L.; funding acquisition, R.W. All authors have read and agreed to the published version of the manuscript.

Funding

Guizhou Key Laboratory of New Quality Processing and Storage of Ecological Specialty Food (No. ZSYS[2025]023).

Data Availability Statement

The original contributions presented in this study are included in the article. Further inquiries can be directed to the corresponding authors.

Conflicts of Interest

The authors declare no conflicts of interest.

Appendix A

After quality control of the original reads from Fengtang plum samples at different growth stages (results shown in Table 1), all samples exhibited Q20 and Q30 values exceeding 90.00%, with GC content consistently above 52.74%. All 18 samples met the criteria for subsequent experimental analysis.
Using the Illumina Nova sequencing platform, PCR-free libraries were constructed and subjected to paired-end sequencing. Through sequence assembly, an average of 90,040 tags per sample were obtained. After quality control, an average of 61,816 high-quality reads were retained per sample, achieving an average quality control efficiency of 69.24%. All 18 samples complied with the standards for further analysis.
The sequencing data were clustered into operational taxonomic units (OTUs) at 97% identity threshold. Taxonomic annotation of OTU sequences was performed using the UNITE database. A rarefaction curve (Figure A1) was plotted with sequencing data volume versus observed species numbers. When the sequencing data volume reached 3000 sequences, bacterial species numbers in all samples approached their maximum values, while fungal species numbers stabilized when the data volume reached 5000 sequences. Based on the effective data volumes of each sample (Table A1), the current sequencing data volume is considered reasonable, and the sequencing depth is sufficient to capture the microbial community diversity contained in all samples.
Figure A1. Species diversity curves of bacteria (A1,A2) and fungi (B1,B2) samples of Fengtang plum during development.
Horticulturae 11 00483 g0a1
Table A1. Quality assessment of sequencing data.
MicrobatSample NameRawPECleanTagsEffectiveTagsQ20 (%)Q30 (%)GC (%)Effective (%)
BacteriaB.S.P.193,83280,89061,38997.7593.1754.4865.42
B.S.P.281,76170,97960,89997.7893.2154.6674.48
B.S.P.397,79886,48365,09597.7793.0554.5766.56
B.S.P.494,15269,60259,95798.6495.3254.9063.68
B.S.P.591,52468,24857,71098.1094.1552.7463.05
B.S.P.696,3746562659,15598.1294.1752.9661.38
B.S.P.7109,20672,50866,55898.3194.6653.9060.95
B.S.P.879,41656,28649,98298.6395.3054.7762.94
B.S.P.990,31265,31959,82698.7195.5055.0866.24
FungiB.S.P.188,55987,51566,67796.9292.4254.4675.29
B.S.P.290,31788,99660,18996.9992.6453.8266.64
B.S.P.391,49788,98862,81096.2991.2655.3768.65
B.S.P.492,16889,34563,02898.4595.0060.0768.38
B.S.P.586,00180,17561,32996.8892.0259.7271.31
B.S.P.696,51291,36569,55898.2894.6859.7772.07
B.S.P.791,81084,99368,83998.4194.8960.0274.98
B.S.P.857,55352,78952,55198.5895.3459.6791.31
B.S.P.991,94090,40067,12998.5195.1459.9473.01
Note: RawPE represents the raw PE reads obtained from sequencing; CleanTags are the sequences obtained after filtering RawTags for low quality and short lengths; EffectiveTags are the final tag sequences used for subsequent analysis after removing chimeras; Q20 and Q30 represent the percentages of bases in EffectiveTags with quality scores greater than 20 (sequencing error rate < 1%) and 30 (sequencing error rate < 0.1%), respectively; GC(%) indicates the content of GC bases in EffectiveTags; Effective(%) represents the percentage of the number of EffectiveTags relative to the number of RawPE.
Table A2. Relative abundance of bacteria and fungi.
ClassificationTaxonomyRelative Abundance (%)ClassificationTaxonomyRelative Abundance (%)
BSP1BSP2BSP3BSP1BSP2BSP3
genusRalstonia0 ± 027.9493 ± 24.560334.8377 ± 11.0352genusTrichoderma38.8515 ± 3.789980.9452 ± 14.241696.123 ± 2.3117
Brevundimonas29.2557 ± 2.21690.0792 ± 0.03960.3563 ± 0.1814Cladosporium43.7916 ± 4.39050.3071 ± 0.14140.1464 ± 0.0383
Limnobacter26.8804 ± 2.63110 ± 00 ± 0Microidium0 ± 012.3632 ± 11.17580.0664 ± 0.0422
Pseudomonas19.3983 ± 1.27240.4355 ± 0.27716.6112 ± 2.4887Plectosphaerella1.8495 ± 1.83110.0606 ± 0.01680.0394 ± 0.0267
Aeromicrobium0 ± 00.4751 ± 0.27436.0174 ± 1.8619Lysurus0 ± 02.7358 ± 1.50991.247 ± 1.1882
Blautia0.0792 ± 0.03962.5337 ± 2.35580.0792 ± 0.0396Alternaria2.5997 ± 0.38720.1903 ± 0.07430.0942 ± 0.0279
Lactobacillus0.1584 ± 0.10473.9984 ± 1.67442.6524 ± 2.1249Pseudopithomyces1.0902 ± 1.00040.0026 ± 0.00260.0045 ± 0.0023
1174-901-124.2755 ± 1.50380.2771 ± 0.27710 ± 0Epicoccum2.1785 ± 0.57450.0484 ± 0.03190.0548 ± 0.0168
Acidiphilium1.8211 ± 1.18040.0396 ± 0.03960.0396 ± 0.0396Xerochrysium0 ± 00.8722 ± 0.86640 ± 0
Bifidobacterium0.0396 ± 0.03961.4252 ± 1.30820.2771 ± 0.1726Septobasidium0.8238 ± 0.61540 ± 00 ± 0
Others18.0918 ± 3.201862.787 ± 22.510849.1291 ± 14.6311Others8.8152 ± 0.44122.4746 ± 0.83142.2243 ± 1.0105
phylumProteobacteria91.5677 ± 1.391833.7688 ± 23.11948.2581 ± 15.2248phylumAscomycota95.2163 ± 1.497195.399 ± 2.504398.2342 ± 1.2558
Firmicutes2.6524 ± 0.733216.2312 ± 10.44737.601 ± 4.8694Basidiomycota1.3813 ± 0.9133.2185 ± 1.70061.4617 ± 1.2023
Bacteroidota0.5146 ± 0.30928.076 ± 4.73621.5439 ± 0.9889Mortierellomycota0.0039 ± 0.00390.074 ± 0.04230.0437 ± 0.0251
Actinobacteriota0.4751 ± 0.06863.4046 ± 1.32679.5804 ± 0.8949Rozellomycota0 ± 00.0367 ± 0.0260.0141 ± 0.0053
Acidobacteriota1.4252 ± 0.80840 ± 00.0396 ± 0.0396Chytridiomycota0.0006 ± 0.00060.0193 ± 0.00670.0064 ± 0.0034
Fusobacteriota0 ± 00.3959 ± 0.17260.9501 ± 0.8314Mucoromycota0 ± 00.0154 ± 0.00840.0006 ± 0.0006
Cyanobacteria1.2272 ± 0.33820.8314 ± 0.83140 ± 0Aphelidiomycota0 ± 00.0077 ± 0.00770 ± 0
unidentified_Bacteria1.1085 ± 0.17261.1085 ± 0.51460.1188 ± 0.0686Glomeromycota0 ± 00.0058 ± 0.00580.0013 ± 0.0013
Campilobacterota0.2375 ± 0.18140.673 ± 0.24080.1584 ± 0.0792Neocallimastigomycota0 ± 00.0058 ± 0.00580 ± 0
Desulfobacterota0.2375 ± 0.18140.3563 ± 0.13710.0396 ± 0.0396Blastocladiomycota0 ± 00.0032 ± 0.00320 ± 0
Others0.5542 ± 0.079235.1544 ± 19.57831.7102 ± 15.3388Others3.3979 ± 0.70141.2147 ± 0.81780.2379 ± 0.0348
Figure A2. Functional prediction of bacterial and fungal communities in Fengtang plum fruits. Note: (A1,A2): Showing the functional prediction of bacterial and fungal communities in Fengtang plum fruit; (B1,B2): PCA analysis of different groups of communities.
Horticulturae 11 00483 g0a2

References

  1. Droby, S.; Wisniewski, M. The fruit microbiome: A new frontier for postharvest biocontrol and postharvest biology. Postharvest Biol. Technol. 2018, 140, 107–112. [Google Scholar] [CrossRef]
  2. Berg, G.; Rybakova, D.; Fischer, D.; Cernava, T.; Vergès, M.-C.C.; Charles, T.; Chen, X.; Cocolin, L.; Eversole, K.; Corral, G.H. Microbiome definition re-visited: Old concepts and new challenges. Microbiome 2020, 8, 103. [Google Scholar]
  3. Ou, T.; Xu, W.-f.; Wang, F.; Strobel, G.; Zhou, Z.-y.; Xiang, Z.-h.; Liu, J.; Xie, J. A microbiome study reveals seasonal variation in endophytic bacteria among different mulberry cultivars. Comput. Struct. Biotechnol. J. 2019, 17, 1091–1100. [Google Scholar] [CrossRef]
  4. Wu, Y.; Qu, M.; Pu, X.; Lin, J.; Shu, B. Distinct microbial communities among different tissues of citrus tree Citrus reticulata cv. Chachiensis. Sci. Rep. 2020, 10, 6068. [Google Scholar] [CrossRef] [PubMed]
  5. Goforth, M.; Cooper, M.A.; Oliver, A.S.; Pinzon, J.; Skots, M.; Obergh, V.; Suslow, T.V.; Flores, G.E.; Huynh, S.; Parker, C.T. Bacterial community shifts of commercial apples, oranges, and peaches at different harvest points across multiple growing seasons. PLoS ONE 2024, 19, e0297453. [Google Scholar] [CrossRef] [PubMed]
  6. Kumari, M.; Qureshi, K.A.; Jaremko, M.; White, J.; Singh, S.K.; Sharma, V.K.; Singh, K.K.; Santoyo, G.; Puopolo, G.; Kumar, A. Deciphering the role of endophytic microbiome in postharvest diseases management of fruits: Opportunity areas in commercial up-scale production. Front. Plant Sci. 2022, 13, 1026575. [Google Scholar] [CrossRef]
  7. Droby, S.; Zhimo, V.Y.; Wisniewski, M.; Freilich, S. The pathobiome concept applied to postharvest pathology and its implication on biocontrol strategies. Postharvest Biol. Technol. 2022, 189, 111911. [Google Scholar] [CrossRef]
  8. Zhang, H.; Serwah Boateng, N.A.; Ngolong Ngea, G.L.; Shi, Y.; Lin, H.; Yang, Q.; Wang, K.; Zhang, X.; Zhao, L.; Droby, S. Unravelling the fruit microbiome: The key for developing effective biological control strategies for postharvest diseases. Compr. Rev. Food Sci. Food Saf. 2021, 20, 4906–4930. [Google Scholar] [CrossRef]
  9. Wang, B.; Wang, X.; Wang, Z.; Zhu, K.; Wu, W. Comparative metagenomic analysis reveals rhizosphere microbial community composition and functions help protect grapevines against salt stress. Front. Microbiol. 2023, 14, 1102547. [Google Scholar] [CrossRef]
  10. Kusstatscher, P.; Cernava, T.; Abdelfattah, A.; Gokul, J.; Korsten, L.; Berg, G. Microbiome approaches provide the key to biologically control postharvest pathogens and storability of fruits and vegetables. FEMS Microbiol. Ecol. 2020, 96, fiaa119. [Google Scholar] [CrossRef]
  11. Zhimo, V.Y.; Kumar, A.; Biasi, A.; Salim, S.; Feygenberg, O.; Toamy, M.A.; Abdelfattaah, A.; Medina, S.; Freilich, S.; Wisniewski, M.; et al. Compositional shifts in the strawberry fruit microbiome in response to near-harvest application of Metschnikowia fructicola, a yeast biocontrol agent. Postharvest Biol. Technol. 2021, 175, 111469. [Google Scholar] [CrossRef]
  12. Kumar, A.; Zhimo, Y.; Biasi, A.; Salim, S.; Feygenberg, O.; Wisniewski, M.; Droby, S. Endophytic microbiome in the carposphere and its importance in fruit physiology and pathology. In Postharvest Pathology; Plant Pathology in the 21st Century; Springer: Berlin/Heidelberg, Germany, 2021; Chapter 5; pp. 73–88. [Google Scholar]
  13. Lukša, J.; Vepštaitė-Monstavičė, I.; Yurchenko, V.; Serva, S.; Servienė, E. High content analysis of sea buckthorn, black chokeberry, red and white currants microbiota–a pilot study. Food Res. Int. 2018, 111, 597–606. [Google Scholar] [CrossRef] [PubMed]
  14. Fang, X.; Shen, J.; Zhang, L.; Zou, X.; Jin, L. Metabolomic and transcriptomic integration reveals the mechanism of aroma formation as strawberries naturally turn colors while ripening. Food Chem. 2024, 460, 140765. [Google Scholar] [CrossRef] [PubMed]
  15. Todhanakasem, T.; Van Tai, N.; Pornpukdeewattana, S.; Charoenrat, T.; Young, B.M.; Wattanachaisaereekul, S. The relationship between microbial communities in coffee fermentation and aroma with metabolite attributes of finished products. Foods 2024, 13, 2332. [Google Scholar] [CrossRef] [PubMed]
  16. Escobar Rodriguez, C.; Novak, J.; Buchholz, F.; Uetz, P.; Bragagna, L.; Gumze, M.; Antonielli, L.; Mitter, B. The bacterial microbiome of the tomato fruit is highly dependent on the cultivation approach and correlates with flavor chemistry. Front. Plant Sci. 2021, 12, 775722. [Google Scholar] [CrossRef] [PubMed]
  17. Topp, B.L.; Russell, D.M.; Neumüller, M.; Dalbó, M.A.; Liu, W. Plum. In Fruit Breeding; Springer: Berlin/Heidelberg, Germany, 2012; pp. 571–621. [Google Scholar]
  18. Zhang, Y.; Li, Y.Q.; Xiao, Y.; Wu, J.L.; Cheng, L. Breeding and cultivation techniques of the new plum variety “fengtangli”. S. China Fruits 2018, 47, 146–148. [Google Scholar] [CrossRef]
  19. Wang, H.L.; Xie, P.; Ma, Y.H.; Zhao, K.; Wang, H.; Zhao, X.; Zheng, Q. Differences in sugar and acid components and quality evaluation of “fengtangli” plum fruits from different production areas in Guizhou. Guizhou Agric. Sci. 2024, 52, 84–93. [Google Scholar]
  20. Rungjindamai, N.; Jeffries, P.; Xu, X.-M. Epidemiology and management of brown rot on stone fruit caused by Monilinia laxa. Eur. J. Plant Pathol. 2014, 140, 1–17. [Google Scholar] [CrossRef]
  21. De Miccolis Angelini, R.M.; Landi, L.; Raguseo, C.; Pollastro, S.; Faretra, F.; Romanazzi, G. Tracking of diversity and evolution in the brown rot fungi Monilinia fructicola, Monilinia fructigena, and Monilinia laxa. Front. Microbiol. 2022, 13, 854852. [Google Scholar] [CrossRef]
  22. Janisiewicz, W.J.; Jurick II, W.M.; Vico, I.; Peter, K.A.; Buyer, J.S. Culturable bacteria from plum fruit surfaces and their potential for controlling brown rot after harvest. Postharvest Biol. Technol. 2013, 76, 145–151. [Google Scholar] [CrossRef]
  23. Janakiev, T.; Dimkić, I.; Bojić, S.; Fira, D.; Stanković, S.; Berić, T. Bacterial communities of plum phyllosphere and characterization of indigenous antagonistic Bacillus thuringiensis R3/3 isolate. J. Appl. Microbiol. 2020, 128, 528–543. [Google Scholar] [CrossRef] [PubMed]
  24. He, S.; Gao, L.; Zhang, Z.; Ming, Z.; Gao, F.; Ma, S.; Zou, M. Diversity analysis of microorganisms on the surface of four summer fruit varieties in Baotou, inner Mongolia, China. PeerJ 2024, 12, e18752. [Google Scholar] [CrossRef] [PubMed]
  25. Bram, B.; Michiel, O.D.B.; Sofie, T.; Sascha, T.; Nele, W.; Wout, B.; Jaco, V. Performance of 16s rdna primer pairs in the study of rhizosphere and endosphere bacterial microbiomes in metabarcoding studies. Front. Microbiol. 2016, 7, 650. [Google Scholar]
  26. Schoch, C.L.; Seifert, K.A.; Huhndorf, S.; Robert, V.; Spouge, J.L.; Levesque, C.A.; Chen, W.; Fungal Barcoding Consortium; Bolchacova, E.; Voigt, K.; et al. Nuclear ribosomal internal transcribed spacer (its) region as a universal DNA barcode marker for fungi. Proc. Natl. Acad. Sci. USA 2012, 109, 6241–6246. [Google Scholar] [CrossRef]
  27. Degnan, P.H.; Howard, O. Illumina-based analysis of microbial community diversity. ISME J. 2012, 6, 183–194. [Google Scholar] [CrossRef]
  28. Caporaso, G.J.; Lauber, L.C.; Walters, W.A.; Berg-Lyons, D.; Huntley, J.; Fierer, N.; Owens, S.M.; Betley, J.; Fraser, L.; Bauer, M.; et al. Ultra-high-throughput microbial community analysis on the illumina hiseq and miseq platforms. ISME J. 2012, 6, 1621–1624. [Google Scholar] [CrossRef]
  29. Magoc, T.; Salzberg, S.L. Flash: Fast length adjustment of short reads to improve genome assemblies. Bioinformatics 2011, 27, 2957–2963. [Google Scholar] [CrossRef] [PubMed]
  30. Bokulich, N.A.; Subramanian, S.; Faith, J.J.; Gevers, D.; Gordon, J.I.; Knight, R.; Mills, D.A.; Caporaso, J.G. Quality-filtering vastly improves diversity estimates from illumina amplicon sequencing. Nat. Methods 2013, 10, 57–59. [Google Scholar] [CrossRef]
  31. Rognes, T.; Flouri, T.; Nichols, B.; Quince, C.; Mahé, F. Vsearch: A versatile open source tool for metagenomics. PeerJ 2016, 4, e2584. [Google Scholar] [CrossRef]
  32. Cole, J.R.; Wang, Q.; Fish, J.A.; Chai, B.; McGarrell, D.M.; Sun, Y.; Brown, C.T.; Porras-Alfaro, A.; Kuske, C.R.; Tiedje, J.M. Ribosomal database project: Data and tools for high throughput rRNA analysis. Nat. Rev. Microbiol. 2014, 42, D633–D642. [Google Scholar] [CrossRef]
  33. Abarenkov, K.; Nilsson, R.H.; Larsson, K.-H.; Alexander, I.J.; Eberhardt, U.; Erland, S.; Høiland, K.; Kjøller, R.; Larsson, E.; Pennanen, T.; et al. The unite database for molecular identification of fungi–recent updates and future perspectives. New Phytol. 2010, 186, 281–285. [Google Scholar] [CrossRef] [PubMed]
  34. Yang, Z.; Peng, C.; Cao, H.; Song, J.; Gong, B.; Li, L.; Wang, L.; He, Y.; Liang, M.; Lin, J. Microbial functional assemblages predicted by the FAPROTAX analysis are impacted by physicochemical properties, but C, N and S cycling genes are not in mangrove soil in the Beibu Gulf, China. Ecol. Indic. 2022, 139, 108887. [Google Scholar] [CrossRef]
  35. Nguyen, N.H.; Song, Z.; Bates, S.T.; Branco, S.; Tedersoo, L.; Menke, J.; Schilling, J.S.; Kennedy, P.G. FUNGuild: An open annotation tool for parsing fungal community datasets by ecological guild. Fungal Ecol. 2016, 20, 241–248. [Google Scholar] [CrossRef]
  36. Segata, N.; Izard, J.; Waldron, L.; Gevers, D.; Miropolsky, L.; Garrett, W.S.; Huttenhower, C. Metagenomic biomarker discovery and explanation. Genome Biol. 2011, 12, R60. [Google Scholar] [CrossRef] [PubMed]
  37. Piombo, E.; Abdelfattah, A.; Danino, Y.; Salim, S.; Feygenberg, O.; Spadaro, D.; Wisniewski, M.; Droby, S. Characterizing the fungal microbiome in date (Phoenix dactylifera) fruit pulp and peel from early development to harvest. Microorganisms 2020, 8, 641. [Google Scholar] [CrossRef]
  38. Lukša, J.; Vepštaitė-Monstavičė, I.; Apšegaitė, V.; Blažytė-Čereškienė, L.; Stanevičienė, R.; Strazdaitė-Žielienė, Ž.; Ravoitytė, B.; Aleknavičius, D.; Būda, V.; Mozūraitis, R.; et al. Fungal microbiota of sea buckthorn berries at two ripening stages and volatile profiling of potential biocontrol yeasts. Microorganisms 2020, 8, 456. [Google Scholar] [CrossRef]
  39. Bill, M.; Chidamba, L.; Gokul, J.K.; Korsten, L. Mango endophyte and epiphyte microbiome composition during fruit development and post-harvest stages. Horticulturae 2021, 7, 495. [Google Scholar] [CrossRef]
  40. Balbino Miguel, P.S.; Delvaux, J.C.; de Oliveira, M.N.V.; Monteiro, L.C.P.; de Souza Freitas, F.; Costa, M.D.; Tótola, M.R.; de Moraes, C.A.; Borges, A.C. Diversity of endophytic bacteria in the fruits of Coffea canephora. Afr. J. Microbiol. Res. 2013, 7, 586–594. [Google Scholar] [CrossRef]
  41. Wang, Y.-R.; Zeng, S.-X.; Leng, J.-S.; Huang, B.-Y.; Chen, H.; Wang, Y.; Liu, J. Metagenomic analysis of the epiphytic and endophytic microbiota of plum fruits at different storage temperatures. Res. Sq. 2024. [Google Scholar] [CrossRef]
  42. Abdelfattah, A.; Freilich, S.; Bartuv, R.; Zhimo, V.Y.; Kumar, A.; Biasi, A.; Salim, S.; Feygenberg, O.; Burchard, E.; Dardick, C.; et al. Global analysis of the apple fruit microbiome: Are all apples the same? Environ. Microbiol. 2021, 23, 6038–6055. [Google Scholar] [CrossRef]
  43. Aydin, D.; Coskun, O.F. Comparison of edta-enhanced phytoextraction strategies with Nasturtium officinale (Watercress) on an artificially arsenic contaminated water. Pak. J. Bot 2013, 45, 1423–1429. [Google Scholar]
  44. Wassermann, B.; Müller, H.; Berg, G. An apple a day: Which bacteria do we eat with organic and conventional apples? Front. Microbiol. 2019, 10, 475179. [Google Scholar] [CrossRef] [PubMed]
  45. Abdelfattah, A.; Wisniewski, M.; Droby, S.; Schena, L. Spatial and compositional variation in the fungal communities of organic and conventionally grown apple fruit at the consumer point-of-purchase. Hortic. Res. 2016, 3, 16047. [Google Scholar] [CrossRef] [PubMed]
  46. Woo, S.L.; Hermosa, R.; Lorito, M.; Monte, E. Trichoderma: A multipurpose, plant-beneficial microorganism for eco-sustainable agriculture. Nat. Rev. Microbiol. 2023, 21, 312–326. [Google Scholar] [CrossRef] [PubMed]
  47. Qiao, C.; Penton, C.R.; Xiong, W.; Liu, C.; Wang, R.; Liu, Z.; Xu, X.; Li, R.; Shen, Q. Reshaping the rhizosphere microbiome by bio-organic amendment to enhance crop yield in a maize-cabbage rotation system. Appl. Soil Ecol. 2019, 142, 136–146. [Google Scholar] [CrossRef]
  48. Su, J.; Wang, Y.; Bai, M.; Peng, T.; Li, H.; Xu, H.-J.; Guo, G.; Bai, H.; Rong, N.; Sahu, S.K.; et al. Soil conditions and the plant microbiome boost the accumulation of monoterpenes in the fruit of Citrus reticulata ‘Chachi’. Microbiome 2023, 11, 61. [Google Scholar] [CrossRef]
  49. Lugtenberg, B.; Kamilova, F. Plant-growth-promoting rhizobacteria. Annu. Rev. Microbiol. 2009, 63, 541–556. [Google Scholar] [CrossRef]
  50. Verma, M.; Mishra, J.; Arora, N.K. Plant growth-promoting rhizobacteria: Diversity and applications. In Environmental Biotechnology: For Sustainable Future; Springer: Berlin/Heidelberg, Germany, 2018; pp. 129–173. [Google Scholar]
  51. Oleńska, E.; Małek, W.; Wójcik, M.; Swiecicka, I.; Thijs, S.; Vangronsveld, J. Beneficial features of plant growth-promoting rhizobacteria for improving plant growth and health in challenging conditions: A methodical review. Sci. Total Environ. 2020, 743, 140682. [Google Scholar] [CrossRef] [PubMed]
  52. Hakim, S.; Naqqash, T.; Nawaz, M.S.; Laraib, I.; Siddique, M.J.; Zia, R.; Mirza, M.S.; Imran, A. Rhizosphere engineering with plant growth-promoting microorganisms for agriculture and ecological sustainability. Front. Sustain. Food Syst. 2021, 5, 617157. [Google Scholar] [CrossRef]
  53. Zeng, Q.; Ding, X.; Wang, J.; Han, X.; Iqbal, H.M.; Bilal, M. Insight into soil nitrogen and phosphorus availability and agricultural sustainability by plant growth-promoting rhizobacteria. Environ. Sci. Pollut. Res. 2022, 29, 45089–45106. [Google Scholar] [CrossRef]
  54. Xamxidin, M.; Huang, X.-P.; Yang, X.-W.; Wang, T.; Chen, C.; Wu, M. Limnobacter parvuscolonica sp. Nov., thiosulfate-oxidizing bacterium isolated from lake water. Res. Sq. 2022. [Google Scholar] [CrossRef]
  55. Chen, Y.; Feng, X.; He, Y.; Wang, F. Genome analysis of a Limnobacter sp. Identified in an anaerobic methane-consuming cell consortium. Front. Mar. Sci. 2016, 3, 257. [Google Scholar] [CrossRef]
  56. Wang, Y.; Wu, J.; Sun, P.; Chen, C.; Shen, J. Community structure of phyllosphere bacteria in different cultivars of fingered citron (Citrus medica ‘fingered’) and their correlations with fragrance. Front. Plant Sci. 2022, 13, 936252. [Google Scholar] [CrossRef] [PubMed]
  57. Sangiorgio, D.; Cellini, A.; Spinelli, F.; Pastore, C.; Farneti, B.; Savioli, S.; Rodriguez-Estrada, M.T.; Donati, I. Contribution of fruit microbiome to raspberry volatile organic compounds emission. Postharvest Biol. Technol. 2022, 183, 111742. [Google Scholar] [CrossRef]
  58. Agarwal, H.; Dowarah, B.; Baruah, P.M.; Bordoloi, K.S.; Krishnatreya, D.B.; Agarwala, N. Endophytes from Gnetum gnemon l. Can protect seedlings against the infection of phytopathogenic bacterium Ralstonia solanacearum as well as promote plant growth in tomato. Microbiol. Res. 2020, 238, 126503. [Google Scholar] [CrossRef] [PubMed]
  59. Elsayed, T.R.; Jacquiod, S.; Nour, E.H.; Sørensen, S.J.; Smalla, K. Biocontrol of bacterial wilt disease through complex interaction between tomato plant, antagonists, the indigenous rhizosphere microbiota, and Ralstonia solanacearum. Front. Microbiol. 2020, 10, 2835. [Google Scholar] [CrossRef]
  60. Mori, T.; Fujiyoshi, T.; Inada, T.; Matsusaki, H.; Ogawa, K.; Matsuzoe, N. Phenotypic conversion of Ralstonia solanacearum in susceptible and resistant Solanum plants. Environ. Control. Biol. 2011, 49, 165–176. [Google Scholar] [CrossRef]
  61. Mori, T.; Inada, T.; Ogawa, K.; Matsusaki, H.; Matsuzoe, N. Phenotypic conversion of Ralstonia solanacearum in water extract of Solanum toxicarium. J. Plant Pathol. 2012, 94, 535–542. [Google Scholar]
  62. Nakahara, H.; Mori, T.; Sadakari, N.; Matsusaki, H.; Matsuzoe, N. Selection of effective non-pathogenic ralstonia solanacearum as biocontrol agents against bacterial wilt in eggplant. J. Plant Dis. Prot. 2016, 123, 119–124. [Google Scholar] [CrossRef]
  63. Konappa, N.; Krishnamurthy, S.; Siddaiah, C.N.; Ramachandrappa, N.S.; Chowdappa, S. Evaluation of biological efficacy of Trichoderma asperellum against tomato bacterial wilt caused by Ralstonia solanacearum. Egypt. J. Biol. Pest Control. 2018, 28, 63. [Google Scholar] [CrossRef]
  64. Mohamed, B.F.; Sallam, N.M.; Alamri, S.A.; Abo-Elyousr, K.A.; Mostafa, Y.S.; Hashem, M. Approving the biocontrol method of potato wilt caused by Ralstonia solanacearum (Smith) using enterobacter cloacae PS14 and Trichoderma asperellum T34. Egypt. J. Biol. Pest Control. 2020, 30, 61. [Google Scholar] [CrossRef]
Figure 1. Diversity of endophytic bacteria (A1A4) and fungi (B1B4) communities of Fengtang plum.
Horticulturae 11 00483 g001
Figure 2. Relative abundance of the top 10 endophytic bacteria (A1,A2) and fungi (B1,B2) of Fengtang plum at the phylum level (1) and genus level (2).
Horticulturae 11 00483 g002
Figure 3. Heatmap of the top 35 endophytic bacteria (A) and fungi (B) at the genus level.
Horticulturae 11 00483 g003
Figure 4. Beta diversity indices and PcoA analysis of endophytic bacteria (A1,A2) and fungi (B1,B2) community of Fengtang plum during development.
Horticulturae 11 00483 g004
Figure 5. LEfSe analysis of bacteria (A1,A2) and fungi (B1,B2) community of Fengtang plum during development.
Horticulturae 11 00483 g005
Figure 6. Functional prediction of bacterial communities in Fengtang plum fruits. Note: (A) is the heat map display function category, (B1,B2) contrast sample ratio difference.
Horticulturae 11 00483 g006
Figure 7. Functional prediction of fungal communities in Fengtang plum fruits. Note: (A) is the heat map display function category, (B1,B2) contrast sample ratio difference.
Horticulturae 11 00483 g007
Table 1. Contribution of bacteria species to community differences during development.
Bacteria SpeciesBSP1 vs. BSP2BSP1 vs. BSP3BSP2 vs. BSP3
Average Abundance (%)Contribution
(%)
Average Abundance (%)Contribution
(%)
Average Abundance (%)Contribution
(%)
BSP1BSP2BSP1BSP3BSP2BSP3
Ralstonia0.00 27.91 22.45 0.00 34.77 20.34 27.91 34.77 32.28
Brevundimonas30.74 0.00 16.88 30.74 0.20 17.86 0.00 0.20 28.61
Limnobacter28.15 0.00 15.46 28.15 0.00 17.82 0.00 0.00 5.38
Pseudomonas20.06 0.56 15.33 20.06 6.38 16.46 0.56 6.38 5.23
Aeromicrobium0.00 0.44 10.71 0.00 6.10 8.00 0.44 6.10 2.88
Blautia0.20 2.59 2.17 0.20 0.04 3.57 2.59 0.04 2.36
Lactobacillus0.16 4.11 1.34 0.16 2.87 1.59 4.11 2.87 1.31
Acidiphilium1.79 0.00 0.99 1.79 0.04 1.03 0.00 0.04 1.12
Bifidobacterium0.04 1.48 0.94 0.04 0.16 1.00 1.48 0.16 1.10
Escherichia-Shigella0.84 1.12 0.800.84 0.28 0.77 1.12 0.28 0.88
Table 2. Contribution of fungi species to community differences during development.
Fungi SpeciesBSP1 vs. BSP2BSP1 vs. BSP3BSP2 vs. BSP3
Average Abundance (%)Contribution
(%)
Average Abundance (%)Contribution
(%)
Average Abundance (%)Contribution
(%)
BSP1BSP2BSP1BSP3BSP2BSP3
Trichoderma38.85 80.95 22.4538.85 96.13 20.3480.95 96.13 32.28
Cladosporium43.80 0.31 16.8843.80 0.15 17.860.31 0.15 28.61
Microidium0.00 12.36 15.460.00 0.07 17.8212.36 0.07 5.38
Plectosphaerella1.85 0.06 15.331.85 0.04 16.460.06 0.04 5.23
Lysurus0.00 2.73 10.710.00 1.24 8.002.73 1.24 2.88
Alternaria2.60 0.19 2.172.60 0.09 3.570.19 0.09 2.36
Pseudopithomyces1.09 0.00 1.341.09 0.00 1.590.00 0.00 1.31
Epicoccum2.18 0.05 0.992.18 0.05 1.030.05 0.05 1.12
Xerochrysium0.00 0.87 0.940.00 0.00 1.000.87 0.00 1.10
Septobasidium0.83 0.00 0.800.83 0.00 0.770.00 0.00 0.88
Disclaimer/Publisher’s Note: The statements, opinions and data contained in all publications are solely those of the individual author(s) and contributor(s) and not of MDPI and/or the editor(s). MDPI and/or the editor(s) disclaim responsibility for any injury to people or property resulting from any ideas, methods, instructions or products referred to in the content.

