Article

Physiological and Transcriptional Characteristics of Banana Seedlings in Response to Nitrogen Deficiency Stress

1
State Key Laboratory of Biological Breeding of Tropical Crops, School of Tropical Agriculture and Forestry, Hainan University, Sanya 570228, China
2
State Key Laboratory of Biological Breeding of Tropical Crops, Institute of Tropical Bioscience and Biotechnology, Chinese Academy of Tropical Agricultural Sciences, Haikou 571101, China
3
Sanya Research Academy, Chinese Academy of Tropical Agriculture Science, Sanya 572019, China
*
Authors to whom correspondence should be addressed.
Horticulturae 2024, 10(3), 290; https://doi.org/10.3390/horticulturae10030290
Submission received: 16 February 2024 / Revised: 8 March 2024 / Accepted: 14 March 2024 / Published: 18 March 2024
(This article belongs to the Special Issue Horticultural Plant Nutrition, Fertilization, Soil Management)

Abstract

:
Nitrogen is a crucial element for the growth and development of plants, directly affecting crop growth and yield. To investigate the physiological and molecular mechanism of nitrogen-deficiency stress, we conducted an investigation into the effects of different nitrogen levels on the growth, photosynthetic characteristics, and gene transcription levels of banana seedlings. Compared with the control group with normal nitrogen levels (NN), the height of plants receiving Reduced-N (NR), Low-N (LN), and N-Free (NF) treatments was decreased by 0.45 cm, 2.5 cm, and 3.25 cm, respectively. Their dry weight was reduced by 1.63 g, 2.99 g, and 2.88 g, respectively. Conversely, the dry weight of the underground plant part in the LN and NF treatment groups exhibited an increase of 0.13 g and 0.16 g, respectively. Regarding photosynthetic characteristics, the Specialty Products Agricultural Division (SPAD) values of the NR, LN, and NF treatments showed reductions of 15.5%, 30.4%, and 35.9%, respectively, compared with those of the control treatments. The values of maximum photosynthetic efficiency (Fv/Fm), actual photosynthetic efficiency (Y(Ⅱ)), and relative electron transfer (ETR) of the banana seedlings decreased to different degrees after NR, LN, and NF treatment, and their values were positively correlated with N levels. Gene transcription analysis showed that N transport-related proteins, including NRT1.7, NRT2.3a, NRT2.3b, and NRT2.5, were significantly up-regulated to increase the nitrogen absorption capacity of plant roots. On the other hand, various transcription factors including GRAS, MYB, and WRKY were notably up-regulated, facilitating root growth and the expanding root absorption area, thereby enhancing nitrogen uptake. Furthermore, genes associated with endogenous hormone metabolic pathways such as gibberellin (GA), strigolactone (SL), and brassinosteroids (BR) were activated in banana plants subjected to low nitrogen stress, enhancing the plant’s ability to adapt to nitrogen-deficient conditions. These findings offer valuable insights into understanding the transcriptional regulatory mechanisms governing banana responses to low nitrogen stress and breeding new varieties with improved nutrient utilization.

1. Introduction

Nitrogen (N) is necessary for maintaining the vital physiological processes of plants. It engages in diverse biochemical reactions, serving as a crucial constituent of proteins, amino acids, and chlorophyll [1,2]. With the exception of the symbiotic nitrogen fixation of leguminous plants with rhizobium, the majority of terrestrial plants acquire inorganic N such as nitrate N (NO3) and ammonium N (NH4+) from the soil via the root system. Plants have evolved to develop diverse transport mechanisms. The nitrate transport proteins (NRTs) of plants are crucial for the uptake and transportation of nitrate. In Arabidopsis, AtNRT2.1, AtNRT2.2, AtNRT2.4, and AtNRT2.5 participate in the response to N deficiency [3,4]. AtNRT2.4 and AtNRT2.5 are responsible for nitrate transport from the root cortex to epidermal cells and from the phloem to leaves [5]. OsNRT2.1, OsNRT2.2, OsNRT2.3a, and OsNAR2.1 from rice are involved in the nitrate uptake of roots [6,7]. Overexpression of OsNPF8.9/NRT1 promotes rice growth under low-N conditions [8]. Additionally, ammonium transporters (AMTs) are classified as a high-affinity transport systems for the utilization of NH4+ [9]. Arabidopsis AMT genes such as AtAMT1.1, AtAMT1.3, and AtAMT1.5 are directly involved in the uptake of ammonium N (NH4+). The expression level of OsAMT1.3 was up-regulated in response to low N levels [10,11].
Transcription factors play a significant role in a plant’s response to low N stress. Under N-deficient conditions, overexpression of MdNAC4 induced the transcription of MdNCED2 in the ABA biosynthesis pathway of apple [12]. BnaA9.WRKY47 regulates the expression of BnaC7.SGR1, BnaA2.NRT1.7, and BanA9AAP1 to alleviate N deficiency in rape plants [13]. In foxtail millet, SiMYB3 promotes root development by regulating IAA synthesis under low-N conditions [14]. ZmNF-YA13 enhances N uptake by increasing the N transport of roots [15]. The expression of ZmDof1 facilitates N absorption by up-regulating organic acid metabolism [16]. Overexpression of GmZFP7 increased the contents of isoflavones in soybean root [17].
Phytohormones such as auxin (IAA) and cytokinin (CTK) play a crucial role in the signal transduction of root development and N response [18,19,20,21]. IAA activates the gene expression of high-affinity nitrate transporter 2 (NRT2s) to accelerate root development under low N stress [22]. The auxin transporter ZmPIN1a enhanced the transport of IAA from the stem to root in maize, promoting the formation of lateral roots [23]. CKT is responsible for N signal transfer in rice. The presence of NO3 can influence the level of CTK in the phloem [24,25]. Exogenous CTK or overexpression of IPF promoted CTK synthesis to inhibit the elongation of roots. Reversely, overexpression of CKX promoted root growth [26,27,28]. Additionally, exogenous ethylene (ETH) has a detrimental effect on plant root elongation [29,30,31]. In maize roots, N deficiency leads to a reduction in ETH production but an increase in root sensitivity to ETH, ultimately resulting in the formation of aerenchyma [32,33]. Abscisic acid (ABA) is a crucial phytohormone in the response of plants to abiotic stress including low N stress. In Arabidopsis, the addition of NO3 resulted in an elevation of ABA levels in the root tip. High levels of ABA are attributed to the activation of ABA-GE induced by NO3 [34].
Banana (Musa acuminata) is a significant fruit grain crop and holds the largest trade volume of fresh fruit globally. Its tall plant height and high fruit yield causes the substantial requirement of N nutrition. Consequently, the cultivation method of “big water and big fertilizer” is extensively employed in banana production. However, the excessive application of N fertilizer to improve banana yield results in 20–30% utilization efficiency. This inefficiency causes considerable fertilizer waste and environmental pollution [35,36]. Current research mainly focuses on N nutrient utilization in banana physiological characteristics. The elucidation of key genes and regulatory mechanism remains elusive. Hence, our study aims to compare the effects of different N levels on the plant growth, photosynthetic parameters, and other pertinent indicators of banana seedlings. An analysis of differentially expressed genes will be carried out to elucidate the underlying mechanism in response to low N stress. The findings offer a theoretical reference for the enhancement of fertilization efficiency and nutrient utilization in banana production.

2. Materials and Methods

2.1. Treatment and Sampling

The experiment was conducted in a greenhouse (temperature: 28 ± 5 °C; relative humidity: 60–70%) located at the Chinese Academy of Tropical Agricultural Sciences, Haikou, Hainan China. Tissue culture seedlings with three leaves (Baxi cv. Musa acuminata) that had rooted for 30 days were chosen and transplanted into cylindrical pots (diameter × height: 13 cm × 11 cm) containing washed sand. The nitrogen concentration required to meet the normal growth of seedlings was set as the control (Normal-N, NN) [37]. Four different levels of N were established, namely NN (16 mM), Reduced-N (NR, 11.2 mM), Low-N (LN, 3.2 mM), and N-Free (NF, 0 mM). Each treatment was replicated 50 times. For each plant, 300 mL of nutrient solution of different nitrogen concentrations was added per week (Table S1). After 28 d, the root samples collected were immediately frozen in liquid nitrogen and stored at −80 °C. The experiment was repeated with three biological replicates.

2.2. Determination of Chlorophyll SPAD Value

Specialty Products Agricultural Division (SPAD) is a common index of chlorophyll content in leaves that is usually used to evaluate the level of chlorophyll content in plant leaves. The SPAD values of banana seedling leaves were assessed using a portable SPAD-502 chlorophyll detector (KonicaMinolta, Tokyo, Japan) at the indicated time points (0, 3, 7, 14, and 28 d) after exposure to different N levels. In total, ten banana seedlings were chosen for analysis, specifically targeting the second fully expanded leaf from the apex.

2.3. Determination of Dry Weight and Plant Height

The plant height of the banana seedlings was determined after growth for 28 d. In total, 10 seedlings were randomly chosen for each treatment. The aboveground and underground tissues of seedlings were collected. The samples were subjected to a temperature of 105 °C for 30 min to terminate biological activity, followed by drying at 75 °C until a constant weight was observed. The dry weight was then measured.

2.4. Determination of Chlorophyll Fluorescence Parameters

In intervals of 0, 7, 14, and 28 d under different N treatments, the second fully unfolded leaf of the banana plant was carefully chosen for chlorophyll determination. The chlorophyll fluorescence parameters were assessed using the IMAGING-PAM-MAXI chlorophyll fluorescence analyzer (WALZ, Effeltrich, Germany). We set the parameters of Meas-Light and Act-Light so that the fluorescence value of the AOI region was maintained between 0.1 and 0.2. Each treatment was repeated 3 times. The samples were collected from 9:00 to 14:00 on a sunny day and were kept in the dark for 20 min.

2.5. Transcriptome Sequencing and Data Analysis

The extraction of total RNA from banana seedling roots was carried out using the Quick RNA Isolation Kit (Huayueyang, Beijing, China). DNase I was added to eliminate genomic DNA contamination. The integrity and concentration of total RNA were assessed through 1.2% agarose gel electrophoresis and using NanoDrop One (Thermo, Waltham, MA, USA). For cDNA library construction, 3 μg of total RNA was utilized. The library was sequenced by BioMarker Technologies Company (Beijing, China), employing the Illumina 6000 platform for sequencing.
FastQC (v0.11.9) software was used to compute Q20, Q30, and GC contents. fastp (v0.20.0) software was employed to filter out adapters, ploy-N, and low-quality readings based on quality control measurements. The clean data were aligned against those for the banana reference genome (v4) obtained from the Banana Genome Center (https://banana-genome-hub.southgreen.fr, accessed on 10 August 2022). The genome coverage and mapping rate were analyzed using Hisat2 (v2.1.0) and QualiMap (v.2.2.1), respectively. Furthermore, htseq-count (v1.99.2) was employed to calculate the gene expression level, which was converted into FPKM (the expected number of fragments per kilobase of transcript sequence sequenced per million base pairs). In accordance with the criteria, log2 (FC) ≥ 1, FDR < 0.01, and p < 0.05, the DESeq2 R package (v1.32.0) was applied to identify differentially expressed genes (DEGs). Gene function was annotated using the following databases: NR (NCBI non-redundant protein sequences), EggNOG (evolutionary genealogy of genes: non-supervised orthologous Groups) and Uniprot (https://www.uniprot.org/, accessed on 12 August 2022).

2.6. Data Analysis and Mapping

Statistical analysis was conducted using SPSS 22.0 software. ANOVA was used for analyzing the variance in the statistical analysis. Bar charts were drawn using Origin 2017 and Illustrator software. Wayne charts and GO enrichment analysis were conducted through online platforms (https://www.chiplot.online/, accessed on 15 August 2022); http://www.bioinformatics.com.cn/, accessed on 15 August 2022. We drew a heat map using Tbtools software (1.075) [38].

2.7. RNA Extraction and qRT-PCR Analysis

Total RNA was extracted and detected as described above. The first-strand cDNA was synthesized through reverse transcription using RevertAid First Strand cDNA Synthesis Kit (Thermo Fisher Scientific, Waltham, MA, USA). qRT-PCR analysis was conducted using SYBR Green qPCR Master MIX Kit (Thermo Fisher Scientific, Waltham, MA, USA). The MaActin gene served as the internal reference. Information and primer sequences of selected genes are detailed in Supplementary Table S2. Relative expression was determined using the 2−ΔΔCt method. Each sample set was replicated three times.

3. Results

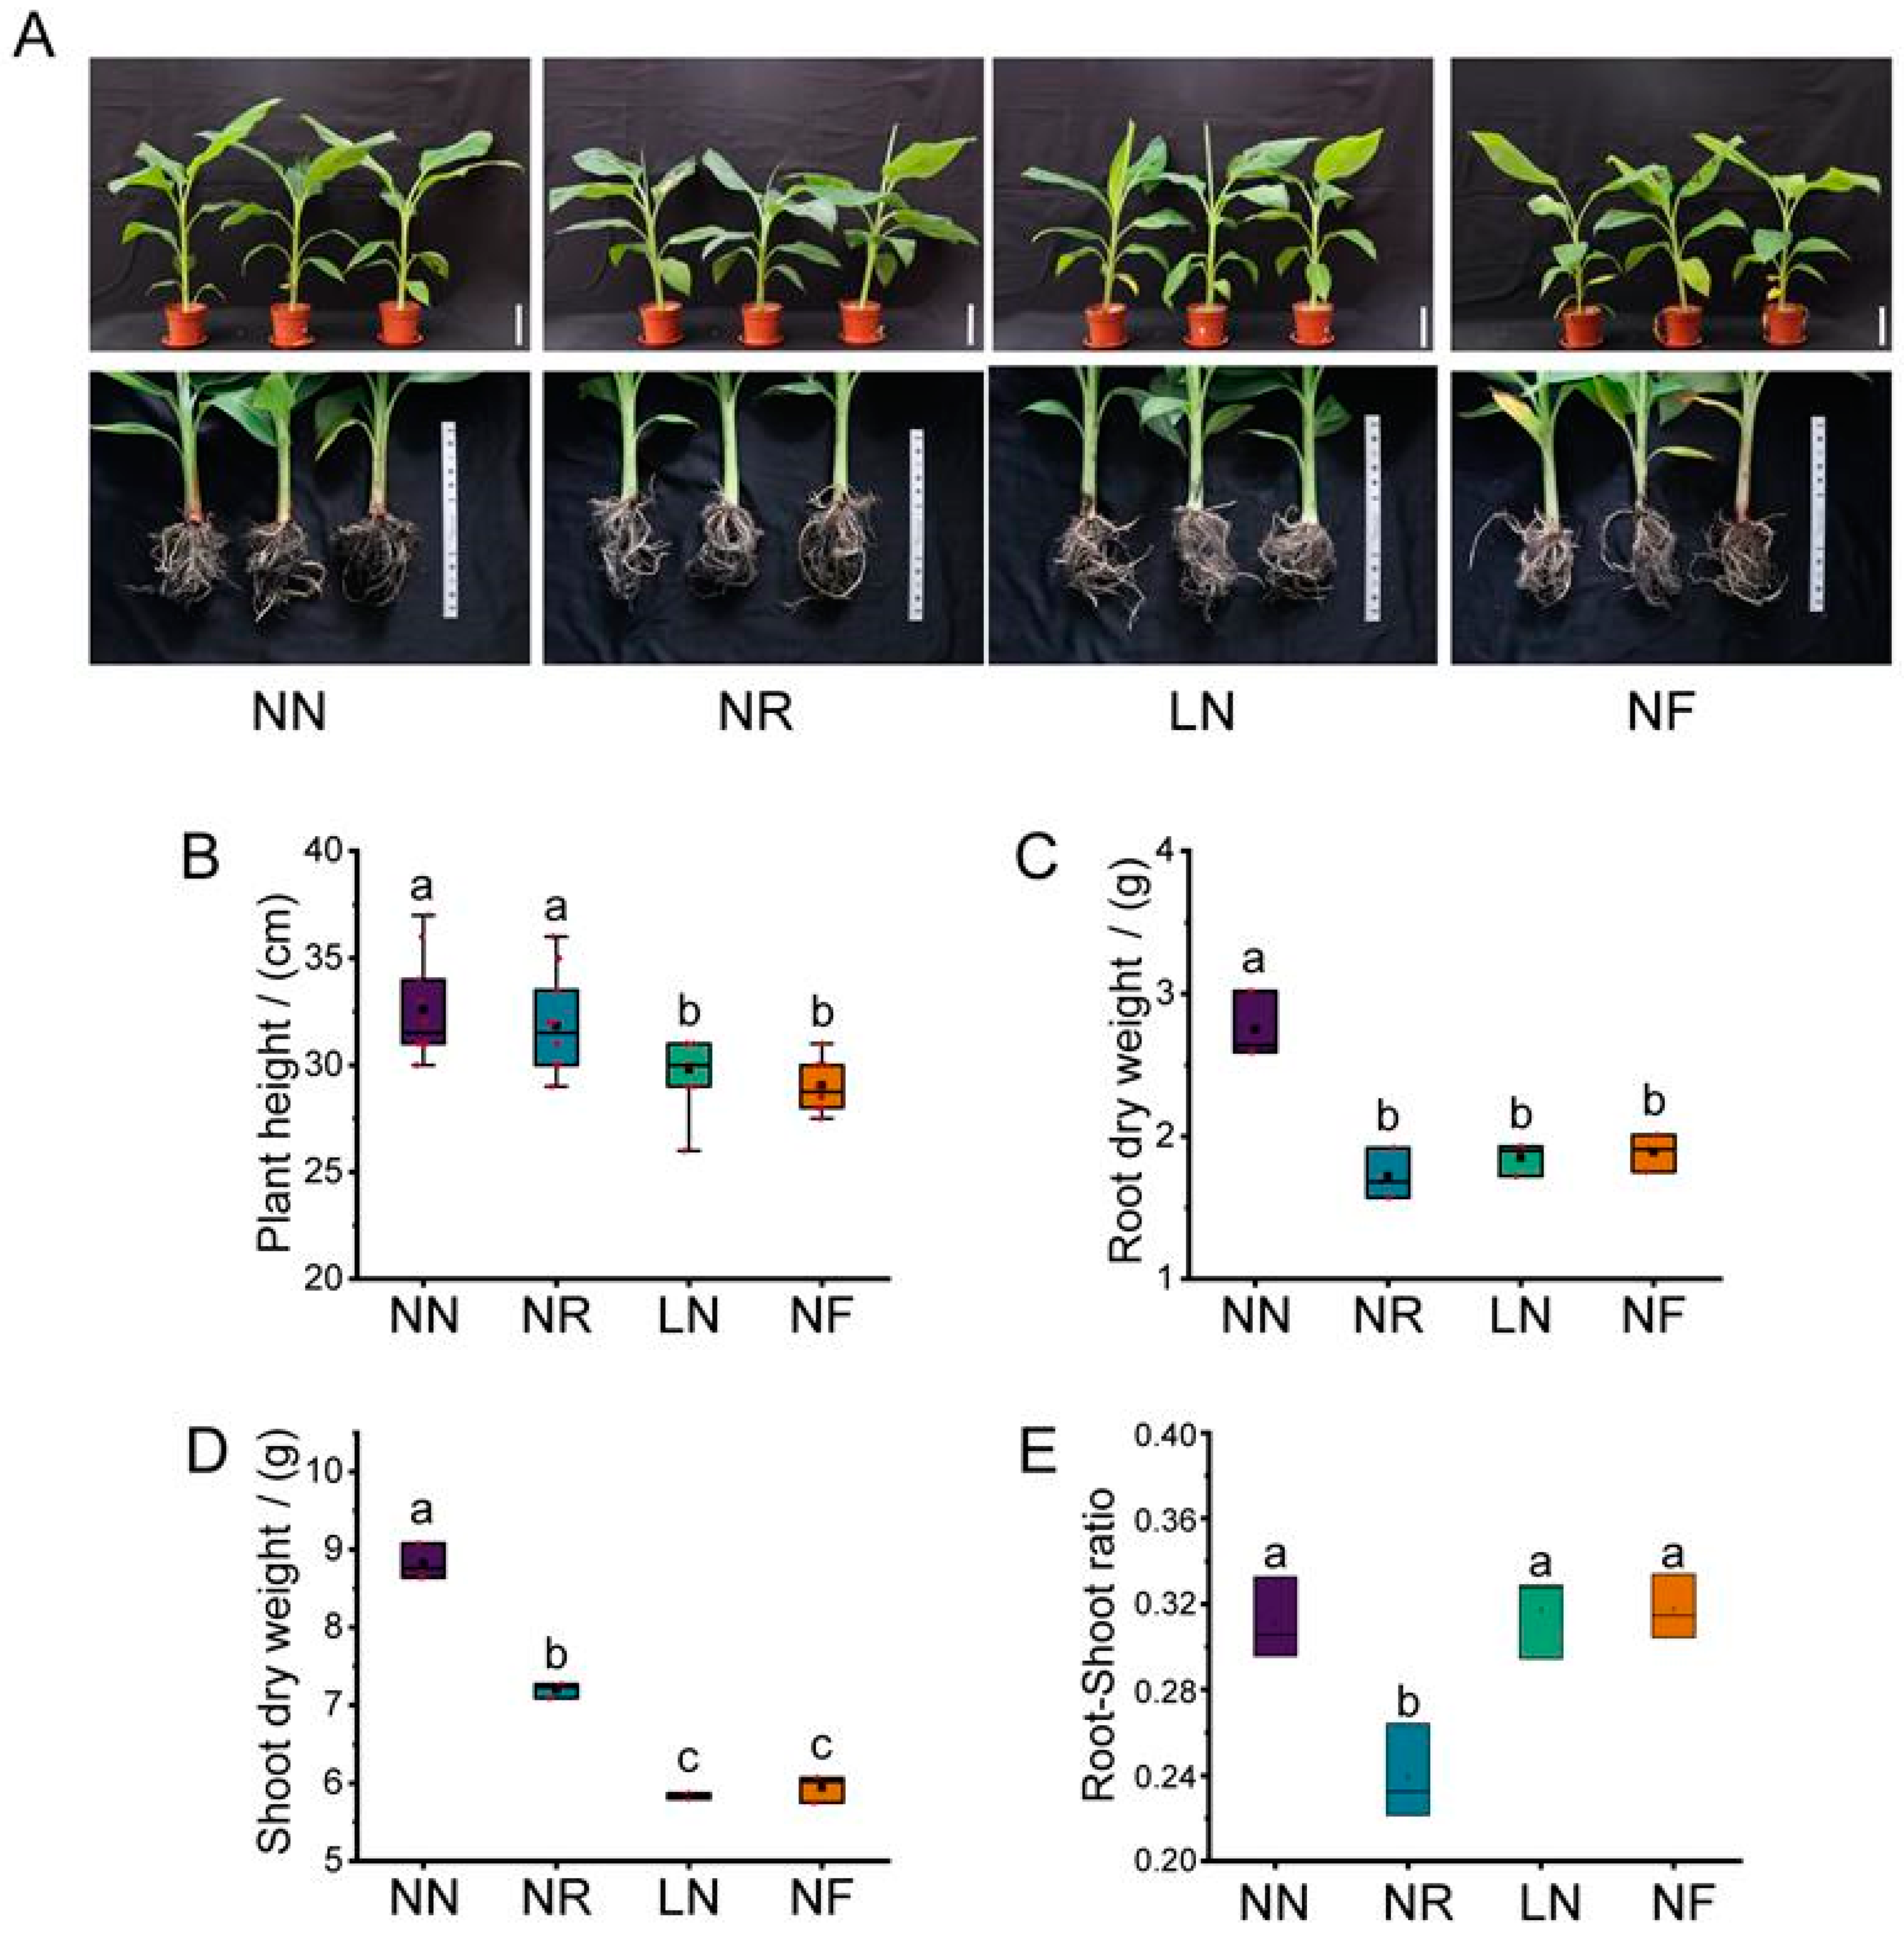
3.1. Effects of Different N Treatments on Plant Height and Dry Weight of Banana Seedlings

To assess the effect of various N treatments on the growth of banana seedlings, plant height and dry weight were determined for aboveground and underground samples. After 28 d, the plant heights of banana seedlings subjected to Low-N (LN) and N-Free (NF) treatments was lower than those in the Normal-N (NN) and Reduced-N (NR) treatments. Specifically, the plant height under LN and NF treatments decreased by 2.5 cm and 3.25 cm, respectively, in comparison with that under the NN treatment. No significant difference was observed in the NR treatment group. This suggests that low N stress significantly inhibited the growth of banana plants (Figure 1A). Both LN and NF treatments had a significant inhibitory effect on the dry matter accumulation of banana seedlings. Specifically, the dry weight decreased by 33.8% (2.99 g) in the LN treatment and 32.6% (2.88 g) in the NF treatment in comparison with that in the NN treatment. Moreover, the dry weight of banana seedlings in the NR, LN, and NF treatments was significantly lower than the normal level, and no significant difference was observed among three treatments (Figure 1B). Additionally, the aboveground part of banana seedlings in the NR, LN, and NF treatments exhibited a significant decrease, while LN and NF treatments show a more pronounced decrease (Figure 1D). Compared with that under the NN treatment, the root-to-shoot ratio of banana seedlings under the NR treatment was significantly reduced (p < 0.05), while there was no significant difference between LN and NF treatments for this ratio (Figure 1E).

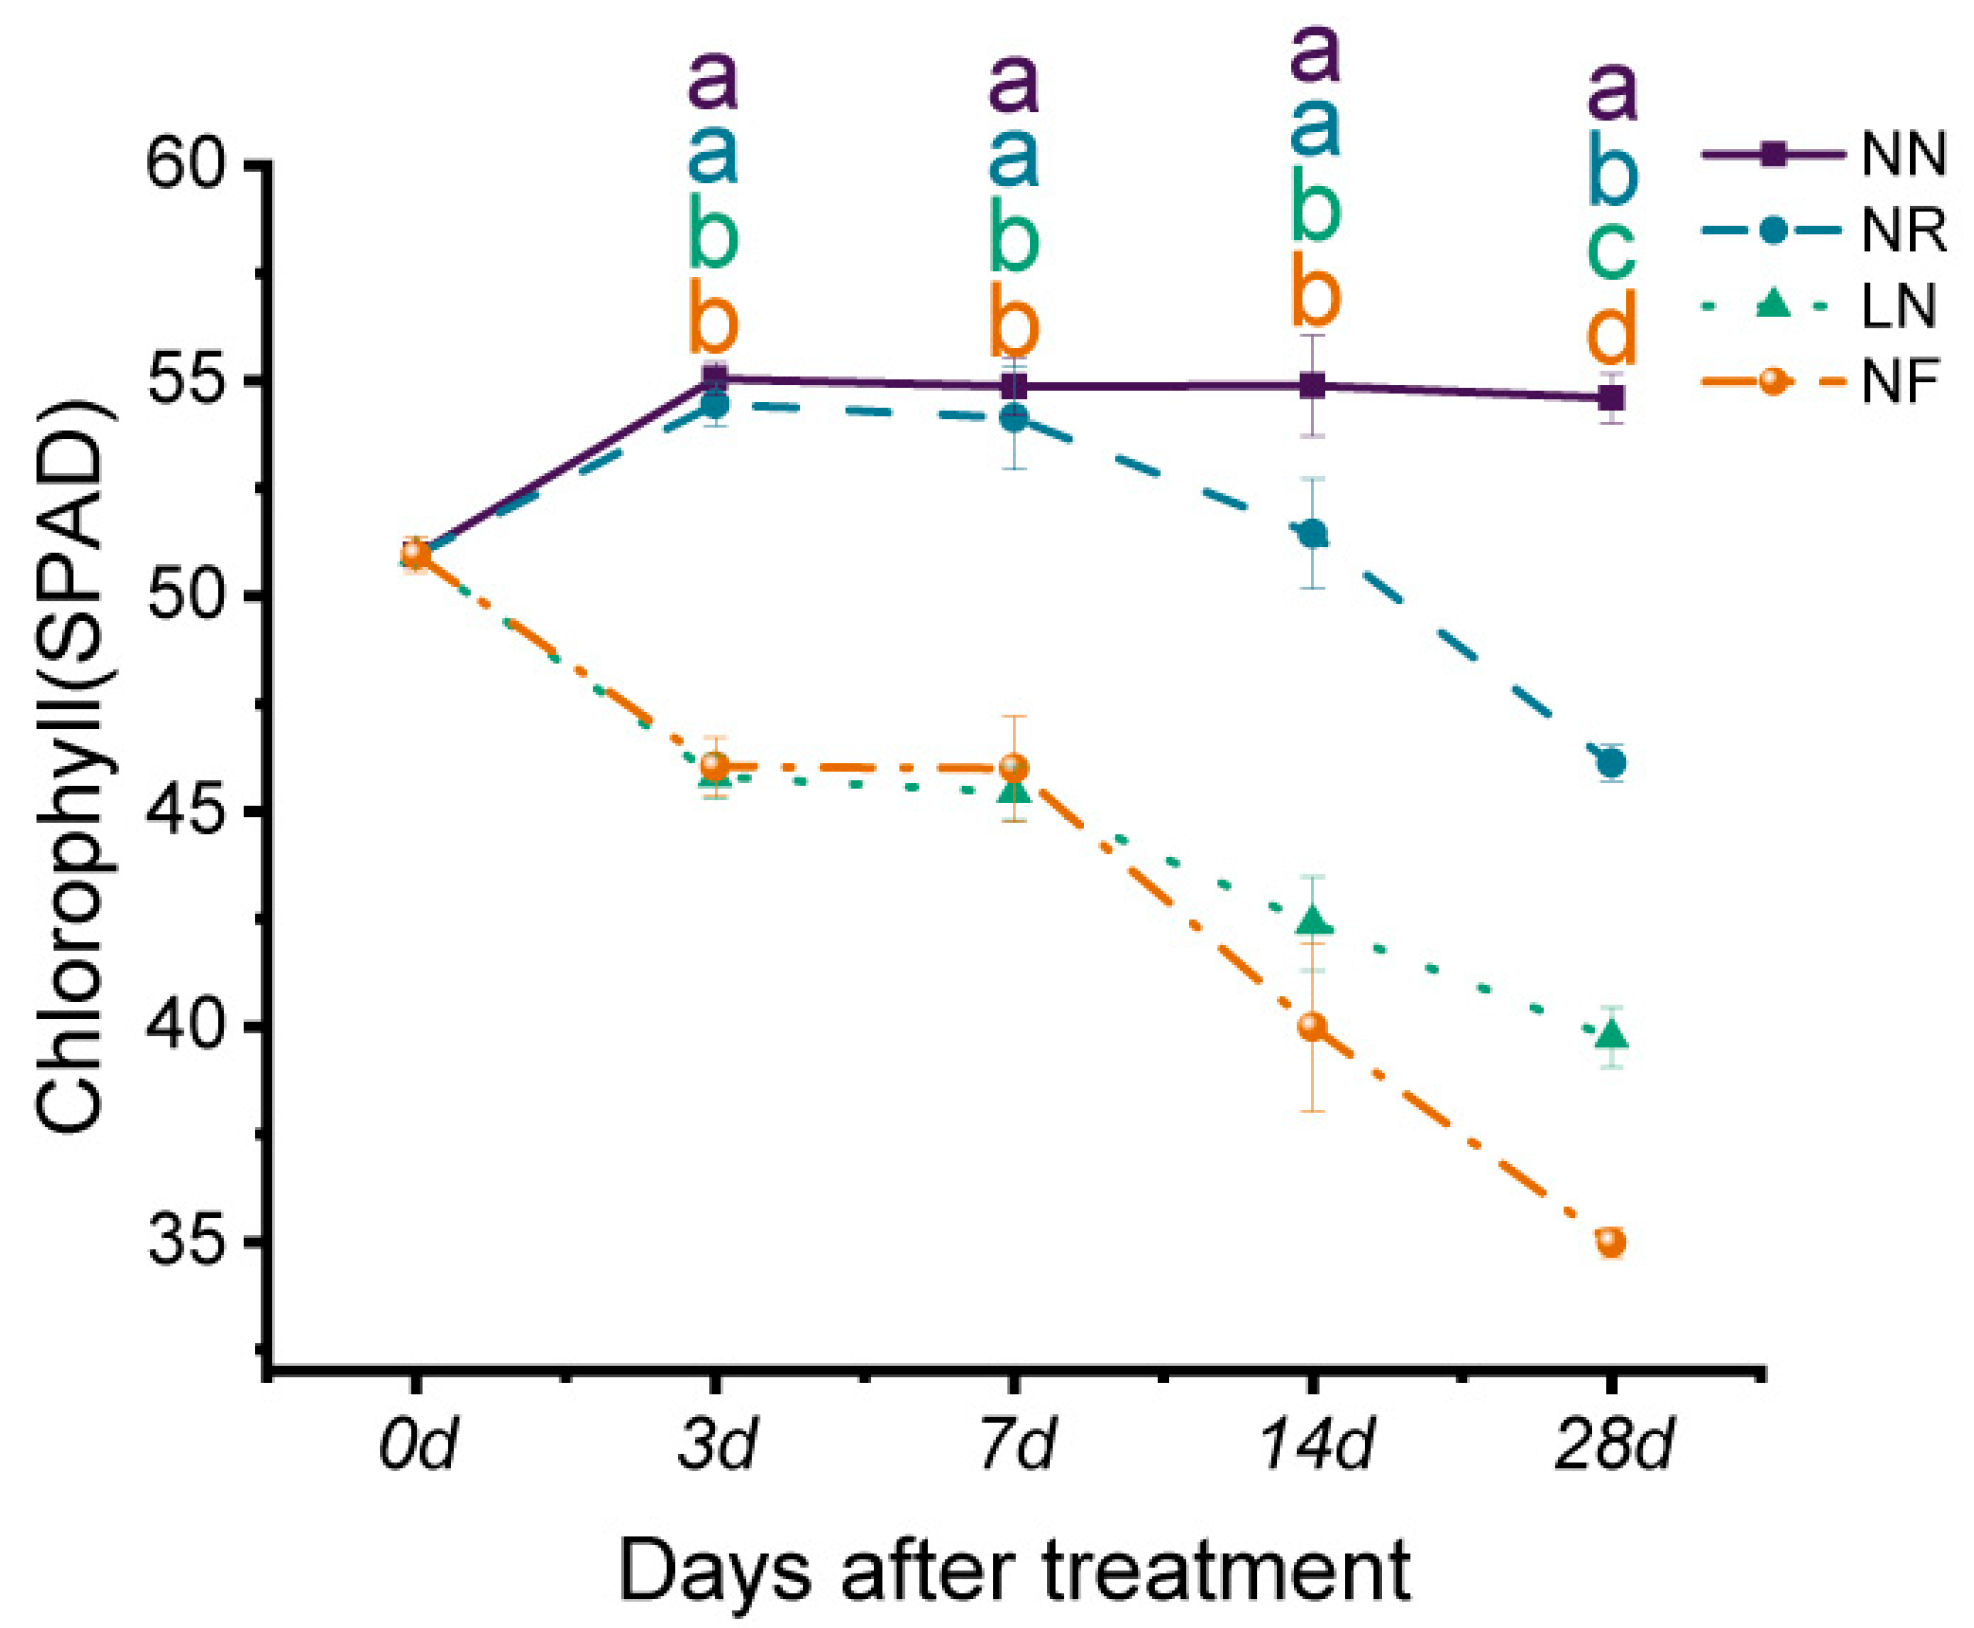
3.2. Effects of Different N Treatments on Chlorophyll Content of Banana Seedlings

The SPAD value is usually used to assess the chlorophyll content in plant leaves, and the relative concentration of chlorophyll is directly related to the nitrogen content of leaves [39]. No obvious differences were observed during the whole growth periods in the NN treatment. The SPAD values of the LN and NF treatments showed a significant decline from the third day, reaching their lowest point on the 28th day. The SPAD value of the NR treatment began to decrease after 7 d. The SPAD values under LN and NF treatments exhibited a statistically significant decrease compared with those under the NN and NR treatments. Specifically, on the 28th day, the SPAD values under the NR, LN, and NF treatments were 15.5%, 30.4%, and 35.9%, respectively (Figure 2).

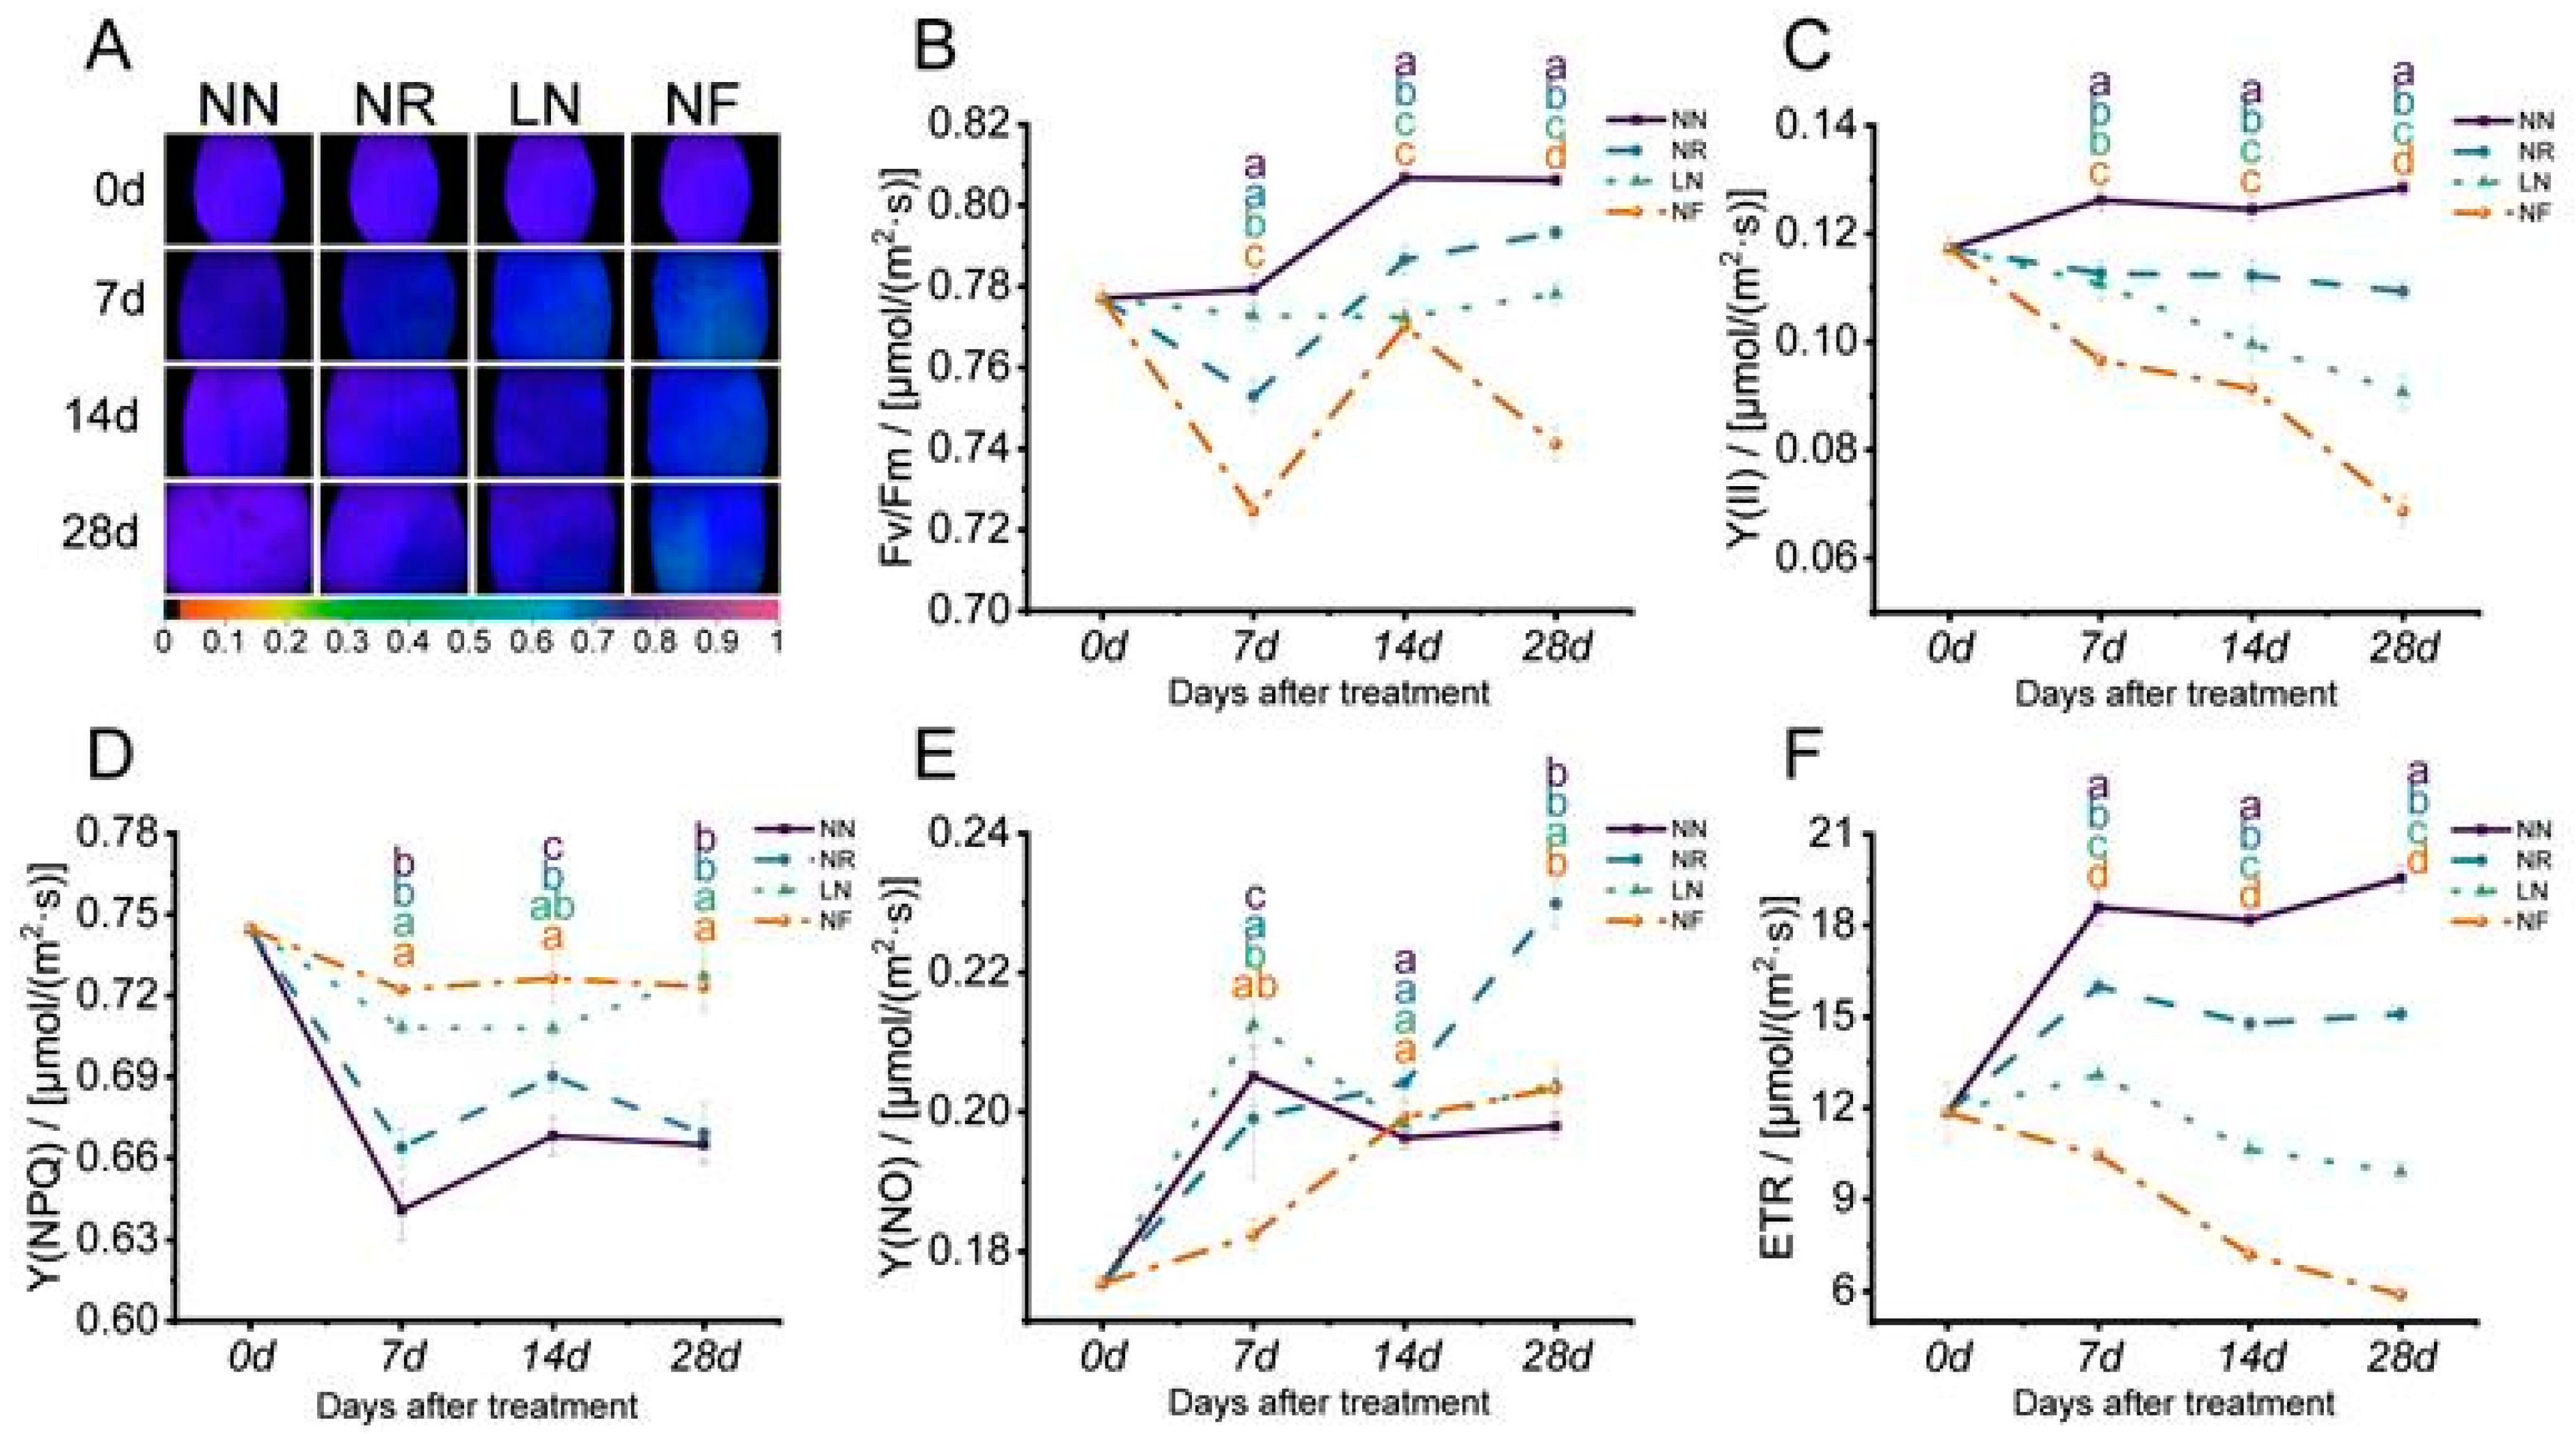
3.3. Different N Treatments’ Effects on Leaf Chlorophyll Fluorescence Parameters

We further evaluated photosynthetic efficiency through the determination of plant chlorophyll fluorescence parameters. The PSⅡ maximum photochemical efficiency (Fv/Fm) is the maximum efficiency at which the light energy absorbed by the photosynthetic center is used in the photochemical reaction, and can effectively reflect the degree of plant stress [40]. In our study, the Fv/Fm value of NN leaves exhibited a gradual increase after 14 days of treatment (Figure 3B). The Fv/Fm values of banana seedlings in the NR, LN, and NF treatments were lower than those under the NN treatment, falling below 0.80. In Figure 3C, Y(Ⅱ) represents the photosynthetic efficiency of PSⅡ. Following the treatment, the Y(Ⅱ) value of NN leaves remained relatively stable at approximately 0.12. Conversely, the Y(Ⅱ) values of NR, LN, and NF leaves showed different degrees of decrease. In contrast, the reduction in N content had a direct correlation with the decrease in the Y(Ⅱ) value observed in banana leaves (Figure 3C). The previous study showed that the relative electron transport rate of Photosystem II (ETR) is a crucial indicator of photosynthetic capacity [41]. Although the alteration pattern of ETR was consistent with that of Y(Ⅱ), the ETR value of banana leaves was pronouncedly decreased (Figure 3F). This suggests that energy loss or a non-photochemical dissipation of light energy was found during the photosynthetic process of banana leaves under low N stress.
Additionally, the quantum yield of the regulatory energy dissipation of PSⅡ (Y(NPQ)) is often used to evaluate the dissipation of excess excitation energy [42]. After 7 d of NF, LN, and NR treatment, the Y(NPQ) values of banana leaves exhibited a statistically significant increase in comparison with those of leaves in the NN treatment. Following a duration of 28 d of treatment, the leaf Y(NPQ) values in the NN and NR treatments remained relatively stable, ranging from 0.65 to 0.70. Conversely, the LN and NF treatment maintained more than 0.70 of Y(NPQ) (Figure 3D). The Y(NO) parameter serves as an indicator of the self-protection mechanism of plants in response to intense light exposure. Specifically, the Y(NO) value of banana seedling leaves subjected to LN treatment was significantly higher level compared with that of those treated with the other three treatments on day 28, as depicted in Figure 3E. In conclusion, under low nitrogen stress, the excitation energy of banana seedlings showed higher activity, indicating that the plants were in the process of adaptation and regulation of light energy use.

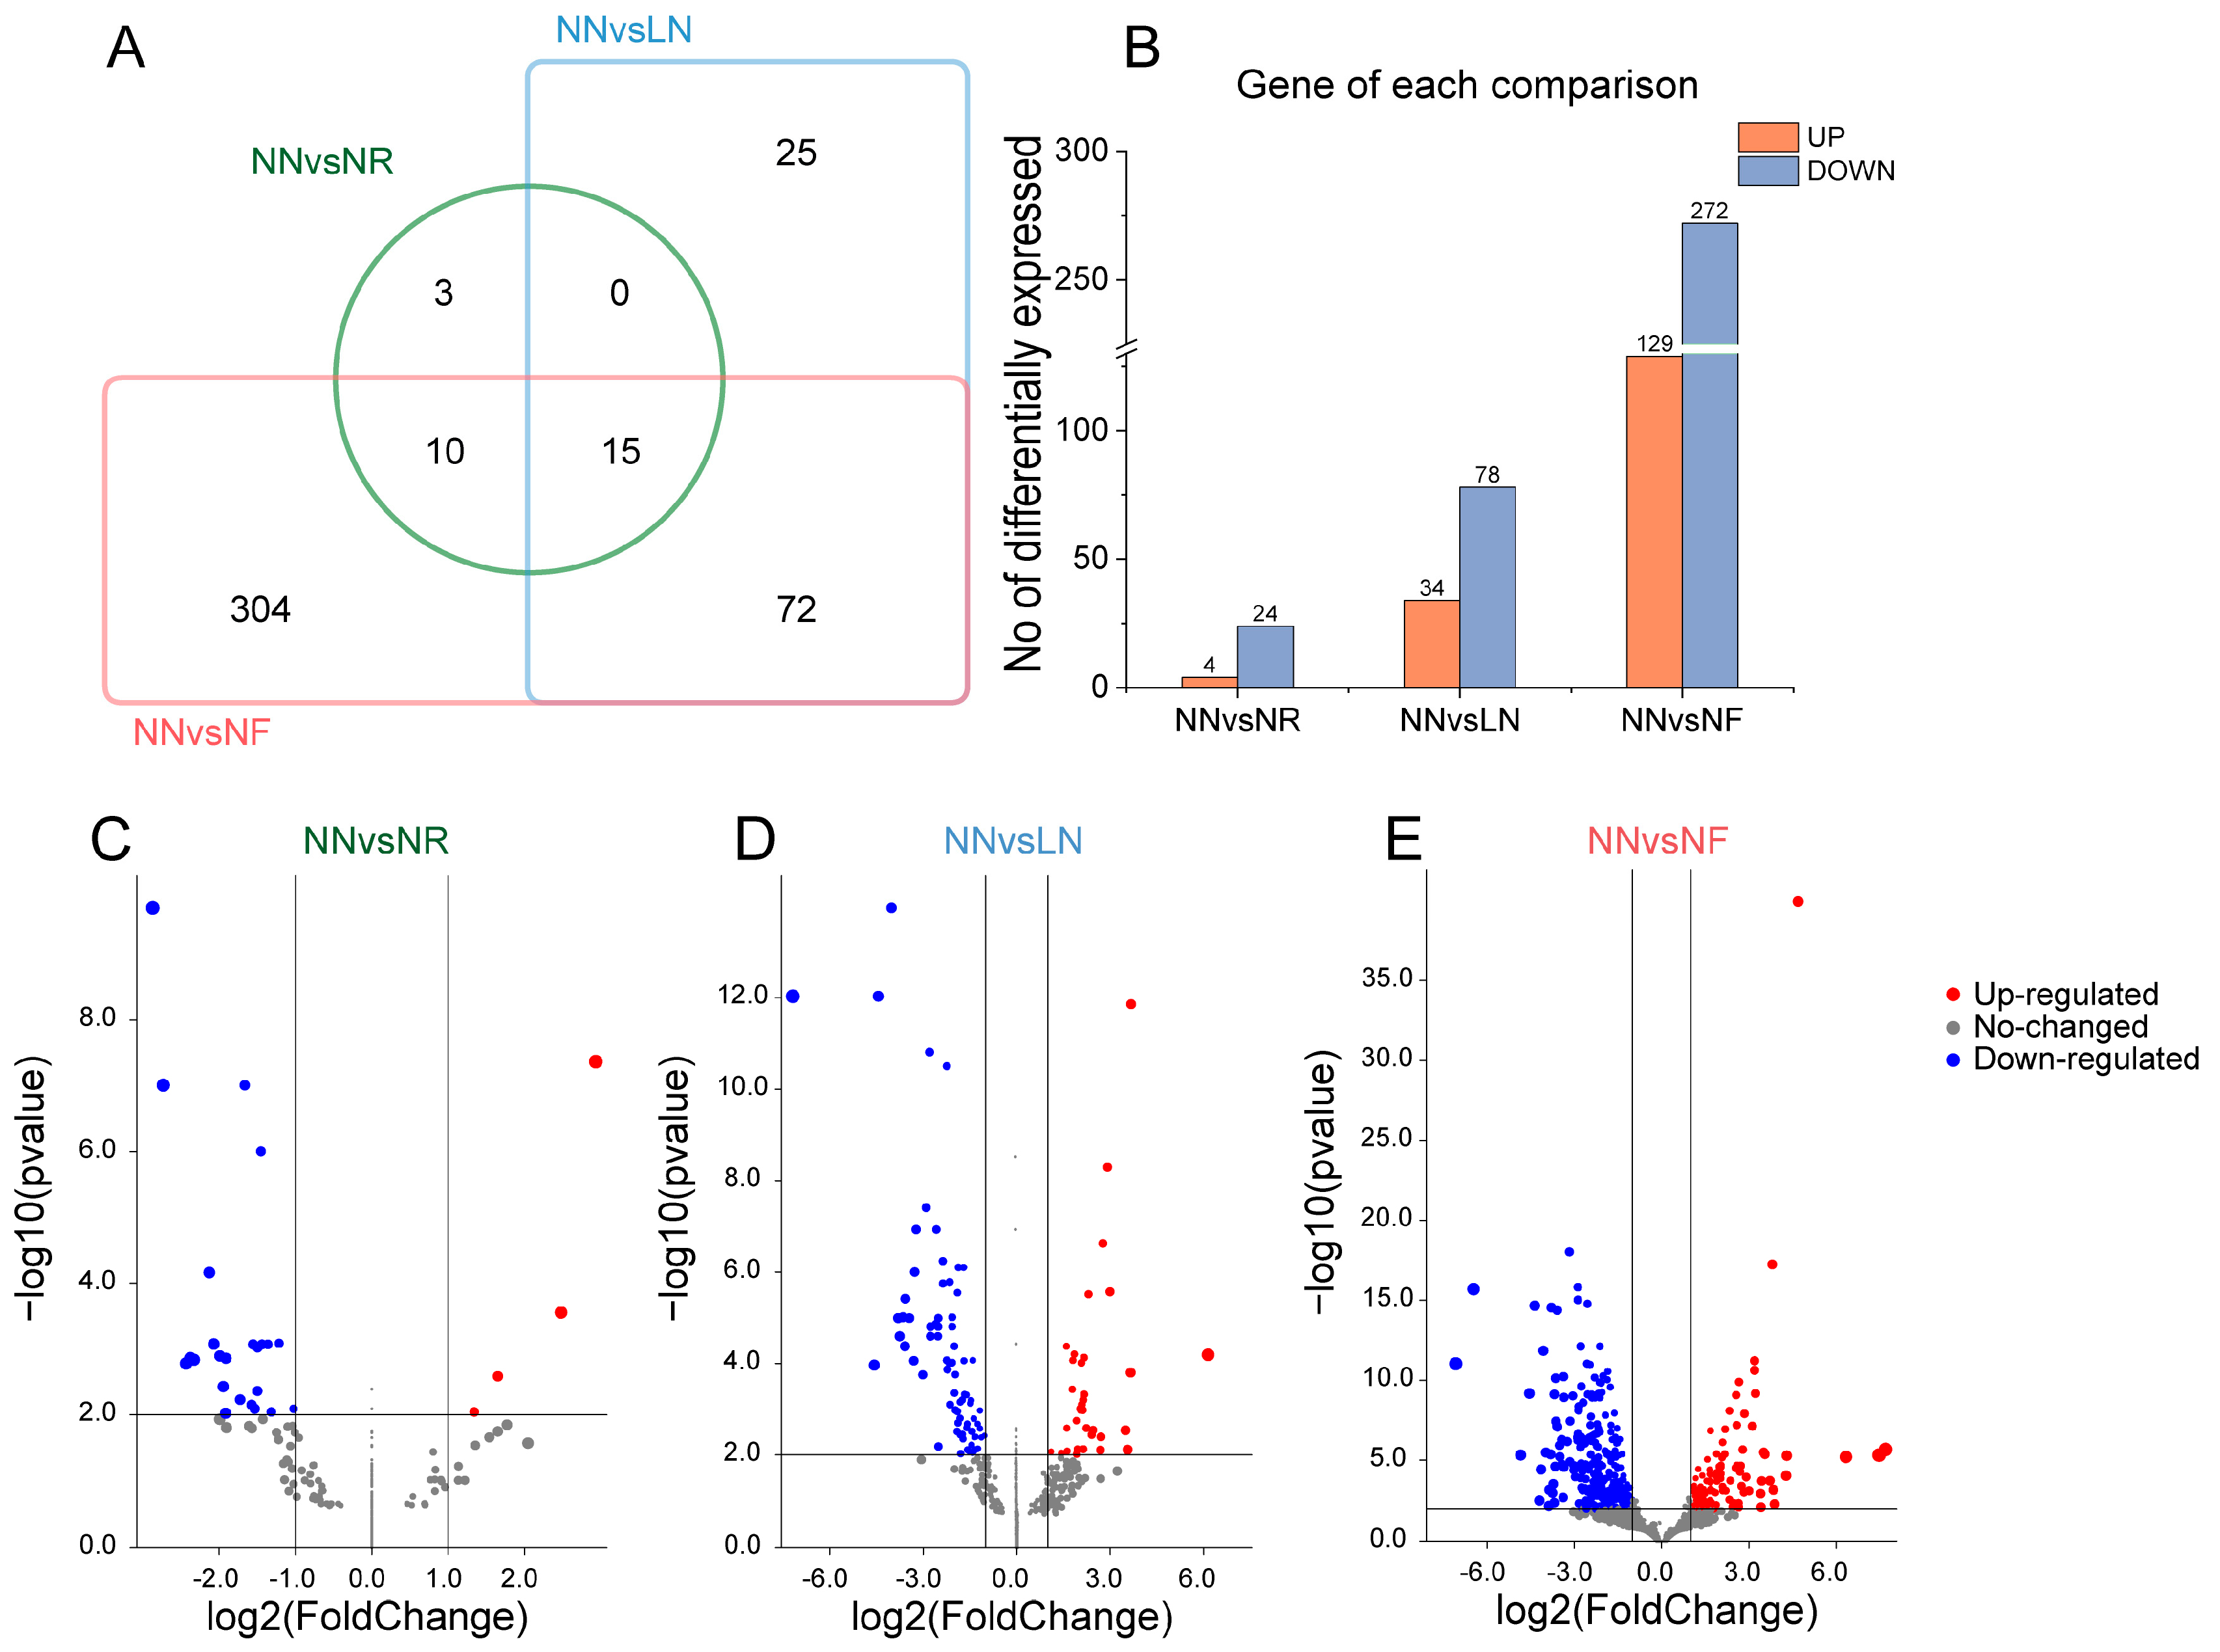
3.4. Screening and Annotation of Differentially Expressed Genes in Banana Roots after Exposure to Low N Stress

In order to identify the crucial genes involved in the response to low N stress, transcriptome analysis was conducted on banana roots after treatment with different N concentrations. DEGs were analyzed using the criteria log2 (FC) ≥ 1 and FDR < 0.01. In total, 541 DEGs were identified. Fifteen DEGs were detected at the intersection of NR vs. NN, LN vs. NN, and NF vs. NN (Figure 4A). Specifically, NR vs. NN analysis showed 28 DEGs, consisting of 4 up-regulated genes and 24 down-regulated genes. LN vs. NN analysis revealed 112 DEGs in banana roots, including 34 up-regulated genes and 78 down-regulated genes. Additionally, NF vs. NN analysis revealed 401 DEGs in the roots, consisting of 129 up-regulated genes and 272 down-regulated genes (Figure 4B). The results depicted in Figure 4C–E demonstrate that a higher degree of nitrogen reduction is associated with a greater number of differentially expressed genes compared with those in the control (NN). The number of down-regulated genes in comparisons, such as NN vs. NR, NN vs. LN, and NN vs. NF, exceeded the number of up-regulated genes. These findings suggest a positive correlation between the extent of nitrogen decline and the abundance of differentially expressed genes, implying the involvement of complex pathways and mechanisms in the response to low nitrogen stress.
GO enrichment analysis was employed to examine the enrichment of DEGs in terms of biological process, cellular component, and molecular function. The set of 112 DEGs obtained from LN vs. NN were involved in light and chemical signal transduction, transport processes, membrane and plasma membrane components, and transport activity, as well as other functions. The 401 DEGs obtained from NF vs. NN showed and enrichment in the cellular composition, response to chemical signals, stress response, secondary metabolism, membrane and plasma membrane components, and transport activity (Figure S1).
The DEGs in the top 20 pathways of LN vs. NN and NF vs. NN contained carbohydrate, lipid, amino acid, cysteine and methionine, starch, and sucrose, as well as other secondary metabolic pathways. Additionally, these genes were found to be involved in protein folding, sorting and degradation processes, membrane transport, cytochrome P450, chaperone and folding catalysis, and transduction and transport processes. DEGs between NF and NN were primarily exhibited in various metabolic processes such as those of enzymes, carbohydrates, amino acids, amino and nucleotide sugars, flavonoids, galactose, tyrosine, N, isoquinoline alkaloids, carotenoids, and phenylpropanoids, as well as other secondary metabolic processes. Additionally, transcription factors, transporters, cytochrome P450, and signal transduction processes were also found to be enriched. Particularly, this enrichment was notable for N metabolism, carbohydrate metabolism, flavonoid metabolism, and transcription factors (Figure S2).

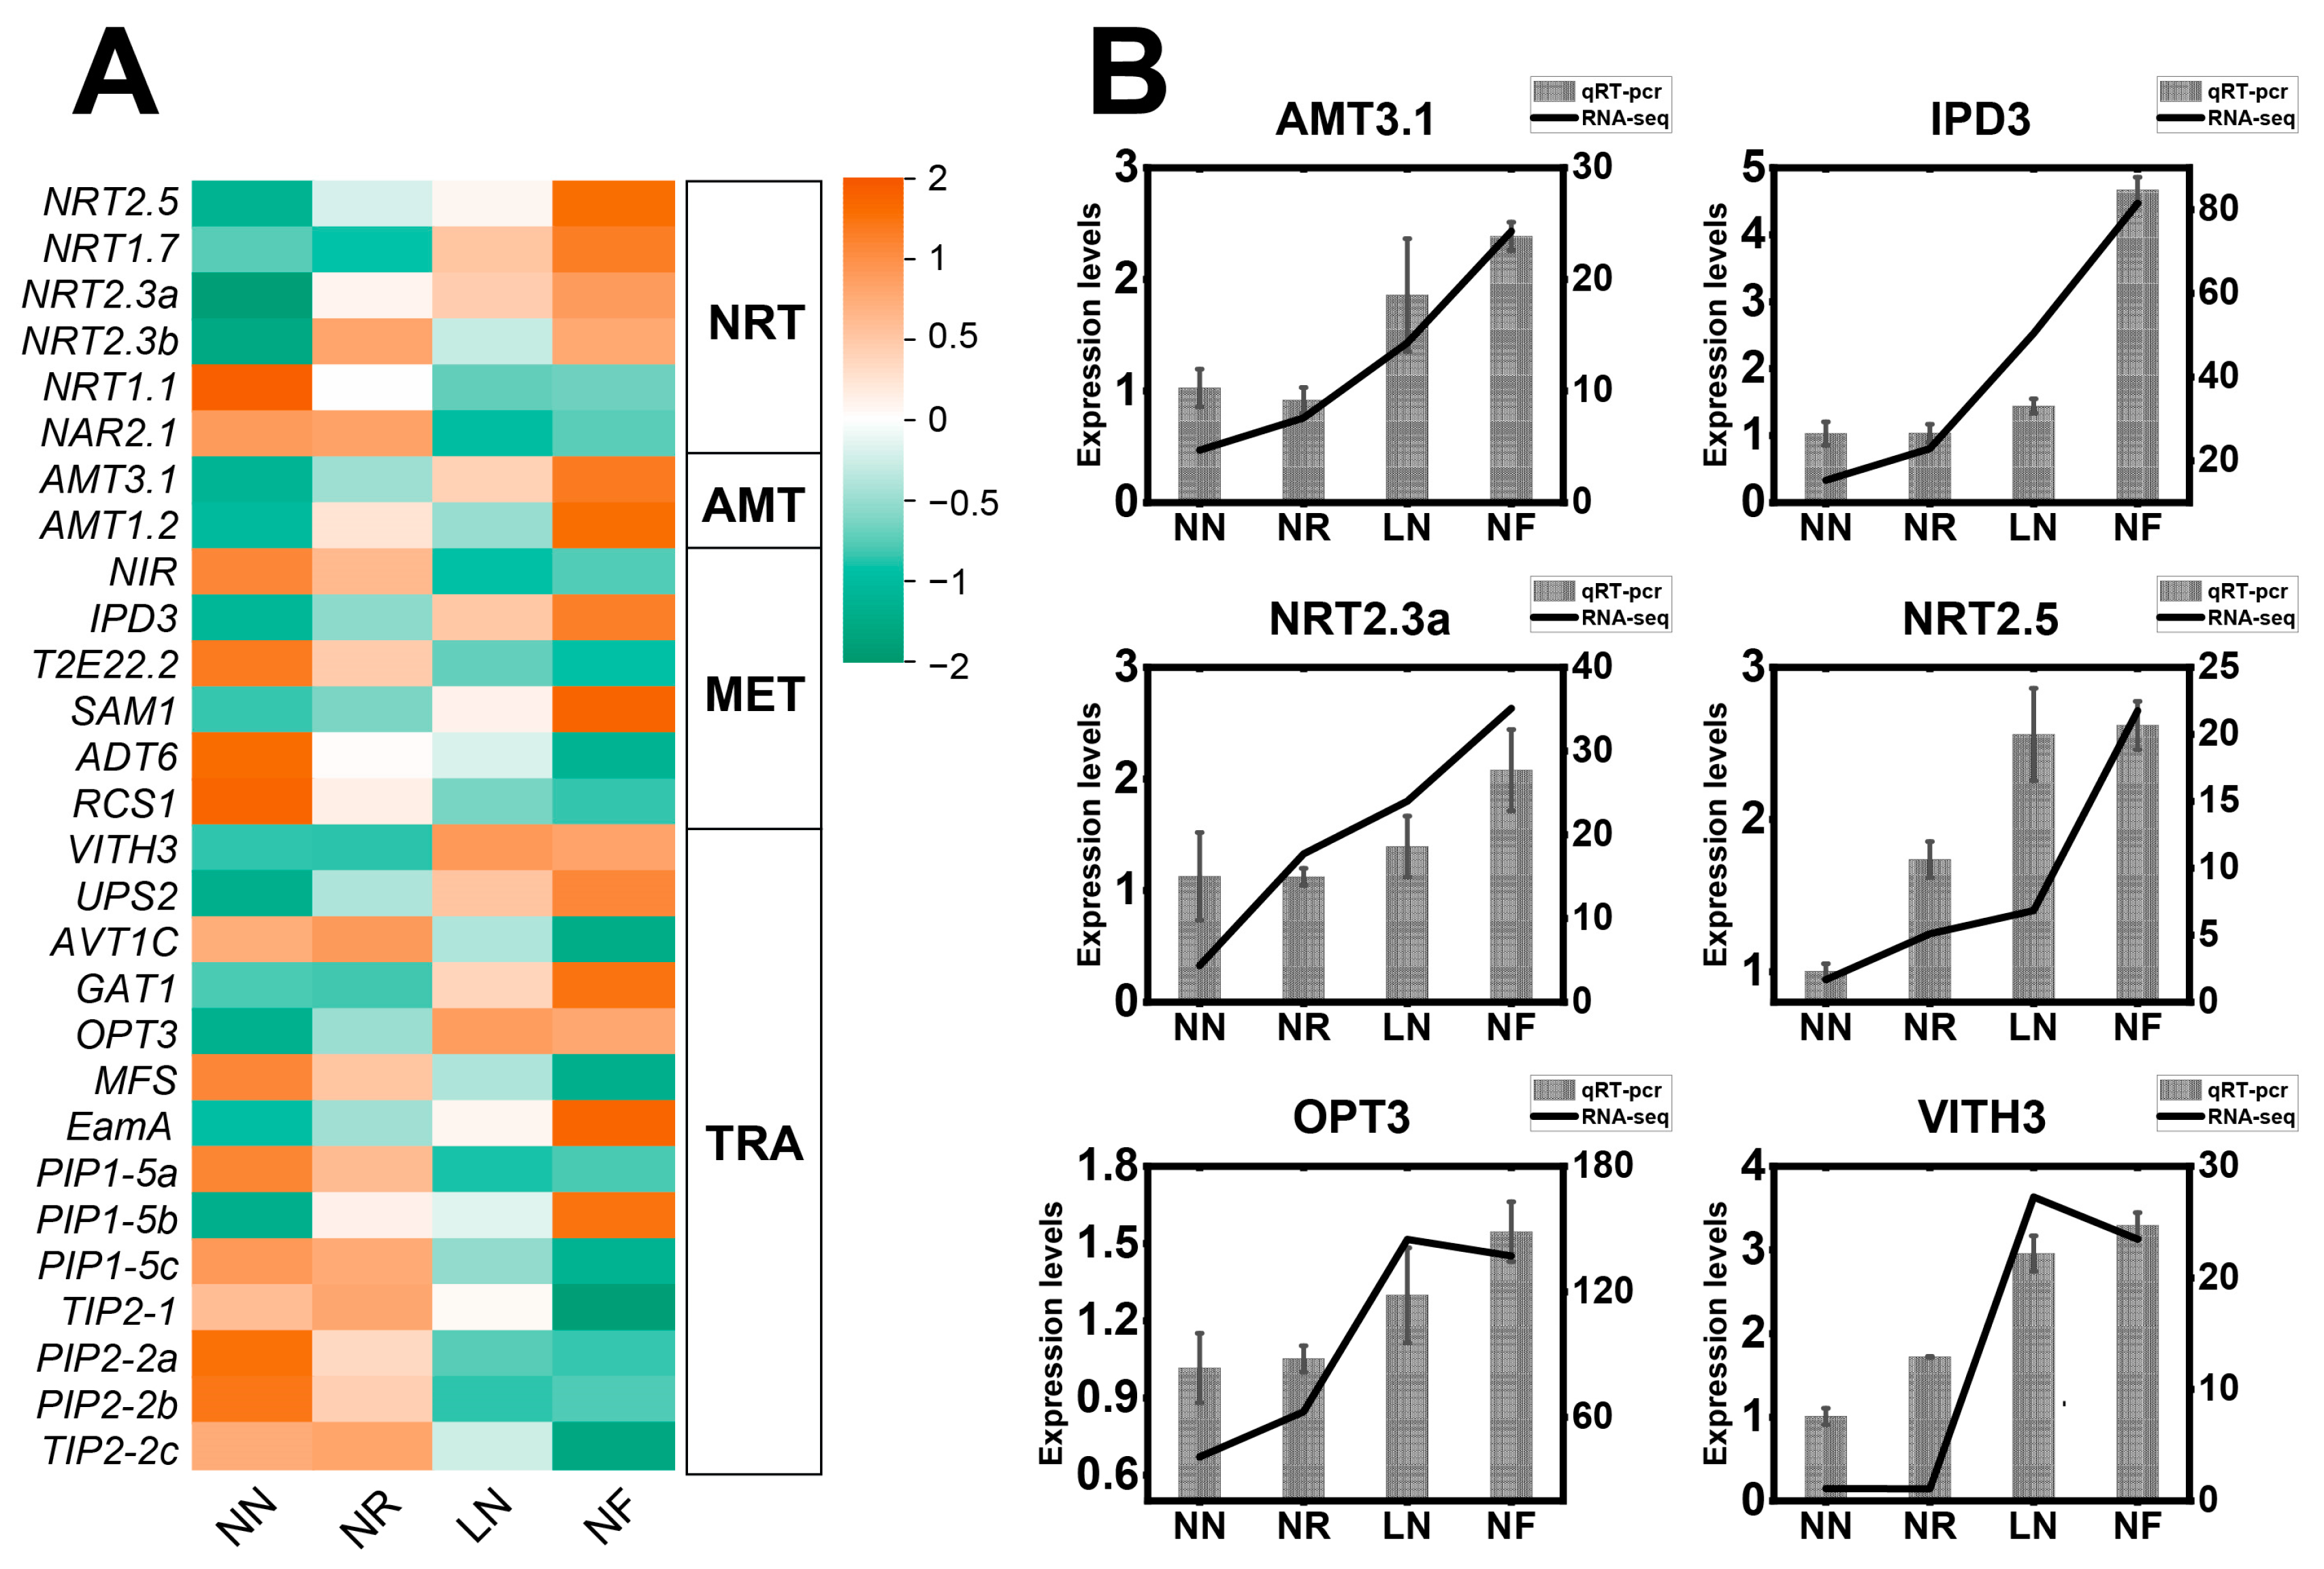
3.5. Expression Characteristics of DEGs Related to N Transport and N Metabolism

A comprehensive analysis of gene expression was conducted to investigate the effects of different N concentrations on N absorption, assimilation, and signal perception. Among the 541 DEGs identified, 28 genes were directly associated with the metabolism processes. These genes clustered into various functional categories, including 6 nitrate transporters, 2 ammonium salt transporters, 6 genes involved in N metabolism and 14 other transporters (Figure 5A). The gene expression and qRT-PCR results indicated that the 28 N-related genes showed notable expression differences. Specifically, the members of the NRT gene family, such as Nitrate transporter protein1.7 (NRT1.7), NRT2.3a, NRT2.3b, and NRT2.5, exhibited significant up-regulation characteristics under low N stress. The expression levels of NRT1.7 and NRT2.5 in NF were approximately 13-fold higher than those under the NN treatment 0at 28 d. AMTs (AMT1.2 and AMT3.1) also exhibited up-regulation in response to low N stress. Furthermore, CYCLOPS (IPD3) related to arbuscular mycorrhizal symbiosis increased 5.3-fold. Additionally, several genes, including S-adenosylmethionine synthetase 1 (SAM1), Vacuolar iron transporter homolog 3 (VITH3), Ureide permease 2 (UPS2), GABA transporter 1 (GAT1), Oligopeptide transporter 3 (OPT3), EamA-like transporter family (EamA), and Probable aquaporin PIP1-5b (PIP1-5b), were also up-regulated (Figure 5A). The findings from qRT-PCR analysis revealed a significant increase in the expression levels of NRT2.3a, NRT2.5, AMT3.1, IPD3, OPT3, and VITH3 genes in response to decreasing nitrogen concentrations over a 28 day treatment period. The result were consistent with the broader trends observed in the transcriptome analysis, suggesting the reliability of the gene expression data. Overall, this study indicates that the up-regulation of DEGs is closely linked to nitrogen uptake, transport, and metabolism processes, which play a crucial role in meeting the nitrogen requirements of banana plants under low nitrogen conditions.

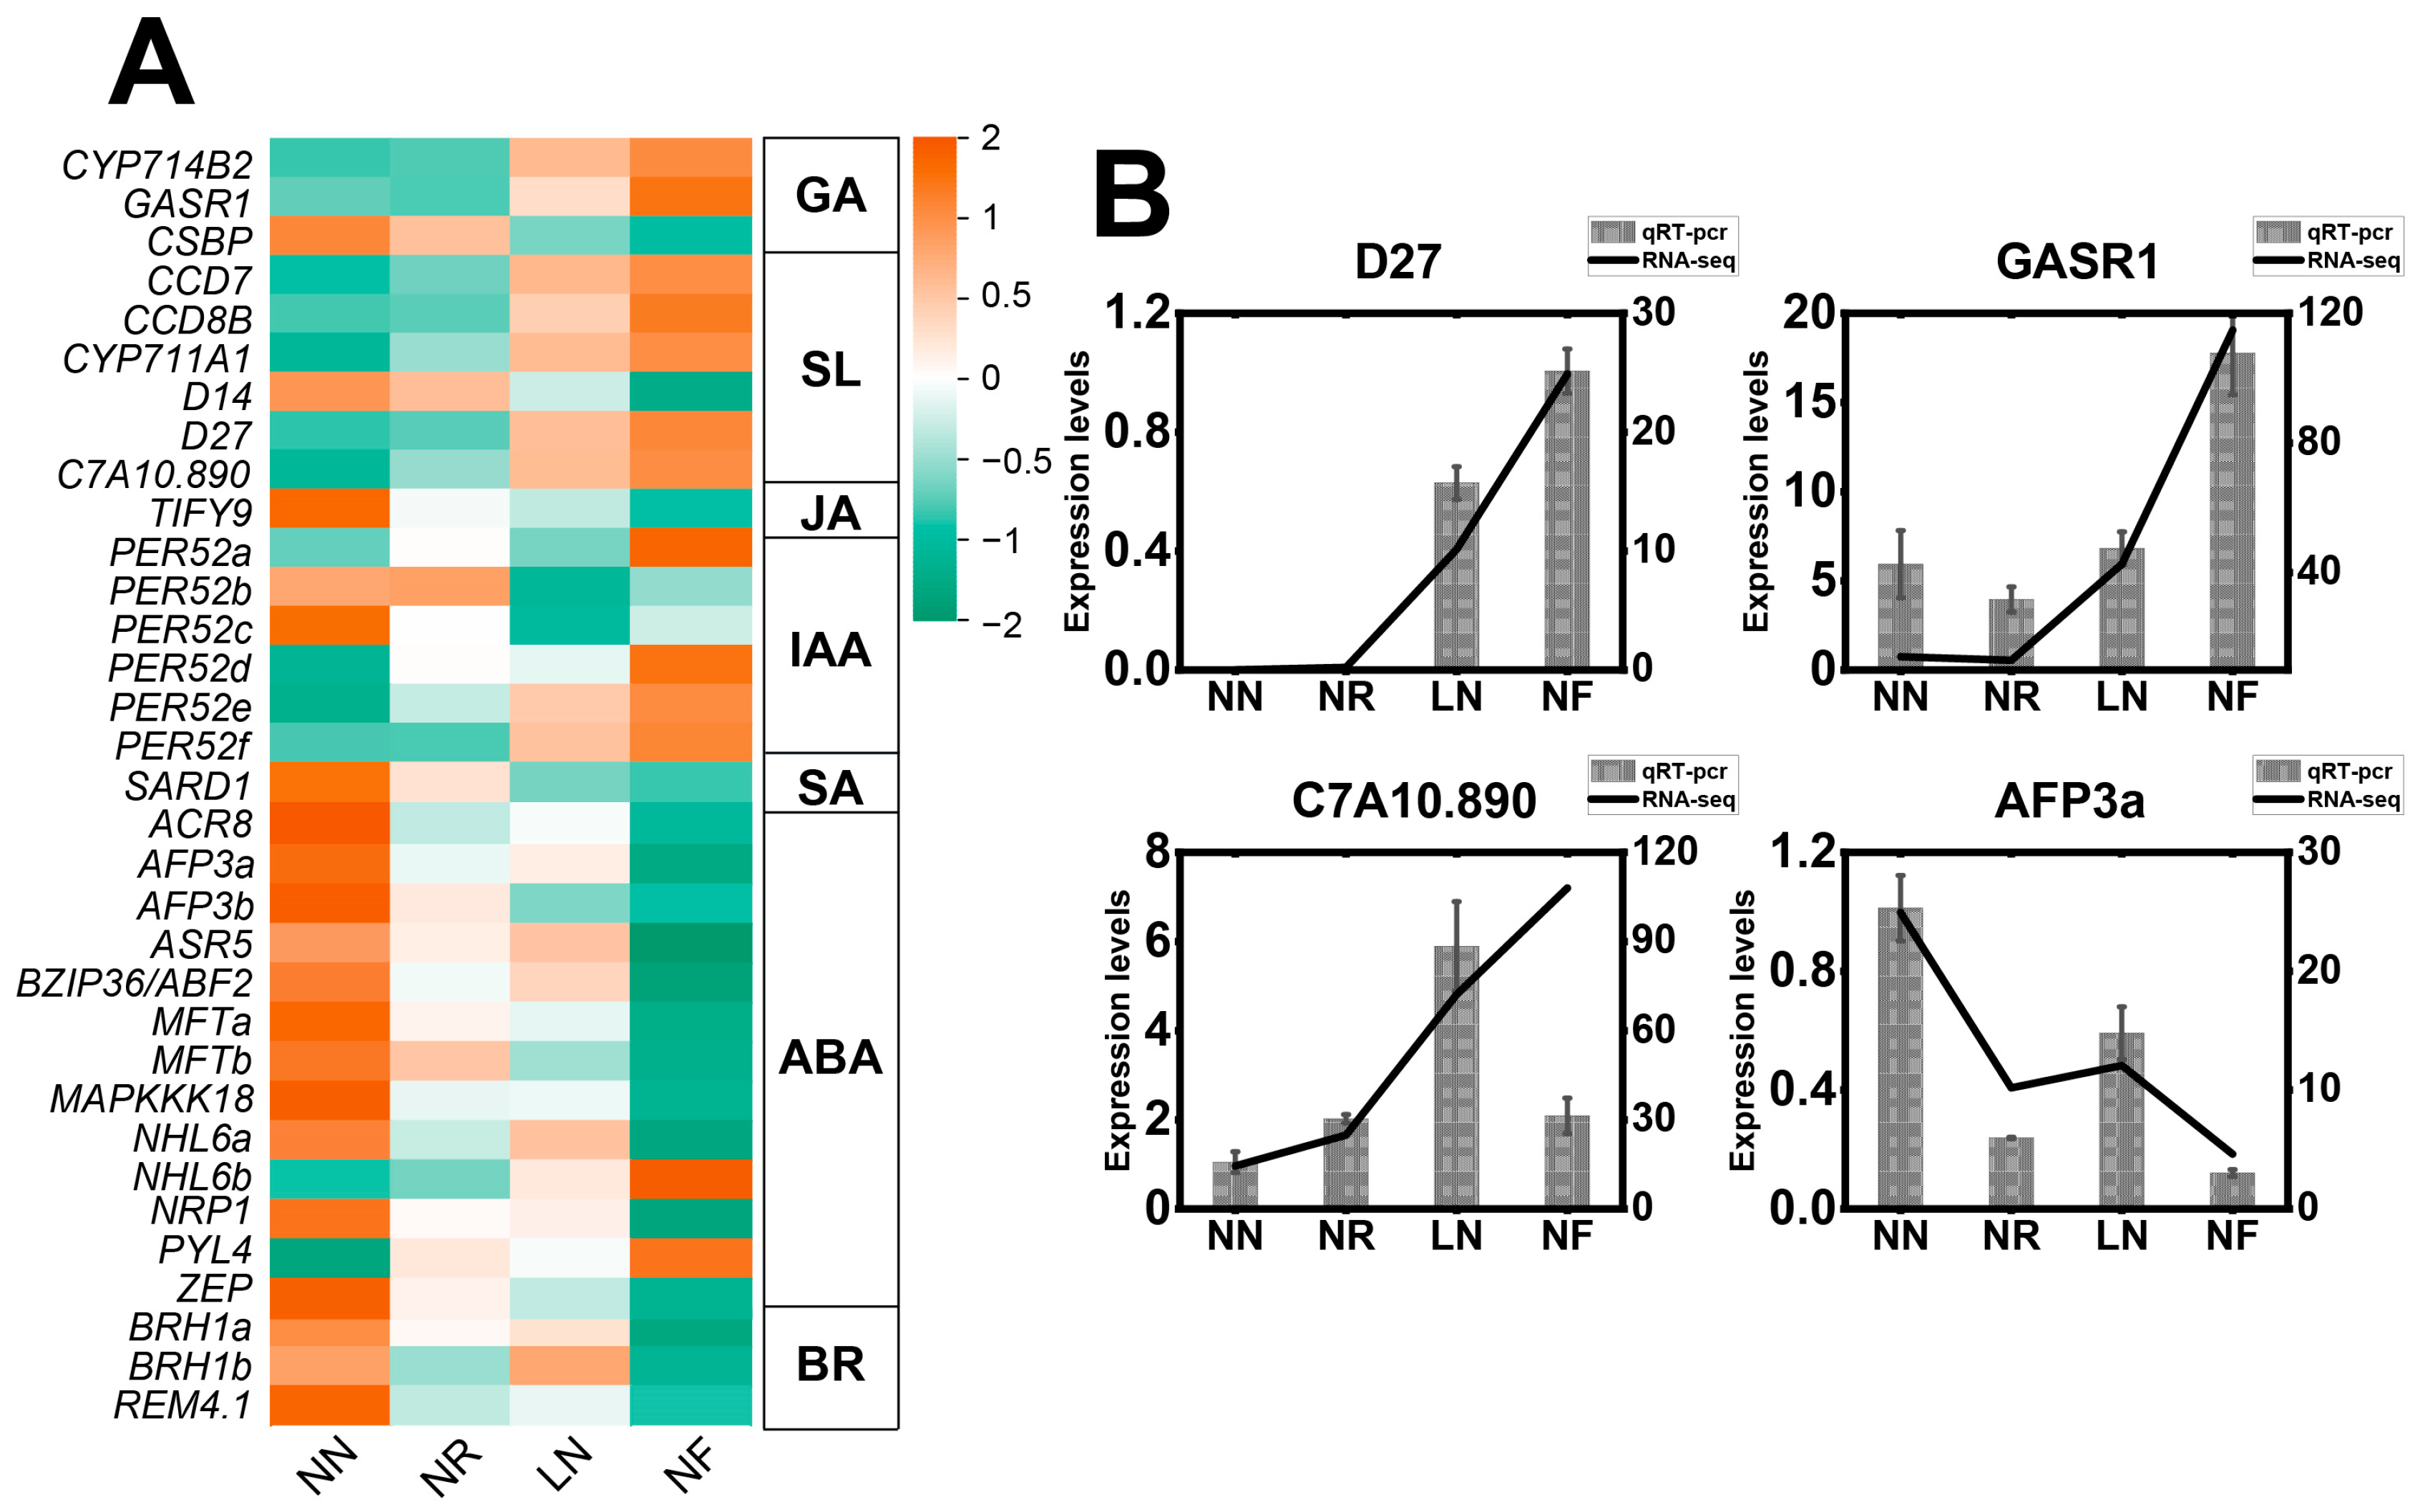
3.6. Expression Characteristics of DEGs Related to Phytohormones

Additionally, a comprehensive examination revealed the identification of 33 genes associated with plant hormones, involving GA, SL, JA, IAA, SA, ABA, BR, and other metabolic pathways (Figure 6). Under low-N conditions, the expression levels of five genes encoding proteins that respond to SL (specifically, Carotenoid cleavage dioxygenase 7 (CCD7), Carotenoid cleavage dioxygenase 8B (CCD8B), Cytochrome P450 711A1 (CYP711A1), Beta-carotene isomerase D27 (D27), and AT4g36470 (C7A10.890)) were significantly up-regulated. Gene D27 had a low expression level in the NN treatment, but a rapid increase in expression in both LN and NF treatments. Among the three genes involved in the GA pathway, Cytochrome P450 714B2 (CYP714B2) and Gibberellin stimulated transcript related protein 1 (GASR1) were significantly up-regulated, whereas Phytohormone-binding protein CSBP (CSBP) showed significant down-regulation. Furthermore, low N stress resulted in the significant up-regulation of IAA-related genes, including Peroxidase 52a (PER52a), PER52d, PER52e, and PER52f, as well as ABA-related genes such as NDR1/HIN1-like protein 6 (NHL6b) and Abscisic acid receptor PYL4 (PYL4). However, Protein TIFY 9 (TIFY9) (JA), Protein SAR DEFICIENT 1 (SAED1) (SA), Brassinosteroid-responsive RING protein 1a (BRH1a), BRH1b, and Remorin 4.1 (REM4.1) (BR) were significantly down-regulated (Figure 6A). The findings from qRT-PCR analysis confirmed an increase in the expressions of D27 and GASR1 in response to decreasing nitrogen concentrations after 28 days of treatment (Figure 6B). Conversely, the qRT-PCR results for C7A10.890 exhibited slight discrepancies compared with the transcriptome data, suggesting the potential involvement of these genes in the morphological adaptation of banana roots to nitrogen deficiency.

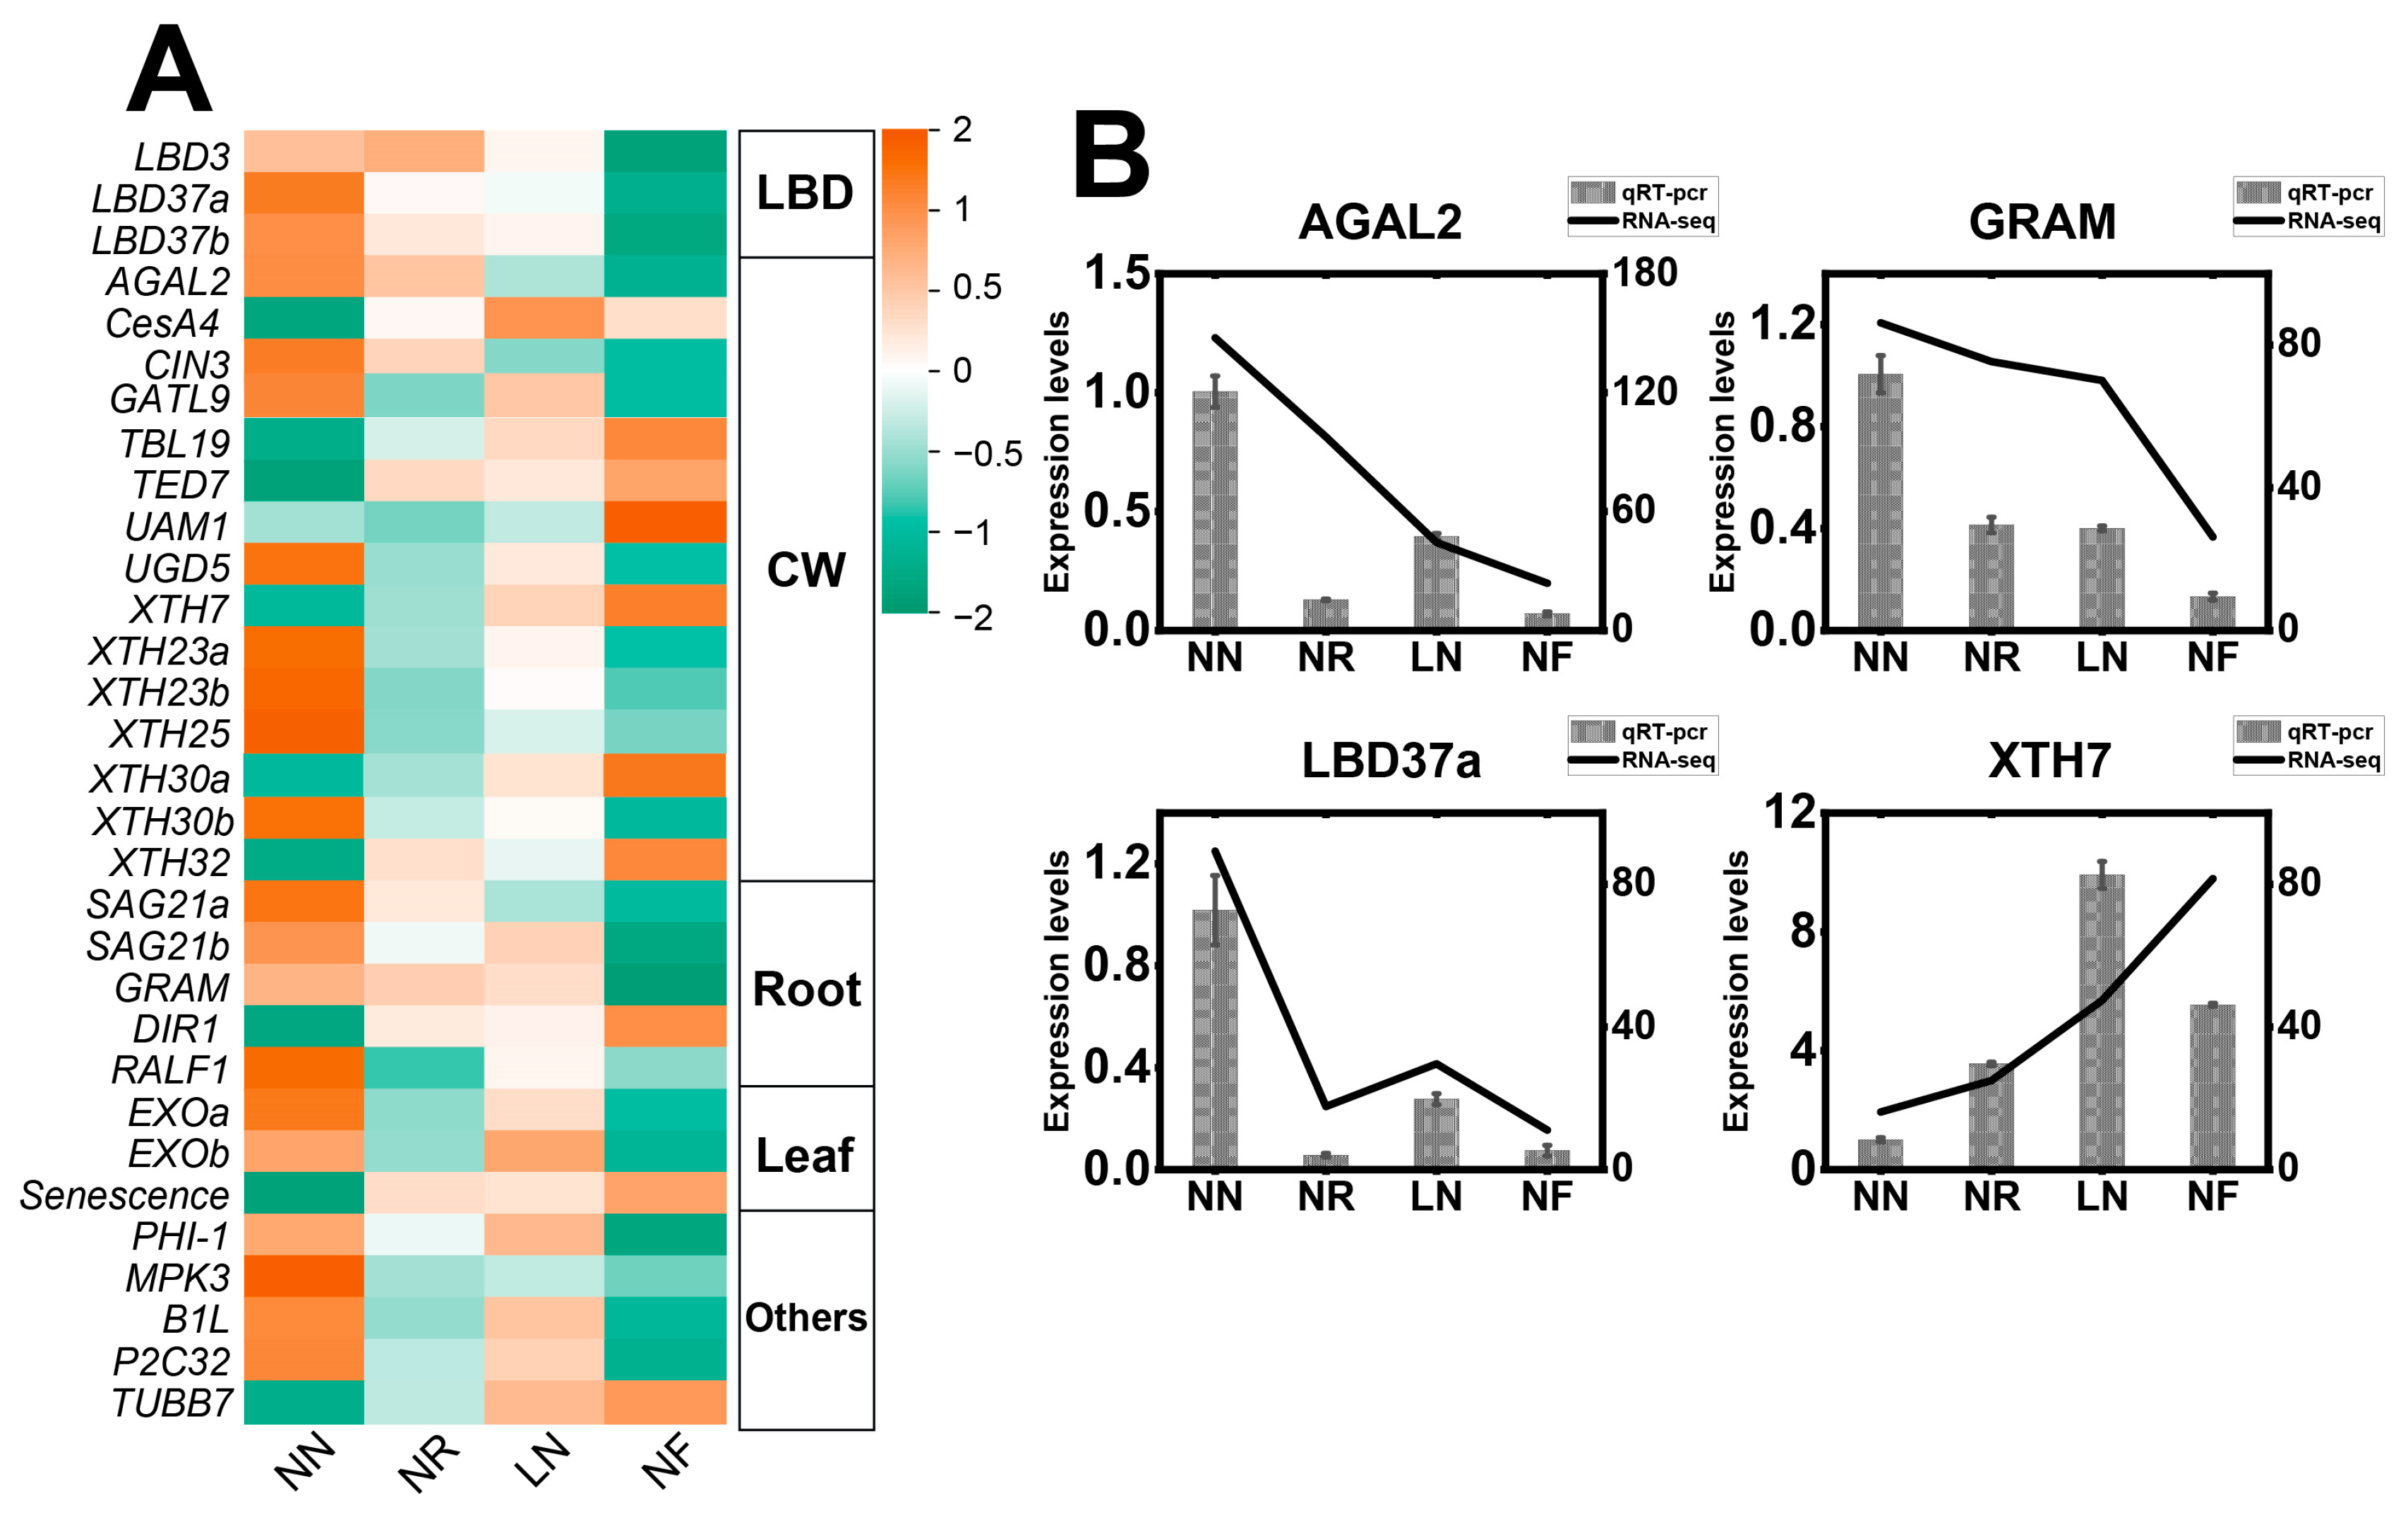
3.7. Analysis of Expression Characteristics of Plant Growth-Related Genes

In the presence of inadequate N availability, plants will modulate the growth status of their roots and leaves in order to acclimate to the N supply alteration. Root absorption serves as the primary mechanism for plants to acquire nutrients. Root absorption surface area directly influenced the rate of nutrient uptake by plants. From the identified DEGs, in total, 31 genes associated with plant growth were found, including 10 up-regulated genes and 21 down-regulated genes. The findings indicated a significant up-regulation of Cellulose synthase A catalytic subunit 4 (CesA4), Protein trichome birefringence-like 19 (TBL19), Protein TRACHEARY ELEMENT DIFFERENTIATION-RELATED 7A (TED7), UDP- arabinopyranose mutase 1 (UAM1), and xyloglucan endotransglucosylase/hydrolase (XTH) (specifically XTH7, XTH30a, and XTH32), as well as other cell wall synthesis-related genes under low N stress. Lateral-boundary-domain (LBD) proteins play a crucial role in the control of plant lateral organ primordium initiation and subsequent lateral organ development. In our study, three identified LBDs were significantly down-regulated in response to low N stress. The lipid transfer protein DIR1 (DIR1), the Tubulin beta-7 chain (TUBB7), and leaf senescence genes were induced by low N treatment. Conversely, Protein EXORDIUMa (EXOa) and EXOb, responsible for inducing leaf growth, showed a significant reduction (Figure 7). Moreover, the results of qRT-PCR experiments on DEGs such as AGAL2, GRAM, LBD37a, and XTH7 were in agreement with those from the transcriptome, indicating the reliability of the findings (Figure 7B). Hence, banana seedlings exhibited an adaptive reaction to nitrogen deficiency via the up-regulation of genes related to cell wall synthesis and modifications to control root elongation and leaf growth.

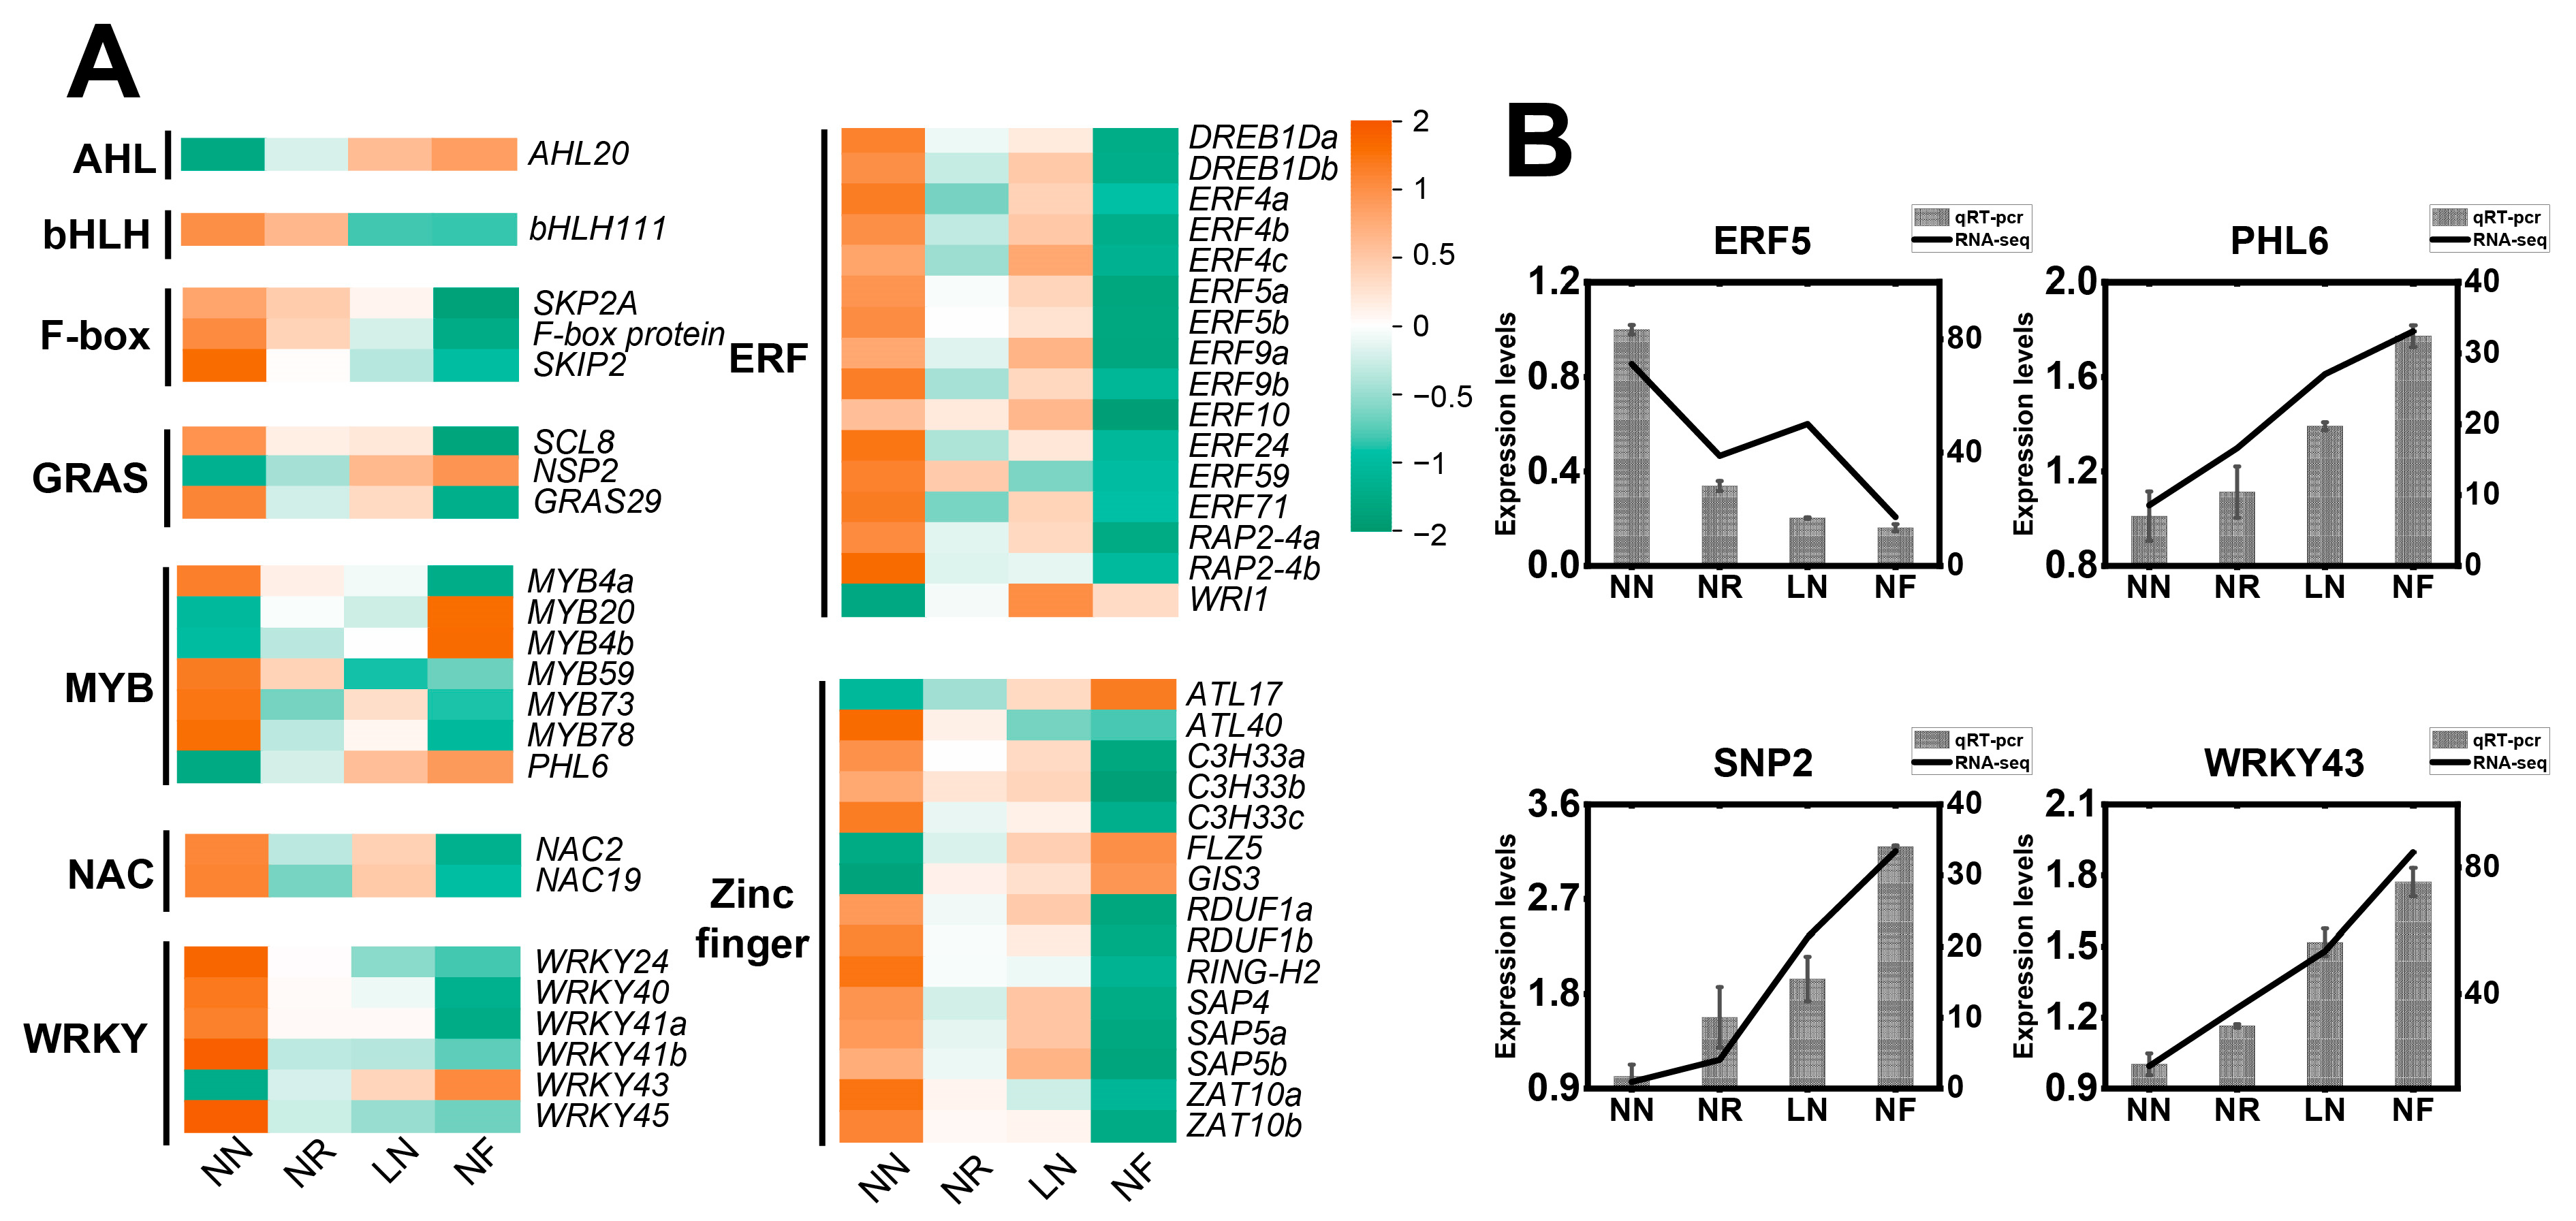
3.8. Expression Characteristics of Transcription Factors Involved in Low N Stress

Transcription factors play a crucial role in the regulation of gene expression within various signaling pathways, thereby influencing N absorption, N transport, and overall plant growth. A comprehensive analysis identified 54 transcription factors in total, classified into 9 distinct families, namely AHL, bHLH, ERF, F-box, GRAS, MYB, NAC, WRKY, and Zinc finger (Figure 8A). Some transcription factors were up-regulated, such as AHL20 from the AHL family, NSP2 from the GRAS family, MYB4a, MYB4b, and PHL6 from the MYB family, WRKY43 from the WRKY family, WRI1 from the ERF family, and ATL17, FLZ5 and GIS3 from the Zinc finger family. Notably, the expression of NSP2, a transcription factor responsible for regulating SL, showed a gradual increase along with a reduction in N levels (Figure 8). In contrast, a significant number of transcription factors were down-regulated, such as bHLH (bHLH111), F-box (SKP2A, F-box protein, and SKIP2), GRAS (SCL8 and GRAS29), MYB (MYB14, MYB59, MYB73, and MYB78), NAC (NAC2 and NAC19), WRKY (WRKY24, WRKY40, WRKY41a/b, and WRKY45), ERF (ERF4a/b, ERF5a/b, ERF9a/b, ERF10, ERF24, ERF59, ERF71, and RAP2-4a/b) and Zinc finger (ATL40, C3H3a/b/c, RDUF1a/b, RING-H2, SAP4/5a/5b, and ZAT10a/b) (Figure 8A). The qRT-PCR findings revealed that the expression levels of PHL6, SNP2, and WRKY43 increased as nitrogen concentrations decreased after 28 days of treatment, while the expression of ERF5 decreased gradually (Figure 8B). The results of qRT-PCR are in alignment with the broader transcriptome outcomes, suggesting the reliability of the gene expression analysis.

4. Discussion

Nitrogen is a fundamental component for the growth, development, and metabolic processes of plants. The majority of plants exhibit discernible alterations in response to N insufficiency or N deficiency [43,44]. Under conditions of low N stress, the plant height of banana seedlings under LN and NF treatments exhibited a notable decrease in comparison with that of those under NN and NR treatments. The above-ground dry weights were also significantly impeded, suggesting that low N stress inhibited the normal growth of banana plants (Figure 1). The root system of plants serves as the primary organ for nutrient absorption and plays a crucial role in response to abiotic stress [45]. When N supply is inadequate, plants decrease their growth rate and prompt root growth to adapt to the low-N environment [46,47]. Similar results were observed in our study. In the LN and NF treatments, low N stress impeded the growth and biomass accumulation of banana seedlings. These treatments stimulated root growth, thereby augmenting the surface area available for root absorption and diminishing the demand for nutrients above the ground.
The chlorophyll fluorescence characteristics of plant leaves serve as a direct indicator for evaluating the effect of environmental factors on photosynthesis. A previous study showed that the structural integrity of chloroplasts was compromised, leading to a reduction in photosynthetic activity and the development of yellowing in plant leaves, ultimately inhibiting plant growth under low N stress [48,49,50]. We found that the SPAD values of banana leaves were decreased in the NR, LN, and NF treatments, exhibiting a strong correlation with the severity of N deficiency (Figure 2). Fv/Fm serves as a measure of the light energy conversion efficiency in the PSII system, assessing the impact of photoinhibition or environmental stress on photosynthesis. This parameter exhibits a minimal fluctuation under non-stressful circumstances, but it experiences a substantial decline under stressful conditions [51]. In comparison with the NN treatment group, the chlorophyll fluorescence parameters, namely Fv/Fm, Y(Ⅱ), and ETR, exhibited a gradual decline in the banana seedling leaves under the NR, LN, and NF treatments (Figure 3). Insufficient N supply inhibited various indicators of Y(Ⅱ) and ETR. This may be attributed to the damage caused by the active center of PSⅡ. The transmission of electrons was disrupted from the reaction center of the sink and source. The excitation energy absorbed by PSⅡ, denoted as Y(NPQ), was dissipated as heat through the regulatory photoprotection mechanism. Where N supply is inadequate, the Y(NPQ) level in leaves is elevated, suggesting that plants experience limitations or stress during the process of photosynthesis [52]. In this study, the Y(NPQ) value of banana leaves in the NF, LN, and NR treatments exhibited a statistically significant increase. The NF treatment demonstrated a sustained high Y(NPQ) value (Figure 3D). These findings suggested that banana seedling leaves have a heightened non-photochemical dissipation mechanism under low N stress to adapt and regulate light energy utilization.
The response of banana seedlings to low N stress involves perception and transmission. In order to elucidate the molecular mechanism, a total of 541 DEGs were identified via RNA-seq in our study. Among these DEGs, 167 were up-regulated and 374 were down-regulated (Figure 4). In the context of inadequate N availability, alterations occur in the N absorption and transportation processes [46,53]. Plants have developed nitrate transporters (NRT) and ammonium salt transporters (AMT) in the N absorption system. NRT1 predominantly consists of low-affinity nitrate transporters, and NRT2 belongs to high-affinity nitrate transporters [54,55]. Under conditions of low N stress, the expression levels of AtNRT2.1, AtNRT2.4, and AtNRT2.5 in Arabidopsis thaliana were significantly increased [3,4]. In rice, OsNRT2.1, OsNRT2.2, and OsNRT2.3a were involved in the process of root nitrate uptake [6,7]. Here, a total of 28 DEGs related to N were identified. Four nitrate transporters (NRT1.7, NRT2.3a, NRT2.3b, and NRT2.5) and two ammonium salt transporters (AMT1.2 and AMT3.1) exhibited significant up-regulation (Figure 5A). After 28 days of treatment, up-regulation of NRT2.3a, NRT2.5, and AMT3.1 gene expression was observed in response to decreasing nitrogen concentrations (Figure 5B), as evidenced by both transcriptomic and qRT-PCR results.
About 95% of land plants obtain nutrients such as nitrogen and phosphorus by forming symbiotic relationships with arbuscular mycorrhizal fungi (AMF) [56,57]. Banana roots can also help plants absorb nitrogen and respond to low nitrogen stress by forming arbuscular mycorrhiza [58]. In this study, the expression of IPD3, a gene associated with AMF, showed a significant increase as the N concentration decreased (Figure 5B). This may be attributed to the formation of a symbiont between AMF and the plant under low N stress [59,60]. Therefore, inadequate N supply in banana seedlings led to an up-regulation of NRTs and AMTs, promoting N uptake. This mechanism enhanced the tolerance of banana seedlings toward N-deficient conditions and improved their adaptability to the surrounding environment.
Plant hormones are crucial for regulating plant growth and development, and their response to abiotic stress [61,62]. They possess the ability to initiate signal transduction pathways in response to external abiotic stress [63,64]. We identified 33 genes associated with plant hormones, involving GA, SL, JA, IAA, SA, ABA, BR, and other plant hormones (Figure 6A). For example, SL is a pivotal hormone responsible for regulating plant growth during nutrient stress. The biosynthesis of SL was activated in response to inadequate N supply [65,66,67]. Our investigation revealed a significant up-regulation of positive regulatory genes CCD7, CCD8B, CYP711A1, C7A10.890, and D27 in the SL pathway under low N stress (Figure 6). Additionally, low N stress also induced the production of GA and other hormones. In rice, GA could stimulate the biosynthesis of SL in regulating N utilization [68,69]. We also found that CYP714B2 and GASR1 in GA pathway, PER52a/d/e/f in the IAA pathway, and NHL6b and PYL4 in the ABA pathway exhibited different degrees of up-regulation in response to N deficiency. Additionally, qRT-PCR results indicated that the expression levels of D27 and GASR1 genes also increased with the decrease in nitrogen concentration after 28 days of treatment, (Figure 6B). These findings suggest that phytohormones such as SL, IAA, ABA, and GA may play a crucial role in the morphological adaptation of banana roots to nitrogen stress.
The participation of transcription factors in the signaling network of plant stress is crucial for nitrogen response factors, ultimately influencing the regulation of target gene expression to modulate root growth [70,71]. Notably, prominent transcription factors, including WRKY, GRAS, MYB, and Zinc finger, have been demonstrated to govern root development in Arabidopsis and rice [72,73,74,75,76]. In Arabidopsis, AtMYB59 controlled the cell cycle of root tip cells, AtWRKY46 modulated lateral root development through ABA signal, AtWRKY23 influenced roots by modifying auxin distribution, and AtZFP5 played a role in root hair development and elongation by mediating cytokinin and ethylene signaling pathways [77,78,79,80]. The GRAS family expressed in roots played pivotal roles in the regulation of the GA signal and plant growth [81,82]. Here, a total of 54 transcription factors belonging to 9 distinct classes were identified, namely AHL, bHLH, ERF, F-box, GRAS, MYB, NAC, WRKY and Zinc finger. Among the 10 transcription factors up-regulated (Figure 8A), NSP2 belonging to the GRAS family participated in the biosynthesis of SL. In addition, the AHL family (AHL20), ERF family (WRI1), MYB family (MYB43a, MYB43b, PHL6), WRKY family (WRKY43), and Zinc finger family (ATL17, FLZ5, GIS3) exhibited a tendency of up-regulation after treatment with low N. However, it is noted that the modes of action of these transcription factors may vary. The analysis of qRT-PCR results reveals that the expression levels of PHL6, SNP2, and WRKY43 increase with decreasing nitrogen concentrations after 28 days of treatment, whereas the expression of ERF5 decreases gradually (Figure 8B). In summary, a combination of transcription factors collaboratively govern the transcription of specific genes to enhance nitrogen absorption and transportation, and growth in banana seedlings in response to nitrogen deficiency.

5. Conclusions

In the current investigation (Figure 9), it was observed that banana seedlings exhibited a response to low nitrogen stress characterized by the inhibition of shoot growth and dry matter accumulation. Root growth was facilitated by enhancements in the root uptake variable area and a reduction in nutrient demand in shoots. Insufficient nitrogen led to a decrease in SPAD value in leaves, thereby impeding photosynthetic efficiency. Low nitrogen stress also triggered the up-regulation of genes associated with plant hormones including GA, SL, IAA, and ABA, as well as the activation of transcription factors such as AHL, GARS, WRKY, and Zinc fingers. The enhanced nitrogen absorption of plants was facilitated by the up-regulation of nitrate transporters (NRT1.7, NRT2.3a, NRT2.3b, and NRT2.5) and ammonium transporters (AMT1.2 and AMT3.1). Additionally, the regulation of structural genes such as CesA and XTH can promote root growth, expanding the nutrient uptake area and enhancing the adaptability of banana plants to low-nitrogen environments. Furthermore, the establishment of a symbiotic relationship with arbuscular mycorrhizal fungi (AMF) can further enhance nutrient uptake, as evidenced by the up-regulated expression of IPD3. Therefore, plants respond to low nitrogen stress by modulating plant hormone levels and inducing the expression of crucial transcription factors.

Supplementary Materials

The following supporting information can be downloaded athttps://www.mdpi.com/article/10.3390/horticulturae10030290/s1: Table S1: The components and their concentrations in different nitrogen levels. Table S2: The primers of candidate and reference genes for qRT-PCR analysis. Figure S1: GO enrichment analysis of differentially expressed genes. Figure S2: KEGG enrichment analysis of differentially expressed genes.

Author Contributions

Conceptualization, Y.W., J.X., and W.W.; methodology, L.Z., J.F. and M.Z.; software, L.Z., B.C. and D.Q.; validation, L.Z., X.Z. and B.Z.; investigation, M.Z. and Y.C.; resources, W.W. and D.Z.; data curation, L.Z. and Y.W.; writing—original draft preparation, L.Z. and Y.W.; writing—review and editing, W.W. and Y.W.; project administration, J.X. and W.W.; funding acquisition, Y.W. and J.X. All authors have read and agreed to the published version of the manuscript.

Funding

This research was supported by the Natural Science Foundation of Hainan (323RC543 and 323QN279), the Project of National Key Laboratory for Tropical Crop Breeding (NKLTCB202311), Hainan Province Science and Technology Special Fund (ZDYF2023XDNY179), the Central Public-interest Scientific Institution Basal Research Fund (1630052022006 and ITBBQDF2023003), and the China Agriculture Research System (CARS-31).

Data Availability Statement

Data are contained within the article.

Conflicts of Interest

The authors declare no conflicts of interest.

References

  1. Yang, J.; Wang, M.; Li, W.; He, X.; Teng, W.; Ma, W.; Zhao, X.; Hu, M.; Li, H.; Zhang, Y.; et al. Reducing expression of a nitrate-responsive bZIP transcription factor increases grain yield and N use in wheat. Plant Biotechnol. J. 2019, 9, 1823–1833. [Google Scholar] [CrossRef]
  2. Wang, G.; Wang, J.; Yao, L.; Li, B.; Ma, X.; Si, E.; Yang, K.; Li, C.; Shang, X.; Meng, Y.; et al. Transcriptome and metabolome reveal the molecular mechanism of barley genotypes underlying the response to low nitrogen and resupply. Int. J. Mol. Sci. 2023, 5, 4706. [Google Scholar] [CrossRef]
  3. Remans, T.; Nacry, P.; Pervent, M.; Girin, T.; Tillard, P.; Lepetit, M.; Gojon, A. A central role for the nitrate transporter NRT2.1 in the integrated morphological and physiological responses of the root system to nitrogen limitation in Arabidopsis. Plant Physiol. 2006, 3, 909–921. [Google Scholar] [CrossRef] [PubMed]
  4. Ye, J.Y.; Tian, W.H.; Jin, C.W. A reevaluation of the contribution of NRT1.1 to nitrate uptake in Arabidopsis under low-nitrate supply. FEBS Lett. 2019, 15, 2051–2059. [Google Scholar] [CrossRef] [PubMed]
  5. Kiba, T.; Feria-Bourrellier, A.B.; Lafouge, F.; Lezhneva, L.; Boutet-Mercey, S.; Orsel, M.; Bréhaut, V.; Miller, A.; Daniel-Vedele, F.; Sakakibara, H.; et al. The Arabidopsis nitrate transporter NRT2.4 plays a double role in roots and shoots of nitrogen-starved plants. Plant Cell 2012, 1, 245–258. [Google Scholar] [CrossRef] [PubMed]
  6. Yan, M.; Fan, X.; Feng, H.; Miller, A.J.; Shen, Q.; Xu, G. Rice OsNAR2.1 interacts with OsNRT2.1, OsNRT2.2 and OsNRT2.3a nitrate transporters to provide uptake over high and low concentration ranges. Plant Cell Environ. 2011, 8, 1360–1372. [Google Scholar] [CrossRef] [PubMed]
  7. Fan, X.; Naz, M.; Fan, X.; Xuan, W.; Miller, A.J.; Xu, G. Plant nitrate transporters: From gene function to application. J. Exp. Bot. 2017, 10, 2463–2475. [Google Scholar] [CrossRef] [PubMed]
  8. Fan, X.; Feng, H.; Tan, Y.; Xu, Y.; Miao, Q.; Xu, G. A putative 6-transmembrane nitrate transporter OsNRT1.1b plays a key role in rice under low nitrogen. J. Integr. Plant Biol. 2016, 6, 590–599. [Google Scholar] [CrossRef] [PubMed]
  9. Fan, S.C.; Lin, C.S.; Hsu, P.K.; Lin, S.H.; Tsay, Y.F. The Arabidopsis nitrate transporter NRT1.7, expressed in phloem, is responsible for source-to-sink remobilization of nitrate. Plant Cell 2009, 9, 2750–2761. [Google Scholar] [CrossRef]
  10. Ferreira, L.M.; De Souza, V.M.; Tavares, O.C.H.; Zonta, E.; Santa-Catarina, C.; de Souza, S.R.; Santos, L.A. OsAMT1.3 expression alters rice ammonium uptake kinetics and root morphology. Plant Biotechnol. Rep. 2015, 9, 221–229. [Google Scholar] [CrossRef]
  11. Hao, D.L.; Zhou, J.Y.; Yang, S.Y.; Qi, W.; Yang, K.J.; Su, Y.H. Function and regulation of ammonium transporters in plants. Int. J. Mol. Sci. 2020, 10, 3557. [Google Scholar] [CrossRef]
  12. Wen, B.; Zhao, X.; Gong, X.; Zhao, W.; Sun, M.; Chen, X.; Li, D.; Li, L.; Wei, X. The NAC transcription factor MdNAC4 positively regulates nitrogen deficiency-induced leaf senescence by enhancing ABA biosynthesis in apple. Mol. Hortic. 2023, 3, 5. [Google Scholar] [CrossRef]
  13. Cui, R.; Feng, Y.; Yao, J.; Shi, L.; Wang, S.; Xu, F. The transcription factor BnaA9.WRKY47 coordinates leaf senescence and nitrogen remobilization in Brassica napus. J. Exp. Bot. 2023, 74, 5606–5619. [Google Scholar] [CrossRef]
  14. Ge, L.; Dou, Y.; Li, M.; Qu, P.; He, Z.; Liu, Y.; Xu, Z.; Chen, J.; Chen, M.; Ma, Y. SiMYB3 in Foxtail Millet (Setaria italica) Confers Tolerance to Low-Nitrogen Stress by Regulating Root Growth in Transgenic Plants. Int. J. Mol. Sci. 2019, 22, 5741. [Google Scholar] [CrossRef]
  15. Pan, Y. Overexpression of ZmNF-YA13 Enhances Nitrogen Uptake in Tobacco and Maize. Master’s Thesis, Dalian University of Technology, Dalian, China, 2021. [Google Scholar]
  16. Kurai, T.; Wakayama, M.; Abiko, T.; Yanagisawa, S.; Aoki, N.; Ohsugi, R. Introduction of the ZmDof1 gene into rice enhances carbon and nitrogen assimilation under low-nitrogen conditions. Plant Biotechnol. J. 2011, 8, 826–837. [Google Scholar] [CrossRef]
  17. Feng, Y.; Zhang, S.; Li, J.; Pei, R.; Tian, L.; Qi, J.; Azam, M.; Agyenim-Boateng, K.G.; Shaibu, A.S.; Liu, Y.; et al. Dual-function C2H2-type zinc-finger transcription factor GmZFP7 contributes to isoflavone accumulation in soybean. N. Phytol. 2023, 5, 1794–1809. [Google Scholar] [CrossRef]
  18. Liang, T.; Yuan, Z.; Fu, L.; Zhu, M.; Luo, X.; Xu, W.; Yuan, H.; Zhu, R.; Hu, Z.; Wu, X. Integrative Transcriptomic and proteomic analysis reveals an alternative molecular network of glutamine synthetase 2 corresponding to nitrogen deficiency in rice (Oryza sativa L.). Int. J. Mol. Sci. 2021, 14, 7674. [Google Scholar] [CrossRef] [PubMed]
  19. Takatsuka, H.; Umeda, M. Hormonal control of cell division and elongation along differentiation trajectories in roots. J. Exp. Bot. 2014, 10, 2633–2643. [Google Scholar] [CrossRef] [PubMed]
  20. Pacifici, E.; Polverari, L.; Sabatini, S. Plant hormone cross-talk: The pivot of root growth. J. Exp. Bot. 2015, 4, 1113–1121. [Google Scholar] [CrossRef] [PubMed]
  21. Steffens, B.; Rasmussen, A. The physiology of adventitious roots. Plant Physiol. 2016, 2, 603–617. [Google Scholar] [CrossRef] [PubMed]
  22. Praveen, A.; Gupta, M. Nitric oxide confronts arsenic stimulated oxidative stress and root architecture through distinct gene expression of auxin transporters, nutrient related genes and modulates biochemical responses in Oryza sativa L. Environ. Pollut. 2018, 240, 950–962. [Google Scholar] [CrossRef] [PubMed]
  23. Li, M.; Xu, J.; Wang, X.; Fu, H.; Zhao, M.; Wang, H.; Shi, L. Photosynthetic characteristics and metabolic analyses of two soybean genotypes revealed adaptive strategies to low-nitrogen stress. J. Plant Physiol. 2018, 229, 132–141. [Google Scholar] [CrossRef]
  24. Collier, M.D.; Fotelli, M.N.; Nahm, M.; Kopriva, S.; Rennenberg, H.; Hanke, D.E.; Gessler, A. Regulation of nitrogen uptake by Fagus sylvatica on a whole plant level–interactions between cytokinins and soluble N compounds. Plant Cell Environ. 2003, 9, 1549–1560. [Google Scholar] [CrossRef]
  25. Gu, J.; Li, Z.; Mao, Y.; Struik, P.C.; Zhang, H.; Liu, L.; Wang, Z.; Yang, J. Roles of nitrogen and cytokinin signals in root and shoot communications in maximizing of plant productivity and their agronomic applications. Plant Sci. 2018, 274, 320–331. [Google Scholar] [CrossRef]
  26. Werner, T.; Nehnevajova, E.; Köllmer, I.; Novák, O.; Strnad, M.; Krämer, U.; Schmülling, T. Root-specific reduction of cytokinin causes enhanced root growth, drought tolerance, and leaf mineral enrichment in Arabidopsis and tobacco. Plant Cell 2010, 12, 3905–3920. [Google Scholar] [CrossRef] [PubMed]
  27. Köllmer, I.; Novák, O.; Strnad, M.; Schmülling, T.; Werner, T. Overexpression of the cytosolic cytokinin oxidase/dehydrogenase (CKX7) from Arabidopsis causes specific changes in root growth and xylem differentiation. Plant J. 2014, 3, 359–371. [Google Scholar] [CrossRef] [PubMed]
  28. Ivanov, V.B.; Filin, A.N. Cytokinins regulate root growth through its action on meristematic cell proliferation but not on the transition to differentiation. Funct. Plant Biol. 2018, 2, 215–221. [Google Scholar] [CrossRef]
  29. Smith, K.A.; Robertson, P.D. Effect of ethylene on root extension of cereals. Nature 1971, 5325, 148–149. [Google Scholar] [CrossRef]
  30. Ma, B.; Yin, C.C.; He, S.J.; Lu, X.; Zhang, W.K.; Lu, T.G.; Chen, S.Y.; Zhang, J.S. Ethylene-induced inhibition of root growth requires abscisic acid function in rice (Oryza sativa L.) seedlings. PLoS Genet. 2014, 10, e1004701. [Google Scholar] [CrossRef]
  31. García, M.J.; Romera, F.J.; Lucena, C.; Alcántara, E.; Pérez-Vicente, R. Ethylene and the regulation of physiological and morphological responses to nutrient deficiencies. Plant Physiol. 2015, 1, 51–60. [Google Scholar] [CrossRef]
  32. Drew, M.C.; He, C.J.; Morgan, P.W. Decreased ethylene biosynthesis, and induction of aerenchyma, by nitrogen- or phosphate-starvation in adventitious roots of Zea mays L. Plant Physiol. 1989, 1, 266–271. [Google Scholar] [CrossRef] [PubMed]
  33. He, C.J.; Morgan, P.W.; Drew, M.C. Enhanced sensitivity to ethylene in nitrogen-or phosphate-starved roots of Zea mays L. during aerenchyma formation. Plant Physiol. 1992, 1, 137–142. [Google Scholar] [CrossRef] [PubMed]
  34. Sun, X.; Chen, F.; Yuan, L.; Mi, G. The physiological mechanism underlying root elongation in response to nitrogen deficiency in crop plants. Planta 2020, 4, 84. [Google Scholar] [CrossRef]
  35. Sun, J.; Li, W.; Li, C.; Chang, W.; Zhang, S.; Zeng, Y.; Zeng, C.; Peng, M. Effect of different rates of nitrogen fertilization on crop yield, soil properties and leaf physiological attributes in banana under subtropical regions of china. Front. Plant Sci. 2020, 11, 613760. [Google Scholar] [CrossRef]
  36. Huang, L.; Cheng, S.; Liu, H.; Zhao, Z.; Wei, S.; Sun, S. Effects of nitrogen reduction combined with organic fertilizer on growth and nitrogen fate in banana at seedling stage. Environ. Res. 2022, 1, 113826. [Google Scholar] [CrossRef]
  37. Chen, H. Study on Banana Nutrition Characteristics under N, P, K, Ca, Mg, S Deficiency and Banana Nutrition Diagnosis. Ph.D. Thesis, South China Agricultural University, Guangzhou, China, 2020. [Google Scholar]
  38. Chen, C.; Chen, H.; Zhang, Y.; Thomas, H.R.; Frank, M.H.; He, Y.; Xia, R. TBtools: An integrative toolkit developed for interactive analyses of big biological data. Mol. Plant 2020, 8, 1194–1202. [Google Scholar] [CrossRef] [PubMed]
  39. Lin, F.F.; Deng, J.S.; Shi, Y.Y. Investigation of SPAD meter-based indices for estimating rice nitrogen status. Comput. Electron. Agric. 2010, 71, S60–S65. [Google Scholar] [CrossRef]
  40. Kitajima, M.; Butler, W.L. Quenching of chlorophyll fluorescence and primary photochemistry in chloroplasts by dibromothymoquinone. Biochim. Biophys. Acta 1975, 1, 105–115. [Google Scholar] [CrossRef]
  41. Oquist, G.; Chow, W.S. On the relationship between the quantum yield of Photosystem II electron transport, as determined by chlorophyll fluorescence and the quantum yield of CO2-dependent O2 evolution. Photosynth. Res. 1992, 1, 51–62. [Google Scholar] [CrossRef]
  42. Van Kooten, O.; Snel, J.F. The use of chlorophyll fluorescence nomenclature in plant stress physiology. Photosynth. Res. 1990, 3, 147–150. [Google Scholar] [CrossRef]
  43. Grzybowski, M.W.; Zwiener, M.; Jin, H.; Wijewardane, N.K.; Atefi, A.; Naldrett, M.J.; Alvarez, S.; Ge, Y.; Schnable, J.C. Variation in morpho-physiological and metabolic responses to low nitrogen stress across the sorghum association panel. BMC Plant Biol. 2022, 1, 433. [Google Scholar] [CrossRef]
  44. Li, X.; Zou, J.; Jin, C.; Jin, H. Transcriptomics analysis reveals Xanthoceras sorbifolia Bunge leaves’ adaptation strategy to low nitrogen. Trees 2023, 37, 1153–1166. [Google Scholar] [CrossRef]
  45. Zinta, R.; Tiwari, J.K.; Buckseth, T.; Thakur, K.; Goutam, U.; Kumar, D.; Challam, C.; Bhatia, N.; Poonia, A.K.; Naik, S.; et al. Root system architecture for abiotic stress tolerance in potato: Lessons from plants. Front. Plant Sci. 2022, 13, 926214. [Google Scholar] [CrossRef]
  46. Kiba, T.; Krapp, A. Plant nitrogen acquisition under low availability: Regulation of uptake and root architecture. Plant Cell Physiol. 2016, 4, 707–714. [Google Scholar] [CrossRef]
  47. Devi, L.L.; Pandey, A.; Gupta, S.; Singh, A.P. The interplay of auxin and brassinosteroid signaling tunes root growth under low and different nitrogen forms. Plant Physiol. 2022, 3, 1757–1773. [Google Scholar] [CrossRef]
  48. Agüera, E.; Cabello, P.; de la Haba, P. Induction of leaf senescence by low nitrogen nutrition in sunflower (Helianthus annuus) plants. Physiol. Plant 2010, 3, 256–267. [Google Scholar] [CrossRef]
  49. Mu, X.; Chen, Q.; Chen, F.; Yuan, L.; Mi, G. A RNA-Seq analysis of the response of photosynthetic system to low nitrogen supply in maize leaf. Int. J. Mol. Sci. 2017, 12, 2624. [Google Scholar] [CrossRef]
  50. Li, Z.; Zhang, X.; Zhao, Y.; Li, Y.; Zhang, G.; Peng, Z.; Zhang, J. Enhancing auxin accumulation in maize root tips improves root growth and dwarfs plant height. Plant Biotechnol. J. 2018, 1, 86–99. [Google Scholar] [CrossRef] [PubMed]
  51. Björkman, O.; Demmig, B. Photon yield of O2 evolution and chlorophyll fluorescence characteristics at 77 K among vascular plants of diverse origins. Planta 1987, 4, 489–504. [Google Scholar] [CrossRef] [PubMed]
  52. Klughammer, C.; Schreiber, U. Complementary PS II quantum yields calculated from simple fluorescence parameters measured by PAM fluorometry and the Saturation Pulse method. PAM Appl. Notes 2008, 2, 201–247. [Google Scholar]
  53. Luo, L.; Zhao, C.; Zheng, D.; Wang, E.; Liang, J.; Yin, C. Nitrogen uptake preference and allocation in Populus cathayana in response to drought stress. Environ. Exp. Bot. 2023, 213, 105415. [Google Scholar] [CrossRef]
  54. Lanquar, V.; Loqué, D.; Hörmann, F.; Yuan, L.; Bohner, A.; Engelsberger, W.R.; Lalonde, S.; Schulze, W.X.; von Wirén, N.; Frommer, W.B. Feedback inhibition of ammonium uptake by a phospho-dependent allosteric mechanism in Arabidopsis. Plant Cell 2009, 11, 3610–3622. [Google Scholar] [CrossRef]
  55. Léran, S.; Varala, K.; Boyer, J.C.; Chiurazzi, M.; Crawford, N.; Daniel-Vedele, F.; David, L.; Dickstein, R.; Fernandez, E.; Forde, B.; et al. A unified nomenclature of NITRATE TRANSPORTER 1/PEPTIDE TRANSPORTER family members in plants. Trends Plant Sci. 2014, 1, 5–9. [Google Scholar] [CrossRef] [PubMed]
  56. Bennett, A.E.; Groten, K. The costs and benefits of plant–arbuscular mycorrhizal fungal interactions. Annu. Rev. Plant Biol. 2022, 73, 649–672. [Google Scholar] [CrossRef]
  57. Xie, K.; Ren, Y.; Chen, A.; Yang, C.; Zheng, Q.; Chen, J.; Wang, D.; Li, Y.; Hu, S.; Xu, G. Plant nitrogen nutrition: The roles of arbuscular mycorrhizal fungi. J. Plant Physiol. 2022, 269, 153591. [Google Scholar] [CrossRef]
  58. Zhang, L.; Yuan, L.; Staehelin, C.; Li, Y.; Ruan, J.; Liang, Z.; Xie, Z.; Wang, W.; Xie, J.; Huang, S. The LYSIN MOTIF-CONTAINING RECEPTOR-LIKE KINASE 1 protein of banana is required for perception of pathogenic and symbiotic signals. N. Phytol. 2019, 223, 15888. [Google Scholar] [CrossRef]
  59. Lanfranco, L.; Bonfante, P.; Genre, A. The mutualistic interaction between plants and arbuscular mycorrhizal fungi. Microbiol. Spectr. 2016, 6, 4–6. [Google Scholar] [CrossRef] [PubMed]
  60. Lanfranco, L.; Fiorilli, V.; Venice, F.; Bonfante, P. Strigolactones cross the kingdoms: Plants, fungi, and bacteria in the arbuscular mycorrhizal symbiosis. J. Exp. Bot. 2018, 9, 2175–2188. [Google Scholar] [CrossRef]
  61. Bogatek, R.; Gniazdowska, A. ROS and phytohormones in plant-plant allelopathic interaction. Plant Signal. Behav. 2007, 4, 317–318. [Google Scholar] [CrossRef]
  62. Qi, Y.; Wei, H.; Gu, W.; Shi, W.; Jiang, L.; Deng, L.; Liu, X. Transcriptome profiling provides insights into the fruit color development of wild Lycium ruthenicum Murr. from Qinghai-Tibet Plateau. Protoplasma 2021, 1, 33–43. [Google Scholar] [CrossRef] [PubMed]
  63. Kiba, T.; Kudo, T.; Kojima, M.; Sakakibara, H. Hormonal control of nitrogen acquisition: Roles of auxin, abscisic acid, and cytokinin. J. Exp. Bot. 2011, 4, 1399–1409. [Google Scholar] [CrossRef] [PubMed]
  64. Osakabe, Y.; Osakabe, K.; Shinozaki, K.; Tran, L.S. Response of plants to water stress. Front. Plant Sci. 2014, 5, 86. [Google Scholar] [CrossRef]
  65. Foo, E.; Reid, J.B. Strigolactones: New physiological roles for an ancient signal. J. Plant Growth Regul. 2013, 32, 429–442. [Google Scholar] [CrossRef]
  66. Yoneyama, K.; Mori, N.; Sato, T.; Yoda, A.; Xie, X.; Okamoto, M.; Iwanaga, M.; Ohnishi, T.; Nishiwaki, H.; Asami, T.; et al. Conversion of carlactone to carlactonoic acid is a conserved function of MAX1 homologs in strigolactone biosynthesis. N. Phytol. 2018, 4, 1522–1533. [Google Scholar] [CrossRef] [PubMed]
  67. Yoneyama, K.; Xie, X.; Kim, H.I.; Kisugi, T.; Nomura, T.; Sekimoto, H.; Yokota, T.; Yoneyama, K. How do nitrogen and phosphorus deficiencies affect strigolactone production and exudation? Planta 2012, 235, 1197–1207. [Google Scholar] [CrossRef] [PubMed]
  68. Wu, K.; Wang, S.; Song, W.; Zhang, J.; Wang, Y.; Liu, Q.; Yu, J.; Ye, Y.; Li, S.; Chen, J.; et al. Enhanced sustainable green revolution yield via nitrogen-responsive chromatin modulation in rice. Science 2020, 6478, eaaz2046. [Google Scholar] [CrossRef]
  69. Tian, Z.; Zhang, Y.; Zhu, L.; Jiang, B.; Wang, H.; Gao, R.; Friml, J.; Xiao, G. Strigolactones act downstream of gibberellins to regulate fiber cell elongation and cell wall thickness in cotton (Gossypium hirsutum). Plant Cell 2022, 12, 4816–4839. [Google Scholar] [CrossRef]
  70. Guo, J.; Sun, B.; He, H.; Zhang, Y.; Tian, H.; Wang, B. Current Understanding of bHLH Transcription Factors in Plant Abiotic Stress Tolerance. Int. J. Mol. Sci. 2021, 9, 4921. [Google Scholar] [CrossRef]
  71. Kidokoro, S.; Shinozaki, K.; Yamaguchi-Shinozaki, K. Transcriptional regulatory network of plant cold-stress responses. Trends Plant Sci. 2022, 9, 922–935. [Google Scholar] [CrossRef]
  72. Hirsch, S.; Oldroyd, G.E. GRAS-domain transcription factors that regulate plant development. Plant Signal. Behav. 2009, 8, 698–700. [Google Scholar] [CrossRef]
  73. Bejarano, I.; Marino, D.; Coleto, I. Arabidopsis MYB28 and MYB29 transcription factors are involved in ammonium-mediated alterations of root-system architecture. Plant Signal. Behav. 2021, 4, 1879532. [Google Scholar] [CrossRef]
  74. Gulzar, F.; Fu, J.; Zhu, C.; Yan, J.; Li, X.; Meraj, T.A.; Shen, Q.; Hassan, B.; Wang, Q. Maize WRKY transcription factor ZmWRKY79 positively regulates drought tolerance through elevating ABA biosynthesis. Int. J. Mol. Sci. 2021, 18, 10080. [Google Scholar] [CrossRef]
  75. Kumar, V.; Singh, D.; Majee, A.; Singh, S.; Roohi; Asif, M.H.; Sane, A.P.; Sane, V.A. Identification of tomato root growth regulatory genes and transcription factors through comparative transcriptomic profiling of different tissues. Physiol. Mol. Biol. Plant 2021, 6, 1173–1189. [Google Scholar] [CrossRef]
  76. Chen, Z.; Wu, Z.; Dong, W.; Liu, S.; Tian, L.; Li, J.; Du, H. MYB transcription factors becoming mainstream in plant roots. Int. J. Mol. Sci. 2022, 16, 62. [Google Scholar] [CrossRef]
  77. An, L.; Zhou, Z.; Sun, L.; Yan, A.; Xi, W.; Yu, N.; Cai, W.; Chen, X.; Yu, H.; Schiefelbein, J.; et al. A zinc finger protein gene ZFP5 integrates phytohormone signaling to control root hair development in Arabidopsis. Plant J. 2012, 3, 474–490. [Google Scholar] [CrossRef] [PubMed]
  78. Grunewald, W.; De Smet, I.; Lewis, D.R.; Löfke, C.; Jansen, L.; Goeminne, G.; Vanden Bossche, R.; Karimi, M.; De Rybel, B.; Vanholme, B.; et al. Transcription factor WRKY23 assists auxin distribution patterns during Arabidopsis root development through local control on flavonol biosynthesis. Proc. Natl. Acad. Sci. USA 2012, 5, 1554–1559. [Google Scholar] [CrossRef] [PubMed]
  79. Ding, Z.J.; Yan, J.Y.; Li, C.X.; Li, G.X.; Wu, Y.R.; Zheng, S.J. Transcription factor WRKY46 modulates the development of Arabidopsis lateral roots in osmotic/salt stress conditions via regulation of ABA signaling and auxin homeostasis. Plant J. 2015, 1, 56–69. [Google Scholar] [CrossRef]
  80. Shinozaki, Y.; Nicolas, P.; Fernandez-Pozo, N.; Ma, Q.; Evanich, D.J.; Shi, Y.; Xu, Y.; Zheng, Y.; Snyder, S.I.; Martin, L.B.B.; et al. High-resolution spatiotemporal transcriptome mapping of tomato fruit development and ripening. Nat. Commun. 2018, 1, 364. [Google Scholar] [CrossRef]
  81. Silverstone, A.L.; Ciampaglio, C.N.; Sun, T. The Arabidopsis RGA gene encodes a transcriptional regulator repressing the gibberellin signal transduction pathway. Plant Cell 1998, 2, 155–169. [Google Scholar] [CrossRef] [PubMed]
  82. Heckmann, A.B.; Lombardo, F.; Miwa, H.; Perry, J.A.; Bunnewell, S.; Parniske, M.; Wang, T.L.; Downie, J.A. Lotus japonicus nodulation requires two GRAS domain regulators, one of which is functionally conserved in a non-legume. Plant Physiol. 2006, 4, 1739–1750. [Google Scholar] [CrossRef]
Figure 1. Effects of different N treatments on plant growth. (A) Plant growth morphology; plant height; bars = 12.2 cm. (B) Root dry weight, (C) shoot dry weight, (D) and root/shoot ratio (E) in banana seedlings. NN: Normal-N treatment (16 mM); NR: Reduced-N treatment (11.20 mM); LN, Low-N treatment (3.20 mM); NF: N-Free treatment (0 mM). The different letters indicate significant differences (Duncan’s test, p < 0.05).
Horticulturae 10 00290 g001
Figure 2. Changes in SPAD value in banana leaves after treatment with different N levels. Data are means ± SE (n = 10), and the different letters indicate significant differences (Duncan’ test, p < 0.05).
Horticulturae 10 00290 g002
Figure 3. Changes in chlorophyll fluorescence parameters in banana seedling leaves subjected to different N treatments. (A) Chlorophyll fluorescence map; (B) PSⅡ maximum photochemical efficiency (Fv/Fm); (C) actual photosynthetic efficiency of PSⅡ (Y(Ⅱ)); (D) quantum yield of regulatory energy dissipation of PSⅡ [Y(NPQ)]; (E) Quantum yield of non-regulatory energy dissipation by PSⅡ (Y(NO)); (F) relative electron transport rate of PSⅡ (ETR). Data are means ± SE (n = 9), and the different letters indicate significant differences (Duncan’s test, p < 0.05).
Horticulturae 10 00290 g003
Figure 4. Screening of DEGs in response to N stress. (A) Venn diagram of DEGs; (B) number of DEGs; (C) volcano map of DEGs from NN vs. NR; (D) volcano map of DEGs from NN vs. LN; (E) volcano map of DEGs from NN vs. NF.
Horticulturae 10 00290 g004
Figure 5. Expression profiles of N-related differential genes. (A) Heatmap of expression pattern; (B) results of qRT-PCR. NRT: nitrate transporter; AMT: ammonium transporter; MET: nitrogen metabolism-related genes; TRA: transport-related proteins.
Horticulturae 10 00290 g005
Figure 6. Expression profiles of phytohormone-related DEGs. (A) Heatmap of expression pattern; (B) results of qRT-PCR. GA: gibberellins; SL: strigolactone; JA: jasmonic acid; IAA: auxin; SA: salicylic acid; ABA: abscisic acid; BR: brassinolactone.
Horticulturae 10 00290 g006
Figure 7. Gene expression characteristics of DEGs associated with plant growth. (A) Heatmap of expression pattern; (B) results of qRT-PCR. LBD: lateral boundary domain proteins; CW: cell wall development-related genes; Root: root growth-related genes, Leaf: leaf growth-related genes; Others: other growth-related genes.
Horticulturae 10 00290 g007
Figure 8. Expression profiles of transcription factors. (A) Heatmap of expression pattern; (B) results of qRT-PCR.
Horticulturae 10 00290 g008
Figure 9. The model of physiological and molecular mechanisms underlying the response of banana seedlings to low nitrogen stress.
Horticulturae 10 00290 g009
Disclaimer/Publisher’s Note: The statements, opinions and data contained in all publications are solely those of the individual author(s) and contributor(s) and not of MDPI and/or the editor(s). MDPI and/or the editor(s) disclaim responsibility for any injury to people or property resulting from any ideas, methods, instructions or products referred to in the content.

