Article

Integrative Metabolome and Transcriptome Analyses Reveal the Pericarp Coloration Mechanisms in Bitter Melon (Momordica charantia L.)

1
Horticulture Research Institute, Sichuan Academy of Agricultural Sciences, Chengdu 610066, China
2
Vegetable Germplasm Innovation and Variety Improvement Key Laboratory of Sichuan Province, Chengdu 610066, China
3
Key Laboratory of Horticultural Crops Biology and Germplasm Enhancement in Southwest Regions, Ministry of Agriculture and Rural Affairs of the P.R. China, Chengdu 610066, China
4
Sichuan Province Engineering Technology Research Center of Vegetables, Chengdu 611934, China
*
Author to whom correspondence should be addressed.
Horticulturae 2024, 10(3), 291; https://doi.org/10.3390/horticulturae10030291
Submission received: 15 February 2024 / Revised: 13 March 2024 / Accepted: 15 March 2024 / Published: 18 March 2024

Abstract

:
Pericarp colors are critical agronomic traits that affect the quality and economic values of fruits. Although a diversity of bitter melon pericarp (BMP) colors is available, the fruit pigmentation mechanisms remain elusive. Hence, this study aimed to unveil the key metabolites and molecular mechanisms underlying variation in BMP coloration through integrative metabolomics and transcriptomics analyses of four differently colored genotypes, including K1102 (grayish orange), 262 (grayish yellow), 1392 (very soft green), and K115 (dark grayish cyan). The four BMPs exhibited significant metabolite profile and transcriptional differences, as over 112 and 1865 DAMs (differentially accumulated metabolites) and DEGs (differentially expressed genes), respectively, were identified. The variation in the content of six anthocyanins, including malvidin 3-O-glucoside, petunidin 3-O-glucoside, rosinidin O-hexoside, cyanidin, cyanidin 3-p-hydroxybenzoylsophoroside-5-glucoside, and pelargonidin 3-O-beta-D-glucoside, might be the major driving factor of BMP color changes. Notably, malvidin 3-O-glucoside, rosinidin O-hexoside, and petunidin 3-O-glucoside are the dominant pigments in K115, while carotenoids and other flavonoids may contribute to other colors. Candidate flavonoid structural and regulatory (MYBs, NACs, MADSs, bHLHs, and bZIPs) genes were identified. Of them, gene13201 (anthocyanin reductase), gene8173 (polyphenol oxidase), gene2136 (NAC43), gene19593 (NAC104), and gene15171 (tetrapyrrole-binding protein) might play essential roles in K115 pericarp color development. Our findings deepen our understanding of BMP pigmentation and provide fundamental resources for higher-valued bitter melon breeding perspectives.

1. Introduction

Bitter melon or bitter gourd (Momordica charantia L.) is a highly economic value and promising industrial vegetable crop of the Cucurbitaceae family [1]. It is cultivated in tropical regions, mainly in Asian and African countries, where its fruits are consumed as an essential vegetable for many culinary uses and commonly exploited for medicinal purposes [1,2]. For instance, pharmacological investigations have proved that bitter melon possesses diverse health-promoting abilities, such as antidiabetic, anti-cancer, anti-obesity, anti-neurodegenerative, antioxidant, and anti-dyslipidemia properties [2,3,4,5,6,7,8]. It has also shown potential for treating SARS-CoV-2 [9]. Its fruits are mainly consumed immature due to their typical bitter flavor induced by the high accumulation of cucurbitacins (cucuriate triterpenoids) [10]. Preferences for bitter melon fruits are attributable to many traits, among which fruit color and fruit ridges are the most critical [10]. As per cucumber, bitter melon fruit displays a variety of colors ranging from white to dark green. QTLs and candidate genes underlying the variation in bitter melon fruit ridges and yield-related traits have been explored [10,11]. However, the molecular determinant of the fruit pericarp pigmentation remains elusive. Fruit color determines essential quality traits and has been the interest of tremendous studies in many horticultural crops, such as apple [12], cucumber [13,14], mango [15], raspberry [16], papaya [17], chokecherry [18], banana [19], etc. These studies have provided vital molecular resources for breeding preferential fruits in these crops. Hence, the molecular dissection of BMP pigmentation mechanisms will generate key targetable metabolic resources for improving the quality and commercial values of bitter gourd fruits.
Fruit color is primarily determined by anthocyanins, a subclass of flavonoid compounds widely distributed in higher plants [20,21]. The most commonly found anthocyanidins are cyanidin, pelargonidin, delphinidin, petunidin, peonidin, and malvidin, and these compounds display different colors varying from red and blue to purple depending on the pH, light, and temperature in plant cells [20]. For example, glycosylated cyanidins are the dominant pigments in apple, berry, and dark red Chinese cherry [12,20,22]. Petunidins and malvidins are the major pigments of black currants and matured darker red wine, respectively [20]. In black goji, petunidin was also identified as the major pigment [23]. Apart from the primary anthocyanin pigments, other phenolic compounds, including carotenoids, chlorophyll, and other flavonoids (flavone, flavanone, flavanols, etc.), influence the final color appearance of fruits [14,24,25]. In cucumber, studies have shown that variations in the composition and amounts of carotenoids and chlorophyll contribute to the yellow, orange, red, light green, green, dark green, and white peel and flesh colors [13,14,26]. We thus hypothesized that color formation in bitter melon fruit might be a complex mechanism involving several metabolites and genes. Although flavonoid profiling of different colored BMPs was performed, no anthocyanin was detected, limiting the exploration of the pigmentation metabolism [27].
Anthocyanins are biosynthesized via the flavonoid pathway from phenylalanine through subsequent catalyzing action of multiple structural and regulatory genes. The main enzyme-encoding structural genes include PAL (phenylalanine ammonia-lyase), 4CL (4-coumarate-CoA ligase), C4H (cinnamate 4-hydroxylase), CHS (chalcone synthase), CHI (chalcone isomerase), F3′H (flavonoid 3′-hydroxylase), F3H (flavanone 3-hydroxylase), F3′5′H (flavonoid 3′,5′-hydroxylase), DFR (dihydroflavonol-4-reductase), ANS/LDOX (anthocyanidin synthase/leucoanthocyanidin dioxygenase), UFGT (UDP-glucose: flavonoid-3-Oglucosyl-transferase), and LAR (leucoanthocyanidin reductase), ANR (anthocyanidin reductase), and GST (glutathione S-transferase) [20,24,28]. The expressions of these genes are regulated by a complex of TFs (transcription factors) at the transcriptional levels. This complex is composed of R2R3-MYBs, bHLHs (basic helix–loop–helix), and WD40 proteins (MBW complex) [20,24,28]. Of them, MYBs play critical roles in regulating the composition and concentration of anthocyanins in plant organs [29,30,31]. In addition to these TFs, many other TFs, such as NAC, bZIP, WRKY, SPL, GATA, etc., network with the MBW complex to modulate the biosynthesis and storage of anthocyanins [24,28]. The anthocyanin component and regulation mechanisms vary depending on the species. Therefore, it is of significant interest to explore the potential candidate genes and reveal the molecular mechanism governing variation in anthocyanin levels of different colored bitter melon fruits. The integrative analysis of metabolome and transcriptome is the most common approach used to effectively break down the metabolic pathways and regulatory genes of diverse fruits’ pigmentation [18,22,32,33,34].
In the present study, we combined metabolomics and transcriptomics analyses of four differently colored bitter melon genotypes, including K1102 (grayish orange), 262 (grayish yellow), 1392 (very soft green), and K115 (dark grayish cyan), to unveil the key anthocyanins and potential candidate genes underlying variation in BMP colors. In addition, we investigated the pericarp pigmentation-associated molecular mechanisms and the variability of metabolites in the different colored BMPs. Our results deepen our understanding of bitter melon fruit color variation and lay a molecular foundation for suitable color breeding in the future.

2. Materials and Methods

2.1. Plant Material and Experimental Procedures

Four bitter melon varieties with different fruit colors, including K1102 (grayish orange), 262 (grayish yellow), 1392 (very soft green), and K115 (dark grayish cyan) (Figure 1A), were used in the present study. They were planted in the Modern Agricultural Science and Technology Innovation Demonstration Park of Sichuan Academy of Agricultural Sciences (30.77° N, 104.21° E) on 11 March 2022. The photon flux density ranged from 600–900 W m2. The temperature and relative humidity during the plants’ growth varied: 15–30 °C and 50–85%, respectively. The soil in this region is predominantly loam and slightly acidic with a pH of 6.6. Eighteen days after simultaneous pollination, fifteen fruits with a length of 10–30 cm and 4.2–6.7 cm in diameter were selected for each genotype. Then, the flesh in the middle of the fruit was immediately collected, mixed, and divided into two parts for transcriptome sequencing and metabolomics profiling. All samples were collected in triplicate. The collected samples were in situ, frozen in liquid nitrogen, and stored at −80 °C up until the analyses.

2.2. LC–MS-Based Widely Targeted Metabolomics Analysis

Freeze-dried pericarp samples’ powder (100 mg) was extracted at 4 °C (overnight) with 1.2 mL of 70% methanol. After centrifugation (15 min at 12,000× g), the supernatants were collected and filtrated with a 0.22 μm micropore membrane (SCAA-104, ANPEL, Shanghai, China). All extracts were stored at −20 °C up until the UPLC–ESI–QqQLIT–MS/MS analysis at MWDB (Metware Biotechnology Co., Ltd., Wuhan, China) [35,36,37]. All sample extracts were mixed equally to constitute quality control (QC) samples. The metabolomics was achieved as per previously described methods, and detailed information about the liquid phase and MS conditions is presented in Table S5 [36,37].
The spectrum information, retention times, and mass spectra were integrated for the qualitative identification of the metabolites. Specifically, the values of Q1 (precursor ions) and Q2 (product ion), retention times, and fragmentation patterns were compared with standards when available (Sigma-Aldrich, St. Louis, MO, USA). When no standards were available, the metabolites were identified via the database of MWDB and verified in public databases (MassBank, KNApSAcK, MoTo DB, HMDB, and METLIN) [35,36,38]. The relative contents of metabolites were computed via the MRM modes (triple quadrupole (QqQ) MS analysis).
The multivariate analyses were achieved after data quality validation and standardization. The PCA (principal component analysis), HCA (hierarchical clustering analysis), and OPLS-DA (orthogonal partial least squares discriminant analysis) analyses were carried out in R with the packages prcomp, pheatmap, and MetaboAnalystR (www.r-project.org), respectively. Significant DAMs (differentially accumulated metabolites) were screened out considering fold change (FC ≥ 1), VIP (variable important in projection) ≥ 1, and p-value < 0.05. Finally, DAMs functional annotation was conducted by mapping to the KEGG (Kyoto Encyclopedia of Genes and Genomes) database and subsequent significant enrichment analyses by MSEA (metabolite sets enrichment analysis).

2.3. RNA Extraction, Library Construction, and Sequencing

Total RNA from each flesh sample was extracted with a Trizol reagent kit (Invitrogen, Carlsbad, CA, USA) per the manufacturer’s instructions. The genomic DNA was discarded using DNase I (TaKaRa, Beijing, China). RNA quality was investigated on an Agilent 2100 Bioanalyzer (Agilent Technologies, Palo Alto, CA, USA) and quantified using the ND-2000 (NanoDrop Technologies). Only high-quality RNA (OD260/280 = 1.8~2.2, OD260/230 ≥ 2.0, RIN ≥ 6.5, 28S:18S ≥ 1.0, >1 μg) samples were used for sequencing library construction. The libraries were prepared with 1 μg of total RNA using the TruSeqTM Kit (Illumina, San Diego, CA). Next, fragmentation was followed by cDNA construction using the NEB Next Ultra RNA Library Prep Kit (NEB #7530, New England Biolabs, Ipswich, MA, USA). After adapters ligation, the resulting cDNA libraries were subjected to Illumina sequencing (HiSeq xten/NovaSeq6000 sequencer) at Gene Denovo Biotechnology Co. Ltd. (Guangzhou, China). The raw paired-end reads’ quality was assessed with SeqPrep (https://github.com/jstjohn/SeqPrep, accessed on 11 September 2022) and Sickle (https://github.com/najoshi/sickle, accessed on 11 September 2022). Thereafter, clean reads were aligned to the M. charantia L. reference genome (https://www.ncbi.nlm.nih.gov/genome/?term=bitter+Melon, accessed on 11 September 2022) by HISAT2 (http://ccb.jhu.edu/software/hisat2/index.shtml, accessed on 11 September 2022) software [39]. Finally, the mapped reads of each sample were assembled using StringTie (http://www.string-db.org/, accessed on 11 September 2022) [40].

2.4. Differentially Expressed Genes (DEGs) and Functional Enrichment Analysis

All transcript expression levels were computed via the TPM (transcripts per million reads) method. Next, RSEM (http://deweylab.biostat.wisc.edu/rsem/, accessed on 11 September 2022) was used for gene abundance quantification [41]. DEGs analysis was conducted with DESeq2 software (v 1.30.0) [42]. Significant DEGs were detected at FDR (false discovery rate) < 0.05 and |fold change| ≥ 1. GO (Genes Ontology, http://geneontology.org/, accessed on 11 September 2022) and KEGG (Kyoto Encyclopedia of Genes and Genomes, http://www.genome.jp/kegg/kaas, accessed on 11 September 2022) analyses were achieved with GO seq and KOBAS software (v2.0), respectively. Significant enrichment terms were identified at p-value < 0.05.

2.5. Quantitative RT-PCR Analysis

RNA was extracted from leaf samples (RNA Extraction Kit, Code No. 9769S, Takara, Beijing, China). Reverse transcription (RT) was conducted using the PrimeScriptTM 2II1st Strand cDNA Synthesis Kit (Code No. 6210A, Takara, Beijing, China). Quantitative RT-PCR was achieved as per the guidance in TB Green® Premix Ex TaqTM II (Code No. RR820A, Takara, Beijing, China). All samples had three biological and technical replicates. The PP2A (Serine/Threonine-protein phosphatase) gene was used as an internal control [43] to normalize the expression levels of target genes via the 2−ΔΔCT method [44]. Primers were designed with primer5 software (Table S4).

2.6. Data Analysis

Excel 2016 software and GraphPad Prism (v9.0.0121, La Jolla, CA, USA) were used for data processing and graph construction. TBtools software was used for heatmaps’ construction [45].

3. Results

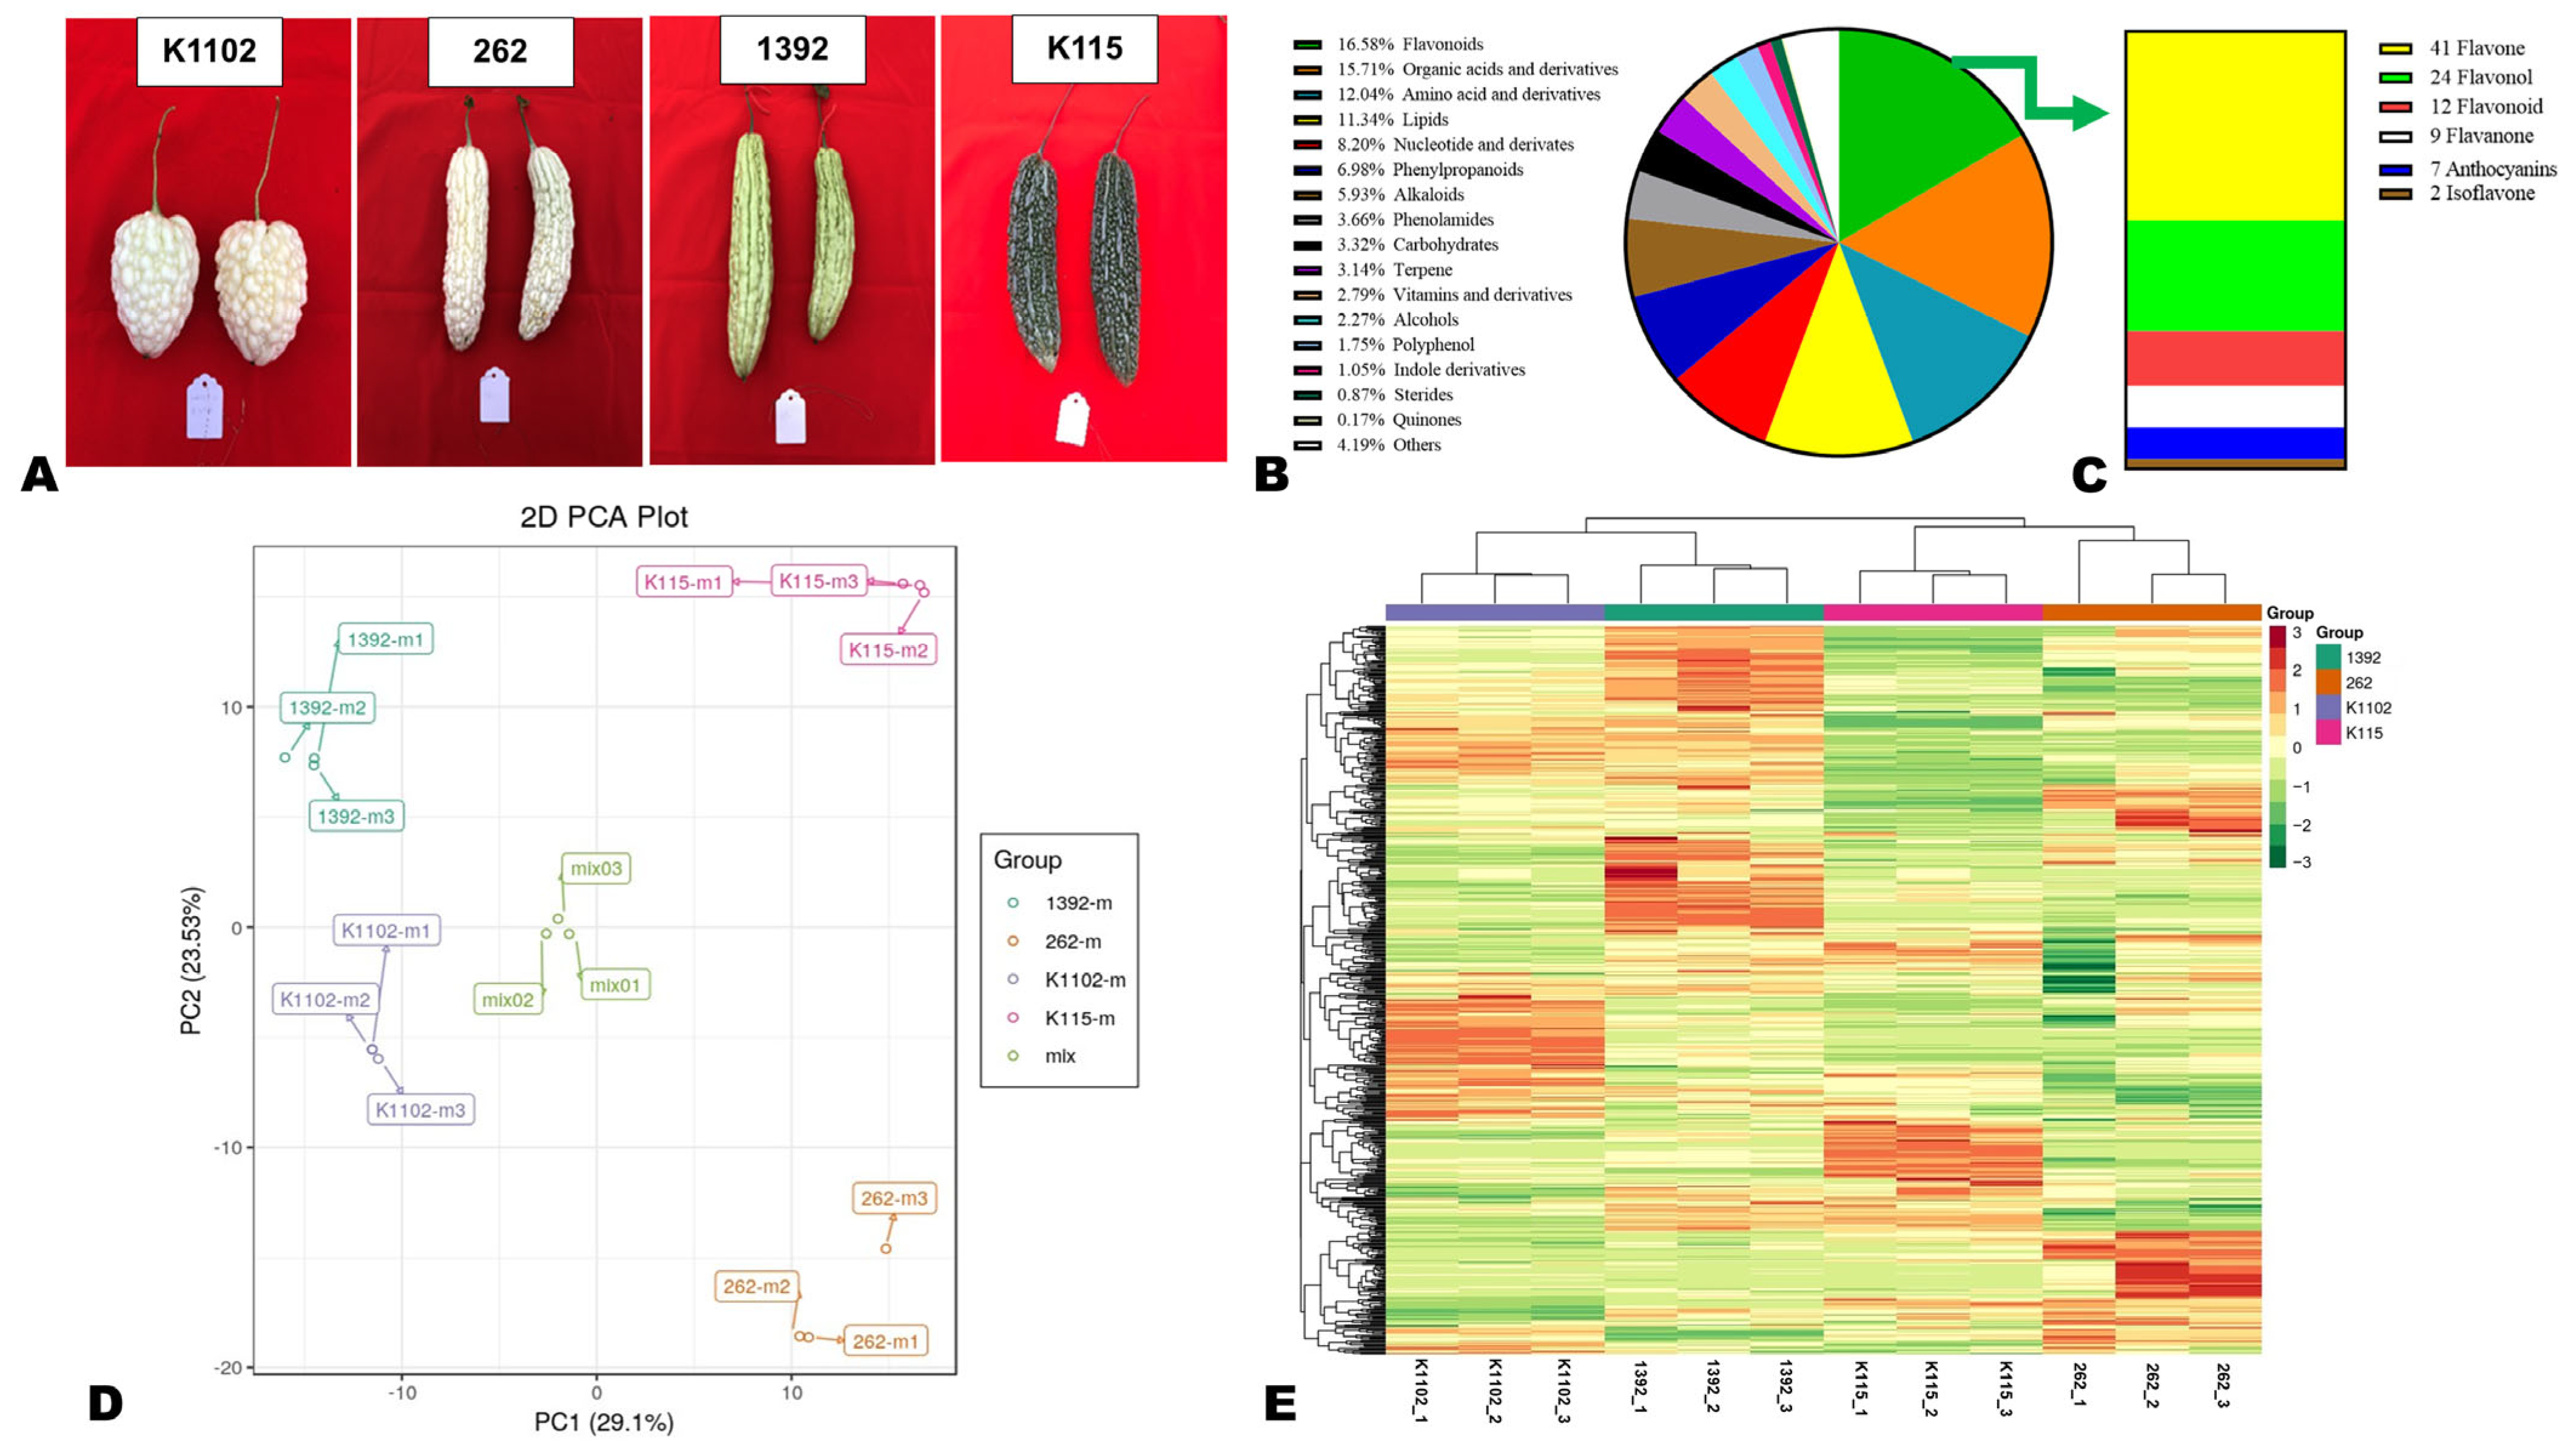
3.1. Metabolite Profiles of White, Grey White, Light Green, and Dark Green Bitter Melon Pericarps

To identify key metabolites associated with bitter melon pericarp (BMP) color variation, we conducted a widely targeted metabolomics analysis of K1102 (grayish orange), 262 (grayish yellow), 1392 (very soft green), and K115 (dark grayish cyan) pericarps (Figure 1A). We accurately identified a total of 573 metabolites (Table S1). The dominant metabolites were flavonoids (16.58%), organic acids and derivatives (15.71%), amino acids and derivatives (12.04%), lipids (11.34%), nucleotides and derivatives (8.20%), phenylpropanoids (6.98%), and alkaloids (5.93%) (Figure 1B). Of the flavonoids, flavones and flavonols were major, and only seven anthocyanins were identified (Figure 1C).
To explore metabolites’ differentiation and variability between the BMP of different colors, we carried out PCA, HCA, and correlations analyses (Figure 1D,E, and Figure S1). The PCA results showed that the metabolite profiles of different colored BMPs were very different as they clustered apart and could be discriminated by PC1 (29.10%) and PC2 (23.53%) (Figure 1D). All the QC samples were gathered together next to the PCA plot center, indicating the repeatability and reliability of the metabolomics analysis. As shown in Figure 1E and Figure S1, the results from HCA and correlation analyses confirmed the dissimilarity of the metabolite profiles of the K1102, 262, 1392, and K115 BMPs. Many metabolites exhibited higher relative content in 1392 (very soft green) compared to other colored pericarps (Figure 1E). For further confirmation of the observed differences in the metabolite profiles, we conducted OPLS-DA analyses. We obtained supportive results with high predictability and strong goodness of fit (R2Y = 1, Q2 ˃ 0.973) (Figure S2).

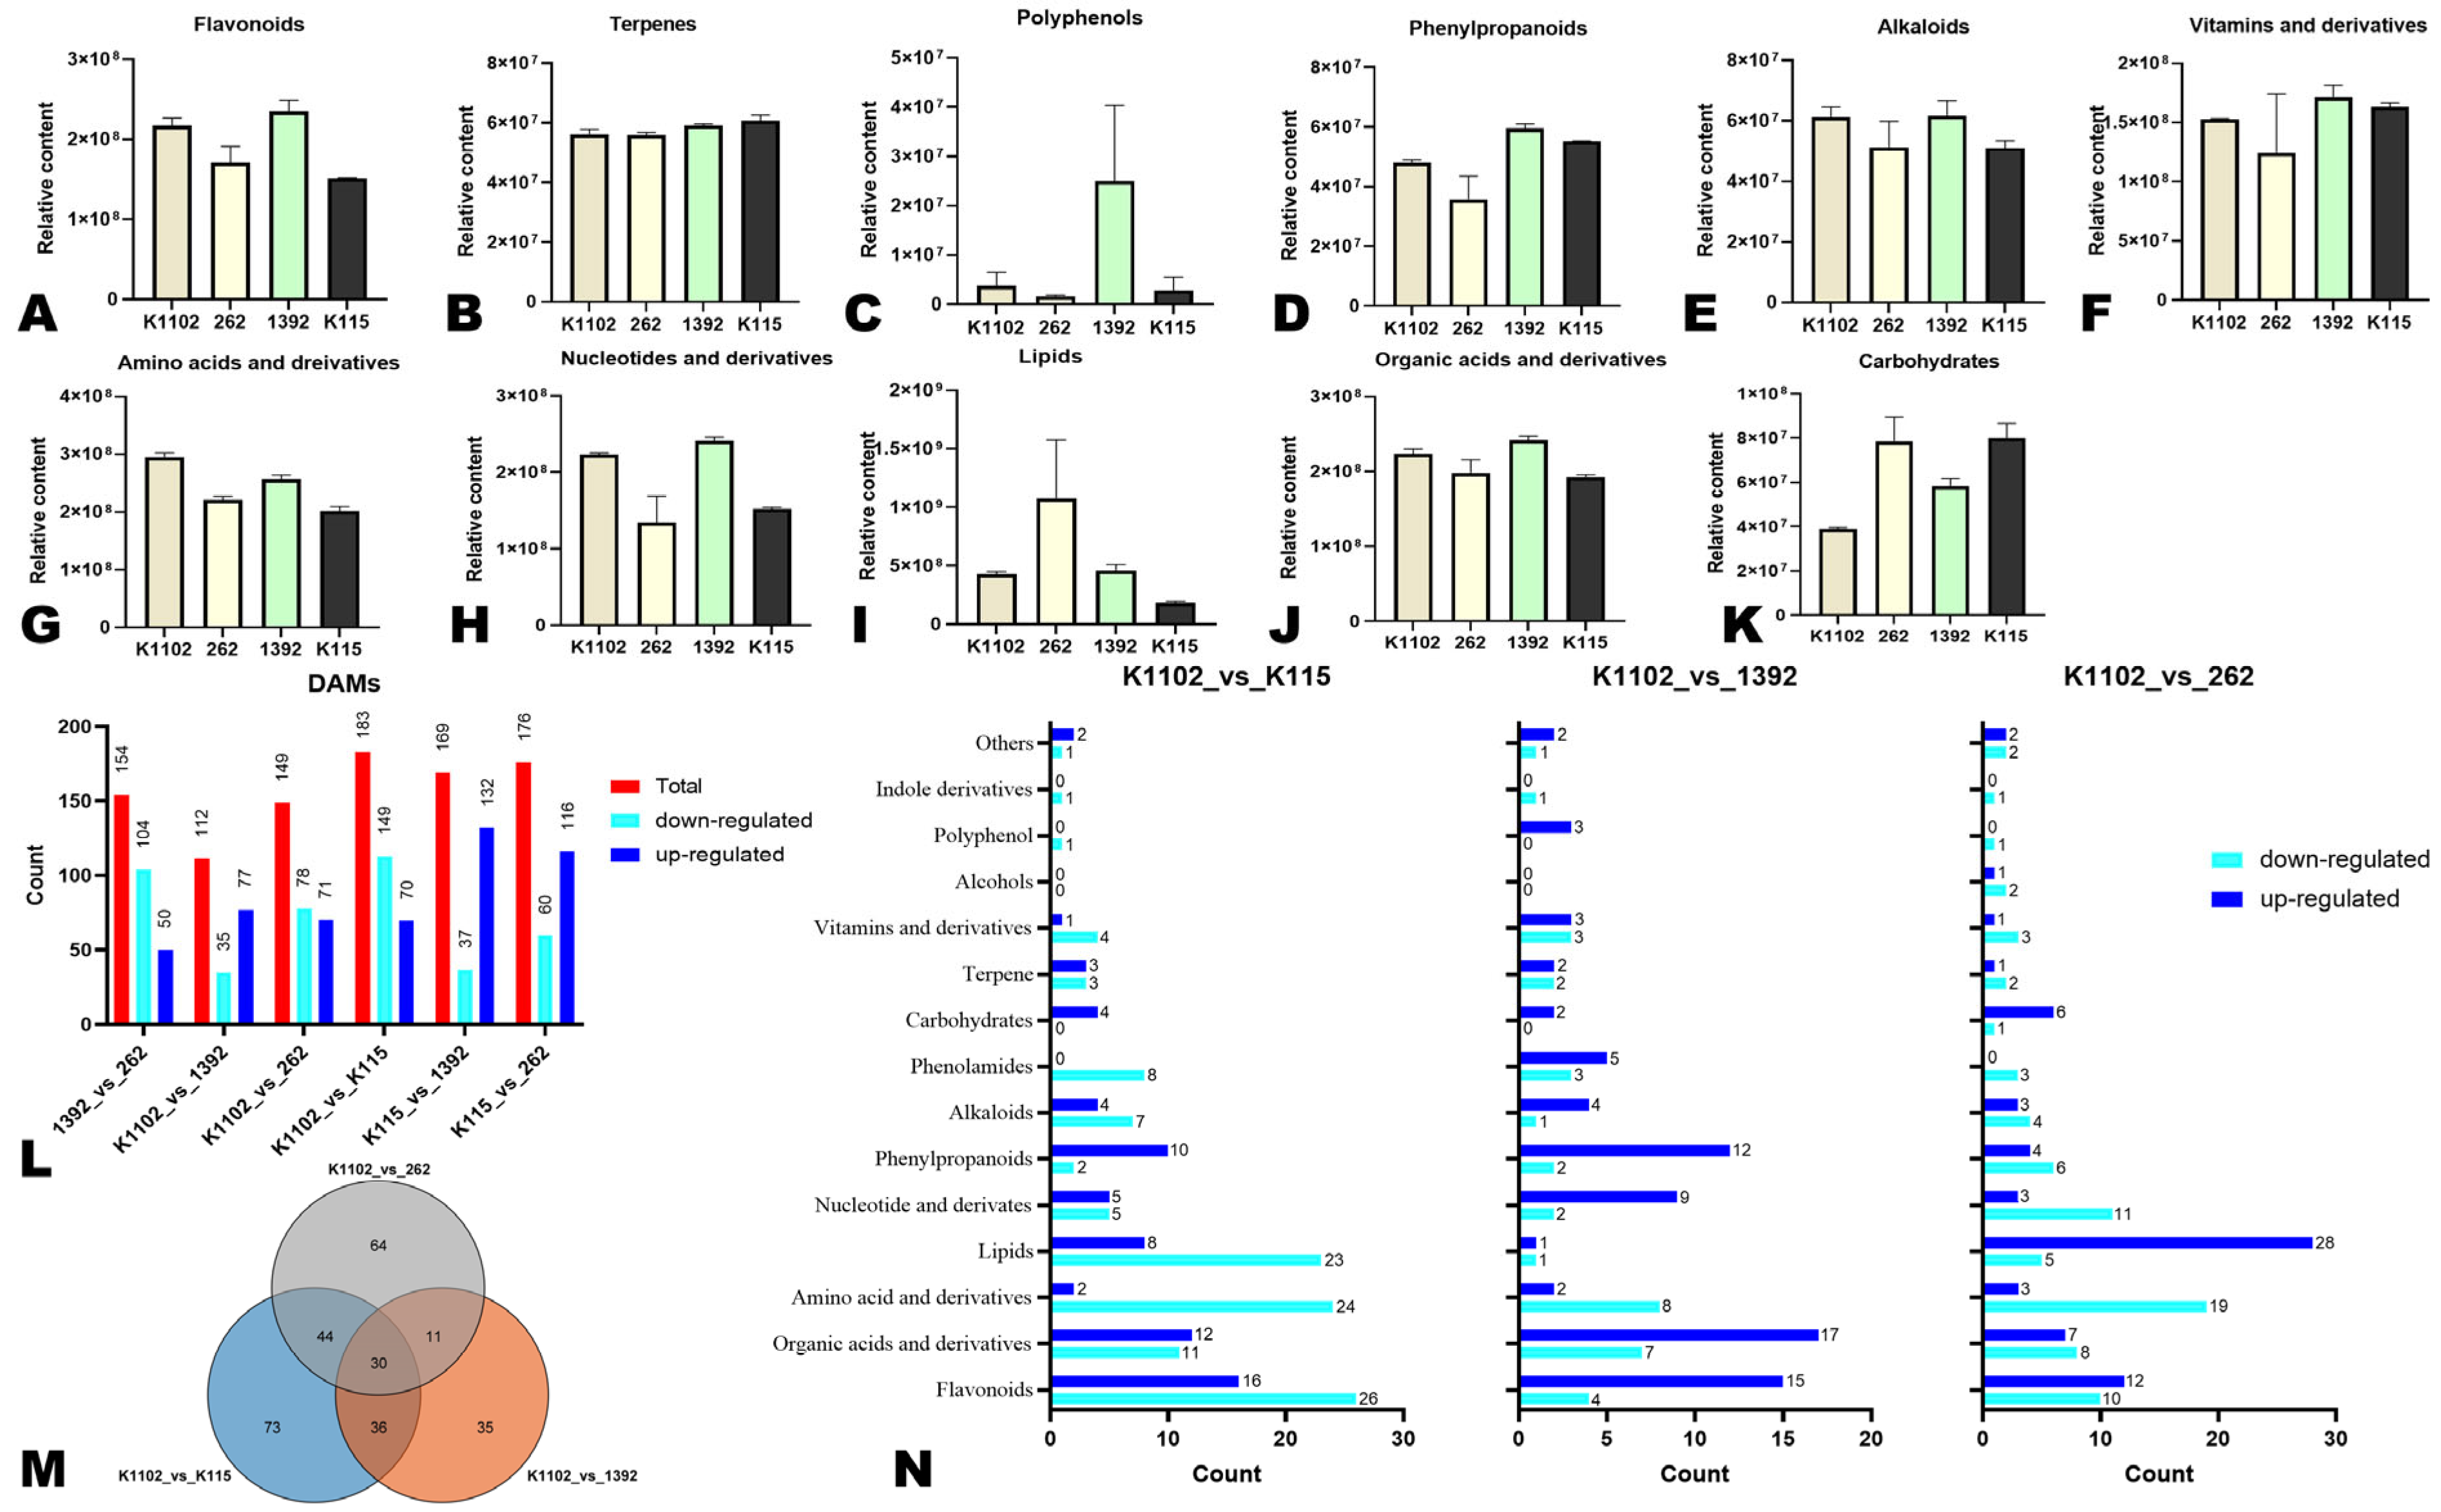
3.2. Variation in Important Metabolic Classes and Differentially Accumulated Metabolites (DAMs)

To explore the distribution characteristics of important metabolites in the different colored BMPs, we calculated the sum of the relative contents of metabolites within the same class and compared their levels in the four sample groups (Figure 2A–K). We observed no major differences in the relative content of terpenes, vitamins and derivatives, and alkaloids (Figure 2B,E,F). BMPs 1392 and 262 exhibited the highest relative content of polyphenols and lipids, respectively (Figure 2C,I). Compared to 262 and K115, K1102 and 1392 had higher relative content of flavonoids, amino acids and derivatives, nucleotides and derivatives, and organic acids and derivatives (Figure 2A,G,H,J). In contrast, 262 and K115 exhibited the highest relative content of carbohydrates (Figure 2K). BMP 1392 had the highest relative content of phenylpropanoids, followed by K115, K1102, and 262 (Figure 2D).
We performed DAMs analysis to uncover DAMs between the different colored BMPs and insights into the differentially regulated pathways. Significant DAMs in pairwise comparison between groups were identified as shown in the volcano plots in Figure S3. In total, 154 (50 up-regulated in 262), 112 (77 up-regulated in 1392), 149 (71 up-regulated in 262), 183 (70 up-regulated in K115), 169 (132 up-regulated in 1392), and 176 (116 up-regulated in 262) significant DAMs were identified in pairwise comparison between 1392_vs_262, K1102_vs_1392, K1102_vs_262, K1102_vs_K115, K115_vs_1392, and K115_vs_262, respectively (Figure 2L). To identify key DAMs, we took K1102 as the control group, and we constructed a Venn diagram (Figure 2M). The results revealed thirty metabolites belonging to diverse classes overlapped (Figure 2M, Table S2). The classification of DAMs in pairwise comparisons of other pericarp color groups against K1102 revealed that flavonoids and organic acids and derivatives were the most differentially accumulated across the different colored BMPs (Figure 2N). The KEGG functional analyses assigned the DAMs mainly to the biosynthesis of secondary metabolites, phenylpropanoids, and amino acids (Figure S4).

3.3. Major Flavonoid Pigments in the Different Colored Bitter Melon Pericarps

Flavonoids represent the most diversified class of phenolic compounds and are primarily associated with the variation in colors of plant organs [24,27]. Therefore, we examined the distribution characteristics of differentially accumulated flavonoids in the four color groups of BMPs (Figure 3). Most differentially accumulated flavones and flavonols had the highest relative content in 1392 (very soft green), followed by 262 (grayish yellow), K1102 (grayish orange), and K115 (dark grayish cyan) (Figure 3A,B). Among flavonoids, astibin and tiliroside exhibited the highest relative content in 262, while isorhamnetin 3-O-glucoside and narcissoside showed the highest content in 1392 (Figure 3C). K115 exhibited the lowest relative content of phloretin and hesperetin 5-O-glucoside, while K1102 had the lowest relative content of hesperetin O-malonylhexoside and xanthohumol (Figure 3D). Anthocyanins are the main pigments of colored plant organs [20,21]. Our analysis revealed that K115 contained higher levels of four anthocyanins, including malvidin 3-O-glucoside (Oenin), rosinidin O-hexoside, cyanidin 3-p-hydroxybenzoylsophoroside-5-glucoside, and petunidin 3-O-glucoside (Figure 3E). We then inferred that they might represent the key pigments of dark grayish cyan BMP. Similarly, cyanidin and petunidin 3-O-glucoside might be the major pigment in soft green BMP, while cyanidin 3-p-hydroxybenzoylsophoroside-5-glucoside and pelargonidin 3-O-beta-D-glucoside might be the key pigment in grayish yellow BMP (Figure 3E). Cyanidin, cyanidin 3-p-hydroxybenzoylsophoroside-5-glucoside, and pelargonidin 3-O-beta-D-glucoside showed higher relative content in K1102 (grayish orange) (Figure 3E). Variations in the accumulation patterns of these six anthocyanins may represent the major underlying factor for BMP color changes (Figure 3E).

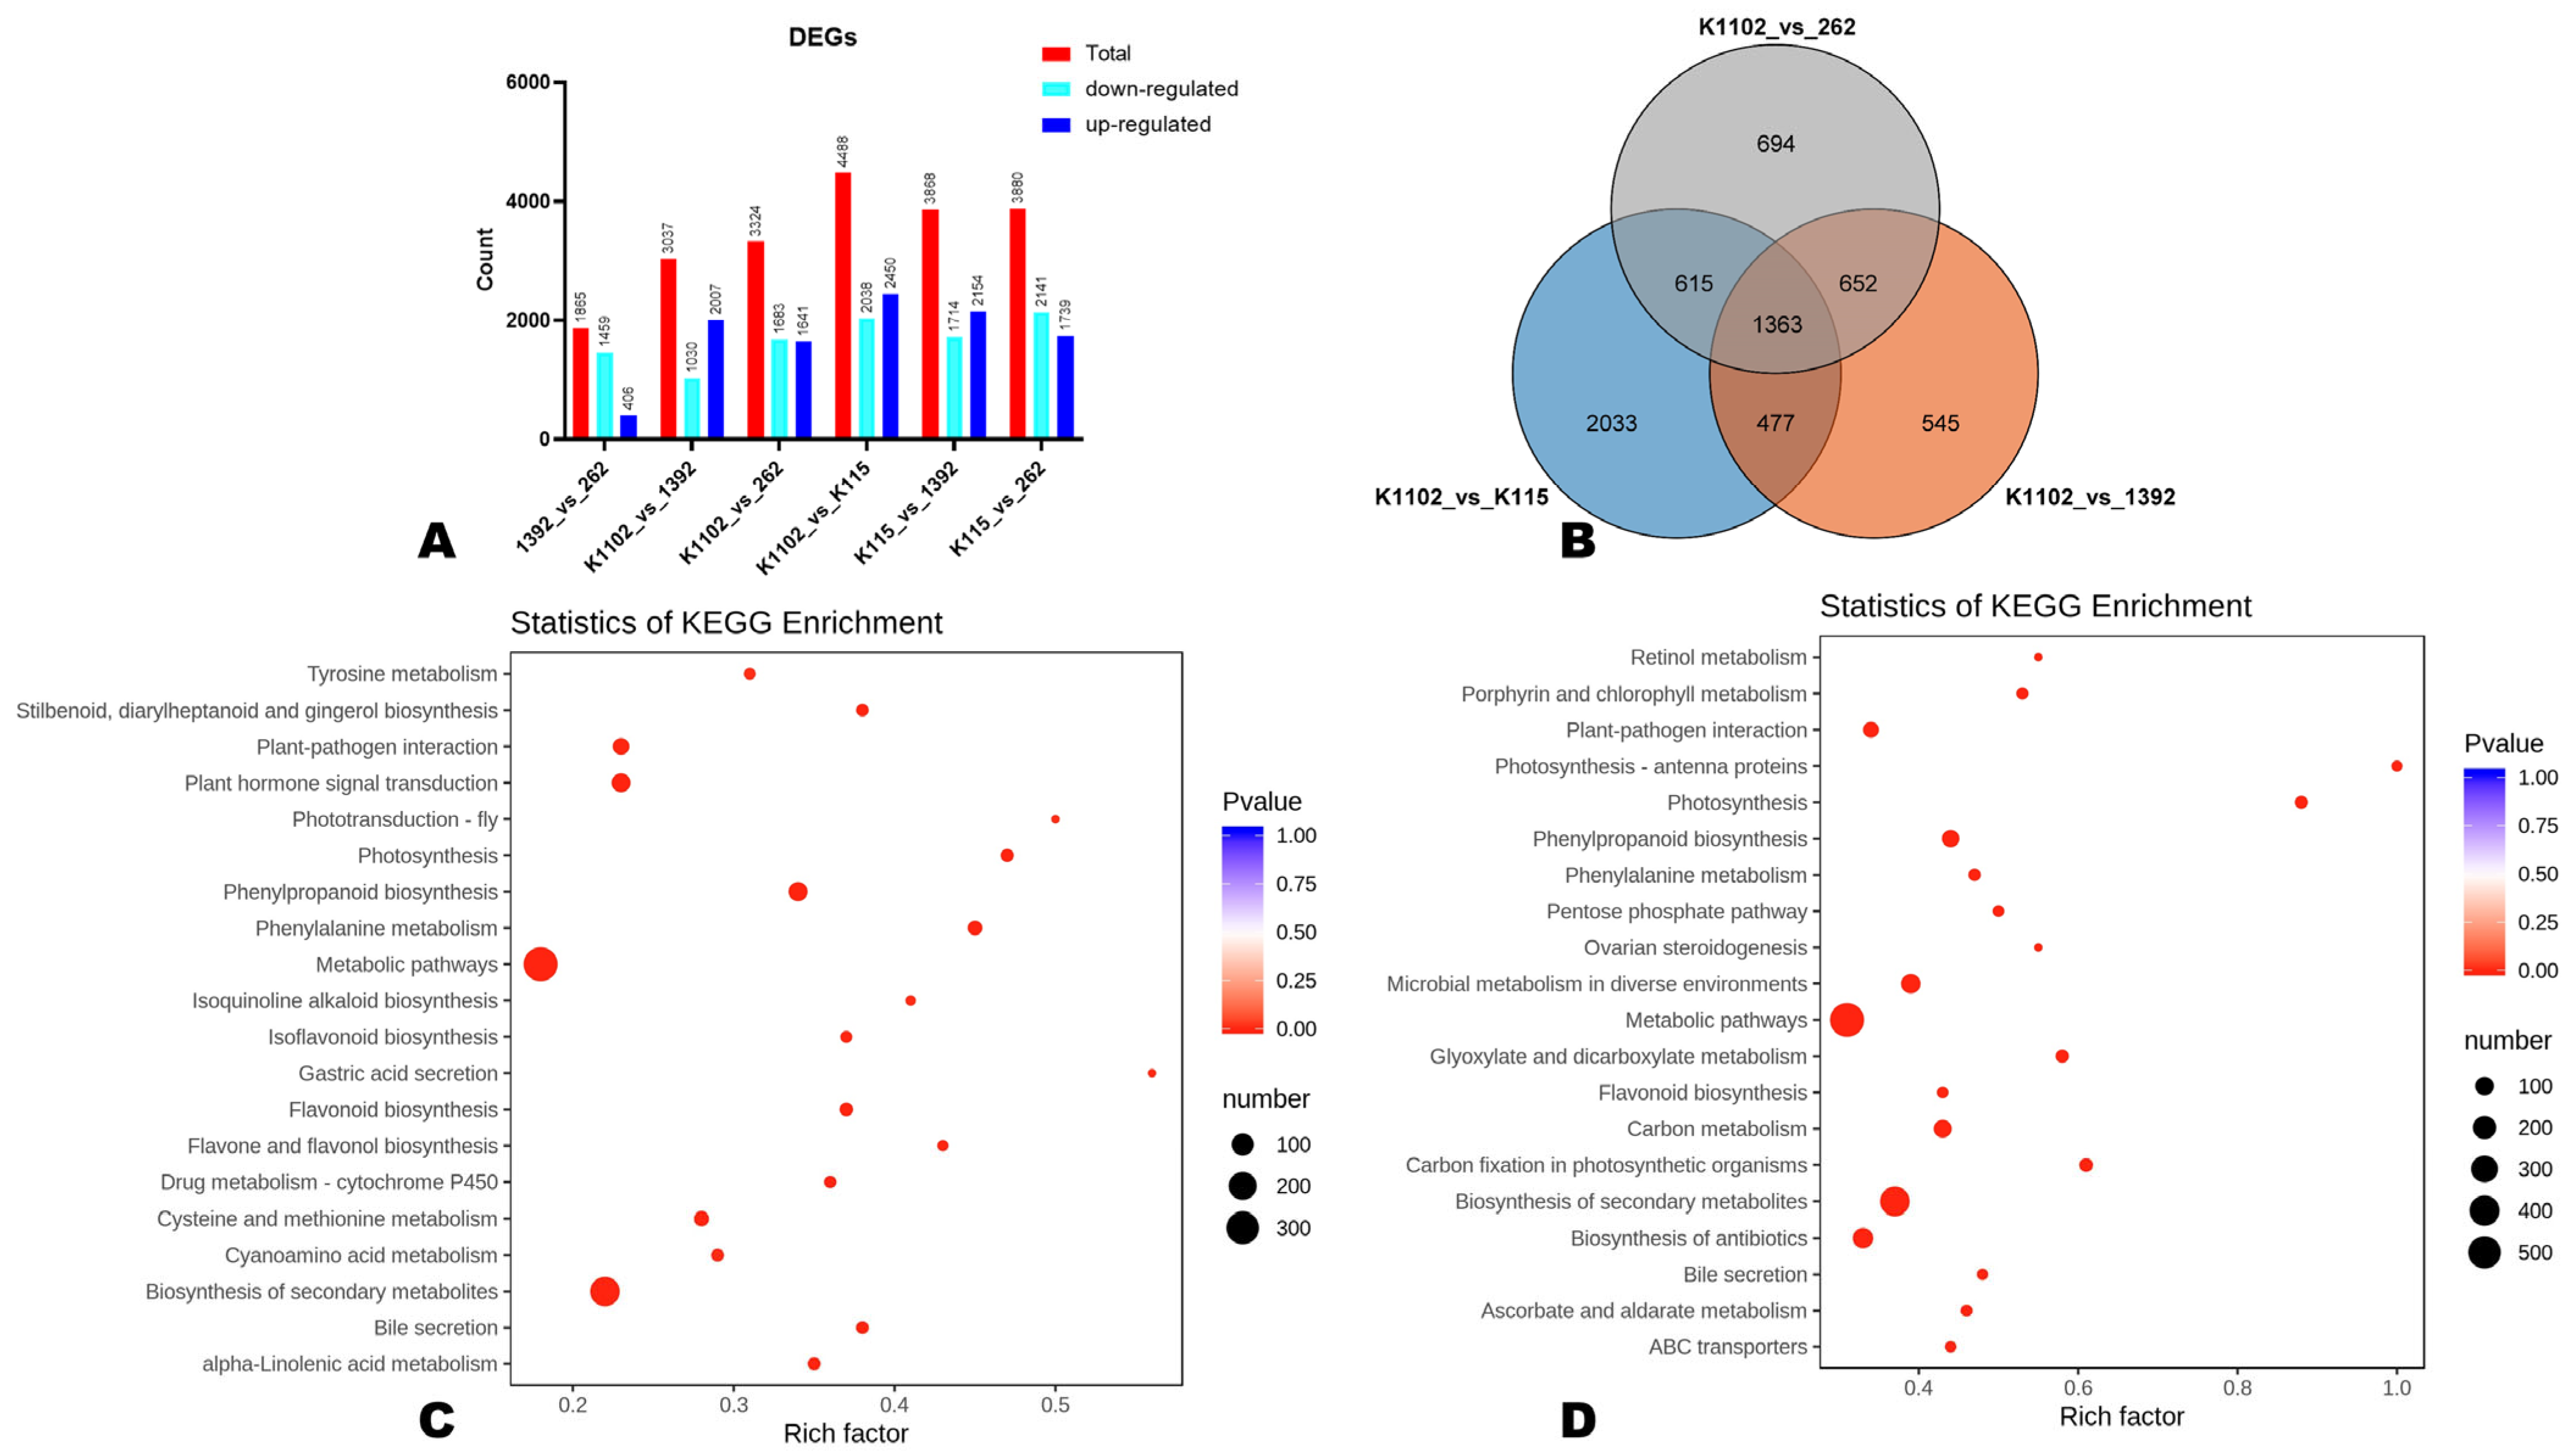
3.4. Comparative Transcriptome Sequencing and Differentially Expressed Genes (DEGs)

To provide more insights into the BMP pigmentation mechanisms, we subjected the four different colored pericarp samples to transcriptome sequencing. The RNA sequencing yielded 40.63–49.18 Mb of raw reads, with higher quality clean reads of 40.1–48.54 Mb (Table S3). The Q20, Q30, and GC contents varied from 95.66 to 96.65%, from 89.38 to 91.28%, and from 45.42 to 45.73%, respectively (Table S3). The total and unique mapping rates against the reference genome were 82.61–86.23% and 77.75–82.09%, respectively (Table S3). Samples of the same groups displayed significantly higher correlations, indicating the repeatability of the transcriptomics analysis (Figure S5B). The 1392 and 262 samples clustered closely on the PCA pot and exhibited high correlations (r = 0.92), suggesting no major transcriptional differences in grayish orange and soft green BMPs (Figure S5A,B). To verify the reliability of the RNA-seq data, we randomly selected ten genes for qRT-PCR analysis. As shown in Figure S6, the expressions of these genes by RNA-seq and qRT-PCR were very consistent (R2 = 0.91), confirming that the transcriptome data are reliable.
To explore transcriptional changes, all DEGs in pairwise comparisons were filtered out. A total of 3324 (1641 up-regulated), 3037 (2007 up-regulated), and 4488 (2450 up-regulated) DEGs in pairwise comparisons between K1102_vs_262, K1102_vs_1392, and K1102_vs_K115, respectively, were identified (Figure 4A). The volcano plots are shown in Figure S7. A Venn diagram shows that 1363 DEGs were common in the three pairwise comparisons (Figure 4B). GO annotation and enrichment analysis assigned the DEGs to diverse cellular processes, such as tetrapyrrole binding, phenylpropanoid biosynthesis, secondary metabolism, etc. (Figure S8). The KEGG analysis results were supportive of those of GO (Figure 4C,D, and Figure S9). However, the flavonoid biosynthesis and tyrosine metabolism were also enriched (Figure 4C,D).

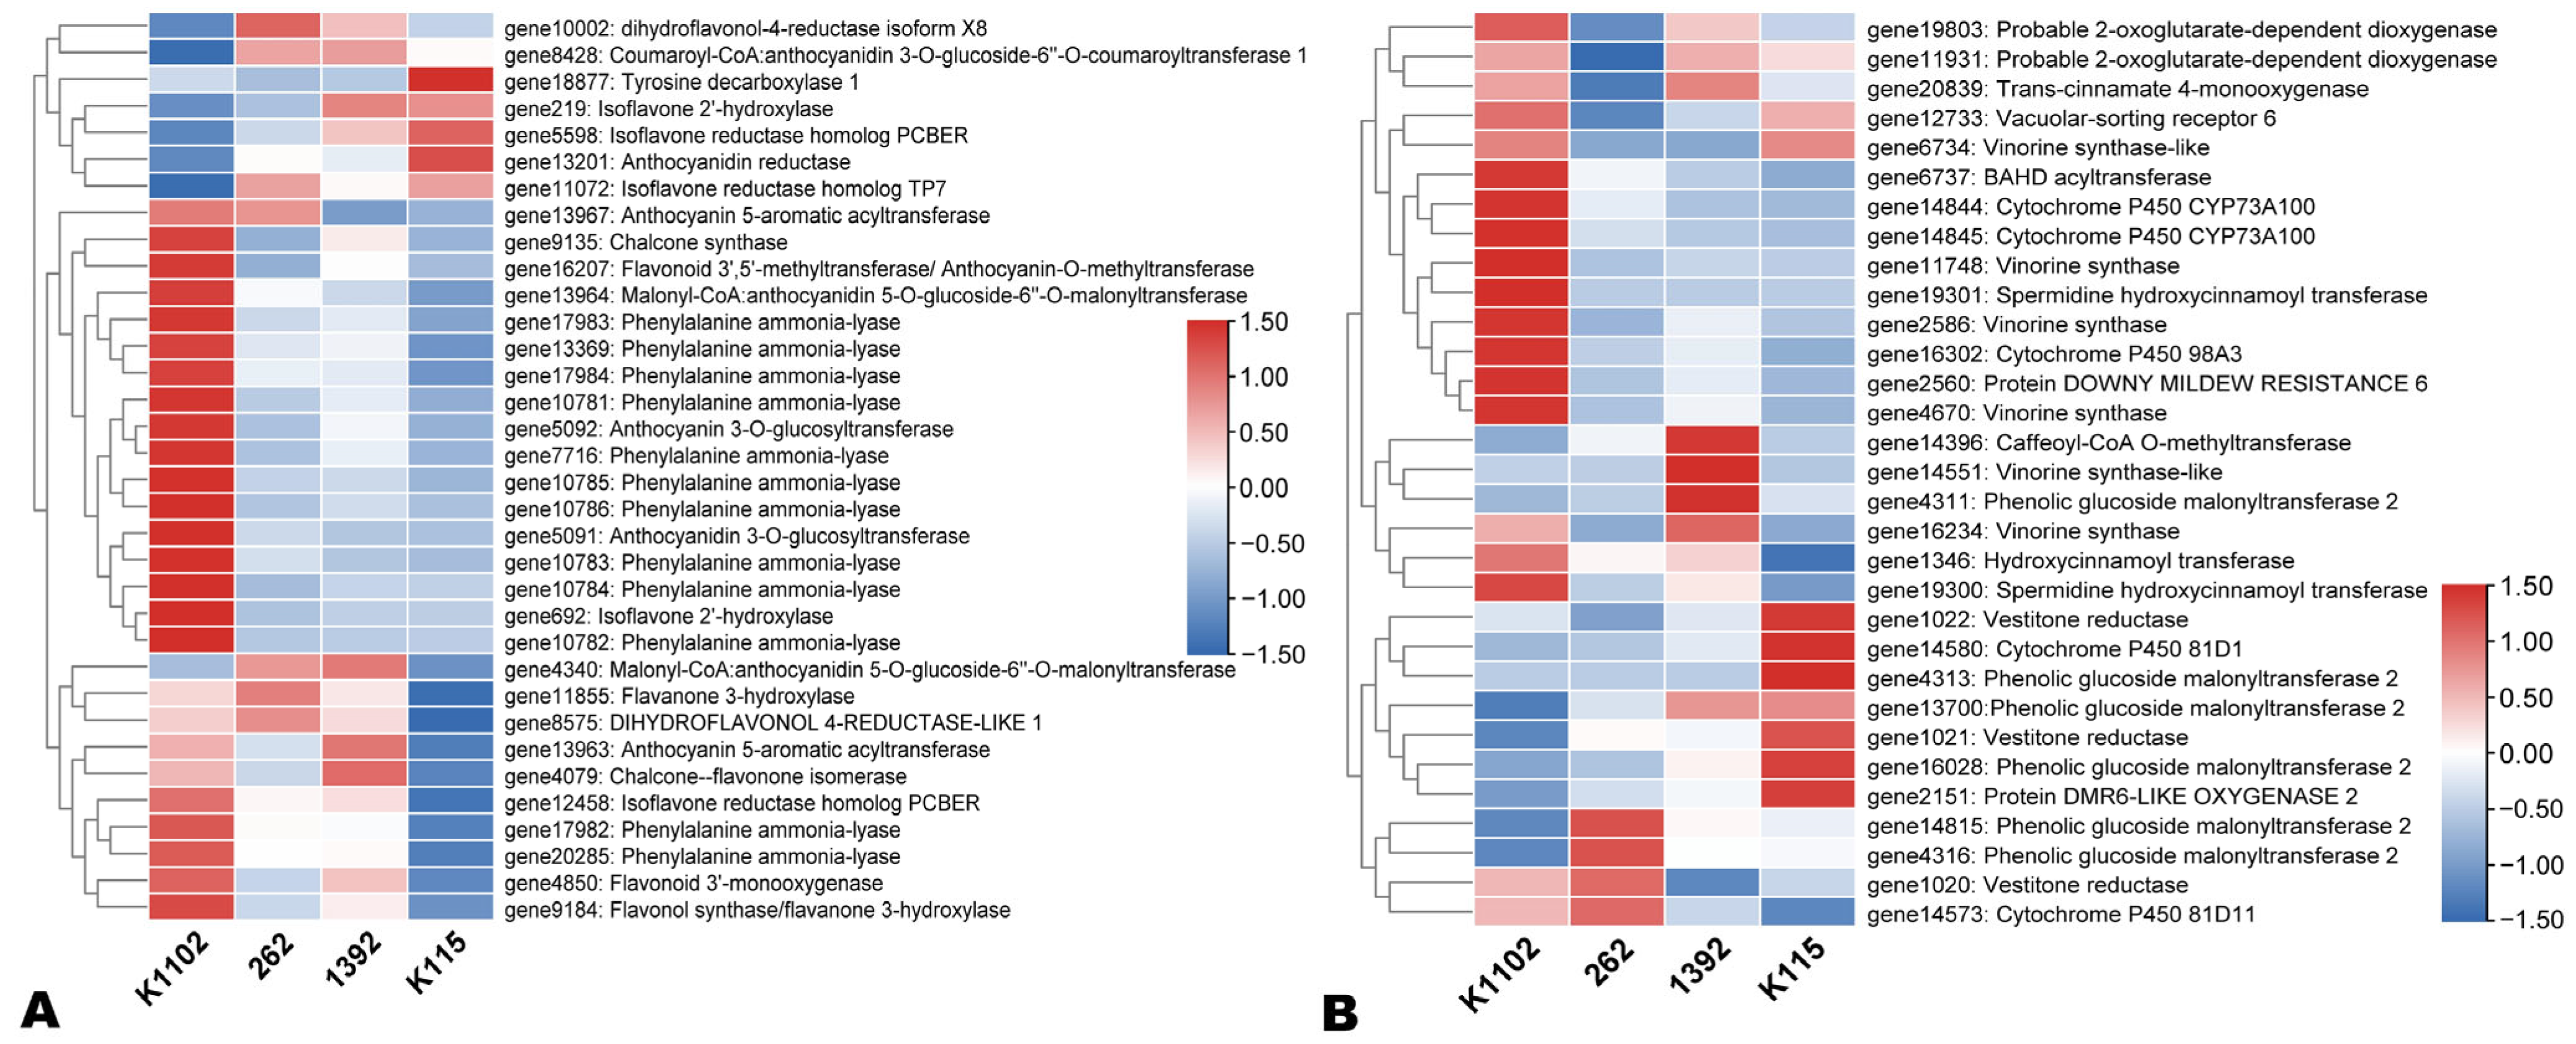
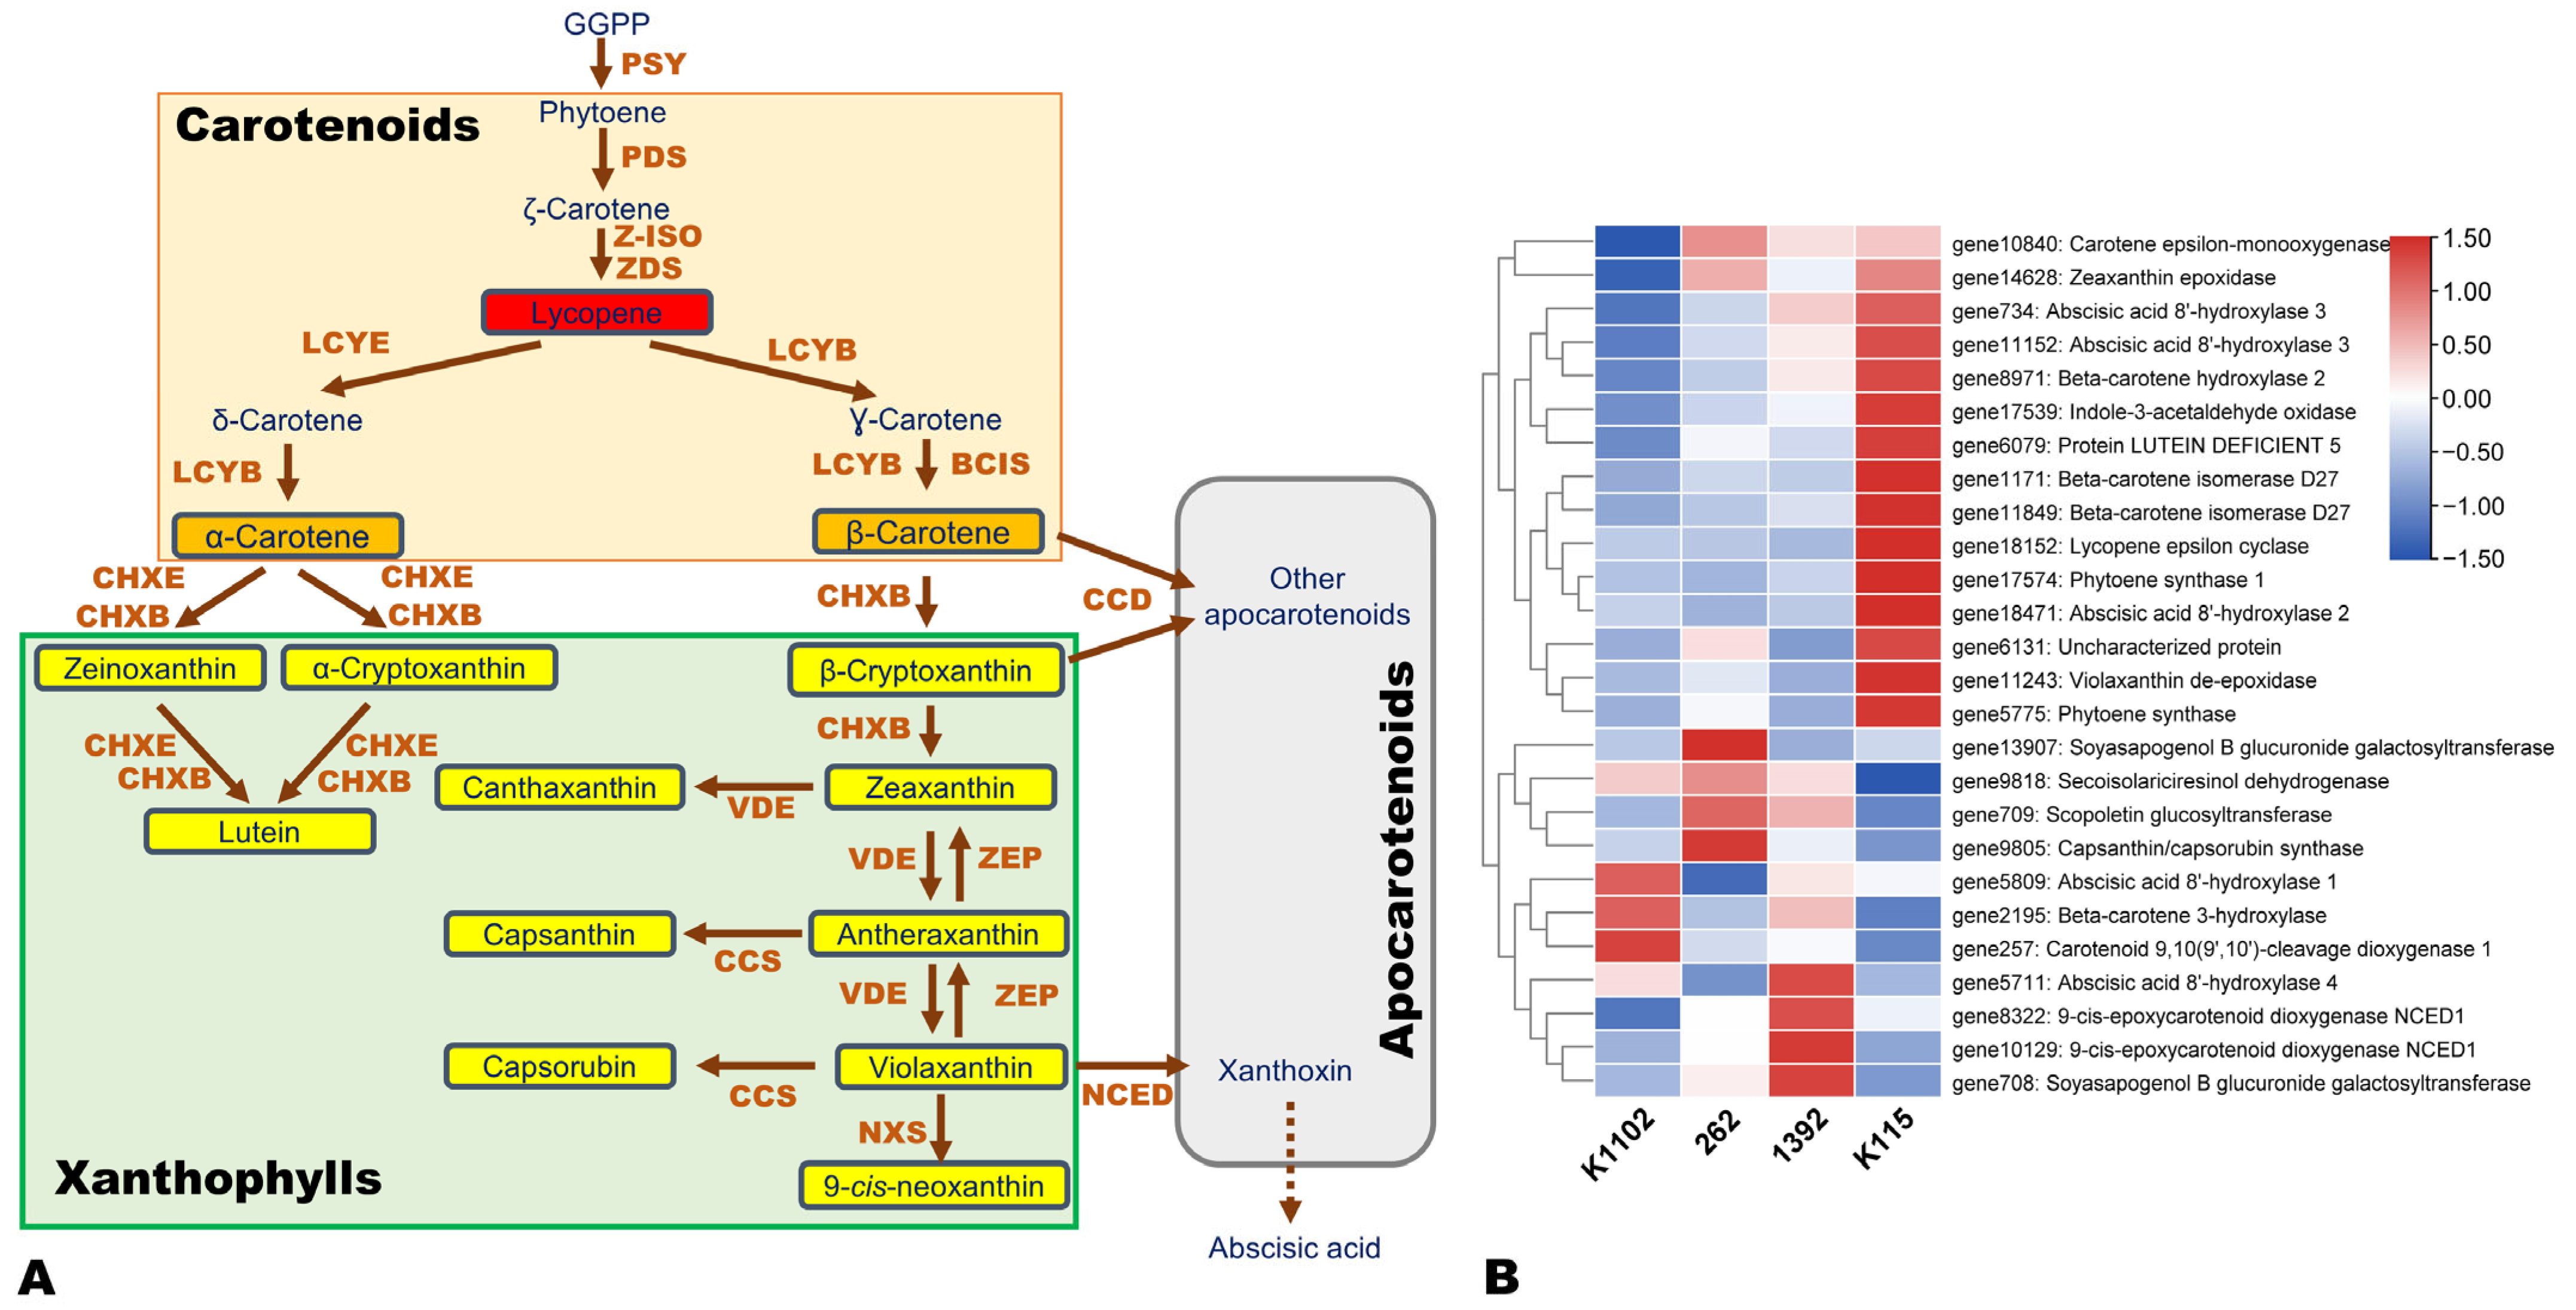
3.5. Expression Patterns of Flavonoid, Carotenoid, and Other Pigment Biosynthesis-Related DEGs

To identify key genes involved in BMP pigmentation, we examined the expression patterns of DEGs related to flavonoid biosynthesis (ko00941, ko00942, ko00943, ko00944), carotenoid biosynthesis (ko00906), and pigment biosynthesis (GO:0046148). Most of the flavonoid biosynthesis-related genes, such as phenylalanine ammonia-lyases, chalcone synthase (gene9135), chalcone isomerase (gene4079), flavonoid 3′-monoxygenase (gene4850), flavonol synthase (gene9134), vinorine synthase, anthocyanidin 3-O-glucosyltransferase (gene5091 and gene5092), etc., were highly induced in K1102, followed by 1392 and 262 (Figure 5A,B). gene18877 (tyrosine decarboxylase 1), gene219 (isoflavone 2′-hydroxylase), gene5598 (isoflavone reductase homolog PCBER), gene13201 (anthocyanin reductase, ANR), and gene11072 (isoflavone reductase homolog TP7) were significantly up-regulated in K115 compared to others (Figure 5A). Meanwhile, gene10002 (dihydroflavonol-4-reductase isoform X8) and gene8428 (coumaroyl-CoA:anthocyanidin 3-O-glucoside-6″-O-coumaroyltransferase 1) were also significantly up-regulated in 262 and 1392 compared to others (Figure 5A). Genes encoding phenolic glucoside malonyltransferase 2 were also induced in all colored BMPs except K1102 (Figure 5B).
As shown in Figure 6, most carotenoid catabolism-related genes, such as abscisic acid 8’-hydroxylase (gene11152, gene734, gene18471, gene5711, and gene5809), carotene epsilon-monooxygenase (gene10840), 9-cis-epoxycarotenoid dioxygenase (gene8322, and gene10129), zeaxanthin epoxidase (gene14628), beta-carotene hydroxylase 2 (gene8971), protein LUTEIN DEFICIENT 5 (gene6079), etc., were highly induced in other colored BMPs compared to the grayish orange (K1102). Most other pigment biosynthesis-related genes, including gene8173 (polyphenol oxidase), gene15171 (tetrapyrrole-binding protein), gene12160 (protein neoxanthin-deficiency), etc., were highly up-regulated in K115 compared to others (Figure S10).

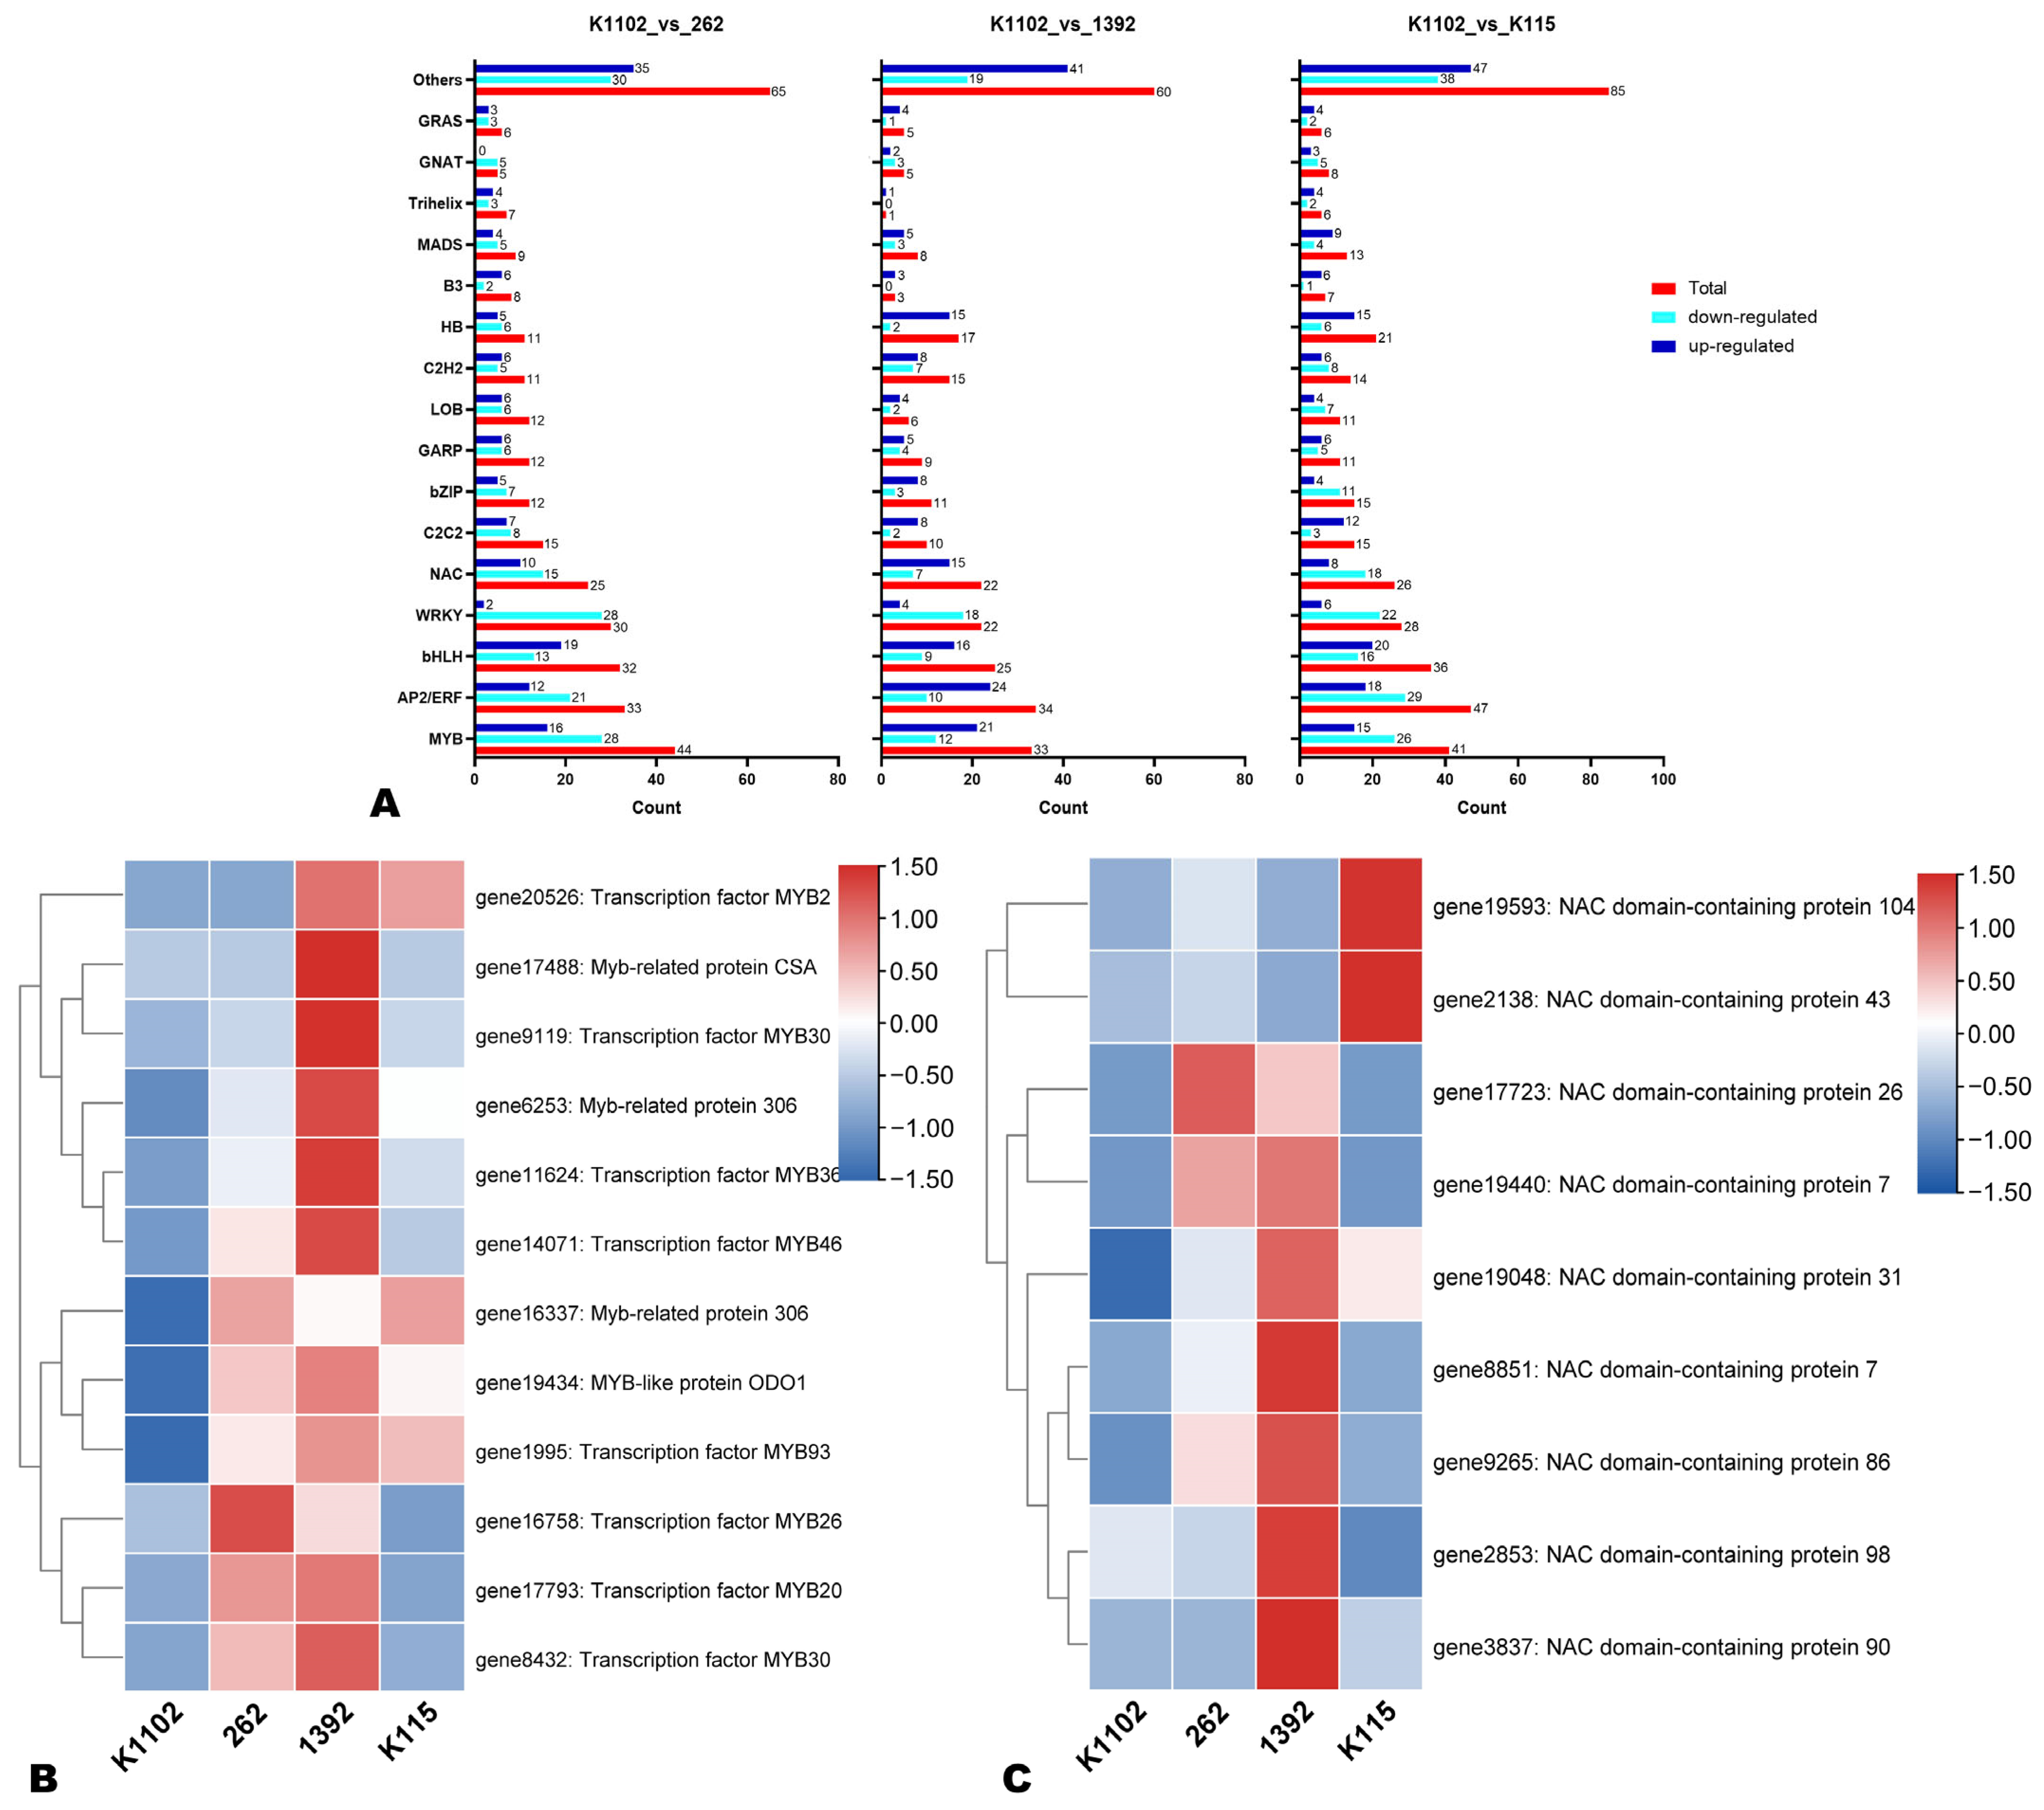
3.6. Potential Candidate Transcription Factors (TFs) Regulating Bitter Melon Pericarp Pigmentation

TFs are key regulators of plant developmental and biochemical processes. To identify potential TF family genes that may govern BMP pigmentation, we screened out all DEGs encoding TFs. In total, we identified 337, 286, and 390 differentially expressed TFs in pairwise comparisons between K1102_vs_262, K1102_vs_1392, and K1102_vs_K115, respectively. MYB, AP2/ERF, bHLH, WRKY, and NAC were the major differentially expressed TFs (Figure 7A). We mainly focused on significantly up-regulated (Log2FC ≥ 3) MYBs, NACs, EP2/ERF, bHLHs, bZIPs, and MADSs with regard to their major roles in regulating flavonoid biosynthesis [20,24,28]. Most MYB (MYB30, MYB303, MYB36, MYB46, MYB20, etc.) and NAC (NAC7, NAC31, NAC26, NAC86, NAC90, and NAC98) genes were highly induced in other colored BMPs compared to K1102, particularly in 1392 (soft green) (Figure 7A,B). Three MYB (MYB2, MYB306, and MYB93) and two NAC (NAC104 and NAC43) genes exhibited high expression in K115 (dark grayish cyan) pericarp (Figure 7A,B). Meanwhile, MYB26 and NAC26 were the most induced in 262 (grayish yellow pericarp) (Figure 7A,B). Regarding other TFs, four ERFs (gene4902, ERF054, ERF2, and ERF106), one bHLH (bHLH97), and three MADSs (AGL12, AGL8, and EJ2) were highly induced in K115 (Figure S9). Two bHLHs (MYC4 and bHLH94) and two bZIPs (bZIP44 and bZIP61) were highly up-regulated in 262 (Figure S11). In 1392, two bHLHs (AIG1 and bHLH126) were also highly induced (Figure S11).
To facilitate an overview of the main anthocyanins and flavonoid structural and regulatory genes involved in BMP color variation, we constructed a diagram that integrates the main results by metabolomics and transcriptomics. These key findings are presented in Figure 8.

4. Discussion

Fruit color is one of the most critical traits affecting fruits’ commercial and quality values. Hence, deciphering and understanding the molecular regulation of color formation in fruit crops is essential to uncover key metabolic and genetic resources for breeding novel fruit varieties of high consumer preference and economic value. Accordingly, this study took advantage of advanced metabolomics and transcriptomics tools to provide insights into the mechanisms underlying the pericarp color of four bitter melon genotypes, including K1102 (grayish orange), 262 (grayish yellow), 1392 (very soft green), and K115 (dark grayish cyan).
The metabolomics analysis revealed a great variation in the metabolite profiles of the four different colored BMPs. K1102, 262, 1392, and K115 samples clustered separately on the PCA and HCA plots and accumulated different levels of important metabolites, such as alkaloids, flavonoids, polyphenols, lipids, amino acids and derivatives, carbohydrates, etc. These results indicate that fruit color may significantly influence bitter gourd fruits’ quality and medicinal values. Fruit of different colors may display considerable variations in pharmaceutical and therapeutical attributes. Supportively, Oude Griep et al. have demonstrated that the ability of fruits and vegetables to treat coronary heart diseases varies depending on their color [46]. Furthermore, these findings corroborate with reports in other fruit crops [12,14,47]. All DAMs in pairwise comparisons between groups were identified, providing fundamental data for in-depth exploration of the variation in bioactive compounds among the four different colored BMPs. Thirty key overlapped DAMs were filtered out and could represent discriminatory metabolic markers to differentiate between BMPs of different colors. Metabolites’ diversity and variability are driven by different expression of genes regulating metabolic pathways. Concordantly, transcriptome sequencing and analysis revealed high numbers of significant DEGs across the four different colored BMPs. These results show that metabolism regulation in the four different colored BMPs is different, and further interest should be given to pathways related to the fruit quality traits.
Anthocyanins are the main metabolic compounds that determine the color of fruits [20,21]. Our analysis unveiled that variation in the levels of six anthocyanins, including malvidin 3-O-glucoside, petunidin 3-O-glucoside, rosinidin O-hexoside, cyanidin, cyanidin 3-p-hydroxybenzoylsophoroside-5-glucoside, and pelargonidin 3-O-beta-D-glucoside, is the major driving factor of fruit color variation in bitter melon. Compared to K115, the other BMPs exhibited higher relative content of most differentially accumulated flavones, flavonols, flavanones, and flavonoids. Accordingly, we found that many flavonoid pathway structural genes were differentially regulated in the four different colored BMPs. Besides anthocyanins, carotenoids, xanthophylls, chlorophyll [25], and other flavonoids [24] contribute to the final color appearance of fruits [14]. For instance, studies have revealed that variations in the composition and amounts of carotenoids and chlorophyll contribute to the yellow, orange, red [26], light green, green, dark green, and white peel and flesh colors in cucumber [13,14]. The examination of DEGs related to carotenoid metabolism showed that the carotenoid catabolism-related genes were not induced in K1102, 262, and 1392. Moreover, tetrapyrrole-binding protein (related to chlorophyll accumulation) genes were significantly down-regulated in K1102 and 262. Taken together, these results show that the grayish orange and grayish yellow colors of K1102 and 262 fruits, respectively, may be due to co-pigmentation between anthocyanins, other flavonoids, carotenoids, and xanthophylls, with cyanidins and pelargonidins being the major pigments. Pelargonidin is known for its natural orange color [20]. The very soft green color of 1392 may result from a co-pigmentation between anthocyanin (mainly cyanidin and petunidin 3-O-glucoside), other flavonoids, chlorophyll, xanthophylls, and carotenoids. Further quantification of chlorophyll and carotenoid contents of different colored BMPs is required to confirm these statements.
K115 displayed a higher content of malvidin 3-O-glucoside, rosinidin O-hexoside, petunidin 3-O-glucoside (dominant pigments), cyanidin 3-p-hydroxybenzoylsophoroside-5-glucoside, and low relatively contents of other flavonoids. Tetrapyrrole-binding protein, carotenoid catabolism, and ABA metabolism-related genes were highly induced in K115 compared to other BMPs. These results indicate that the dark grayish cyan color of K115 may be due to a co-pigmentation between these four anthocyanins and chlorophyll, with malvidin 3-O-glucoside, rosinidin O-hexoside, and petunidin 3-O-glucoside being the dominant pigments. Petunidins have been identified as the major pigments in black currants and black goji [23], while malvidins were found to be the dominant pigments in darker red wine [20]. Furthermore, we found that the genes gene8173 (polyphenol oxidase) and gene13201 (ANR) were up-regulated in K115 compared to other BMPs. These results infer that the browning reaction (polymerization of proanthocyanins) may contribute to the fruit color development of K115. The enzymatic browning reaction catalyzed by polyphenol oxidases (PPOs) influences the color quality of vegetables and fruits [48]. The significant induction of ABA (abscisic acid) metabolism-related genes in K115 suggests that ABA may promote anthocyanin biosynthesis and accumulation, leading to their predominance in the fruit pericarp. In fig (Ficus carica L.), it is shown that ABA stimulates anthocyanin synthesis and accumulation to enhance fruit color during repining [49]. Further studies on ABA-promoting anthocyanin accumulation in BMPs are needed for biochemical control of better gourd fruit color perspectives.
TFs, particularly R2R3-MYBs, bHLHs, and WD40 proteins, play critical roles in regulating the expressions of flavonoid structural genes at the transcriptional level [20,24,28]. We have identified potential candidate MYB, NAC, EP2/ERF, bHLH, bZIP, and MADS family genes that might regulate the levels of anthocyanin compounds in different colored BMPs. These genes should be subjected to functional genomics studies in order to dissect the regulatory network of flavonoid biosynthesis and accumulation in bitter melon fruits. Notably, particular attention should be given to the candidate MYB family genes due to their recognized major regulation function of anthocyanins in plant organs [29,30,31,50,51]. Attention should also be paid to NAC family candidate genes, particularly NAC104 and NAC43, which showed significantly higher expression in K115 compared to other BMPs. NAC TFs ANAC078 and MdNAC52 were found to regulate anthocyanin and other flavonoid synthesis and accumulation in Arabidopsis and apple, respectively [52,53]. The flavonoid pathway-related differentially expressed structural genes identified may also represent an important resource for modulating the composition and concentration of flavonoids in bitter melon fruits.

5. Conclusions

The present study identified key metabolites and insights into the molecular mechanisms underlying the pericarp color variation in bitter melon. The variation in the content of six anthocyanins, including malvidin 3-O-glucoside, petunidin 3-O-glucoside, rosinidin O-hexoside, cyanidin, cyanidin 3-p-hydroxybenzoylsophoroside-5-glucoside, and pelargonidin 3-O-beta-D-glucoside, is the major driving factor of BMP color differences. The grayish orange pericarp color may be a co-pigmentation between cyanidin, cyanidin 3-p-hydroxybenzoylsophoroside-5-glucoside, pelargonidin 3-O-beta-D-glucoside (major pigments), other flavonoids, and carotenoids. Meanwhile, co-pigmentation between cyanidin 3-p-hydroxybenzoylsophoroside-5-glucoside, pelargonidin 3-O-beta-D-glucoside (major pigments), other flavonoids, and carotenoids may be responsible for grayish yellow pericarp color. The soft green pericarp color may result from a co-pigmentation between petunidin 3-O-glucoside, cyanidin (major pigments), other flavonoids, chlorophyll, xanthophylls, and carotenoids. Malvidin 3-O-glucoside, rosinidin O-hexoside, and petunidin 3-O-glucoside are the dominant pigments in K115 (dark grayish cyan), but cyanidin 3-p-hydroxybenzoylsophoroside-5-glucoside and chlorophyll may participate in the color. MYBs, NACs, MADSs, bHLHs, EP2/ERFs, and bZIPs TF family genes may play critical roles in regulating BMP pigmentation. Candidate biosynthesis and regulatory genes were identified for future studies. Among them, gene13201 (anthocyanin reductase), gene8173 (polyphenol oxidase), gene2136 (NAC43), gene19593 (NAC104), and gene15171 (tetrapyrrole-binding protein) need to be paid attention to when dissecting dark grayish cyan color development. Our findings will facilitate the molecular dissection of the regulatory network of pericarp pigmentation in bitter melon and contribute to breeding varieties with high nutritional value.

Supplementary Materials

The following supporting information can be downloaded at: https://www.mdpi.com/article/10.3390/horticulturae10030291/s1, Figure S1. Correlation analysis of samples based on the relative content of the metabolites; Figure S2. OPLS-DA plots of all pairwise comparisons; Figure S3. Volcano plots of the DAMs in all pairwise comparisons; Figure S4. KEGG annotation and enrichment plots of the DAMs in all pairwise comparisons; Figure S5. PCA (A) and correlation (B) analyses of samples based on the FPKM values of all genes from the transcriptome sequencing; Figure S6. qRT-PCR validation of the transcriptome data; Figure S7. Volcano plots of the DEGs in three pairwise comparisons; Figure S8. GO annotation and enrichment plots of the DEGs three pairwise comparisons; Figure S9. KEGG annotation and enrichment plots of the DEGs in pairwise comparison K1102_vs_262; Figure S10. Expression patterns of other DEGs’ related pigment biosynthesis; Figure S11. Expression patterns of other key highly up-regulated (Log2FC ≥ 3) TFs; Table S1. List of the 573 identified metabolites and their relative content in the four different colored bitter melon pericarps; Table S2. List of the 30 key differentially accumulated metabolites; Table S3. Summary of the high-quality transcriptome data of the four different colored BMPs; Table S4. List of primers used for the qRT-PCR analysis; Table S5. Liquid chromatography (A) and mass spectrometry (B) conditions.

Author Contributions

Conceptualization, L.Y. and W.C.; methodology, L.Y.; software, L.Y. and Y.M.; validation, Z.L.; formal analysis, M.M. and H.L.; investigation, L.Y., H.L. and Y.Z.; resources, L.Y. and W.C.; data curation, Y.M.; writing—original draft preparation, L.Y.; writing—review and editing, W.C., Z.L. and J.L.; visualization, L.Y. and Y.M.; supervision, W.C.; project administration, W.C.; funding acquisition, L.Y., Z.L. and W.C. All authors have read and agreed to the published version of the manuscript.

Funding

This research was funded by the National Key Research and Development Program of China, grant No. 2022YFD1100205, 2022YFD1601503, and 2022YFD1601506; the Sichuan Innovation Team of National Modern Agricultural Industry Technology System; and the Sichuan Provincial Finance Department, grant No. 1+9KJGG001.

Institutional Review Board Statement

Not applicable.

Informed Consent Statement

Not applicable.

Data Availability Statement

The RNA-seq of raw data was submitted to NCBI under number: PRJNA1031990 with the link: https://dataview.ncbi.nlm.nih.gov/object/PRJNA1031990, accessed on 11 September 2022, and can be accessed on 1 May 2024. All other datasets used and/or analyzed during the current study are available from the corresponding author upon reasonable request.

Conflicts of Interest

The authors declare no conflicts of interest. The funders had no role in the design of the study; in the collection, analyses, or interpretation of data; in the writing of the manuscript; or in the decision to publish the results.

References

  1. Cui, J.; Yang, Y.; Luo, S.; Wang, L.; Huang, R.; Wen, Q.; Han, X.; Miao, N.; Cheng, J.; Liu, Z.; et al. Whole-Genome Sequencing Provides Insights into the Genetic Diversity and Domestication of Bitter Gourd (Momordica Spp.). Hortic. Res. 2020, 7, 85. [Google Scholar] [CrossRef] [PubMed]
  2. Cortez-Navarrete, M.; Méndez-Del Villar, M.; Ramos-González, E.J.; Pérez-Rubio, K.G. Momordica charantia: A Review of Its Effects on Metabolic Diseases and Mechanisms of Action. J. Med. Food 2021, 24, 1017–1027. [Google Scholar] [CrossRef]
  3. Desai, S.; Tatke, P. Charantin: An Important Lead Compound from Momordica charantia for the Treatment of Diabetes. J. Pharmacogn. Phytochem. 2015, 3, 163–166. [Google Scholar]
  4. Jia, S.; Shen, M.; Zhang, F.; Xie, J. Recent Advances in Momordica charantia: Functional Components and Biological Activities. Int. J. Mol. Sci. 2017, 18, 2555. [Google Scholar] [CrossRef] [PubMed]
  5. Sur, S.; Ray, R.B. Bitter Melon (Momordica charantia), a Nutraceutical Approach for Cancer Prevention and Therapy. Cancers 2020, 12, 2064. [Google Scholar] [CrossRef] [PubMed]
  6. Wang, S.; Li, Z.; Yang, G.; Ho, C.T.; Li, S. Momordica charantia: A Popular Health-Promoting Vegetable with Multifunctionality. Food Funct. 2017, 8, 1749–1762. [Google Scholar] [CrossRef] [PubMed]
  7. Richter, E.; Geetha, T.; Burnett, D.; Broderick, T.L.; Babu, J.R. The Effects of Momordica charantia on Type 2 Diabetes Mellitus and Alzheimer’s Disease. Int. J. Mol. Sci. 2023, 24, 4643. [Google Scholar] [CrossRef]
  8. Saeed, F.; Afzaal, M.; Niaz, B.; Arshad, M.U.; Tufail, T.; Hussain, M.B.; Javed, A. Bitter Melon (Momordica charantia): A Natural Healthy Vegetable. Int. J. Food Prop. 2018, 21, 1270–1290. [Google Scholar] [CrossRef]
  9. Singh, S.K.; Singh, S.; Singh, R. Targeting Novel Coronavirus SARS-CoV-2 Spike Protein with Phytoconstituents of Momordica charantia. J. Ovarian Res. 2021, 14, 126. [Google Scholar] [CrossRef]
  10. Yang, J.; Weng, Y.; Li, H.; Kong, Q.; Wang, W.; Yan, C.; Wang, L. Epidermal Patterning Factor 2-Like (McEPFL2): A Putative Candidate for the Continuous Ridge (Cr) Fruit Skin Locus in Bitter Gourd (Momordica charantia L.). Genes 2022, 13, 1148. [Google Scholar] [CrossRef]
  11. Rao, P.G.; Behera, T.K.; Gaikwad, A.B.; Munshi, A.D.; Srivastava, A.; Boopalakrishnan, G. Vinod Genetic Analysis and QTL Mapping of Yield and Fruit Traits in Bitter Gourd (Momordica charantia L.). Sci. Rep. 2021, 11, 4109. [Google Scholar] [CrossRef] [PubMed]
  12. Chen, Z.; Yu, L.; Liu, W.; Zhang, J.; Wang, N.; Chen, X. Research Progress of Fruit Color Development in Apple (Malus domestica Borkh.). Plant Physiol. Biochem. 2021, 162, 267–279. [Google Scholar] [CrossRef] [PubMed]
  13. Bo, K.; Wei, S.; Wang, W.; Miao, H.; Dong, S.; Zhang, S.; Gu, X. QTL Mapping and Genome-Wide Association Study Reveal Two Novel Loci Associated with Green Flesh Color in Cucumber. BMC Plant Biol. 2019, 19, 243. [Google Scholar] [CrossRef] [PubMed]
  14. Gebretsadik, K.; Qiu, X.; Dong, S.; Miao, H.; Bo, K. Molecular Research Progress and Improvement Approach of Fruit Quality Traits in Cucumber. Theor. Appl. Genet. 2021, 134, 3535–3552. [Google Scholar] [CrossRef] [PubMed]
  15. Ranganath, K.G.; Shivashankara, K.S.; Roy, T.K.; Dinesh, M.R.; Geetha, G.A.; Pavithra, K.C.G.; Ravishankar, K.V. Profiling of Anthocyanins and Carotenoids in Fruit Peel of Different Colored Mango Cultivars. J. Food Sci. Technol. 2018, 55, 4566–4577. [Google Scholar] [CrossRef] [PubMed]
  16. Li, X.; Sun, J.; Chen, Z.; Jiang, J.; Jackson, A. Characterization of Carotenoids and Phenolics during Fruit Ripening of Chinese Raspberry (Rubus chingii Hu). RSC Adv. 2021, 11, 10804–10813. [Google Scholar] [CrossRef] [PubMed]
  17. Shen, Y.H.; Yang, F.Y.; Lu, B.G.; Zhao, W.W.; Jiang, T.; Feng, L.; Chen, X.J.; Ming, R. Exploring the Differential Mechanisms of Carotenoid Biosynthesis in the Yellow Peel and Red Flesh of Papaya. BMC Genom. 2019, 20, 49. [Google Scholar] [CrossRef]
  18. Li, X.; Li, Y.; Zhao, M.; Hu, Y.; Meng, F.; Song, X.; Tigabu, M.; Chiang, V.L.; Sederoff, R.; Ma, W.; et al. Molecular and Metabolic Insights into Anthocyanin Biosynthesis for Leaf Color Change in Chokecherry (Padus virginiana). Int. J. Mol. Sci. 2021, 22, 10697. [Google Scholar] [CrossRef]
  19. Fu, X.; Cheng, S.; Liao, Y.; Huang, B.; Du, B.; Zeng, W.; Jiang, Y.; Duan, X.; Yang, Z. Comparative Analysis of Pigments in Red and Yellow Banana Fruit. Food Chem. 2018, 239, 1009–1018. [Google Scholar] [CrossRef]
  20. Khoo, H.E.; Azlan, A.; Tang, S.T.; Lim, S.M. Anthocyanidins and Anthocyanins: Colored Pigments as Food, Pharmaceutical Ingredients, and the Potential Health Benefits. Food Nutr. Res. 2017, 61, 1361779. [Google Scholar] [CrossRef]
  21. Chen, L.; Hu, B.; Qin, Y.; Hu, G.; Zhao, J. Advance of the Negative Regulation of Anthocyanin Biosynthesis by MYB Transcription Factors. Plant Physiol. Biochem. 2019, 136, 178–187. [Google Scholar] [CrossRef] [PubMed]
  22. Wang, Y.; Wang, Z.; Zhang, J.; Liu, Z.; Wang, H.; Tu, H.; Zhou, J.; Luo, X.; Chen, Q.; He, W.; et al. Integrated Transcriptome and Metabolome Analyses Provide Insights into the Coloring Mechanism of Dark-Red and Yellow Fruits in Chinese Cherry [Cerasus pseudocerasus (Lindl.) G. Don]. Int. J. Mol. Sci. 2023, 24, 3471. [Google Scholar] [CrossRef]
  23. Tang, P.; Giusti, M.M. Black Goji as a Potential Source of Natural Color in a Wide PH Range. Food Chem. 2018, 269, 419–426. [Google Scholar] [CrossRef] [PubMed]
  24. Santos, E.L.; Maia, B.H.L.N.S.; Ferriani, A.P.; Teixeira, S.D. Flavonoids: Classification, Biosynthesis and Chemical Ecology. In Flavonoids—From Biosynthesis to Human Health; InTech: London, UK, 2017; pp. 3–16. [Google Scholar]
  25. Khoo, H.E.; Prasad, K.N.; Kong, K.W.; Jiang, Y.; Ismail, A. Carotenoids and Their Isomers: Color Pigments in Fruits and Vegetables. Molecules 2011, 16, 1710–1738. [Google Scholar] [CrossRef] [PubMed]
  26. Stra, A.; Almarwaey, L.O.; Alagoz, Y.; Moreno, J.C.; Al-Babili, S. Carotenoid Metabolism: New Insights and Synthetic Approaches. Front Plant Sci 2023, 13, 1361779. [Google Scholar] [CrossRef] [PubMed]
  27. Zhang, H.; Du, X.; Yu, J.; Jin, H.; Liu, N. Comparative Metabolomics Study of Flavonoids in the Pericarp of Different Coloured Bitter Gourds (Momordica charantia L.). Physiol. Mol. Biol. Plants 2022, 28, 1347–1357. [Google Scholar] [CrossRef] [PubMed]
  28. Saito, K.; Yonekura-Sakakibara, K.; Nakabayashi, R.; Higashi, Y.; Yamazaki, M.; Tohge, T.; Fernie, A.R. The Flavonoid Biosynthetic Pathway in Arabidopsis: Structural and Genetic Diversity. Plant Physiol. Biochem. 2013, 72, 21–34. [Google Scholar] [CrossRef] [PubMed]
  29. Yang, G.; Li, L.; Wei, M.; Li, J.; Yang, F. SmMYB113 Is a Key Transcription Factor Responsible for Compositional Variation of Anthocyanin and Color Diversity Among Eggplant Peels. Front. Plant Sci. 2022, 13, 843996. [Google Scholar] [CrossRef]
  30. Yan, H.; Pei, X.; Zhang, H.; Li, X.; Zhang, X.; Zhao, M.; Chiang, V.L.; Sederoff, R.R.; Zhao, X. Myb-Mediated Regulation of Anthocyanin Biosynthesis. Int. J. Mol. Sci. 2021, 22, 3103. [Google Scholar] [CrossRef]
  31. Li, C.; Yu, W.; Xu, J.; Lu, X.; Liu, Y. Anthocyanin Biosynthesis Induced by MYB Transcription Factors in Plants. Int. J. Mol. Sci. 2022, 23, 11701. [Google Scholar] [CrossRef]
  32. Liu, Y.; Lv, J.; Liu, Z.; Wang, J.; Yang, B.; Chen, W.; Ou, L.; Dai, X.; Zhang, Z.; Zou, X. Integrative Analysis of Metabolome and Transcriptome Reveals the Mechanism of Color Formation in Pepper Fruit (Capsicum annuum L.). Food Chem. 2020, 306, 125629. [Google Scholar] [CrossRef]
  33. Zhou, X.; Liu, S.; Yang, Y.; Liu, J.; Zhuang, Y. Integrated Metabolome and Transcriptome Analysis Reveals a Regulatory Network of Fruit Peel Pigmentation in Eggplant (Solanum melongena L.). Int. J. Mol. Sci. 2022, 23, 3475. [Google Scholar] [CrossRef]
  34. Zhang, X.; Wang, J.; Li, P.; Sun, C.; Dong, W. Integrative Metabolome and Transcriptome Analyses Reveals the Black Fruit Coloring Mechanism of Crataegus maximowiczii C.K. Schneid. Plant Physiol. Biochem. 2023, 194, 111–121. [Google Scholar] [CrossRef] [PubMed]
  35. Chen, W.; Gong, L.; Guo, Z.; Wang, W.; Zhang, H.; Liu, X.; Yu, S.; Xiong, L.; Luoa, J. A Novel Integrated Method for Large-Scale Detection, Identification, and Quantification of Widely Targeted Metabolites: Application in the Study of Rice Metabolomics. Mol. Plant 2013, 6, 1769–1780. [Google Scholar] [CrossRef] [PubMed]
  36. Dossou, S.S.K.; Xu, F.; Cui, X.; Sheng, C.; Zhou, R.; You, J.; Tozo, K.; Wang, L. Comparative Metabolomics Analysis of Different Sesame (Sesamum indicum L.) Tissues Reveals a Tissue-Specific Accumulation of Metabolites. BMC Plant Biol. 2021, 21, 352. [Google Scholar] [CrossRef] [PubMed]
  37. Dossou, S.S.K.; Xu, F.; You, J.; Zhou, R.; Li, D.; Wang, L. Widely Targeted Metabolome Profiling of Different Colored Sesame (Sesamum indicum L.) Seeds Provides New Insight into Their Antioxidant Activities. Food Res. Int. 2022, 151, 110850. [Google Scholar] [CrossRef] [PubMed]
  38. Xiao, J.; Gu, C.; He, S.; Zhu, D.; Huang, Y.; Zhou, Q. Widely Targeted Metabolomics Analysis Reveals New Biomarkers and Mechanistic Insights on Chestnut (Castanea mollissima Bl.) Calcification Process. Food Res. Int. 2021, 141, 110128. [Google Scholar] [CrossRef]
  39. Kim, D.; Langmead, B.; Salzberg, S.L. HISAT: A Fast Spliced Aligner with Low Memory Requirements. Nat. Methods 2015, 12, 357–360. [Google Scholar] [CrossRef] [PubMed]
  40. Pertea, M.; Pertea, G.M.; Antonescu, C.M.; Chang, T.-C.; Mendell, J.T.; Salzberg, S.L. StringTie Enables Improved Reconstruction of a Transcriptome from RNA-Seq Reads. Nat. Biotechnol. 2015, 33, 290–295. [Google Scholar] [CrossRef]
  41. Li, B.; Dewey, C.N. RSEM: Accurate Transcript Quantification from RNA-Seq Data with or without a Reference Genome. BMC Bioinform. 2011, 12, 323. [Google Scholar] [CrossRef]
  42. Love, M.I.; Huber, W.; Anders, S. Moderated Estimation of Fold Change and Dispersion for RNA-Seq Data with DESeq2. Genome Biol. 2014, 15, 550. [Google Scholar] [CrossRef] [PubMed]
  43. Hou, F.; Li, S.; Wang, J.; Kang, X.; Weng, Y.; Xing, G. Identification and Validation of Reference Genes for Quantitative Real-Time PCR Studies in Long Yellow Daylily, Hemerocallis citrina Borani. PLoS ONE 2017, 12, e0174933. [Google Scholar] [CrossRef] [PubMed]
  44. Livak, K.J.; Schmittgen, T.D. Analysis of Relative Gene Expression Data Using Real-Time Quantitative PCR and the 2−ΔΔCT Method. Methods 2001, 25, 402–408. [Google Scholar] [CrossRef]
  45. Chen, C.; Chen, H.; Zhang, Y.; Thomas, H.R.; Frank, M.H.; He, Y.; Xia, R. TBtools: An Integrative Toolkit Developed for Interactive Analyses of Big Biological Data. Mol. Plant 2020, 13, 1194–1202. [Google Scholar] [CrossRef] [PubMed]
  46. Oude Griep, L.M.; Monique Verschuren, W.M.; Kromhout, D.; Ocké, M.C.; Geleijnse, J.M. Colours of Fruit and Vegetables and 10-Year Incidence of CHD. Br. J. Nutr. 2011, 106, 1562–1569. [Google Scholar] [CrossRef] [PubMed]
  47. Chen, Y.; Li, W.; Jia, K.; Liao, K.; Liu, L.; Fan, G.; Zhang, S.; Wang, Y. Metabolomic and Transcriptomic Analyses of Flavonoid Biosynthesis in Apricot Fruits. Front. Plant Sci. 2023, 14, 1210309. [Google Scholar] [CrossRef]
  48. Moon, K.M.; Kwon, E.-B.; Lee, B.; Kim, C.Y. Recent Trends in Controlling the Enzymatic Browning of Fruit and Vegetable Products. Molecules 2020, 25, 2754. [Google Scholar] [CrossRef]
  49. Lama, K.; Harlev, G.; Shafran, H.; Peer, R.; Flaishman, M.A. Anthocyanin Accumulation Is Initiated by Abscisic Acid to Enhance Fruit Color during Fig (Ficus carica L.) Ripening. J. Plant Physiol. 2020, 251, 153192. [Google Scholar] [CrossRef]
  50. Hao, N.; Du, Y.; Li, H.; Wang, C.; Wang, C.; Gong, S.; Zhou, S.; Wu, T. CsMYB36 Is Involved in the Formation of Yellow Green Peel in Cucumber (Cucumis sativus L.). Theor. Appl. Genet. 2018, 131, 1659–1669. [Google Scholar] [CrossRef]
  51. Kim, D.H.; Lee, J.; Rhee, J.; Lee, J.Y.; Lim, S.H. Loss of the R2r3 Myb Transcription Factor Rsmyb1 Shapes Anthocyanin Biosynthesis and Accumulation in Raphanus sativus. Int. J. Mol. Sci. 2021, 22, 10927. [Google Scholar] [CrossRef]
  52. Morishita, T.; Kojima, Y.; Maruta, T.; Nishizawa-Yokoi, A.; Yabuta, Y.; Shigeoka, S. Arabidopsis NAC Transcription Factor, ANAC078, Regulates Flavonoid Biosynthesis under High-Light. Plant Cell Physiol. 2009, 50, 2210–2222. [Google Scholar] [CrossRef]
  53. Sun, Q.; Jiang, S.; Zhang, T.; Xu, H.; Fang, H.; Zhang, J.; Su, M.; Wang, Y.; Zhang, Z.; Wang, N.; et al. Apple NAC Transcription Factor MdNAC52 Regulates Biosynthesis of Anthocyanin and Proanthocyanidin through MdMYB9 and MdMYB11. Plant Sci. 2019, 289, 110286. [Google Scholar] [CrossRef]
Figure 1. Morphology and variability of metabolites in the four different colored bitter melon fruits. Global and transversal morphologies of the fruits from the three different growing areas. (A) Morphology and appearance of the fruits. (B) Classification of the 573 identified metabolites. (C) Specific classification of flavonoid groups. (D) Principal component analysis (PCA). (E) Heat map visualization. Each sample is represented by one row, and each metabolite is visualized in one column. Red indicates high abundance; green indicates relatively low metabolite abundance.
Horticulturae 10 00291 g001
Figure 2. Variation in major metabolite classes and differentially accumulated metabolites (DAMs). (AK) Relative content of some important classes of metabolites in the flesh of the four different colored bitter melon fruits. The specific metabolite class is indicated at the top of each graph. (L) Number of DAMs in the pairwise comparison between groups. (M) Venn diagram showing the number of key DAMs. (N) Classification of DAMs in the pairwise comparison between K1102 against other groups.
Horticulturae 10 00291 g002
Figure 3. Heatmaps showing the variation in the differentially accumulated flavonoids across the flesh of the four different colored bitter melon fruits: (A) flavones; (B) flavonols; (C) flavonoids; (D) flavanones; (E) anthocyanins.
Horticulturae 10 00291 g003
Figure 4. Differentially expressed genes and functional characterization. (A) Number of DEGs in pairwise comparison between groups. (B) Venn diagram showing the number of overlapped DEGs in the pairwise comparison between K1102 against other groups. (C,D) KEGG annotation and enrichment of DEGs in pairwise comparison between K1102_vs_1392 and K1102_vs_K115, respectively.
Horticulturae 10 00291 g004
Figure 5. Expression patterns of DEGs related to flavonoid biosynthesis. (A) Flavonoid structural genes. (B) Other flavonoid biosynthesis-related genes. Gene expression was scaled in this analysis using FPKM (fragments per kilobase of exon model per million mapped fragments) Z-scores based on the mean value of three biological replicates in the heatmap. The key is located on the right-hand side in each case.
Horticulturae 10 00291 g005
Figure 6. Expression patterns of DEGs related to carotenoid biosynthesis. (A) Diagram of carotenoid biosynthesis pathway. (B) Expression patterns of carotenoid biosynthesis-related DEGs. Gene expression was scaled in this analysis using FPKM (fragments per kilobase of exon model per million mapped fragments) Z-scores based on the mean value of three biological replicates in the heatmap. The key is located on the right-hand side. PSY, phytoene synthases; PDS, phytoene desaturase; ZISO, ζ-carotene isomerase; ZDS, ζ-carotene desaturase; LYCE, Lycopene ξ-cyclase; LYCB, lycopene β-cyclase; BCIS, β-carotene isomerases; CHXB/E, ζ/β-ring hydroxlases (or LUT5); CCS, capsanthin/capsorubin synthase; CCDs, carotenoid cleavage dioxygenases; ZEP, zeaxanthin epoxidase; VDE, violaxanthin deepoxidase; NCED, 9-cis-epoxy-carotenoid dioxygenases.
Horticulturae 10 00291 g006
Figure 7. Differentially expressed transcription factors (DETFs) in the pairwise comparison between K1102 against other groups. (A) Classification of the DETFs. (B,C) Expression patterns of highly up-regulated (Log2FC ≥ 3) MYBs and NACs. Gene expression was scaled in this analysis using FPKM (fragments per kilobase of exon model per million mapped fragments) Z-scores based on the mean value of three biological replicates in the heatmap. The key is located on the right-hand side in each case.
Horticulturae 10 00291 g007
Figure 8. Integration of metabolomics and transcriptomics results highlighting variation in the major anthocyanin pigments and the differentially expressed flavonoid structural genes. Bar graphs show variation in the relative content of key anthocyanins. PAL, phenylalanine ammonia-lyase; C4H, cinnamic acid 4-hydroxylase; 4CL, 4-coumarate-CoA ligase; CHS, chalcone synthase; CHI, chalcone isomerase; IFS, isoflavonoid synthase; FS, flavone synthase; DFR, dihydroflavonol 4-reductase; F3H, flavanone 3-hydroxylase; F3′H, flavonoid 3′-hydroxylase; F3′5′H, flavonoid 3′,5′-hydroxylase; ANS, anthocyanidin synthase; ANR, anthocyanidin reductase; LAR, leucoanthocyanin reductase; PPO, polyphenol oxidase; UFGT, UDP glucose-flavonoid 3-O-glycosyl-transferase; BZ1, anthocyanidin 3-O-glucosyltransferase.
Horticulturae 10 00291 g008
Disclaimer/Publisher’s Note: The statements, opinions and data contained in all publications are solely those of the individual author(s) and contributor(s) and not of MDPI and/or the editor(s). MDPI and/or the editor(s) disclaim responsibility for any injury to people or property resulting from any ideas, methods, instructions or products referred to in the content.

