Article

Survey on Yeast Assimilable Nitrogen Status of Musts from Native and International Grape Varieties: Effect of Variety and Climate

by
Elisavet Bouloumpasi
1,*,
Adriana Skendi
2 and
Evangelos H. Soufleros
1
1
Department of Food Science and Technology, Faculty of Agriculture, Aristotle University of Thessaloniki, P.O. Box 235, GR-54124 Thessaloniki, Greece
2
Department of Agricultural Biotechnology and Oenology, International Hellenic University, 1st Km Dramas—Mikrohoriou, GR-66100 Drama, Greece
*
Author to whom correspondence should be addressed.
Fermentation 2023, 9(8), 773; https://doi.org/10.3390/fermentation9080773
Submission received: 31 July 2023 / Revised: 16 August 2023 / Accepted: 18 August 2023 / Published: 19 August 2023

Abstract

:
Yeast assimilable nitrogen (YAN), besides the oenological parameters (sugar content, titratable acidity, and pH) in grape musts of sixteen native and international varieties of Vitis vinifera cultivated in six regions of Northern Greece, was assessed in the frame of the present study. Low levels of YAN are frequently thought to be the cause of problematic fermentations and originate significant changes in the organoleptic aspects of the finished product. The objective of this multi-variety study was to assess factors affecting the YAN amount and composition in technologically mature grapes and, therefore, to evaluate the necessity of YAN supplementation with ammonium salts in musts across different native and international grape varieties. Free amino nitrogen was measured colorimetrically, ammoniacal nitrogen was measured enzymatically, and their values for each must sample were summed to obtain the total amount of YAN. Statistical analysis was carried out including principal component analysis (PCA) to discover relationships among must samples and the parameters studied. PCA analysis classified samples depending on grape varieties and region of origin, bringing knowledge about native and international cultivars of great commercial interest. Moreover, these findings could help to understand how commercial varieties can behave in different climates in the climate change context.

1. Introduction

Nitrogen is an important parameter to monitor in grapes for wine production. Different factors influence nitrogen quantity in grapes, with the nitrogen fertilization of vines being the most important. Amino acids represent one of the most important groups of nitrogen compounds present in grapes, must, and wine. The quantity of amino acids in grape juice can vary significantly depending on the climate as well as the ripeness of the grapes [1]. Among the amino acids present in the must, only α-amino acids, named free amino nitrogen (FAN), are used by the Saccharomyces cerevisiae yeasts during their growth. Together with ammoniacal nitrogen (ammonia NH3 plus NH4+ nitrogen), α-amino acids represent yeast assimilable nitrogen (YAN), also called by some authors “promptly assimilable nitrogen by yeasts” (PAN) [2].
Nitrogen compounds in grapes usually reach maximum values at the technological maturity stage, according to Garde-Cerdan et al. [3], who studied grape ripening in conjunction with the evolution of assimilable nitrogen (amino and ammoniacal nitrogen). The nitrogen content of the grape juice can highly affect the yeast metabolism and different critical aspects of fermentation, i.e., the amount of yeast biomass, the rate of fermentation, the time for complete fermentation, as well as the type and quantity of end products [4]. Lack of assimilable nitrogen sources during alcoholic fermentation can delay fermentation [5,6] or produce high amounts of non-desirable by-products (fusel alcohols, as well as hydrogen sulfide) [1,7]. On the other hand, high levels of assimilable nitrogen increase the rate and decrease the overall time of fermentation [8] and favor the synthesis of high levels of acetate esters [9]. Low ammoniacal nitrogen content could increase the production of higher alcohols as the yeasts have the ability to use amino acids as a nitrogen source. Yeast metabolism allows the transformation of amino acids. The corresponding α-keto acids, produced during the transamination process, are transformed by decarboxylation into aldehydes that are reduced further to higher alcohols [10].
The yeasts prefer nitrogen sources that can be converted quickly into vital elements of their metabolism, but parameters such as the strain, carbon source, and growth conditions can affect the order of utilization of available nitrogen sources in the must [7,11]. Yeasts utilize α-amino acids present in the must for their growth, and their lack is linked with the formation of fusel alcohols and hydrogen sulfide [1]. On the other hand, elevated YAN concentration may result in microbial instability, the production of carcinogens (ethyl carbamate), allergens (biogenic amines), and haze formation [12]. The type of nitrogen also affects the aroma profile. So, higher alcohols are produced when amino acids are added compared to the ammonium form [13].
It is commonly accepted that a minimum of 140 mg of assimilable nitrogen per liter is indispensable for a complete and good-quality fermentation; musts with lower levels have a reduced capacity to produce alcohol, resulting in a slow or stationary fermentation Butzke [14]. The addition of diammonium hydrogen phosphate or ammonium sulphate at levels up to 1 g L−1 (expressed in salts) or ammonium bisulphate up to 0.2 g L−1 (expressed in salts) is allowed by European legislation [15] in order to help increase the amount of assimilable nitrogen needed for yeast fermentation. If used in excess, it can promote the production of higher concentrations of ethyl carbamate [16]. Generally, nitrogen fertilization in the field during growth represents an alternative for increasing the YAN of the must [17,18,19,20]. Nitrogen fertilization increased YAN levels by over 50% in the must of the Greek variety Vitis vinifera L. cv. Savvatiano (considered a “neutral variety”), whereas in the respective wine, it increased the intensity of aroma [17]. It seems that the effect of fertilization on YAN levels depends on factors such as timing, irrigation, and climate, besides cultivar [18,19].
Different surveys on YAN content have been conducted for Vitis vinifera varieties in diverse grape-growing regions differing in climate and growing practices (i.e., United States [14,21]), South Africa [22] and Europe (Italy [2], Spain [23], France [24], Czech Republic [25], and Germany [26]). Some authors have focused their investigation on the variability of YAN depending on the variety [27,28]) region or district ([27,28]), ripeness [27] and vintage [27,28]), while others have been involved in prediction studies to establish variety-specific regression models based on YAN measurements before harvest [21,29]. Differences in YAN between cultivars, vintage, and vineyard locations were reported in the literature [27]. According to Petropoulos et al. [30], climatic conditions and the cultivar are more likely to be the key parameters affecting amino acid concentration in grapes.
However, due to the variable nature of YAN, the information gathered in these surveys may not necessarily be applicable in a Greek context. Limited research was done to assess YAN in local and foreign grape types cultivated in Greece’s major wine-producing regions. Only one study monitored the effect of climatic conditions and vineyard altitude on YAN concentration in a native Greek grape variety (Vitis vinifera L. cv. Agiorgitiko) during a three-year period in one single region [30]. Since the nitrogen amount in the must represents a crucial factor for quality wines, monitoring this parameter considering the factors that affect it (i.e., climate and variety) is of help to the wine industry. Therefore, it would be beneficial to gain insight into the nitrogen status of the Greek grapes used for wine production since no study exists about YAN in Greek musts for wine production from international and native grape varieties.
In this context, the aim of the study was (i) to assess the nitrogen status of grape juices currently used to make commercial wines in Northern Greece, and (ii) to examine the impacts of variety and climate on yeast assimilable nitrogen of grape musts. This investigation was conducted with the aim to bring into consideration international grape varieties that are not reported in the literature, besides native Greek varieties. The aim was accomplished by evaluating a large number of grape musts for free amino nitrogen (FAN) and ammoniacal nitrogen and by employing exploratory statistical methods.

2. Materials and Methods

2.1. Samples

A survey of the YAN status of 274 musts (132 white and 142 red), corresponding to 16 different grape varieties from six regions of Greece and 12 regional units from the northern part of Greece (see Figure 1), was conducted during the 2017 harvest period. Grape samples were harvested at a ripeness level suitable for commercial winemaking according to the various producers’ (wineries’) harvest protocols. Upon collection, samples were coded and analyzed immediately. The grape bunches were pressed by hand to separate the must from the pomace. The distribution of samples according to variety and region appears in Table 1.

2.2. Enological Parameters and Yeast Assimilable Nitrogen Analysis

The fresh must aliquot for chemical analysis was centrifuged (4000 rpm, 10 min) and classical enological parameters, namely Baume, pH, and titratable acidity (expressed as g L−1 tartaric acid), were determined according to the official methods of OIV [31].
The components of YAN, free amino nitrogen (FAN) and ammoniacal nitrogen were measured separately. Free amino nitrogen was measured by the NOPA (Nitrogen by o-Phthaldialdehyde) colorimetric method [32]. Ammoniacal nitrogen (NH4-N) was measured enzymatically using Ammonia (Rapid) Assay (K-AMIAR 07/14, Megazyme, Ireland). Values for FAN and ammonia were then summed to obtain the total amount of YAN (expressed as mg N L−1) available in the must.

2.3. Meteorological Data

Meteorological data were collected from each grape production area in order to assess the effect of climatic factors on the YAN of grape musts. Therefore, a dataset containing temperature and rainfall data for each region, comprising the period from April to October, was built (see Supplementary Table S1). This frame period was chosen since it covers the grape growth phases.

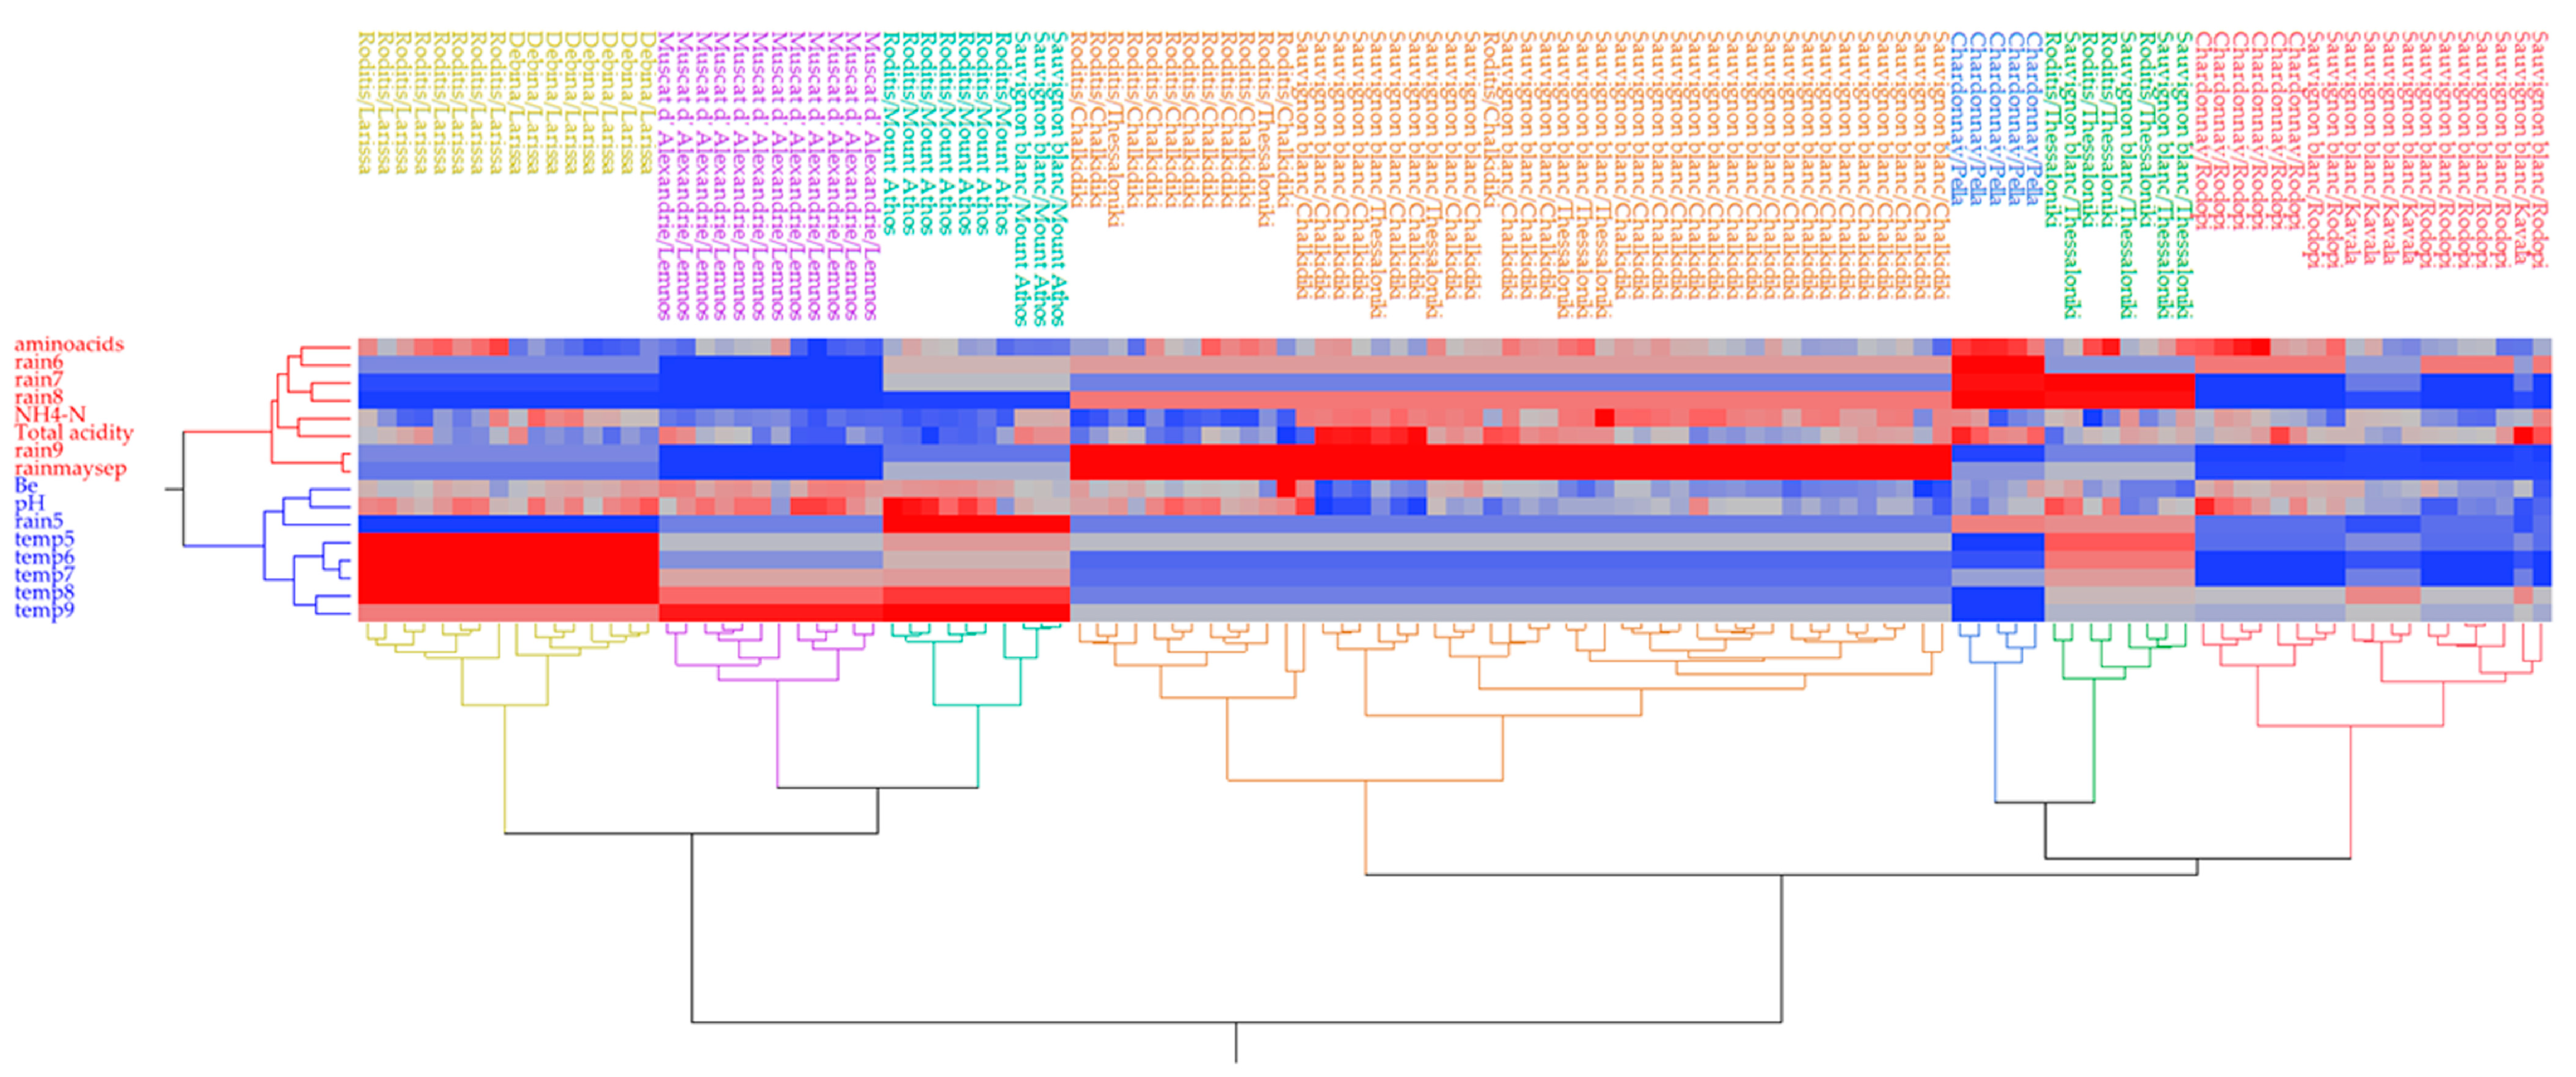
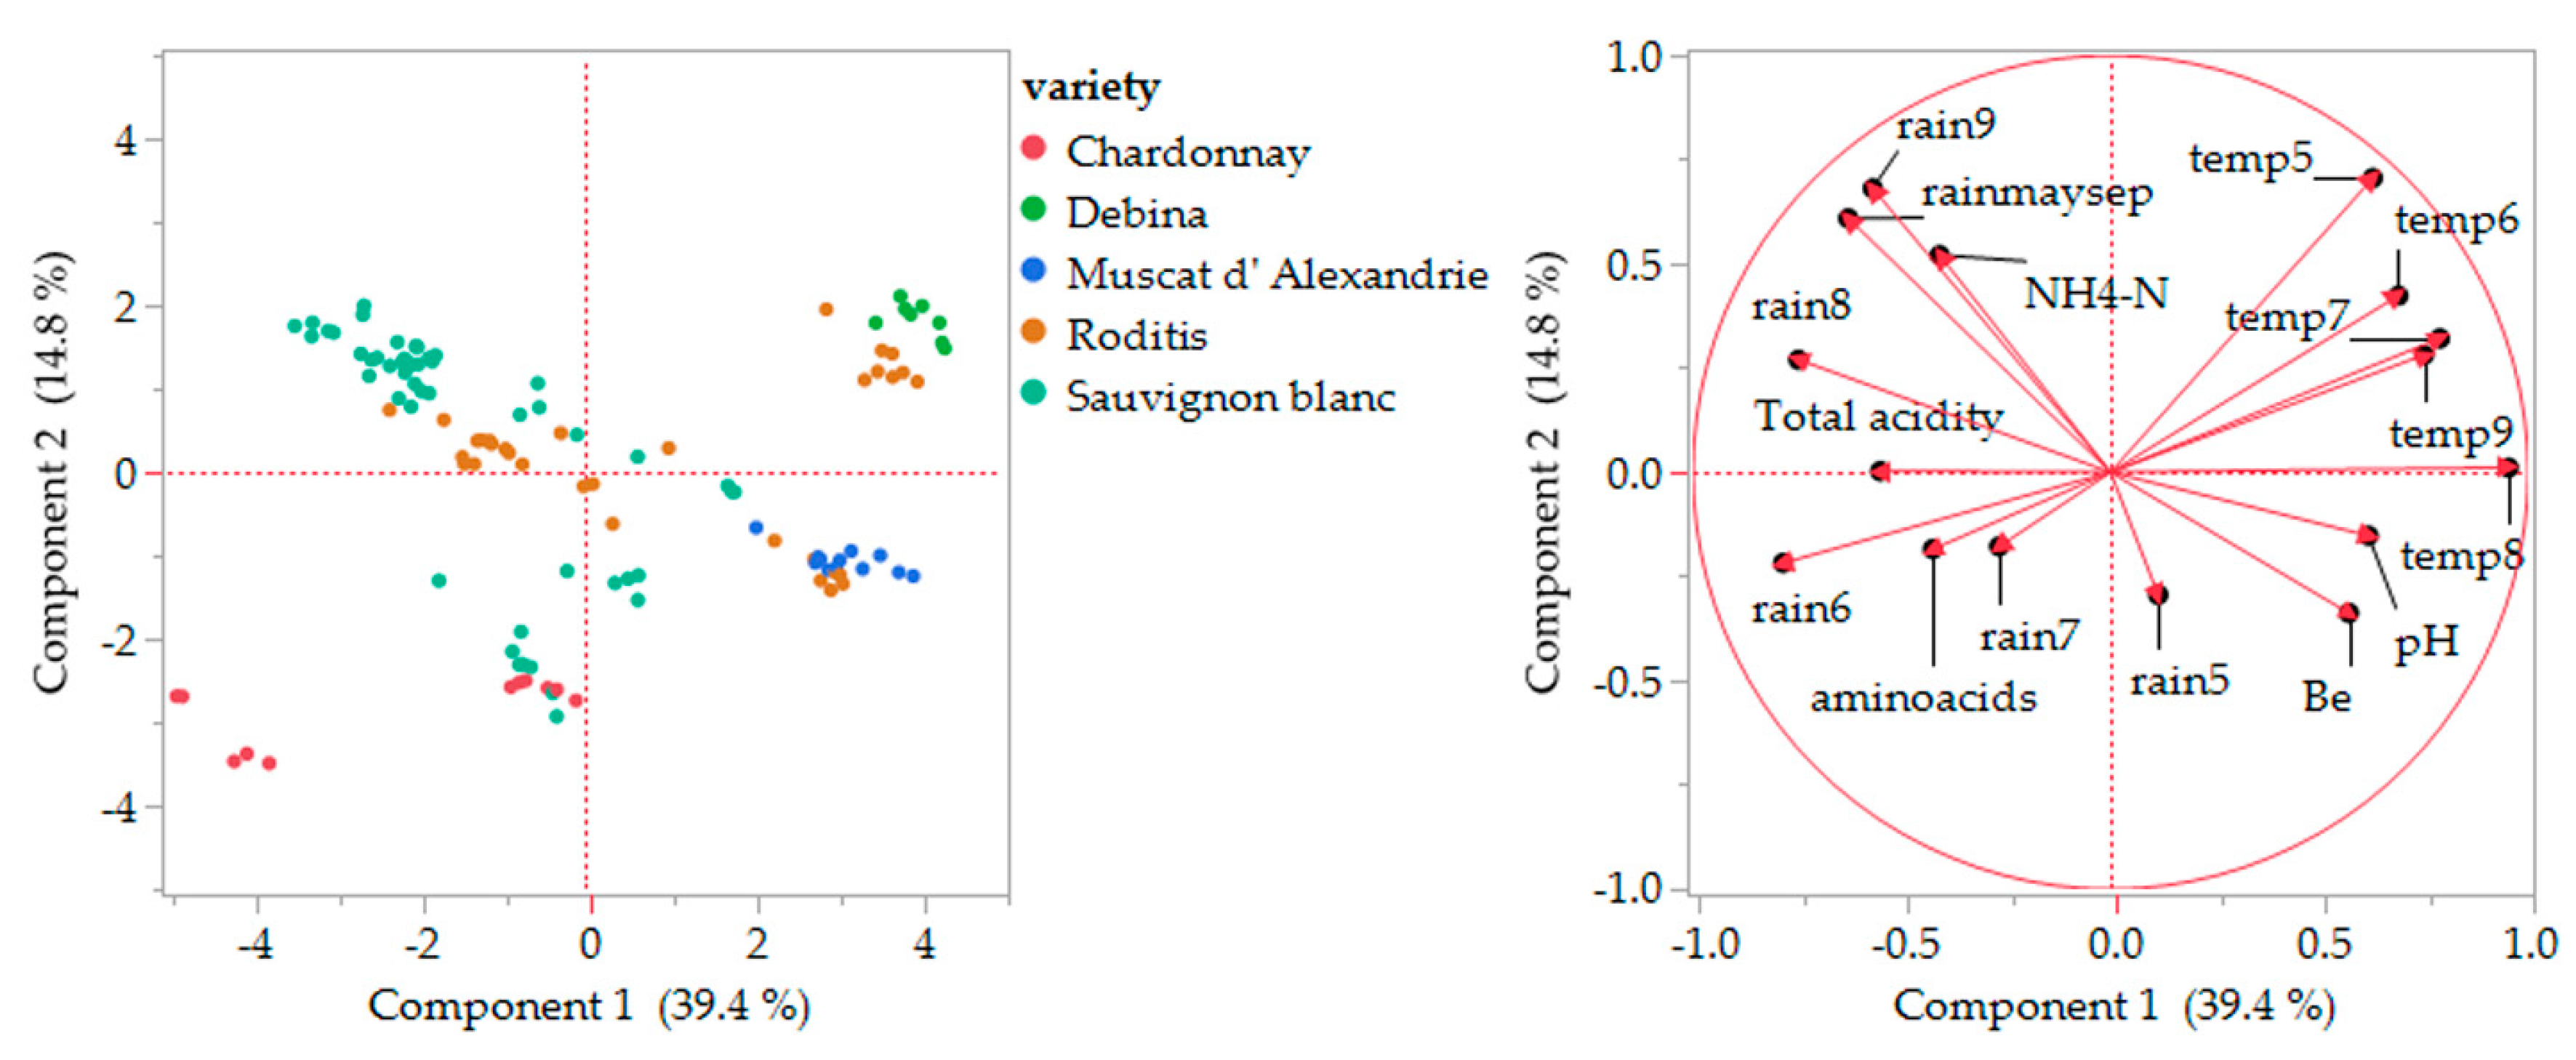
2.4. Statistical Analysis

Statistical data processing was performed using IBM SPSS Statistics, v.25 statistical software (International Business Machines—IBM Corporation, Chicago, IL, USA). Non-parametric tests for independent samples were performed. Kruskal–Wallis tests (when compared more than two independent variables) were used to detect evidence of differences among the grape varieties and the regional units (p < 0.05). Dunn’s post hoc tests with Bonferroni adjustment are carried out on each pair of groups. The median test and Mann–Whitney U test were used to test two independent variables differences.
Pearson linear and Spearman’s correlation (2-tailed, p < 0.05) were employed to recognize any relationship between the parameters studied, depending on the type of data distribution.
The mathematical processing of the standardized data was done by hierarchical cluster analysis (HCA) using Ward’s method. The results from the cluster analysis are presented by a dendrogram. HCA analysis was performed using the statistical software package JMP 14 (SAS Institute Inc., Cary, NC, USA).

3. Results

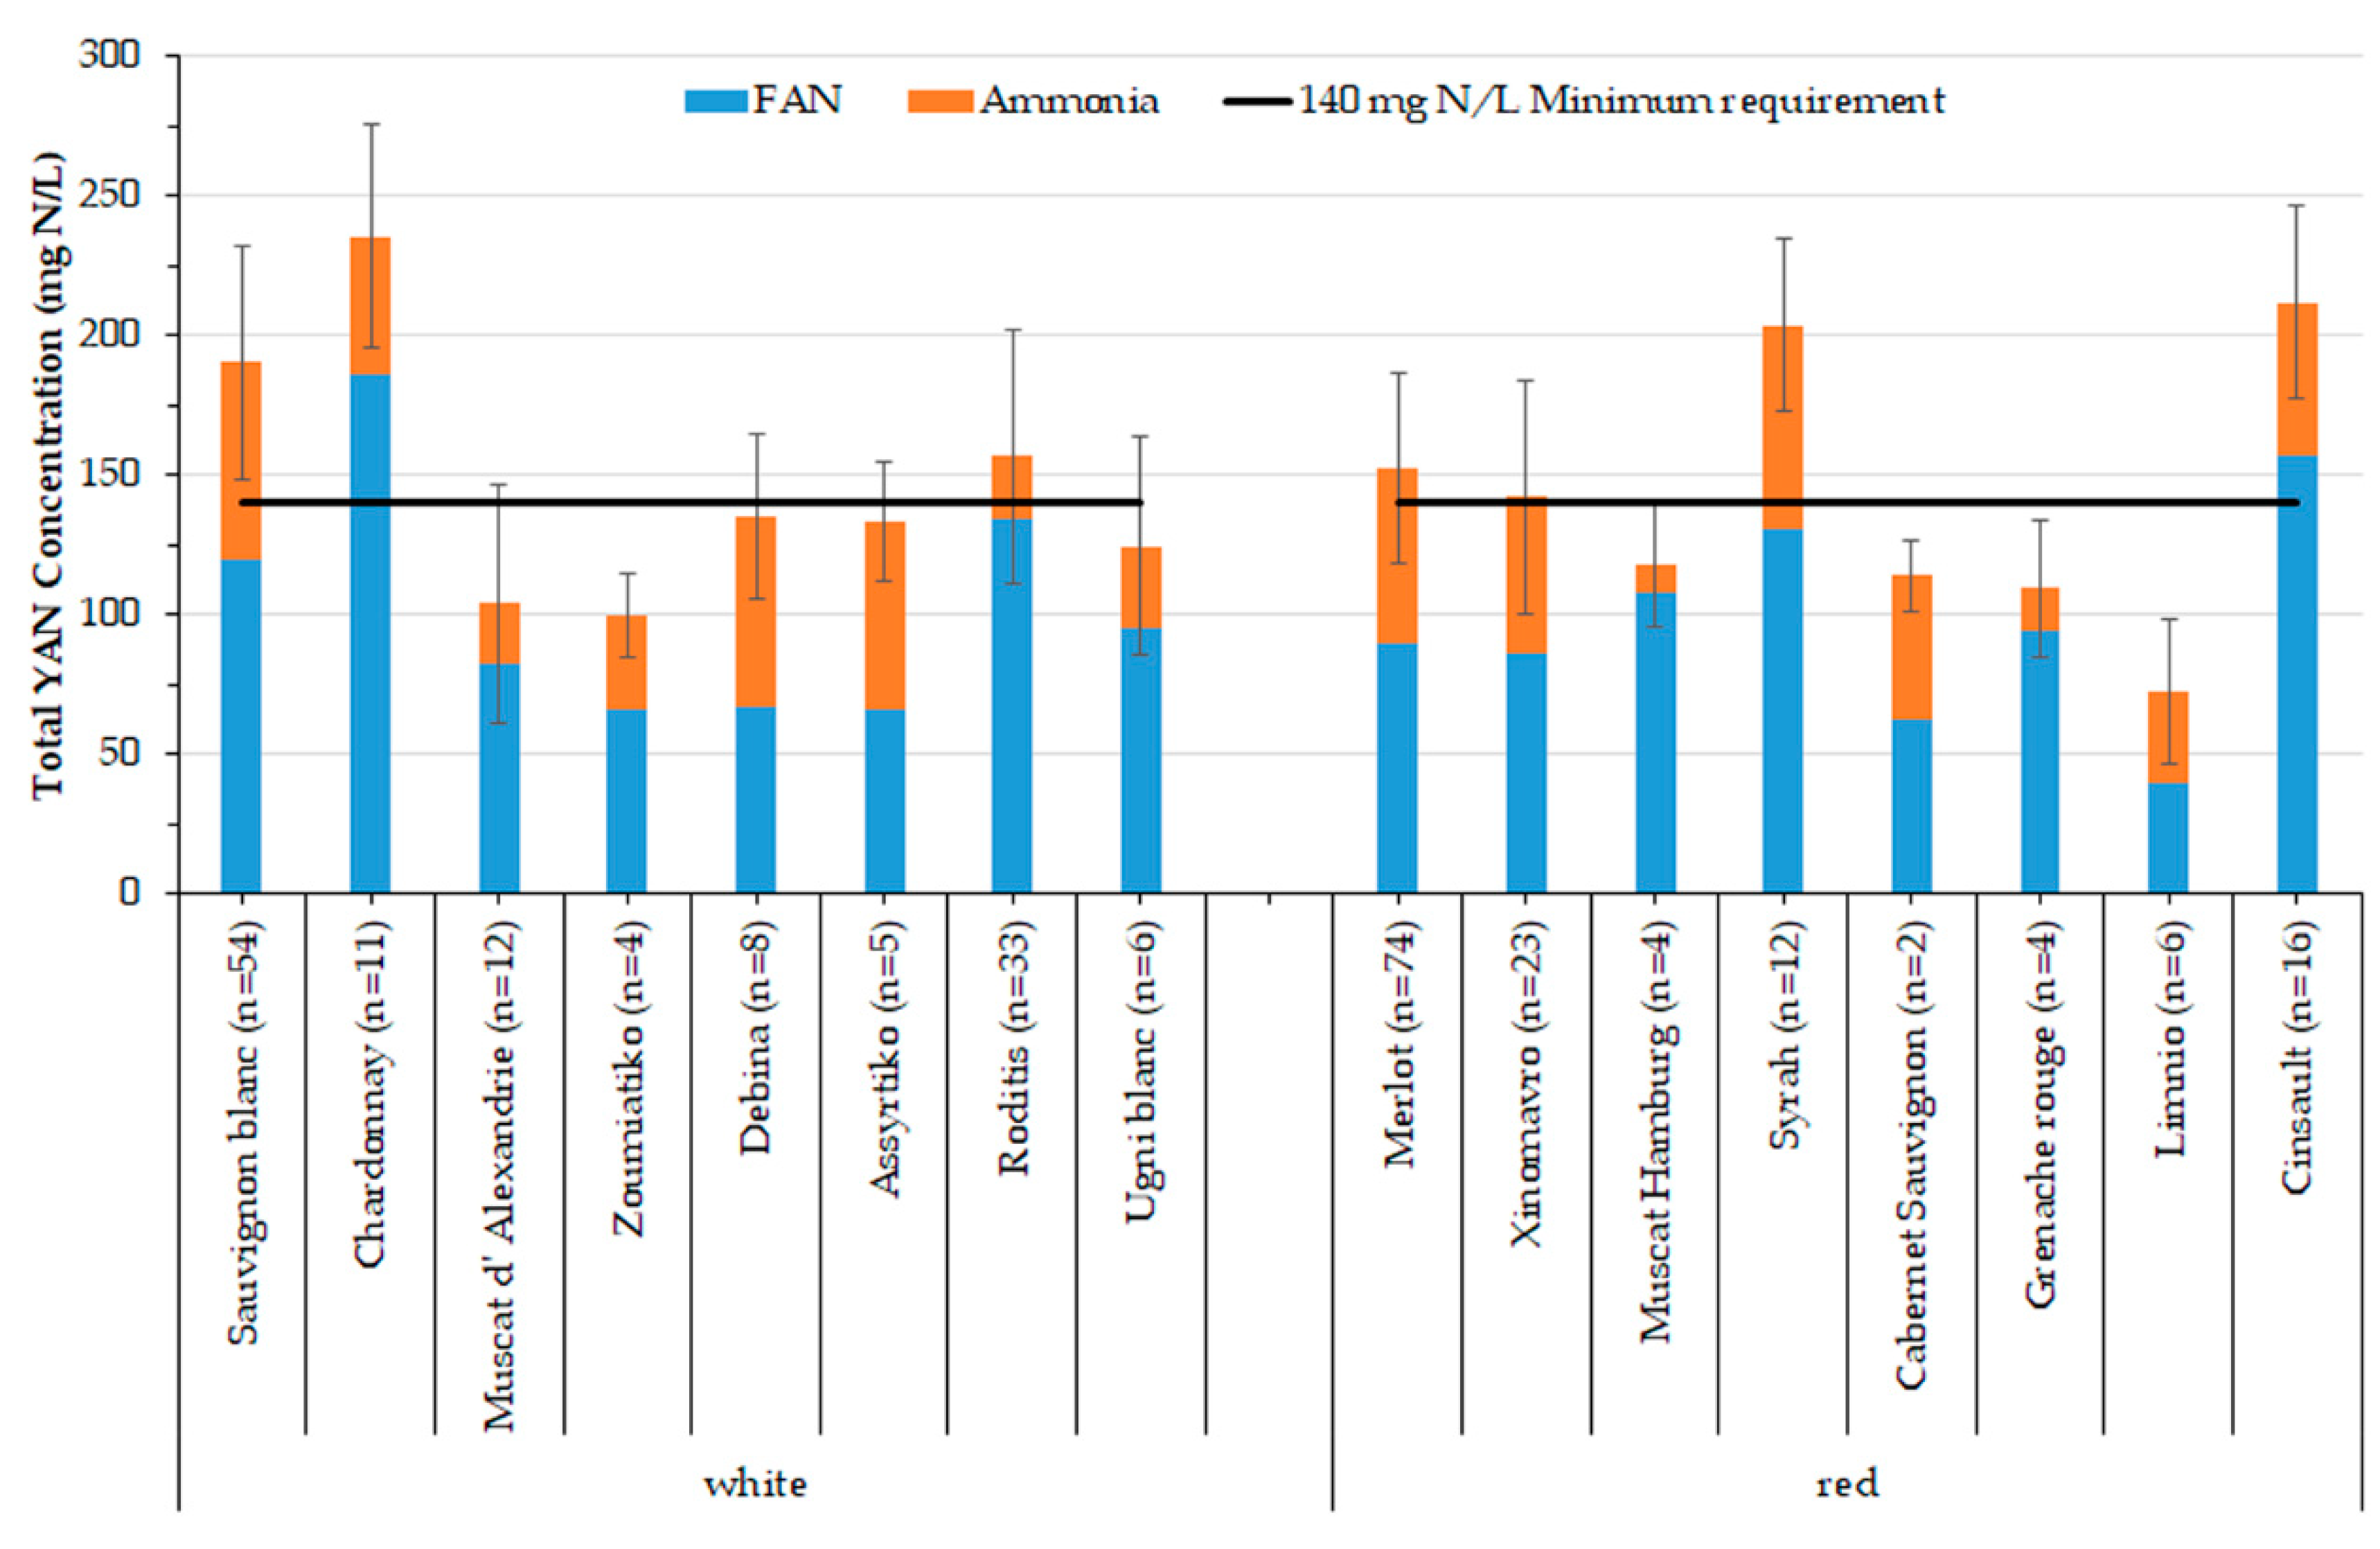
3.1. YAN Status of Grape Samples

A very broad variation was observed in the values of FAN (31–223 mg N L−1) and ammoniacal nitrogen (1–123 mg N L−1) among the studied samples, resulting consequently in an 8-fold variation in the YAN (sum of them) values (Table 2). Nevertheless, the variation observed for YAN (40 to 332 mg N L−1) in this study was lower than those reported by other authors [2,14,22]. Besides the cultivar, identified as the principal factor affecting YAN concentration, vintage and climate are of great importance [22]. Petrovic, Kidd and Buica [22] reported an 11-fold variation for South African musts however, their samples were spread over two vintage years and belong to many other cultivars besides those included in this study. In a similar way, Nicolini, Larcher and Versini [2] attribute the very high (25-fold) variation found in Italian samples to varietal and vintage differences. A 13-fold variation (40 to 559 mg N L−1) observed by Butzke [14] for musts, besides the varietal differences, could be accounted for by the different climates of the three grape-growing regions in the United States (California, Oregon and Washington) from where the samples were collected.
Significant statistical differences were observed between the medians of red and white varieties in terms of FAN and ammoniacal nitrogen, while medians of YAN do not differ significantly. White grape varieties exhibited higher FAN but lower ammoniacal nitrogen than the red ones. The literature associates red cultivars with lower YAN and FAN values than white cultivars [22]. An increase in FAN content in grapes is reported during ripening, starting from veraison, with the level reaching in some varieties a maximum before harvest [33]. Similarly, the total nitrogen level of grapes rises during maturation, but can stabilize after an initial increase and, in some situations, may even start to drop as ripening progresses, as reviewed by Bell and Henschke [12]. On the contrary, the concentration of ammoniacal nitrogen varies widely in grapes and declines between veraison and harvest [12].
The collected must samples were characterized by a broad variation in the sugar content and total acidity (expressed as tartaric acid), while they showed less than 1 unit of pH range variation (Table 1). Red and white samples differed in pH and sugar content while exhibiting statistically similar total acidity. The red musts were higher in sugars and exhibited higher pH values than the white samples. This behavior is in agreement with correct oenological practices for producing red wines with higher alcohol content and with the literature that reports pH and TA (as tartaric acid) values in the range of 3.0–3.4, and 6–9 g/L for white and 3.3–3.7, and 5–8 g/L for red wines, respectively [34].

3.2. Grape Variety

The nitrogen content of the samples, as well as basic oenological parameters, categorized based on the grape variety, are presented in Table 3. According to the Kruskal–Wallis test, significant differences in the medians of all the determined must parameters were observed among the varieties. Among the varieties considered, Chardonnay had the highest YAN value (mean 254 mg N L−1), followed by Cinsault, Syrah and Sauvignon Blanc. Average concentrations of YAN in international varieties cultivated in Greece followed the ranking: Chardonnay > Cinsault > Syrah > Sauvignon blanc > Merlot > Ugni blanc > Muscat Hamburg > Cabernet Sauvignon > Grenache rouge > Muscat of Alexandria (also known as Zibibbo in Sicily, Italy). Nevertheless, the differences in the number of samples tested for each variety could affect this classification, especially for the samples present in low numbers (Ugni Blanc, Cabernet Sauvignon and Grenache Rouge). Different surveys conducted in various countries do not concord in ranking specific varieties according to YAN [2,14,21,28]. Butzke [14] found a similar ranking, (i.e., Sauvignon blanc > Merlot > Cabernet Sauvignon) while Hagen, Keller and Edwards [28] and Petrovic, Kidd and Buica [22] reported a slightly different one for grape musts from the Pacific Northwest (U.S.A.) (Chardonnay > Syrah > Cabernet Sauvignon > Merlot) and South Africa (Chardonnay > Sauvignon blanc > Cinsault > Syrah > Cabernet Sauvignon > Merlot), respectively. In all those studies, the average YAN content of the Chardonnay variety exceeds 200 mg L−1.
Overall, despite the fact that the absolute YAN numbers vary amongst the numerous studies, what is remarkable is the proximity in ranking. Our results regarding the red varieties Merlot and Syrah are much higher than those reported by Petrovic, Kidd and Buica [22]. In addition, other studies performed in various world wine areas have consistently indicated Chardonnay to have a high average YAN level [2,14,21]. To our knowledge, no information on the YAN levels of Grenache rouge, Ugni blanc, Muscat of Alexandria, and Muscat Hamburg grapes have been reported in the literature. Yet, in this investigation was discovered that all four varieties had mean YAN levels lower than 140 mg L−1, exhibiting values of 110 mg L−1 (n = 4), 126 mg L−1 (n = 6), 104 mg L−1 (n = 12), and 118 mg L−1 (n = 4), for Grenache rouge, Ugni blanc, Muscat of Alexandria, and Muscat Hamburg, respectively. Since the nitrogen content of grapes varies with the vintage [22] but also with viticultural techniques [35], differences among the studies conducted in different countries are expected. Nevertheless, regardless of the study location, they serve to evidence the influence of cultivars on the YAN levels.
The highest mean value of YAN among Greek native varieties found in Roditis (157 mg N L−1) is nearly 80 mg N L−1 less than the highest value presented in the international variety Chardonnay. Based on YAN concentration, the native varieties are ranked as follows: Roditis > Xinomavro > Debina > Assyrtiko > Zoumiatiko > Limnio. Although the mean YAN value of international varieties is higher than that of native, only a few differences were observed between the values of single cultivars. No clear trend was observed among native and international varieties regarding the median values of YAN. This fact could be due to a high variation detected among the samples collected. Statistical analysis revealed the existence of only a few Greek varieties that differed from the international ones (Table 3). In a previous study, Bouloumpasi et al. [36], reported that international Vitis vinifera varieties (i.e., Chardonnay, Sauvignon blanc, Malvasia aromatica) had a significantly (p < 0.05) higher average soluble protein content in comparison to grapes of Greek native Vitis vinifera varieties (i.e., Malagousia, Roditis). Possibly genetic factors are those affecting YAN accumulation in grapes. The literature suggests that YAN may be a cultivar-specific trait [22]. In general, it seems that native cultivars have similar contents of FAN but different ammoniacal nitrogen from the international ones.
Concerning the FAN values, the literature reports that Grenache Rouge wines had a high amino acid content, higher than Syrah and Merlot [37]. However, in this study, Syrah grapes had higher mean FAN content, followed by Grenache Rouge and Merlot. As only four samples of Grenache Rouge were examined in the current survey, this amount could not be considered enough to draw conclusions about the variety. The FAN content of Merlot musts ranged from 50 to149 mg L−1. Etiévant et al. [38] reported average Merlot amino acid content of 124 mg L−1 for wines originating from France, well within the above range. Muscat of Alexandria wines also have been reported to contain low amounts of FAN [39]. The low levels found could not be explained in terms of grape variety or the location because the samples originated from a single region (Lemnos—Aegean Islands) characterized by semi-arid climate and mainly rocky soils.
Ammoniacal nitrogen in our study ranged from 1–123 mg N L−1, while other authors reported values ranging between 5 and 325 mg N L−1 [5,8,14]. The NH4-N contribution to YAN varies highly among varieties (i.e., between 2 and 53% of the YAN as reported by Huang and Ough [40], and it is variety-related, as in varieties of high proline accumulation (e.g., Cabernet Sauvignon) the FAN contribution to YAN is lower, resulting in a higher contribution by NH4-N to YAN compared with varieties that are high arginine accumulators [40].
Significant differences are observed, in general, in oenological parameters between native and international varieties. Native varieties seem to have more sugars, higher pH values and lower acidity than the international varieties. This behavior could be due to genetic factors or viticultural techniques applied by vine growers.
As displayed in Figure 2, for most of the varieties, the mean concentration of YAN does not exceed 140 mg N L−1, which is widely considered to be the minimum requirement for a successful fermentation for Saccharomyces, as reviewed by Nicolini, Larcher and Versini [2], Bell and Henschke [12], and Verdenal et al. [41], otherwise, there is a high risk for the fermentation to stop prematurely, while the risk factor is moderate when the YAN content ranges from 140 to 200 mg N L−1 [12]. This amount of YAN is necessary, especially for white musts. On the other hand, Australian Wine Research Institute [42] recommends a minimum of 100 mg N L−1 YAN for red musts due to extended contact with grape skins, which leads to the extraction of more nitrogen [43]. The international varieties Sauvignon blanc, Chardonnay, Merlot, Cinsault and Syrah, along with the native varieties Xinomavro and Roditis, had more than 140 mg N L−1 YAN on average. On the contrary, international varieties Ugni blanc, Muscat of Alexandria, Grenache rouge, Cabernet Sauvignon, Muscat Hamburg, and the natives Zoumiatiko, Debina, Assyrtiko, and Limnio did not exceed the minimum required quantity of YAN. Limnio, followed by Zoumiatiko found to have the lowest average concentration of YAN, at 73 mg N L−1 and 100 mg N L−1, respectively. It appears that most native Greek varieties are deficient in YAN and would probably need nitrogen supplementation in order to achieve a successful fermentation. The percentage (36%) of Greek must samples with YAN levels below the threshold level of 140 mg N L−1 was lower than that reported for Italian musts (58%) [2] but higher than that of must grapes from the West Coast of United States (13%) [14]. However, as depicted in Figure 2, high variance exists in the values within varieties. This behavior is in line with the findings of Petrovic, Kidd and Buica [22] and also Nicolini, Larcher and Versini [2]. The latter noted that YAN was the most variable factor in grape juice used to evaluate the quality of the grape at harvest. High variation in the YAN values within the same variety could be due to the growing region characteristics and differences in cultivation techniques adopted.

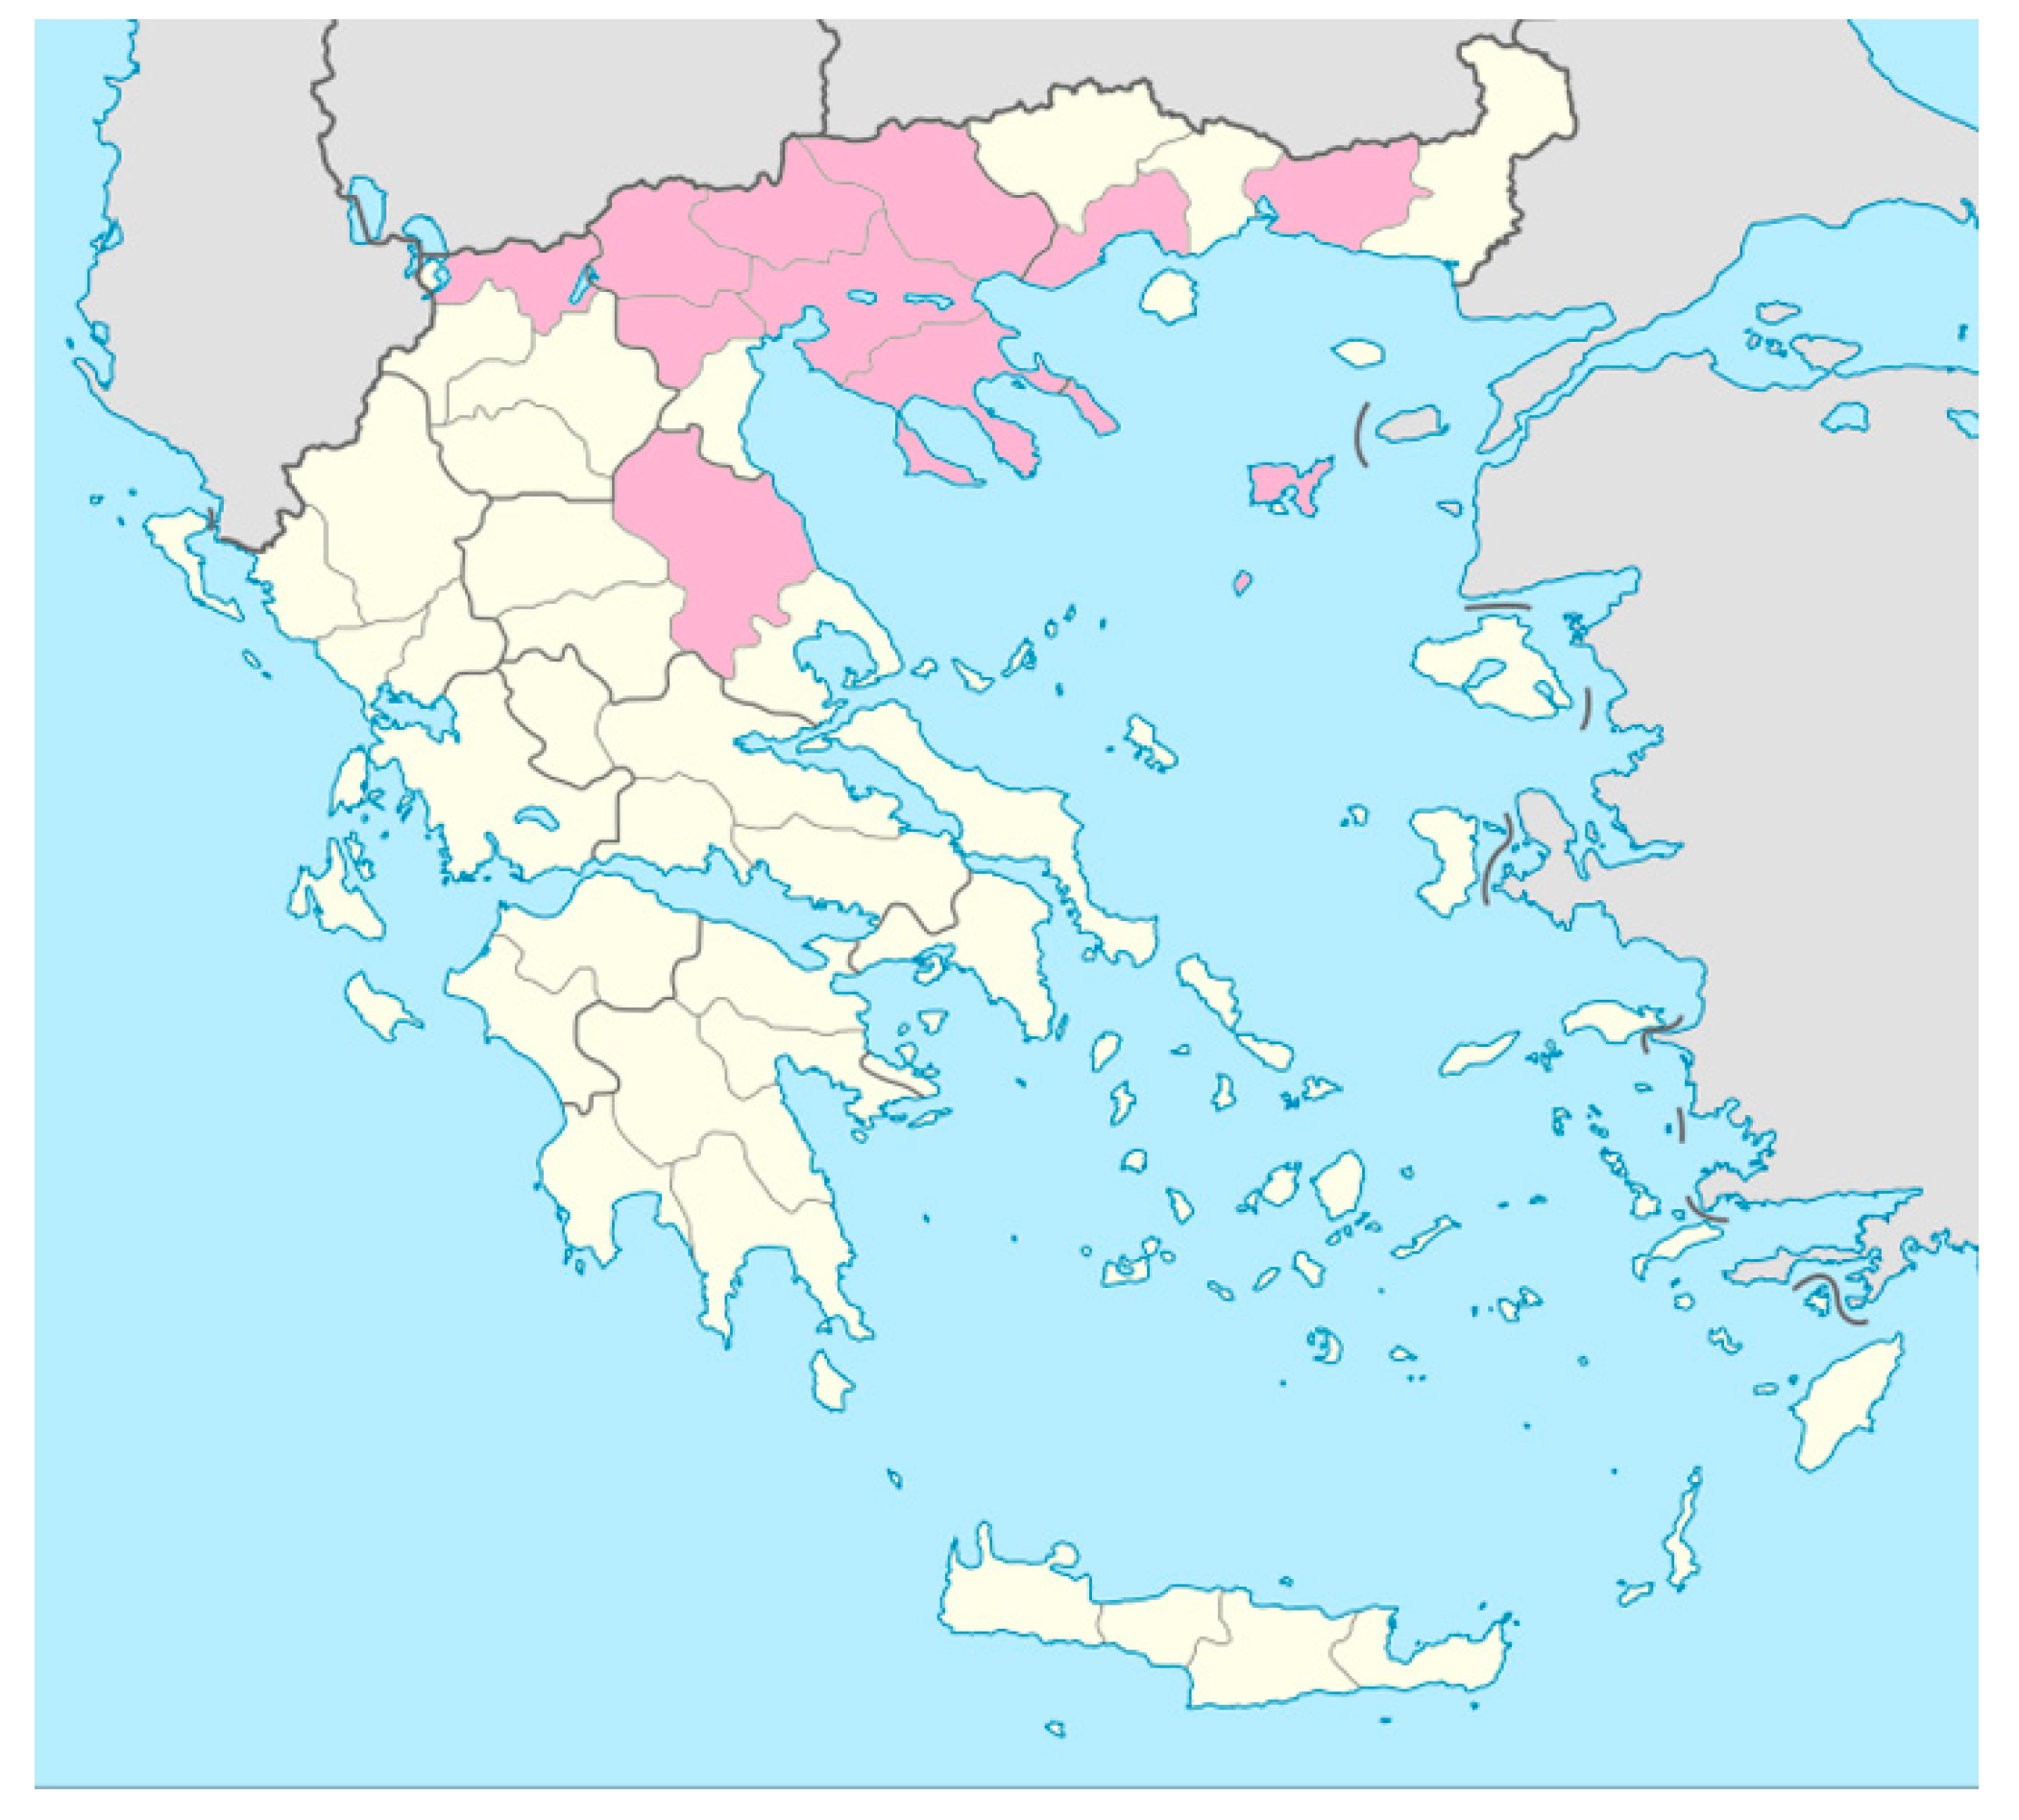
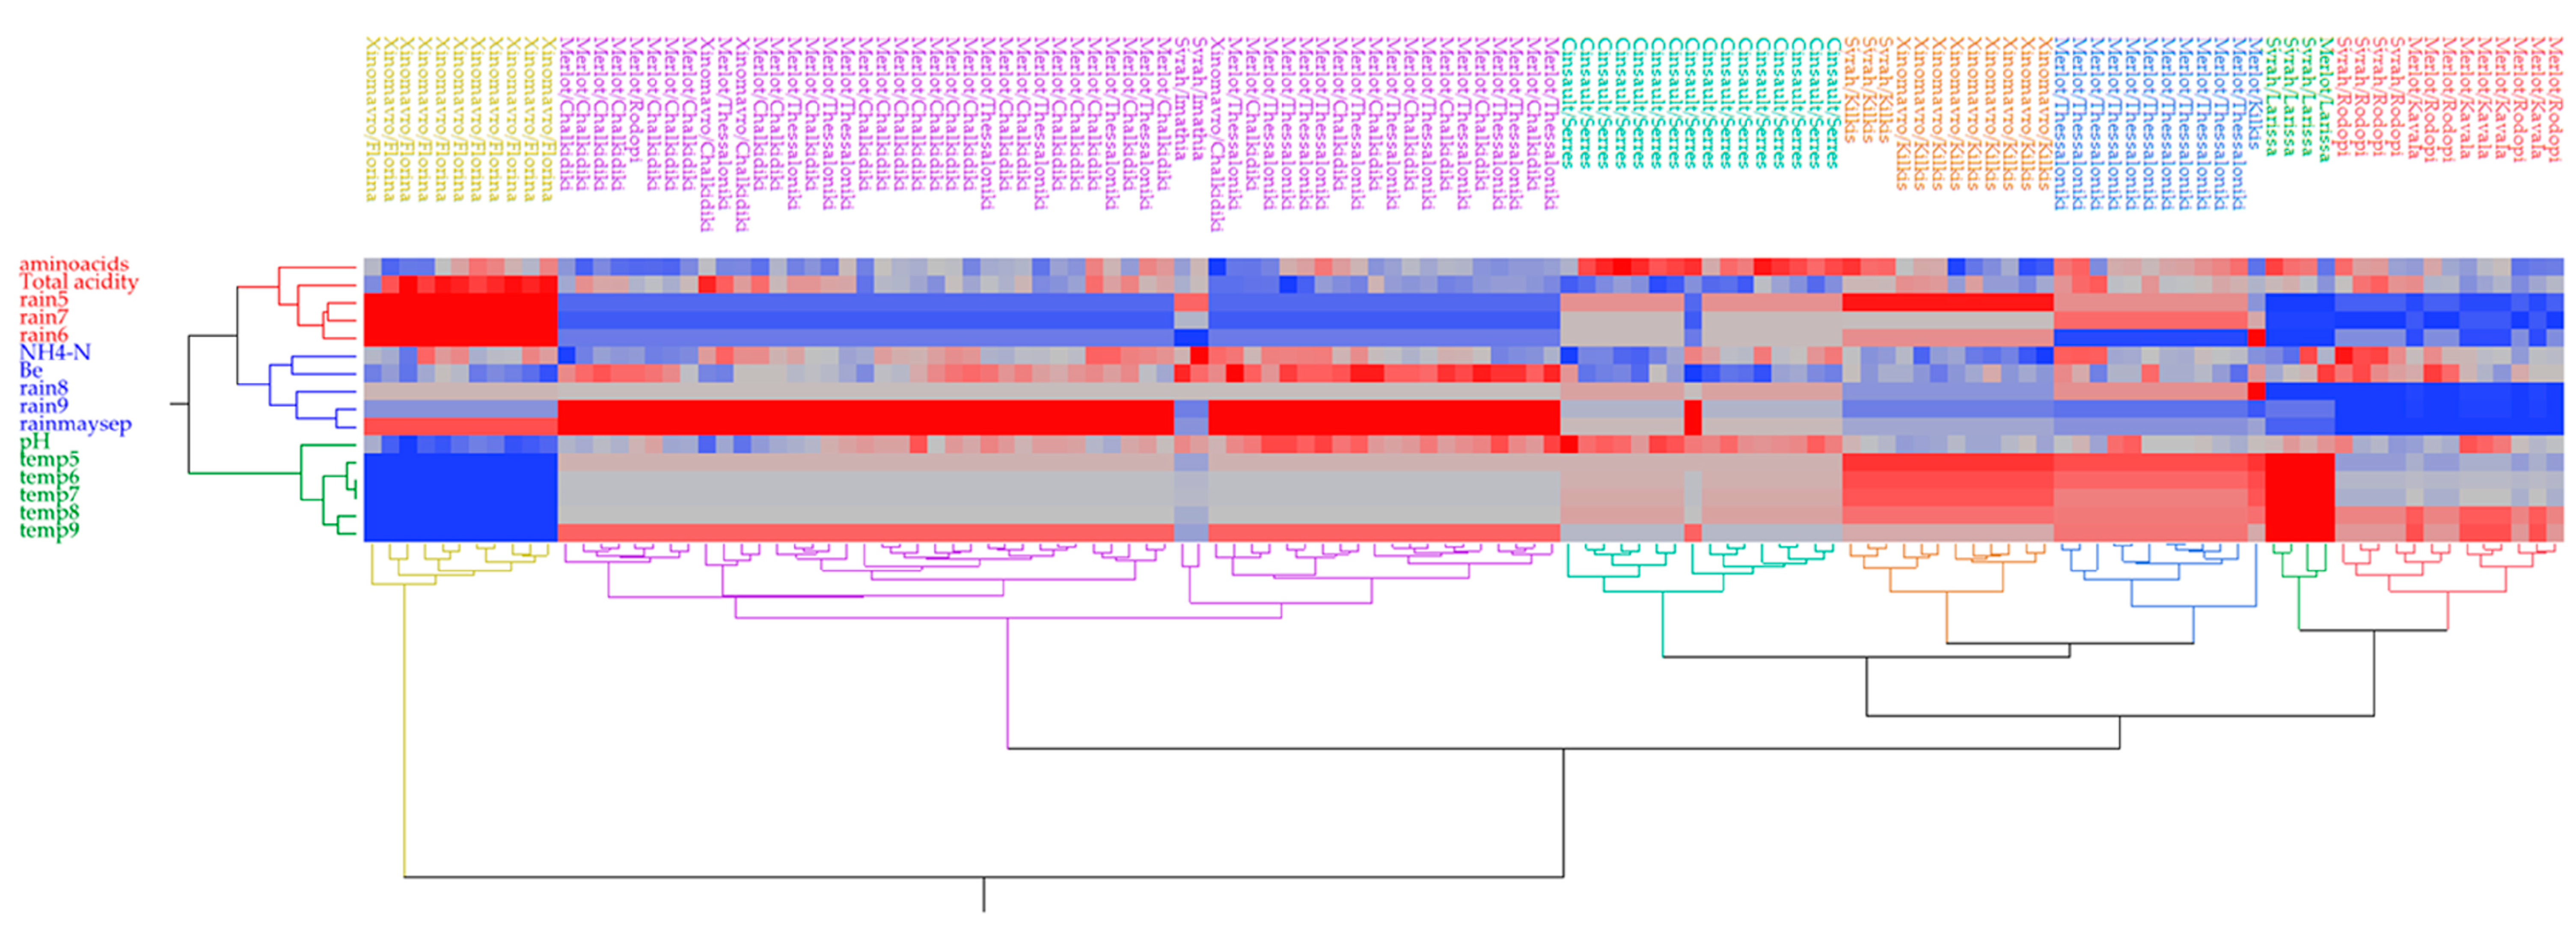
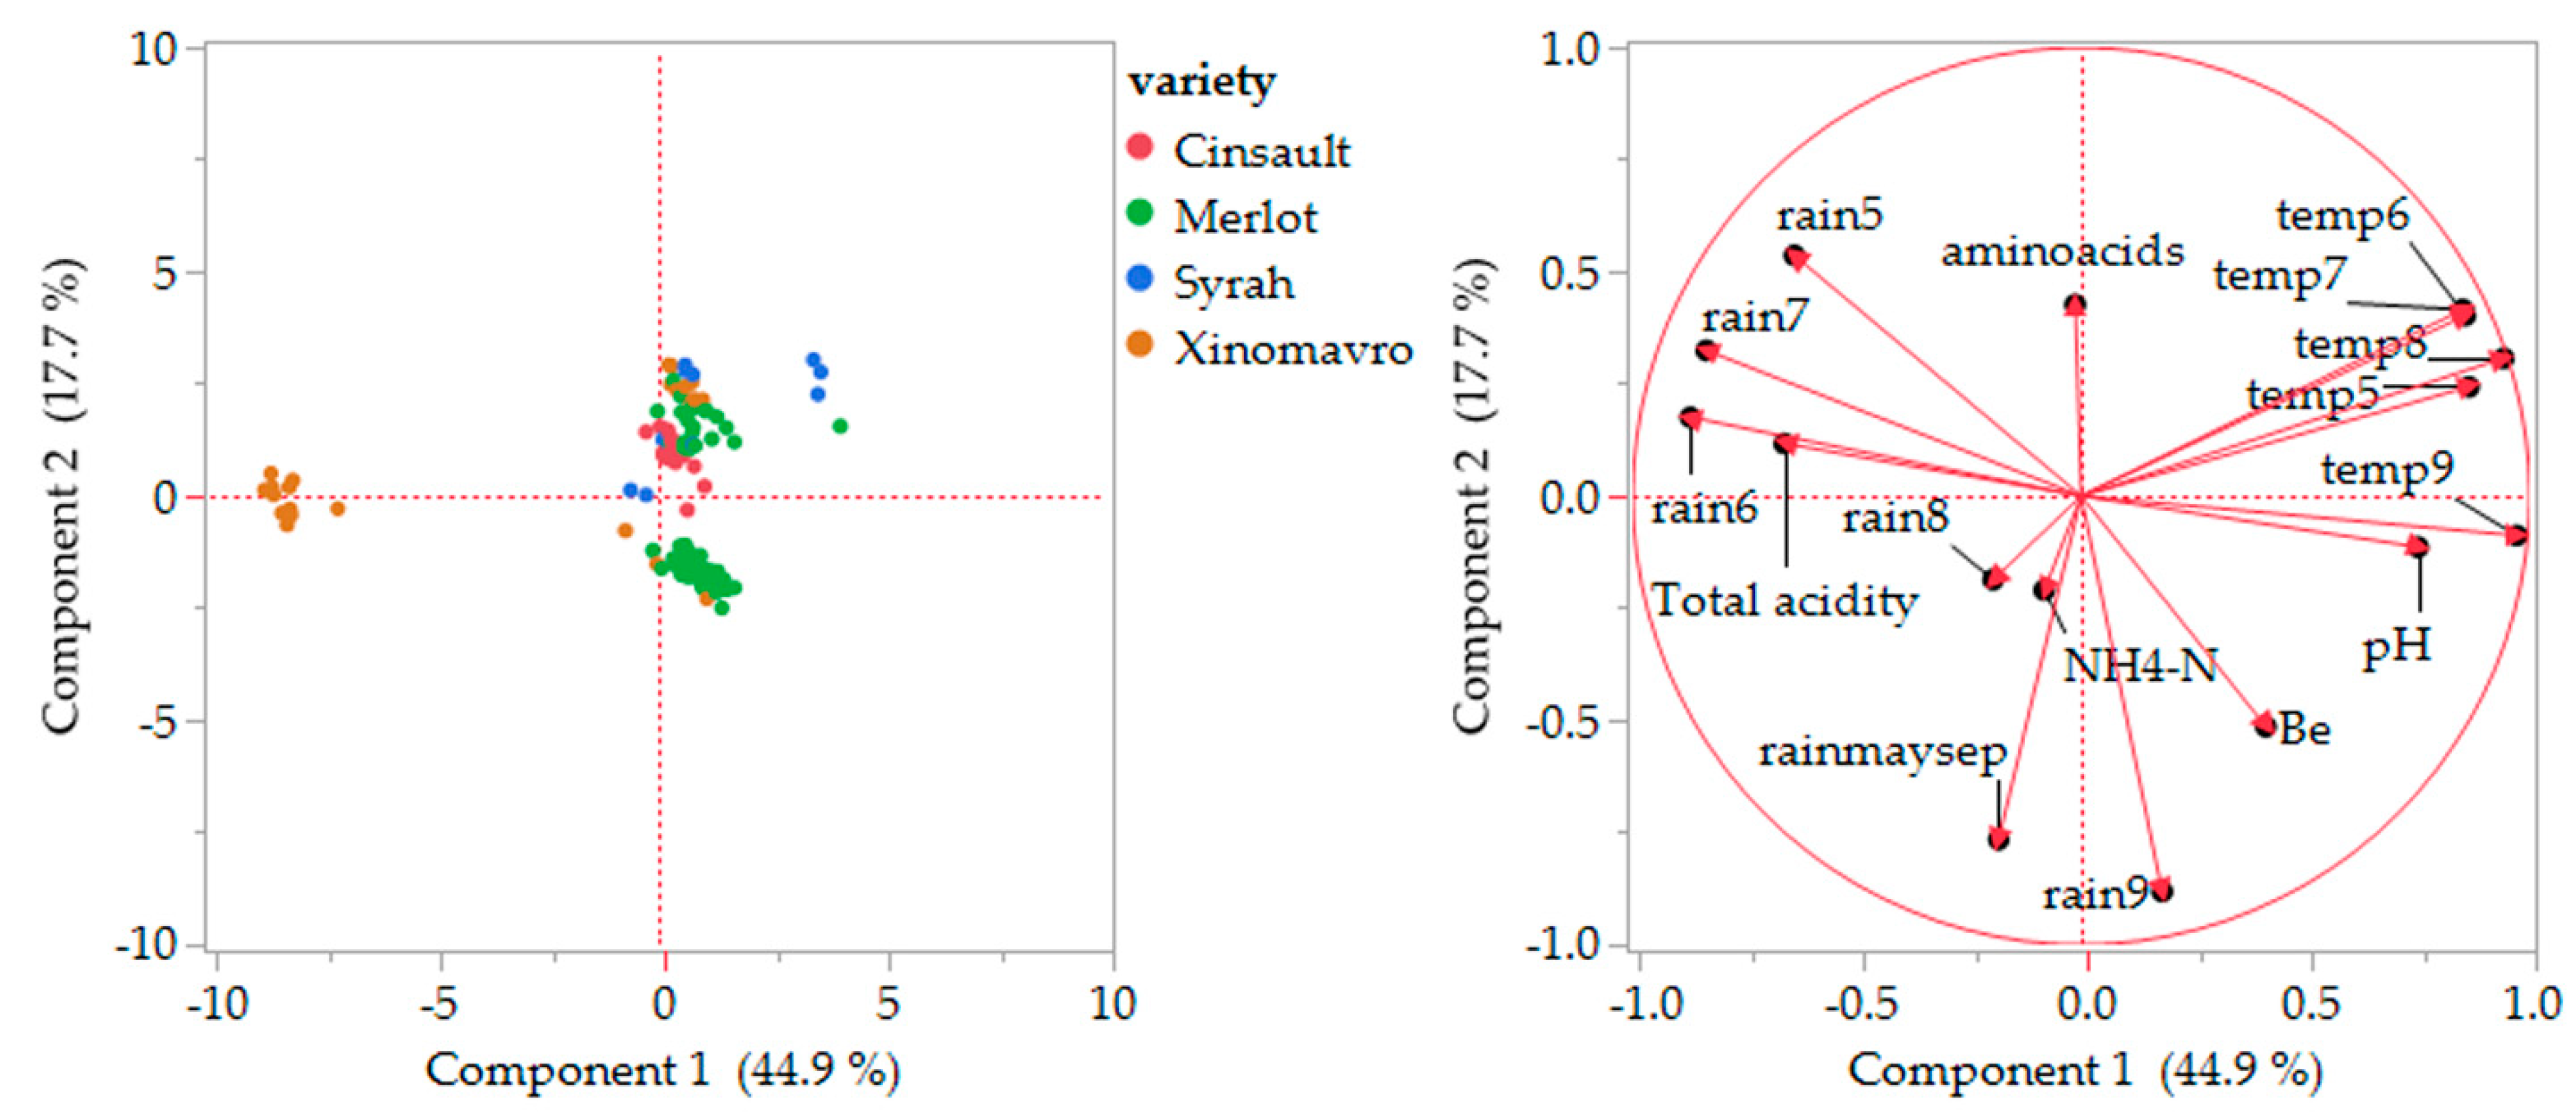
3.3. Region and Effect of Climate

The collected samples originated from 12 different regional units belonging to six regions: the Central Macedonia region (Chalkidiki, Imathia, Kilkis, Serres, Thessaloniki, and Mount Athos), Western Macedonia (Florina, Pella), Eastern Macedonia (Kavala), Thrace (Rodopi), Aegean Islands (Lemnos), and Thessaly (Larissa). (Supplementary Table S2). We elected to examine the effect of grape origin based on regional units (smaller areas than regions) as it would reflect better climatic conditions in the respective vineyards. In order to evaluate each region’s climate, data regarding precipitation and temperatures were collected from each regional unit for the period between May and September, as most of the varieties are harvested during August and September.
For the explanatory analysis, grape varieties with fewer than eight samples were not included. Merlot and Sauvignon Blanc samples were collected from six and five different regional units, respectively, trying to represent each regional unit. With respect to the climatic data, the general description of each regional unit based on the collected data is as follows:
Thrace/Rodopi: high temperatures over 25 °C during July–August, rainfall of 5 mm during July–September, and rainfall of 62 mm during May–September.
Eastern Macedonia/Kavala: high temperatures over 25 °C during July–August, rainfall of 18 mm during July–September, and rainfall of 62 mm in May–September.
Central Macedonia/Serres: high temperatures over 25 °C during July–August, rainfall of 254 mm during July–September, and high rainfall (357 mm) in May–September.
Central Macedonia/Kilkis: high temperatures over 25 °C during June–August, 27 mm of rainfall during June–August and >100 mm in September, and a total rainfall of 292 mm during May–September.
Central Macedonia/Thessaloniki: high temperatures over 25 °C during June–August, rainfall of 47 mm during June–August and >90 mm in September, and a total rainfall 245 mm in May–September.
Central Macedonia/Chalkidiki: high temperatures > 25 °C July–August, rainfall of 43 mm during June–August and >350 mm in September, and a total rainfall 460 mm in May–September.
Central Macedonia/Athos: high temperatures > 25 °C July–August, rainfall of 16 mm during June–August and >75 mm in September, and a total rainfall of 233 mm in May–September.
Central Macedonia/Imathia: high temperatures > 25 °C July–August, rainfall of 42 mm during June–August and >100 mm in September, total rainfall < 250 mm in May–September.
Central Macedonia/Pella: high temperatures > 25 °C July–August, rainfall of 78 mm during June–September, 10 mm in September, and a total rainfall of 186 mm in May–September.
Western Macedonia/Florina: low temperatures below 25 °C during all months, rainfall of 300 mm during July–September, 150 mm in September, and a total rainfall of 420 mm in May–September.
Thessaly/Larissa: high temperatures over 25 °C during June–August and low total rainfall of 150 mm during May and September (none during July–August, and nearly 100 mm in September).
North Aegean/Lemnos: high temperatures during June–August, no rainfall during June–September, and a total rainfall of 45 mm in May–September.
Cluster analysis was performed to find relationships among the samples collected using nitrogen composition, basic oenological parameters and climate data (rainfall and temperatures), which are different per regional unit. Genetic classification of different plant matrices (e.g., wine, maize, and sweet cherries) has been done previously using cluster analysis, occasionally or in conjunction with principal components analysis [44,45,46,47].

3.3.1. White Grape Varieties

In the previous sections, it was noted that the high variation in FAN and YAN content cannot be attributed only to the grape variety. Therefore, cluster analysis was performed to reveal possible relationships between the nitrogen fractions and oenological attributes and climate data (Figure 3), as climate affects both maturity (sugar content, titratable acidity) and nitrogen compounds in grapes [30]. Samples from white varieties were divided into groups of increasing dissimilarity according to the heat map generated. White samples were arranged in seven well-defined groups (noted with different colors: red, blue, green, brown, blue-green, violet, and yellow), suggesting similar composition within the same group. It seems that the arrangement is done mainly according to the grape variety and regional unit of origin.
On the other hand, the variables are organized into two clusters (shown in red, and blue). The red cluster comprises variables FAN, NH4-N, total acidity, total rainfall (May-September), as well as rainfall for each month from June to September. The rainfall during ripening and total acidity have been correlated. Tartaric and malic acids build up before the veraison. Due to respiration and the loss of malic acid, as well as berry enlargement (and the dilution of both acids), the acid concentration reduces during ripening and sugar accumulation. Because the rate of malic acid breakdown increases as the temperature rises, grapes cultivated in cooler climates or harvested earlier in the season typically have higher amounts of acidity in the must and wine. In the blue cluster are the variables linked with temperatures from May to September, rainfall in May, pH value, and sugar level (Baume) [48].
Grouping in clusters of different colors revealed differences among white grape musts. More specifically, the red group consisted of Sauvignon Blanc and Chardonnay samples from Rodopi and Kavala regional units, characterized by medium-to-higher FAN content, low-to-no rainfall (<5 mm) in July–August, and low total rainfall (<62 mm) from May to September. The green cluster grouped Sauvignon Blanc and Roditis varieties from the regional unit Thessaloniki and appeared to be closely related to the blue group consisting of the Chardonnay variety from the Pella regional unit. Those groups were characterized by 67 mm of rain during July and August, higher FAN values, and less than 250 mm of rainfall during May and September. The brown group included various subgroups from two cultivars Sauvignon Blanc and Roditis, from regional units of Thessaloniki and Chalkidiki, which are geographically close to each other. These samples were characterized by intermediate-to-higher FAN levels, rainfall over 90 mm during September and >245 mm during May–September, rainfall during June and August, and lower sugar levels. The samples in the blue-green clusters were of Sauvignon Blanc and Roditis grapes from the Mount Athos regional unit, which were distinguished by low FAN and NH4-N levels, nearly no rain during the June to August period, high temperatures during August and September, higher-than-average sugars and pH values, and lower total acidity. The purple group contained Muscat of Alexandria grapes from the Lemnos regional unit, with low-to-intermediate FAN values, low NH4-N, higher pH values, dry thermal climate (a total lack of rainfall from June to September, and high temperatures during August and September). Lastly, the yellow group grouped two Greek native cultivars, Roditis and Debina, from the Larissa regional unit. Those samples were characterized either by high FAN values and lower NH4-N values (Roditis), or low FAN and higher NH4-N (Debina), higher pH values, intermediate levels of sugars, high temperatures from June to September, and almost no rainfall during the summer months. Specific clusters were identified based on regions.
It appears that the same white variety was grouped in separate clusters based on the regional units where it was cultivated. This was the case for Sauvignon blanc, Roditis, and Chardonnay grapes, suggesting different compositions for each group. Soufleros, Bouloumpasi, Tsarchopoulos, and Biliaderis [39] noted differences in the a-amino acid content of Roditis wines cultivated in different regions, with samples originating from Macedonia, Central Greece, and Peloponnesos containing on average 496, 428, and 394 mg L−1 of α-amino acids. Soufleros et al. [39] and Schrader et al. [49] have previously reported that the region’s climate and the grapes’ level of maturity could affect the total content of amino acids in the juice. Petropoulos, Metafa, Kotseridis, Paraskevopoulos, and Kallithraka [30] found that the temperature generally increased amino acid content, although rainfall showed the opposite trend. Garde-Cerdan, Lorenzo, Lara, Pardo, Ancin-Azpilicueta, and Salinas [3] also noted that the amount of nitrogen compounds in grapes depended on their maturation stage.
A principal component analysis (PCA) was performed for white grape varieties using FAN (a-amino acids), ammoniacal nitrogen (NH4-N), basic must analyses (Be, pH, and total acidity), and climate data to examine whether these compounds may lead to any grouping of samples according to variety. The resulting plots for white must are presented in Figure 4. The PCA results showed that the two main components (Component 1 × Component 2) explained only 54.2% of the total variance (Components 3, 4, and 5 explained other 13%, 11%, and 6.56%, explaining about 84.76% of the total variation). The PCA score plot (Figure 4, left) shows a pattern in which the samples from Muscat of Alexandria are placed closely together in the lower right quartile, the samples from Debina are placed together in the upper right quartile, and the samples from other varieties form separate groups. The Chardonnay, Sauvignon blanc, and Roditis samples are spread in two or more groups. Specifically, the Chardonnay samples are all placed in the lower left quartile, forming two separate groups, one of which is located in the left lower part and comprises samples from a single regional unit (Pella), thus suggesting grouping not only based on the cultivar but also on the regional unit.
The loading plots (Figure 4, right) show that amino acids were negatively affected by both components, while ammoniacal nitrogen and total acidity were negatively affected by the first component and positively by the second component. Amino acid content (FAN) appears to be positively correlated with rainfall during June and July and negatively to temperature from May to July. Ammoniacal nitrogen positively correlated with total rainfall during May–September, especially rainfall in August and September, and a negative correlation with pH, Baume, the temperature during August (ripening period), and the rainfall during May (growing period). No correlation was found between amino acid and ammoniacal nitrogen levels. Similarly to the heat map, the PCA grouped samples based on both the variety and the region, suggesting that the region, with its unique climate, has a significant input on the content of assimilable nitrogen compounds in the grape.

3.3.2. Red Grape Varieties

Similarly to the white grape samples, a heatmap cluster analysis for the red grape samples based on nitrogen status, oenological parameters, and climate data for rainfall and temperature revealed the presence of seven clusters (Figure 5). On the other hand, the variables are organized into three clusters (shown in red, blue, and green). The red cluster comprises the variables FAN, total acidity, and rainfall for June, July, and August. The blue cluster groups variables such as NH4-N content, Baume, total rainfall (May–September), as well as rainfall in August and September. Lastly, in the green cluster the rest of the variables (temperatures from May to September and pH value) are included. The grouping of red musts under different colors reveals differences among the samples. More specifically, the red cluster is composed of Merlot and Syrah samples from Rodopi and Kavala regional units, characterized by low FAN content, medium-to-higher NH4-N content, nearly no rainfall (<5 mm) during July–August, and low total rainfall (<62 mm) from May to September. The green group, which appears to be closely related to the red group, includes Syrah and Merlot samples from the Larissa regional unit and is also characterized by a lack of rainfall (<1 mm) during July–August, low total rainfall from May–September (<140 mm), and higher temperatures from May to September in contrast to the red group. The blue cluster comprises the Merlot variety from the Thessaloniki regional unit and is characterized by intermediate-to-higher FAN levels and high temperatures from May to September. The brown cluster includes two cultivars, Xinomavro and Syrah, from the Kilkis regional unit and is characterized by low-to-intermediate FAN levels, low NH4-N levels, high temperatures from May to August, and rainfall of 150 mm during May–June. The blue-green group includes the Cinsault variety from the Serres regional unit, and its characteristics include the highest FAN along with low NH4-N, sugar, total acidity levels, intermediate temperatures, and rainfall of 360 mm from May to September. The purple cluster comprises three cultivars, Merlot, Syrah, and Xinomavro, from three regional units, Thessaloniki, Chalkidiki, and Imathia, and consists of several subgroups. It is characterized by low FAN content, low rainfall from June to August but high in September, intermediate-to-high sugars, and ammoniacal nitrogen values. Lastly, the yellow cluster includes the Xinomavro variety grown in the Florina regional unit and differs from the others due to higher total acidity, lower sugar content, rainfall of 240 mm from May to July, and lower temperatures from May to September in comparison to other groups.
It appears that the heat map grouped samples based primarily on the climate conditions of the regional unit and secondarily on the variety. Regional units such as Florina, Larissa, and Rodopi/Kavala are distinguished based on rainfall and temperatures (low or high), independently of the variety, while the other regional units of Central Macedonia do not discriminate much. Petropoulos, Metafa, Kotseridis, Paraskevopoulos, and Kallithraka [30] reported that rainfall had a detrimental impact on the amino acid content of Agiorgitiko grapes in the viticultural region of Nemea from veraison through harvest, although the increased ambient temperature had the reverse effect.
The principal component analysis performed for red grape varieties explained 62.6% (Component 1 × Component 2) of the total variance (Component 3 and 4 explained the other 12.3% and 7.92%, explaining about 82.82% of the total variation) (Figure 6). The PCA score plot (Figure 6, left) grouped the Xinomavro cultivar originating from the Florina regional unit positioned upon the horizontal axis at the far-left side. The other Xinomavro samples are positioned near the center of the plot, together with the other samples from the Central Macedonia region (the Chalkidiki, Thessaloniki, Imathia, Kilkis, and Serres regional units). All those areas are characterized by a lack of rainfall during ripening and high temperatures during the June–August period. Similarly, the Syrah cultivar is spread into four groups depending on the origin (Rodopi, Kilkis, Imathia, and Larissa). The placement of the samples from the same variety in different quartiles or the same implies that they are arranged based on other parameters, e.g., samples placed in the upper right quartile are affected by temperatures during May–September, the period of growing and ripening of grapes, and Larissa is the area with the highest mean temperatures among the examined regional units for all months, except September (see Supplementary Table S2).
The loading plots (Figure 6, right) reveal that amino acids were positively affected by the second component, while ammoniacal nitrogen was negatively affected by both components. No correlation was found between amino acid and ammoniacal nitrogen levels. In conclusion, the heat map and PCA grouped the red must samples based on both the variety and the region.

4. Conclusions

In the present study, the yeast assimilable nitrogen status of the musts of several Greek grape-growing areas and varieties, both native and international, was surveyed. The musts from technologically ripe grapes analyzed varied largely in their assimilable nitrogen content. The content of international varieties cultivated in Greece fell within the range noted by other researchers. About 36% of the Greek samples were below the suggested by some authors deficiency threshold of 140 mg L−1, thus posing a danger of problems with the nutrition of yeasts in the course of fermentation unless it occurs an addition of a nitrogen source. Significant differences were observed among varieties, with international varieties found to be richer in assimilable nitrogen than most of the natives included in this survey. Some international varieties had a high content of YAN, similar to surveys conducted in Italy and the United States. This study also revealed that not only grape variety but also cultivation region is a determinator of the concentration and composition of YAN. This work brings insights into the knowledge about native and international cultivars of great commercial interest. In addition, this work can be useful to understand how commercial varieties included in this study can behave in different climates in the context of climate change.

Supplementary Materials

The following supporting information can be downloaded at: https://www.mdpi.com/article/10.3390/fermentation9080773/s1, Table S1: Meteorological data (temperature and rainfall) during growth period May–September 2017; Table S2: Variation (minimum–maximum value observed) of Yeast Assimilable Nitrogen, Free Amino Nitrogen, ammoniacal Nitrogen in grape musts categorized per grape origin (mg N L−1 must).

Author Contributions

Conceptualization, E.B. and E.H.S.; methodology, E.B.; software, E.B. and A.S.; formal analysis, E.B.; investigation, E.B.; resources, E.H.S.; data curation, E.B. and A.S.; writing—original draft preparation, E.B. and A.S.; writing—review and editing, E.B., A.S. and E.H.S.; visualization, E.B. and A.S.; supervision, E.H.S.; project administration, E.H.S. All authors have read and agreed to the published version of the manuscript.

Funding

This research received no external funding.

Data Availability Statement

The data presented in this study are available on request from the corresponding author (pending privacy and ethical considerations).

Conflicts of Interest

The authors declare no conflict of interest.

References

  1. Sponholz, W. Nitrogen compounds in grapes, must, and wine. In Proceedings of the International Symposium on Nitrogen in Grapes and Wine, Seattle, WA, USA, 18–19 June 1991; pp. 67–77. [Google Scholar]
  2. Nicolini, G.; Larcher, R.; Versini, G. Status of yeast assimilable nitrogen in Italian grape musts and effects of variety, ripening and vintage. Vitis 2004, 43, 89–96. [Google Scholar] [CrossRef]
  3. Garde-Cerdan, T.; Lorenzo, C.; Lara, J.F.; Pardo, F.; Ancin-Azpilicueta, C.; Salinas, M.R. Study of the evolution of nitrogen compounds during grape ripening. Application to differentiate grape varieties and cultivated systems. J. Agric. Food Chem. 2009, 57, 2410–2419. [Google Scholar] [CrossRef] [PubMed]
  4. Bisson, L. Yeast and biochemistry of ethanol formation. In Principles and Practices of Winemaking; Boulton, R.B., Singleton, V.L., Bisson, L.F., Kunkee, R.E., Eds.; Chapman & Hall: New York, NY, USA, 1996; pp. 140–172. [Google Scholar]
  5. Henschke, P.A.; Jiranek, V. Yeasts-metabolism of nitrogen compounds. In Wine Microbiology Biotechnology; Fleet, G.H., Ed.; Harwood Academic: Chur, Switzerland, 1993; Volume 77, pp. 77–164. [Google Scholar]
  6. Su, Y.; Heras, J.M.; Gamero, A.; Querol, A.; Guillamón, J.M. Impact of nitrogen addition on wine fermentation by S. cerevisiae strains with different nitrogen requirements. J. Agric. Food Chem. 2021, 69, 6022–6031. [Google Scholar] [CrossRef] [PubMed]
  7. Barbosa, C.; Mendes-Faia, A.; Mendes-Ferreira, A. The nitrogen source impacts major volatile compounds released by Saccharomyces cerevisiae during alcoholic fermentation. Int. J. Food Microbiol. 2012, 160, 87–93. [Google Scholar] [CrossRef]
  8. Bely, M.; Sablayrolles, J.-M.; Barre, P. Automatic detection of assimilable nitrogen deficiencies during alcoholic fermentation in oenological conditions. J. Ferment. Bioeng. 1990, 70, 246–252. [Google Scholar] [CrossRef]
  9. Hernandez-Orte, P.; Bely, M.; Cacho, J.; Ferreira, V. Impact of ammonium additions on volatile acidity, ethanol, and aromatic compound production by different Saccharomyces cerevisiae strains during fermentation in controlled synthetic media. Aust. J. Grape Wine R. 2006, 12, 150–160. [Google Scholar] [CrossRef]
  10. Barbosa, C.; Falco, V.; Mendes-Faia, A.; Mendes-Ferreira, A. Nitrogen addition influences formation of aroma compounds, volatile acidity and ethanol in nitrogen deficient media fermented by Saccharomyces cerevisiae wine strains. J. Biosci. Bioeng. 2009, 108, 99–104. [Google Scholar] [CrossRef]
  11. Christofi, S.; Papanikolaou, S.; Dimopoulou, M.; Terpou, A.; Cioroiu, I.B.; Cotea, V.; Kallithraka, S. Effect of yeast assimilable nitrogen content on fermentation kinetics, wine chemical composition and sensory character in the production of assyrtiko wines. Appl. Sci. 2022, 12, 1405. [Google Scholar] [CrossRef]
  12. Bell, S.J.; Henschke, P.A. Implications of nitrogen nutrition for grapes, fermentation and wine. Aust. J. Grape Wine R. 2005, 11, 242–295. [Google Scholar] [CrossRef]
  13. Webster, D.R.; Edwards, C.G.; Spayd, S.E.; Peterson, J.C.; Seymour, B.J. Influence of vineyard nitrogen fertilization on the concentrations of monoterpenes, higher alcohols, and esters in aged riesling wines. Am. J. Enol. Vitic. 1993, 44, 275–284. [Google Scholar] [CrossRef]
  14. Butzke, C.E. Survey of yeast assimilable nitrogen status in musts from California, Oregon, and Washington. Am. J. Enol. Vitic. 1998, 49, 220–224. [Google Scholar] [CrossRef]
  15. EU. European Commission Delegated Regulation (EU) 2019/934 of 12 March 2019 Supplementing Regulation (EU) No 1308/2013 of the European Parliament and of the Council as Regards Wine-Growing Areas Where the Alcoholic Strength May Be Increased, Authorised Oenological Practices and Restrictions Applicable to the Production and Conservation of Grapevine Products, the Minimum Percentage of Alcohol for By-Products and Their Disposal, and Publication. OJ 2019, 149, 1–52. [Google Scholar]
  16. Henschke, P.A.; Ough, C.S. Urea accumulation in fermenting grape juice. Am. J. Enol. Vitic. 1991, 42, 317. [Google Scholar] [CrossRef]
  17. Miliordos, D.E.; Kanapitsas, A.; Lola, D.; Goulioti, E.; Kontoudakis, N.; Leventis, G.; Tsiknia, M.; Kotseridis, Y. Effect of nitrogen fertilization on Savvatiano (Vitis vinifera L.) grape and wine composition. Beverages 2022, 8, 29. [Google Scholar] [CrossRef]
  18. Hannam, K.D.; Neilsen, G.H.; Forge, T.; Neilsen, D. The concentration of yeast assimilable nitrogen in Merlot grape juice is increased by N fertilization and reduced irrigation. Can. J. Plant Sci. 2013, 93, 37–45. [Google Scholar] [CrossRef]
  19. Linsenmeier, A.W.; Loos, U.; Löhnertz, O. Must composition and nitrogen uptake in a long-term trial as affected by timing of nitrogen fertilization in a cool-climate Riesling vineyard. Am. J. Enol. Vitic. 2008, 59, 255. [Google Scholar] [CrossRef]
  20. Hilbert, G.; Soyer, J.; Molot, C.; Giraudon, J.; Milin, M.; Gaudillere, J. Effects of nitrogen supply on must quality and anthocyanin accumulation in berries of cv. Merlot. Vitis 2015, 42, 69. [Google Scholar] [CrossRef]
  21. Nisbet, M.A.; Martinson, T.E.; Mansfield, A.K. Accumulation and prediction of yeast assimilable nitrogen in New York winegrape cultivars. Am. J. Enol. Vitic. 2014, 65, 325. [Google Scholar] [CrossRef]
  22. Petrovic, G.; Kidd, M.; Buica, A. A statistical exploration of data to identify the role of cultivar and origin in the concentration and composition of yeast assimilable nitrogen. Food Chem. 2019, 276, 528–537. [Google Scholar] [CrossRef]
  23. Garde-Cerdán, T.; Martínez-Gil, A.M.; Lorenzo, C.; Lara, J.F.; Pardo, F.; Salinas, M.R. Implications of nitrogen compounds during alcoholic fermentation from some grape varieties at different maturation stages and cultivation systems. Food Chem. 2011, 124, 106–116. [Google Scholar] [CrossRef]
  24. van Leeuwen, C.; Friant, P.; Soyer, J.-P.; Molot, C.; Choné, X.; Dubourdieu, D. Measurement of total nitrogen and assimilable nitrogen in grape juice to assess vine nitrogen status. J. Int. Sci. Vigne Vin. 2000, 34, 75–82. [Google Scholar] [CrossRef]
  25. Baron, M. Yeast assimilable nitrogen in South Moravian grape musts and its effect on acetic acid production during fermentation. Czech J. Food Sci. 2011, 29, 603–609. [Google Scholar] [CrossRef]
  26. Berger, S.; Schober, V.; Korntheuer, K.U.; Eder, R. Einfluss des hefeverwertbaren Stickstoffes auf die Gärung in Mosten der Sorten Grüner Veltliner, Rheinriesling, Welschriesling und Neuburger. Mitt. Klosterneubg. 1999, 49, 117–123. [Google Scholar]
  27. Nicolini, G.; Versini, G.; Corradin, L.; Larcher, R.; Beretta, C.; Olivari, A.; Eccli, E. Misura dell’azoto prontamente assimilabile dal lievito nei mosti d’uva ed esempi di applicazione. Riv. Vitic. Enol. 2004, 1–2, 13–27. Available online: http://hdl.handle.net/10449/17619 (accessed on 17 August 2023).
  28. Hagen, K.M.; Keller, M.; Edwards, C.G. Survey of biotin, pantothenic acid, and assimilable nitrogen in winegrapes from the Pacific Northwest. Am. J. Enol. Vitic. 2008, 59, 432. [Google Scholar] [CrossRef]
  29. Nisbet, M.A.; Martinson, T.E.; Mansfield, A.K. Preharvest prediction of yeast assimilable nitrogen in Finger Lakes Riesling using linear and multivariate modeling. Am. J. Enol. Vitic. 2013, 64, 485. [Google Scholar] [CrossRef]
  30. Petropoulos, S.; Metafa, M.; Kotseridis, Y.; Paraskevopoulos, I.; Kallithraka, S. Amino acid content of Agiorgitiko (Vitis vinifera L. cv.) grape cultivar grown in representative regions of Nemea. Eur. Food Res. Technol. 2018, 244, 2041–2050. [Google Scholar] [CrossRef]
  31. OIV. Compendium of International Methods of Wine and Must Analysis; OIV, International Organisation of Vine and Wine: Paris, France, 2018; Volume 1–2. [Google Scholar]
  32. Dukes, B.C.; Butzke, C.E. Rapid determination of primary amino acids in grape juice using an o-Phthaldialdehyde/N-Acetyl-L-Cysteine spectrophotometric assay. Am. J. Enol. Vitic. 1998, 49, 125. [Google Scholar] [CrossRef]
  33. Hernández-Orte, P.; Guitart, A.; Cacho, J.F. Changes in the concentration of amino acids during the ripening of Vitis vinifera Tempranillo variety from the denomination d’origine Somontano (Spain). Am. J. Enol. Vitic. 1999, 20, 144–154. [Google Scholar] [CrossRef]
  34. Sowalsky, R.A.; Noble, A.C. Comparison of the effects of concentration, pH and anion species on astringency and sourness of organic acids. Chem. Senses 1998, 23, 343–349. [Google Scholar] [CrossRef]
  35. Panzeri, V.; Ipinge, H.N.; Buica, A. Evaluation of South African Chenin Blanc wines made from six different Trellising systems using a chemical and sensorial approach. S. Afr. J. Enol. Vitic. 2020, 41, 133–150. [Google Scholar] [CrossRef]
  36. Bouloumpasi, E.; Koutsouridou, V.; Soufleros, E.; Greveniotis, V. Nitrogen status of grapes cultivated under conventional and organic farming systems (PoS2-82). In Proceedings of the XV European Society for Agronomy Congress, Geneva, Switzerland, 27–31 August 2018; p. 164. [Google Scholar]
  37. Bouloumpasi, E.; Soufleros, E.H.; Tsarchopoulos, C.; Biliaderis, C.G. Primary amino acid composition and its use in discrimination of Greek red wines with regard to variety and cultivation region. Vitis 2015, 41, 195–202. [Google Scholar] [CrossRef]
  38. Etiévant, P.; Schlich, P.; Bouvier, J.-C.; Symonds, P.; Bertrand, A. Varietal and geographic classification of French red wines in terms of elements, amino acids and aromatic alcohols. J. Sci. Food Agr. 1988, 45, 25–41. [Google Scholar] [CrossRef]
  39. Soufleros, E.H.; Bouloumpasi, E.; Tsarchopoulos, C.; Biliaderis, C.G. Primary amino acid profiles of Greek white wines and their use in classification according to variety, origin and vintage. Food Chem. 2003, 80, 261–273. [Google Scholar] [CrossRef]
  40. Huang, Z.; Ough, C.S. Effect of vineyard locations, varieties, and rootstocks on the juice amino acid composition of several cultivars. Am. J. Enol. Vitic. 1989, 40, 135. [Google Scholar] [CrossRef]
  41. Verdenal, T.; Dienes-Nagy, Á.; Spangenberg, J.E.; Zufferey, V.; Spring, J.-L.; Viret, O.; Marin-Carbonne, J.; van Leeuwen, C. Understanding and managing nitrogen nutrition in grapevine: A review. OENO One 2021, 55, 1–43. [Google Scholar] [CrossRef]
  42. AWRI. Yeast Assimilable Nitrogen. Available online: https://www.awri.com.au/industry_support/winemaking_resources/wine_fermentation/yan/ (accessed on 16 August 2023).
  43. Stines, A.P.; Grubb, J.; Gockowiak, H.; Henschke, P.A.; HØJ, P.B.; van Heeswijck, R. Proline and arginine accumulation in developing berries of Vitis vinifera L. in Australian vineyards: Influence of vine cultivar, berry maturity and tissue type. Aust. J. Grape Wine R. 2000, 6, 150–158. [Google Scholar] [CrossRef]
  44. Skendi, A.; Papageorgiou, M.; Stefanou, S. Preliminary study of microelements, phenolics as well as antioxidant activity in local, homemade wines from North-East Greece. Foods 2020, 9, 1607. [Google Scholar] [CrossRef]
  45. Greveniotis, V.; Bouloumpasi, E.; Zotis, S.; Korkovelos, A.; Ipsilandis, C.G. Stability, the last frontier: Forage yield dynamics of peas under two cultivation systems. Plants 2022, 11, 892. [Google Scholar] [CrossRef]
  46. Greveniotis, V.; Giourieva, V.; Bouloumpasi, E.; Sioki, E.; Mitlianga, P. Morpho-physiological characteristics and molecular markers of maize crosses under multi-location evaluation. J. Agric. Sci. 2018, 10, 79–90. [Google Scholar] [CrossRef]
  47. Ganopoulos, I.; Moysiadis, T.; Xanthopoulou, A.; Ganopoulou, M.; Avramidou, E.V.; Aravanopoulos, F.A.; Tani, E.; Madesis, P.; Tsaftaris, A.; Kazantzis, K. Diversity of morpho-physiological traits in worldwide sweet cherry cultivars of GeneBank collection using multivariate analysis. Sci. Hortic. 2015, 197, 381–391. [Google Scholar] [CrossRef]
  48. Lakso, A.N.; Kliewer, W.M. The influence of temperature on malic acid metabolism in grape berries: I. Enzyme responses. Plant Physiol. 1975, 56, 370–372. [Google Scholar] [CrossRef] [PubMed]
  49. Schrader, U.; Lemperle, E.; Becker, N.J.; Bergner, K.E. Der Aminosäure-Zucker, Saure-, and Mineralstoffgehalt von Weinbeeren in Abhängigkeit vom Kleinklima des Standortes der Rebe. Wein-Wissensch 1976, 31, 160–175. [Google Scholar]
Figure 1. Regional units of Greece involved in the present study (noted in pink).
Fermentation 09 00773 g001
Figure 2. Average YAN concentrations (in mg N L−1) according to variety, represented as a stacked plot of FAN and ammonia concentrations.
Fermentation 09 00773 g002
Figure 3. Heatmap of correlations for musts from white grape varieties between the nitrogen composition, basic oenological parameters, and climate data (rainfall and temperatures for months May to September. Rainfall (rain) and temperatures (temp) for months May (5) to September (9); Blue areas in the map dendrogram indicate low values, whereas the red areas indicate high values.
Fermentation 09 00773 g003
Figure 4. Plots of principal component analysis scores (left) and loadings (right) for the composition of the white musts. Rainfall (rain) and temperatures (temp) for months May (5) to September (9); rainmaysep is total rainfall from months May to September.
Fermentation 09 00773 g004
Figure 5. Heatmap of correlations for musts from red grape varieties between the nitrogen composition and basic oenological parameters and climate data rainfall (rain) and temperatures (temp) for months May (5) to September (9)); Blue areas in the map dendrogram indicate low values whereas the red areas indicate high values.
Fermentation 09 00773 g005
Figure 6. Plots of principal component analysis scores (left) and loadings (right) for the composition of the red musts. Rainfall (rain) and temperatures (temp) for months May to September; rainmaysep is total rainfall from months May to September.
Fermentation 09 00773 g006
Table 1. Name, color, origin of grape variety, number of the must samples collected and regional units of cultivation.
Grape VarietyVariety ColorOrigin of VarietyNumber of SamplesRegional Units
Assyrtiko1N5Chalkidiki
Cabernet Sauvignon2I2Chalkidiki
Chardonnay1I11Pella, Rodopi
Cinsault2I16Serres
Debina1N8Larissa
Grenache Rouge2I4Chalkidiki
Limnio2N6Rodopi
Merlot2I74Chalkidiki, Kavala, Kilkis, Larissa, Thessaloniki, Rodopi
Muscat Hamburg2I4Larissa
Muscat of Alexandria1I12Lemnos
Roditis1/2N33Chalkidiki, Larissa, Mount Athos, Thessaloniki
Sauvignon Blanc1I54Chalkidiki, Kavala, Mount Athos, Rodopi, Thessaloniki
Syrah2I12Imathia, Kilkis, Larissa, Rodopi
Ugni Blanc1I6Larissa
Xinomavro2N23Chalkidiki, Florina, Kilkis
Zoumiatiko1N4Serres
Variety color: 1: white; 2: red; origin of variety: I: international; N: native.
Table 2. Yeast assimilable nitrogen, free amino nitrogen, ammoniacal nitrogen and oenological parameters of the musts according to the grape color 1,2.
SamplesNo of SamplesYAN (N L−1)FAN (N L−1)NH4-N Ammonia (N L−1)Baume (Be)pHTotal Acidity (g L−1 Tartaric Acid)
All samples27439.79–277.5030.58–222.900.70–142.869.10–16.102.87–3.793.51–10.59
(161.20/158.90)(107.77/103.90)(53.43/56.15)(11.85/11.90)(3.42/3.44)(6.41/6.34)
White grapes13239.79–277.5030.58–222.900.70–142.869.10–16.103.15–3.654.46–8.81
(166.68/172.67)(117.44/117.25) a(49.24/47.14) a(11.39/11.35) a(3.40/3.41) a(6.46/6.51)
Red grapes14241.73–265.5530.77–193.002.30–112.409.96–14.102.87–3.793.51–10.59
(156.11/155.39)(98.77/94.36) a(57.33/59.59) a(12.28/12.30) a(3.44/3.47) a(6.36/6.14)
1. The mean/median values of the measurements are shown in parentheses. 2. Within the same column, medians between white and red groups of musts with the same letter differ significantly from each other (p < 0.05), as determined by the independent median test.
Table 3. Variation (minimum–maximum value observed) of yeast assimilable nitrogen, free amino nitrogen, ammoniacal nitrogen and oenological parameters in grape musts categorized per grape variety (mg N L−1 must) 1,2.
VarietyNo of SamplesYAN (N L−1)FAN (N L−1)NH4-N Ammonia (N L−1)Baume (Be)pHTotal Acidity (g L−1 Tartaric Acid)
Sauvignon blanc54110.02–271.86 (190.43/187.99) aeksw61.36–176.90 (119.88/119.10) elm15.56–142.86 (70.55/81.33) ek9.10–13.00 (10.80/10.60) abc3.15–3.58 (3.34/3.36) f5.02–8.81 (6.87/6.73) af
Chardonnay11178.14–277.50 (235.67/228.20) bfiloqtxz136.80–222.90 (186.55/194.80) bchkl10.61–79.51 (49.11/47.10)10.50–12.49 (11.56/11.70) i3.26–3.61 (3.43/3.40)6.19–8.44 (7.27/7.16) b
Ugni blanc689.60–176.40 (124.55/111.14) op54.71–160.60 (95.14/68.58)10.00–63.18 (29.41/22.21)9.80–11.67 (10.80/10.65)3.32–3.45 (3.38/3.37)5.43–6.64 (6.00/5.95)
Muscat of Alexandria1239.79–174.94 (104.01/86.86) klmn30.58–145.60
(82.40/66.64) cd
9.21–31.67 (21.62/20.92) fghijk10.90–13.20 (12.55/12.65) aeg3.33–3.58 (3.49/3.50) a4.87–7.39 (5.93/5.97)
Zoumiatiko484.00–120.40 (100.10/98.00) efgh51.53–89.14
(66.34/62.35)
31.26–35.76 (33.76/34.01)9.11–10.40 (10.00/10.25)3.34–3.40 (3.38/3.39)5.17–5.48 (5.39/5.45)
Debina8107.80–192.96 (135.20/126.00) qr46.33–95.32 (67.41/66.13) ab47.17–97.64 (67.79/61.96) i11.30–12.50 (11.97/12.00)3.41–3.55 (3.48/3.50) b5.17–7.20 (5.81/5.66)
Assyrtiko5100.80–154.00 (133.45/133.25)44.84–76.33 (65.73/67.14)55.96–77.94 (67.72/68.98)11.80–13.80 (12.80/12.80)3.17–3.35 (3.23/3.20)7.09–8.4 (7.68/7.54)
Roditis3370.00–275.41 (156.85/154.00) zα62.04–212.10 (134.76/133.20) fi0.70–83.51 (22.09/14.90) abcde10.20–16.10 (11.79/11.60) j3.24–3.65 (3.48/3.49) cg4.46–7.95 (5.86/5.85) f
Merlot7489.71–238.86 (152.66/150.05) wxy50.46–148.90
(89.72/85.49) efgh
18.44–89.96 (62.94/61.53) bh10.80–14.00 (12.68/12.75) bdhij3.27–3.68 (3.48/3.50) dh3.51–8.78 (6.27/6.19) c
Cinsault16110.76–265.55 (211.75/217.00) cgjmpruyα92.72–193.00
(156.67/160.90) dgj
18.04–81.87 (55.08/59.30) cg9.96–12.70 (11.17/11.10) def3.52–3.79 (3.60/3.59) fgh3.83–6.38 (4.93/4.91) abcde
Grenache rouge473.06–124.60 (109.67/120.50) ij70.76–117.70
(94.06/93.89)
2.30–30.43 (15.61/14.85)13.70–14.10 (13.83/13.75)3.45–3.49 (3.46/3.46)5.00–6.08 (5.54/5.53)
Syrah12148.40–252.00
(203.66/209.41) dhnv
82.35–170.60
(130.53/140.65) a
33.30–112.40 (73.14/71.44) dj11.50–13.70 (12.57/12.50) cf3.26–3.57 (3.45/3.47) e6.04–8.66 (7.00/6.73) d
Cabernet Sauvignon2105.21–123.20
(114.21/114.21)
59.50–64.88 (62.19/62.19)45.71–58.32 (52.02/52.02)11.90–13.80 (12.85/12.85)3.41–3.52 (3.47/3.47)5.29–5.95 (5.62/5.62)
Muscat Hamburg495.20–144.20
(118.35/117.00)
87.62–128.10
(108.41/108.95)
3.40–16.10 (9.95/10.14)12.20–12.60 (12.45/12.50)3.51–3.6 (3.57/3.58)3.60–4.56 (4.00/3.92)
Xinomavro2363.12–204.65
(142.08/149.33) stuv
31.53–141.00
(86.07/95.25) ijkm
17.08–87.49
(56.01/57.79) af
10.30–12.80 (11.55/11.50) gh2.87–3.47 (3.19/3.15) abcde4.61–10.59 (8.00/7.61) e
Limnio641.73–110.88
(72.53/76.55) abcd
30.77–43.66 (39.33/41.15)4.12–67.59
(33.21/38.00)
10.80–12.20 (11.38/11.30)3.21–3.43 (3.32/3.33)5.63–7.91 (6.40/6.19)
1. The mean/median values of the measurements are shown in parentheses. 2. Within one column, medians of groups of grape musts with the same letter differ significantly from each other (p < 0.05), as determined by the independent samples Kruskal–Wallis test followed by Dunn’s pairwise tests adjusted using the Bonferroni correction.
Disclaimer/Publisher’s Note: The statements, opinions and data contained in all publications are solely those of the individual author(s) and contributor(s) and not of MDPI and/or the editor(s). MDPI and/or the editor(s) disclaim responsibility for any injury to people or property resulting from any ideas, methods, instructions or products referred to in the content.

