Article

Design and Construction of a New Reactor for Flexible Biomethanation of Hydrogen

1
Institute NOWUM-Energy, University of Applied Sciences Aachen, Heinrich-Mussmann-Str. 1, 52428 Juelich, Germany
2
Department of Environmental Microbiology Helmholtz Centre for Environmental Research—UFZ, Permoserstr. 15, 04318 Leipzig, Germany
*
Authors to whom correspondence should be addressed.
Fermentation 2023, 9(8), 774; https://doi.org/10.3390/fermentation9080774
Submission received: 29 June 2023 / Revised: 14 August 2023 / Accepted: 17 August 2023 / Published: 19 August 2023
(This article belongs to the Special Issue Fermentation Processes: Modeling, Optimization and Control)

Abstract

:
The increasing share of renewable electricity in the grid drives the need for sufficient storage capacity. Especially for seasonal storage, power-to-gas can be a promising approach. Biologically produced methane from hydrogen produced from surplus electricity can be used to substitute natural gas in the existing infrastructure. Current reactor types are not or are poorly optimized for flexible methanation. Therefore, this work proposes a new reactor type with a plug flow reactor (PFR) design. Simulations in COMSOL Multiphysics ® showed promising properties for operation in laminar flow. An experiment was conducted to support the simulation results and to determine the gas fraction of the novel reactor, which was measured to be 29%. Based on these simulations and experimental results, the reactor was constructed as a 14 m long, 50 mm diameter tube with a meandering orientation. Data processing was established, and a step experiment was performed. In addition, a kLa of 1 h−1 was determined. The results revealed that the experimental outcomes of the type of flow and gas fractions are in line with the theoretical simulation. The new design shows promising properties for flexible methanation and will be tested.

1. Introduction

The climate crisis is about to reveal its dramatic consequences for all life on earth. Carbon emissions must be halted as soon as possible to counteract human-induced climate change [1]. Therefore, the transition of energy systems to renewable technologies is essential. The number of wind turbines and photovoltaic (PV) systems and their share in electricity production will further increase in the upcoming years. As a result, electricity production will become more dependent on weather conditions [2]. This can lead to instability in the electricity grid [3]. Increasing e-mobility and electrification of the heat sector further challenge grid stability [4,5].
Energy storage systems help maintain grid stability and reduce the curtailment of wind and PV systems through grid control measures. Electrochemical, mechanical, thermal, chemical, electrical, and hybrid systems are used to store energy [6,7]. An energy storage can be centralized or distributed. Distributed energy storage is primarily found in homes, commercial buildings, and industrial facilities. It is used to achieve various goals, including increasing self-generation, reducing grid dependency, promoting energy independence, lowering costs, and reducing fossil fuel consumption. Centralized energy storage is installed at strategic locations on the grid to support the overall electricity system and to provide operational flexibility, peak shaving, grid stability, and cost savings. It also supports the integration of renewable energy by providing backup power during periods of low generation [8]. Thus, centralized energy storage is critical to overall grid stability, while distributed energy storage provides support at the local level. It is also important to distinguish between short-term storage, with storage periods ranging from seconds to days, and long-term storage, with storage periods ranging from weeks to seasons.
While there are many different short-term storage systems, long-term storage is limited to a few pumped hydro and thermal storage systems, as well as power-to-gas (P2G) and power-to-liquids storage [9]. The advantage of these types of storage is that they can also be used to supplement fuel for vehicles or heating systems. This can help decarbonize existing mobility and heating systems by ensuring they transition to fully electrified energy systems [10]. The most common P2G applications use electricity to electrolyze water into oxygen and hydrogen. The hydrogen can either be directly stored or processed into other gases or liquids. Methanation describes the conversion of hydrogen and carbon dioxide to methane, with methane serving as a substitute for natural gas. Conversion to methane is less efficient than directly using hydrogen, but methane is cheaper to transport because of its higher volumetric energy density. In addition, many countries have well-established natural gas networks with a storage capacity that can be used. However, converting a natural gas network to a hydrogen network requires significant time and financial investment, and there is still a lack of understanding of the options for converting existing pipelines [11,12].
Chemical or biotechnological methods can be used to perform methanation. Chemical methanation uses catalysts in the Sabatier process. The biotechnological approach uses microorganisms called methanogenic archaea that are capable of producing methane. Biomethanation can be carried out either directly by hydrogenotrophic methanogens from hydrogen and carbon dioxide or indirectly by homoacetogens producing acetate, which is further converted by acetoclastic archaea [13]. The direct route is advantageous because acetoclastic methane production releases carbon dioxide. Methanation can occur directly in a biogas plant by injecting hydrogen, called in situ methanation. However, in situ methanation can seriously inhibit the digestion of the biogas substrate if the hydrogen flow is too high [14,15]. When biomethanation is performed in a separate reactor that is fed with hydrogen and a carbon dioxide source, it is called ex situ methanation. Ex situ methanation is easier to operate and can achieve higher methane production rates than in situ methanation [15,16].
There are several reactor concepts used for biomethanation, of which the most relevant systems are briefly described below. Continuous stirred tank reactors (CSTRs) have agitators and can be supplemented with spargers. Gas can be supplied either through the headspace or via gas injection at the bottom of the reactor [17]. Mass transfer is primarily dependent on agitation of the system. CSTRs use high-speed agitators and, therefore, have high energy consumption. Trickle bed reactors typically consist of a packed bed covered with a biofilm that is irrigated to provide nutrients and to maintain moisture. In these reactors, the large volumetric interfacial area created by the biofilm growing on the packed bed covered by a thin layer of liquid is advantageous for mass transfer. Membrane reactors contain a porous membrane that separates the gas and liquid phases. Gas is introduced through the membrane. These reactors do not require additional mixing, but the membrane pores can become clogged due to biofilm formation [18]. Plug-flow reactors (PFRs) are tubular reactors. The tubular design allows for the use of high pressures. Reactor length, diameter, and fluid flow rate define the residence time of the PFR. Thus, the conversion rate of a PFR depends on its length. PFRs are currently not widely used in methanation processes [19]. Bubble column reactors are a special type of PFR used for gas fermentation. They use gas bubbles to facilitate mixing and to enhance mass transfer. The use of smaller gas bubbles results in a larger volumetric interfacial area. In addition, agitators and optimized recirculation can be used to improve the mixing process [17,18]. The most common systems for hydrogen biomethanation are CSTRs and trickle bed reactors [20,21]. Overcoming the limitations of hydrogen mass transfer is a key challenge in methanation, and the volumetric mass transfer coefficient kLa can be used to compare the efficiency. It can be increased by decreasing the bubble size, which results in an increased volumetric interfacial area and can be achieved by sparging or agitation [22]. It has recently been proposed that the mass transfer for thin biofilms may not be dependent on the kLa but on a Fick-like diffusion, leading to an advantage for trickle bed reactors with thin biofilms [18]. Bubble column reactors, membrane reactors, and trickle bed reactors seem to be favorable for use in ex situ methanation. Trickle bed reactors can be used to achieve high hydrogen uptake and conversion rates with low energy consumption when the mass transfer is the main limitation [18].
If hydrogen for methanation is produced from renewable energy sources with fluctuating hydrogen production rates and downtime due to a lack of wind or sun, the reactor used for methanation should be adapted to the fluctuating hydrogen feed. Therefore, either hydrogen storage is needed to avoid downtime, or the methanation reactor design must be sufficient to avoid long start-up times due to the lag phase of the microorganisms. However, it was shown in a previous study that microbial communities can be resilient upon starvation, and even after 14 days of downtime, reactivation without lag phase can be achieved [23]. For trickle bed reactors, it has been reported that the time for recovery after downtimes of 12 h to 24 h is between 1.5 h and 7 h [24,25]. PV plant downtimes of ≥12 h can occur. Existing reactors face challenges, particularly when the recovery time exceeds the duration of the power supply, making them unsuitable for shorter operating periods, such as when power is derived from PV systems. This work aims to develop a reactor optimized for fast recovery after downtimes. Therefore, the aim is to shorten start-up phases. This can be achieved by increasing the travel distance of the gas phase in the reactor, either by cascading or by increasing the height of the reactors. Cascading common reactor systems increases investment costs as the number of cascades directly affects the required construction components. Furthermore, increasing the height of bioreactors on an industrial scale poses challenges to structural integrity and mixing, requiring robust construction materials and techniques to withstand the increased weight and pressure while ensuring efficient mixing and uniform nutrient distribution throughout the reactor volume. This limits the use of bubble column reactors, for example, because the travel distance of the gas phase is limited by the height of the reactor. Bubble column reactors are vertical tubes containing a liquid, a gas, and sometimes a solid phase. Bubble column reactors tend to be larger in diameter than PFR reactors. There are many ways to improve the properties of a bubble column reactor, including static mixers [26]. In addition, the bubble column reactor is designed for bubble-to-slug flow but not for laminar-stratified flow [27].
Contrarily, PFRs can provide long travel distances of the gas phase without losing its ability to be operated under increased pressure. They are well-established for chemical applications, especially when aiming for high conversion rates [28]. The PFR design has already been tested for methanation with a biofilm PFR [19]. In contrast, the reactor design described in this paper is a meandering orientation PFR with a liquid phase carrying the microorganisms and a gaseous phase carrying the substrate and the product, similar to a bubble column reactor. Since the mass transfer of hydrogen is less limited in biofilm reactors, lower methane production rates can be expected in our system, but nutrients can be easily supplied, and the risk of clogging is lower compared with that in the biofilm reactor. Packed tubes for trickle bed operation were considered too challenging, as the bed could lead to high-pressure drops in long tubular reactors [20]. Static mixers can be used to improve the mixing and dispersion of gas–liquid fluids with laminar flow in PFR [29]. Therefore, a static mixer was designed and integrated into the reactor. In addition, the proposed reactor design with an extra-long meandering tube would extend the residence time to counteract the negative effect of lag phases after shutdowns.

2. Materials and Methods

The reactor design consists of a 50 mm diameter polyvinyl chloride tube, an integrated static mixer in the form of a helical structure, hereafter referred to as a helical structure, to further improve the properties of the reactor, a gas analysis unit, and a data processing unit. The helical inlays were first designed, modeled, and simulated in COMSOL Multiphysics®, and then tested in an experimental setup. Finally, the reactor with helical inlays was installed for characterization and testing, as shown in Figure 1.

2.1. Computational Model

For the simulation, two domain models of the meandering column reactor with and without helical structures were modeled in COMSOL Multiphysics® 6.1. The helical structures were imported from a Solid Works® 2021 model. The mass transfer rate of the liquid (water) and gas (80% H2 + 20% CO2) mixture was simulated based on these domain models. Both domains comprised a reactor with a cylindrical geometry of 0.5 m in length and 0.06 m in diameter. A helical structure obtained from Solid Works® 2021 was integrated into domain 2, possessing a spiral geometry with a width of 0.05 m. To obtain the model of the system, the “Two-phase flow, laminar model” under fluid flow in COMSOL Multiphysics® was chosen. This model is a special case of two-phase flow. The level-set technique was used for both domain systems. A time-resolved study was carried out.
Physics: Table 1 lists the liquid and gas properties, as well as the magnitude of the gravity component. Boundary conditions: There are four faces present bounding the calculation domain, which are the inlet boundaries for liquid and gas, the outlet boundary, and the wall boundary. Table 1 presents the boundary conditions for the simulation.

2.2. Mesh Independence Test and Model Validation

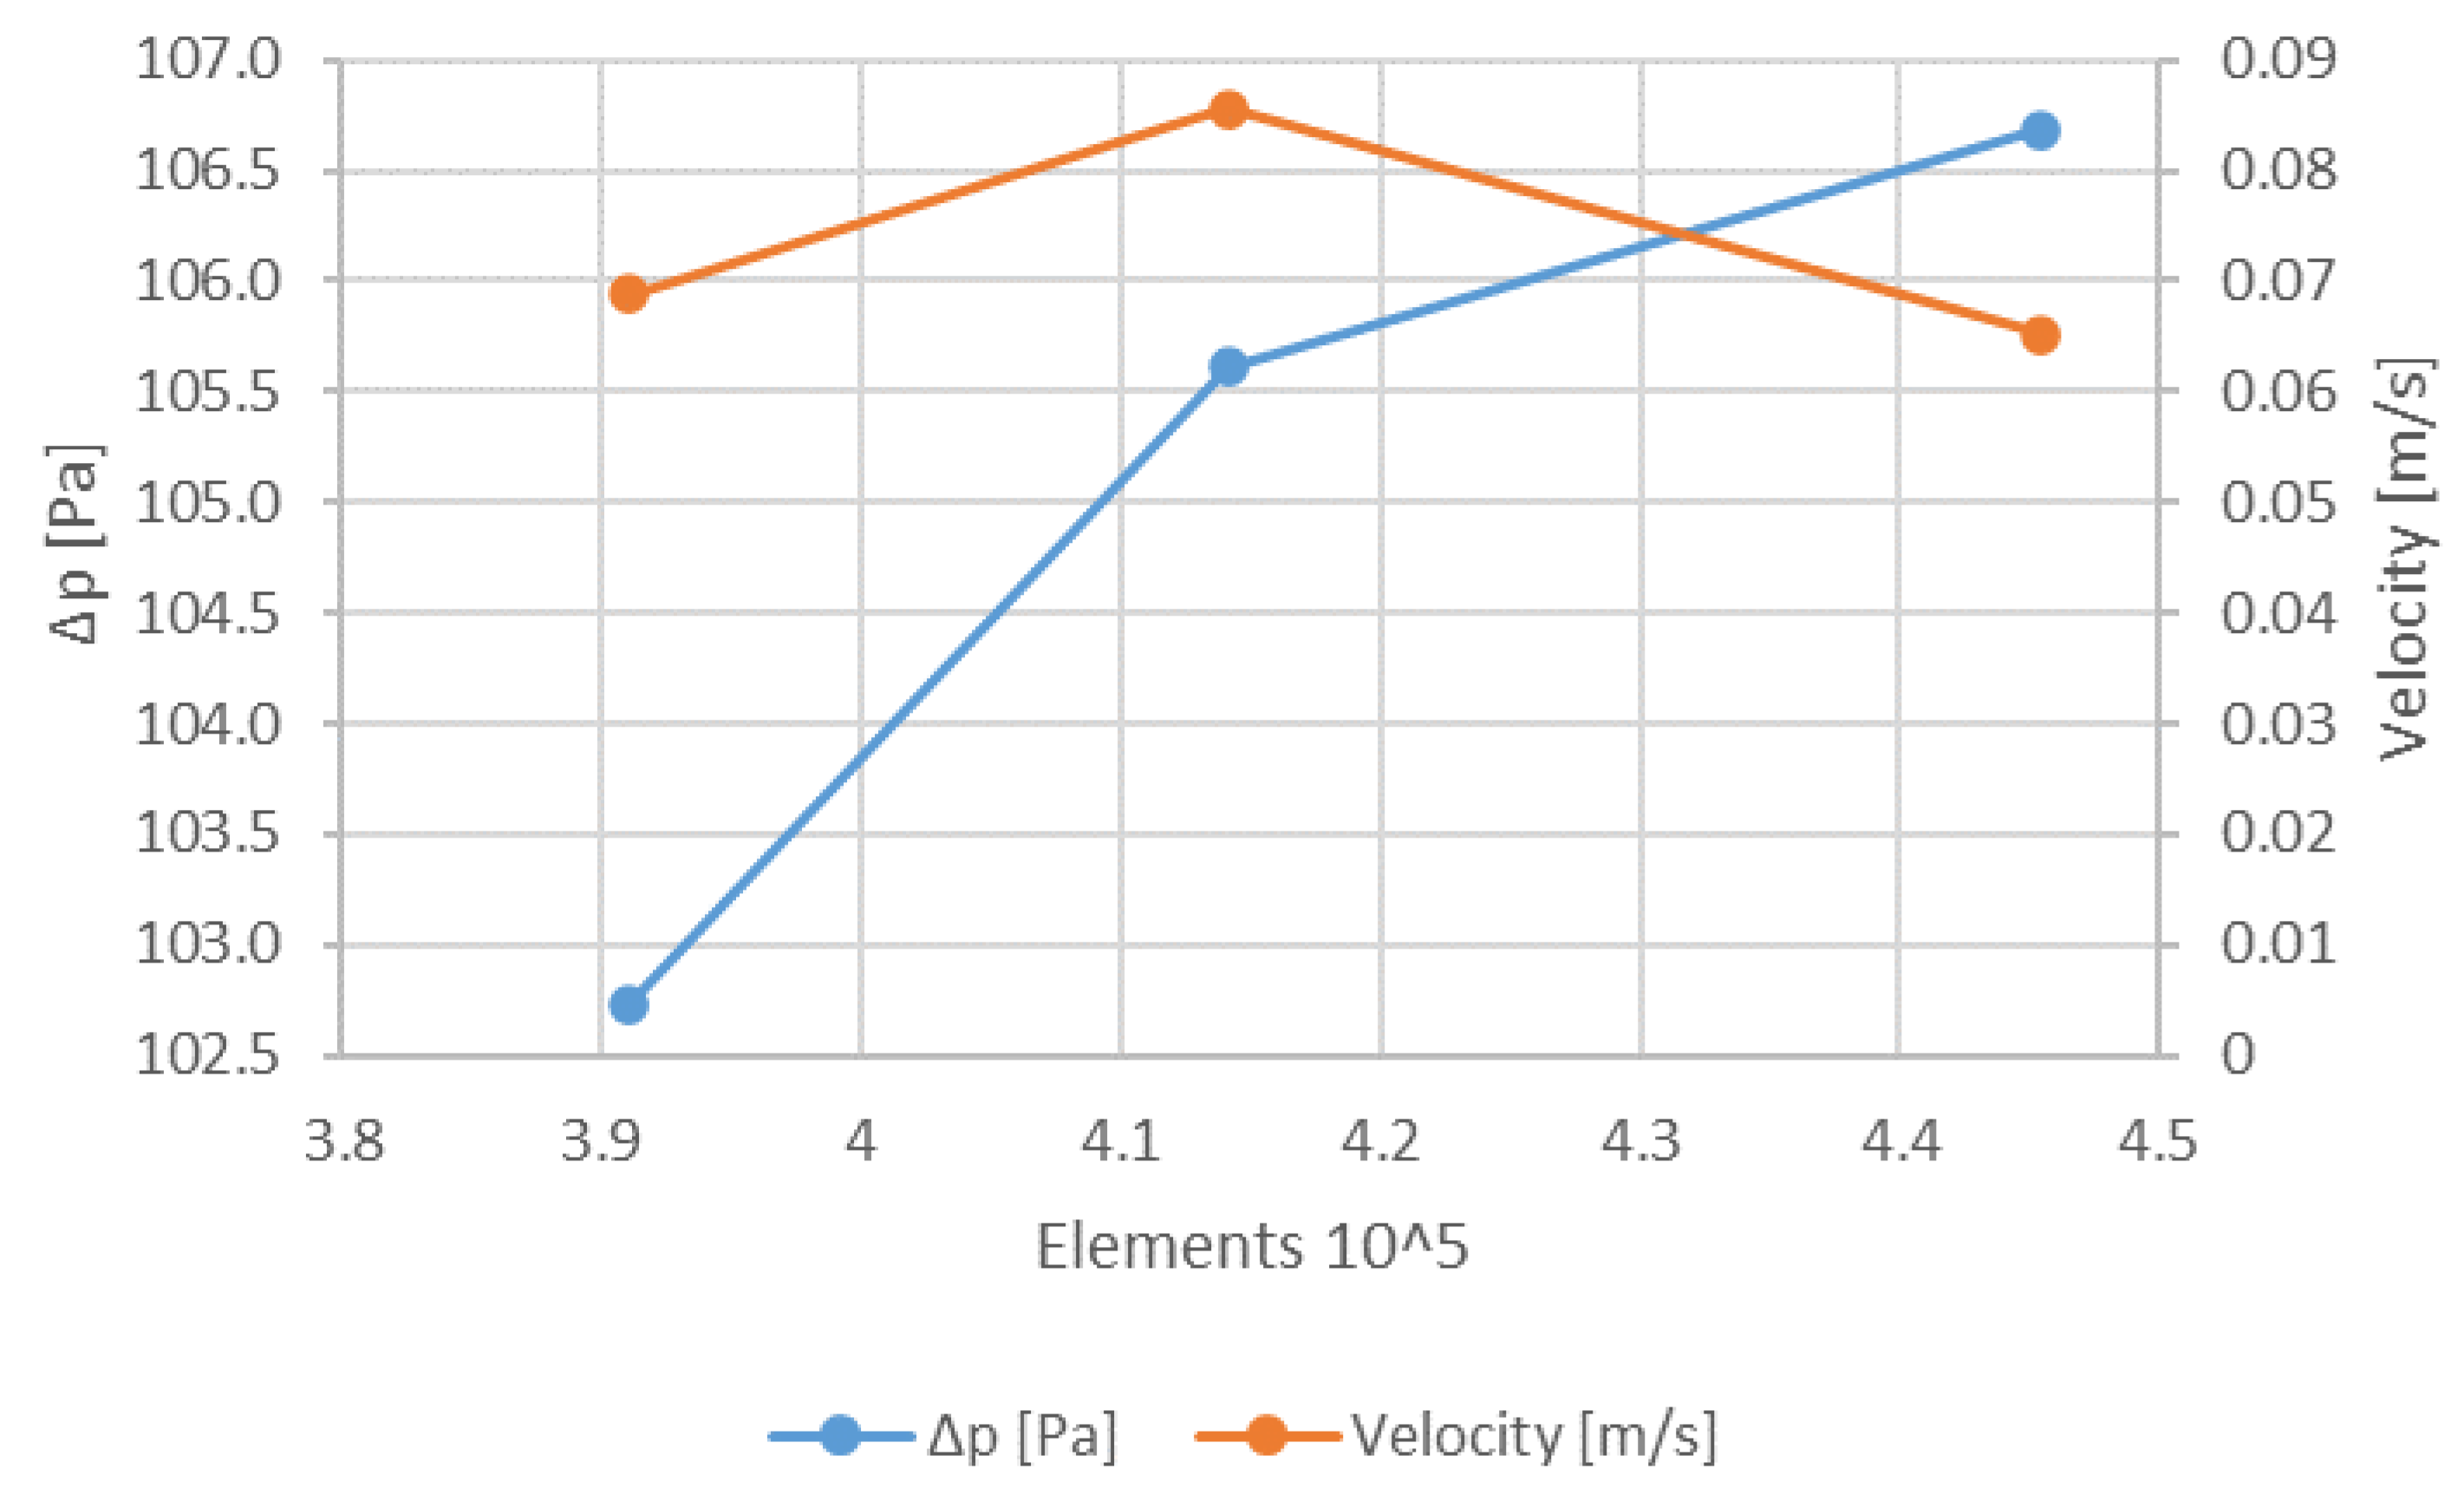
A mesh dependence test for the static mixer in the form of a helical mixer was performed to ensure that the node density was sufficient. Since the goal of the simulation is limited to estimating the flow pattern and mixing properties based on the streamlines, the focus was on pressure drop and velocity. The mesh was applied with a higher density at the helical structure and the pipe wall. Figure 2 shows that the influence of the mesh was small under the given conditions, although the pressure drop increased slightly with an increasing number of elements. Empirical data on pressure drop, velocity, and mixing characteristics should be collected in the future to validate the model better. However, the model is sufficient for its purpose and has been used to design the static mixer in the form of a helical structure and to estimate its basic properties. The model can be further developed in the future.
Meshes were designed to simulate the streamline flow and velocity distribution of the two domains described in 2.1. Domain 1 (Figure 3a bottom) had 267,116 solid elements, 3684 surface elements, and 365 line elements, resulting in 44,930 degrees of freedom. Instead, domain 2 (Figure 3b bottom) had 35,552 solid elements, 36,616 surface elements, and 6824 line elements, resulting in 379,280 degrees of freedom.
The liquid (L) enters the reactor on the left side of the reactor column, while the gas (G) enters the reactor perpendicular to the liquid. The mesh design used for the simulation is shown at the bottom of Figure 3a. The model of domain 2 is shown in Figure 3b. The column is the same as in domain 1, but the helical structure is integrated into the column. This results in a different mesh design with a more detailed mesh at the edges of the helix.
Despite the mesh, both computational domain systems were given the same dimensions, properties, settings, and conditions during simulation.

2.3. Experimental Setup

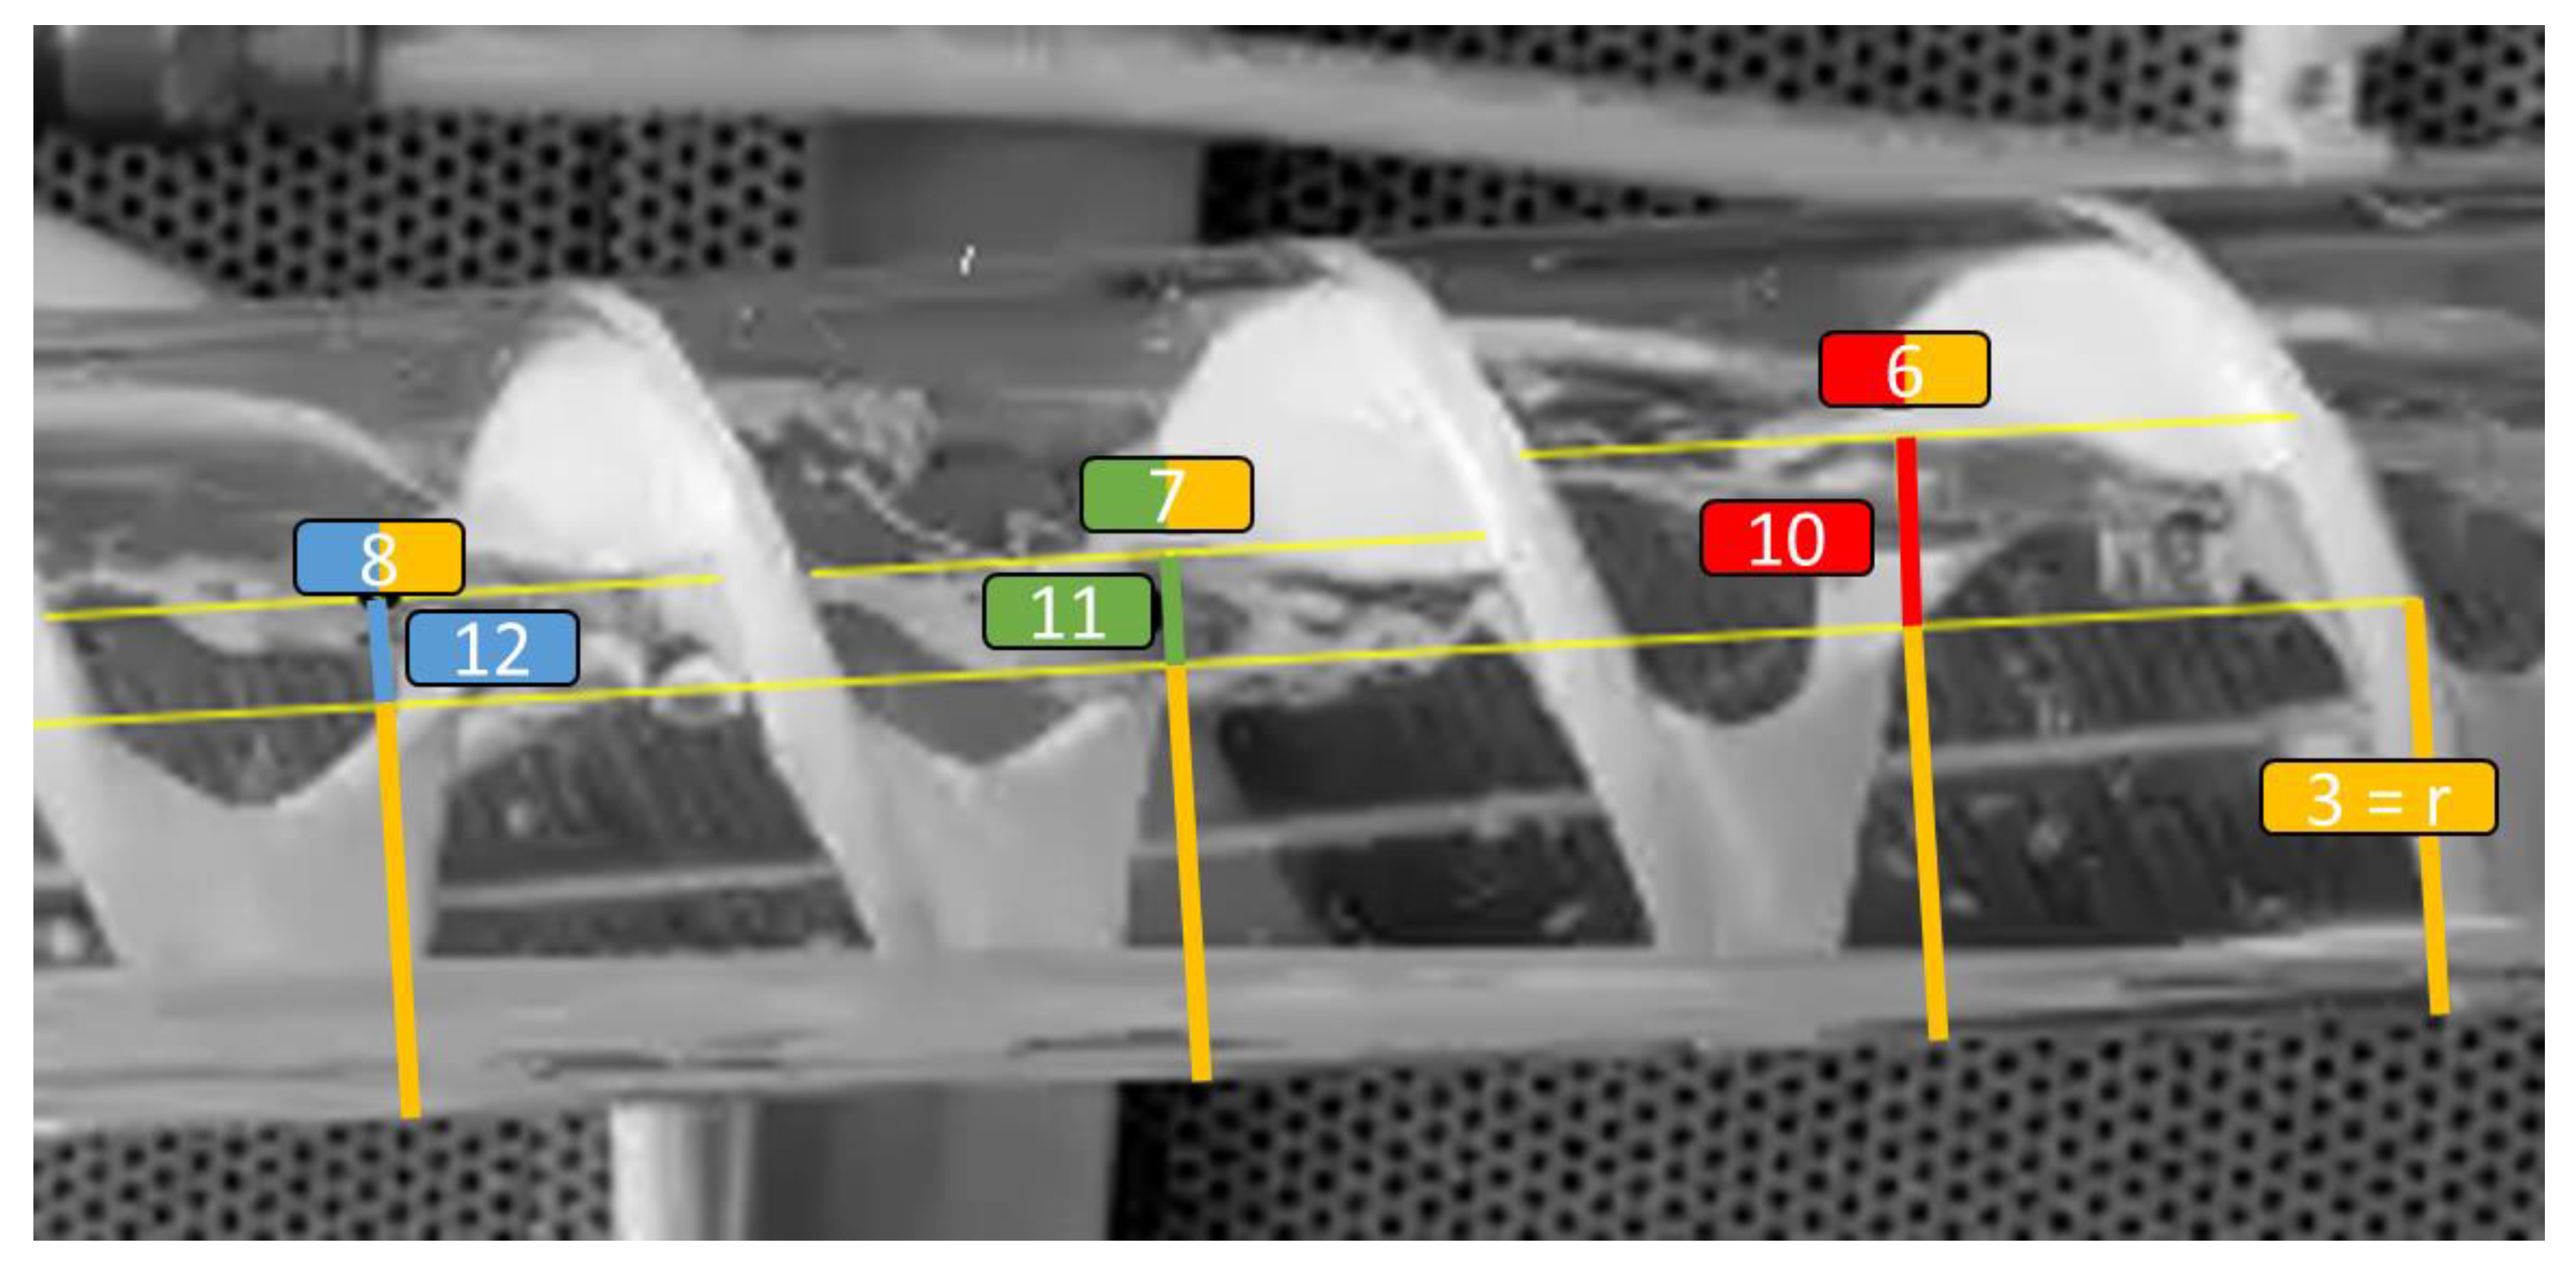
The helical structures were tested in an experimental setup with the same dimensions and characteristics as in the simulations discussed in 2.1. An acrylic glass tube was used to visually monitor the gas–liquid phases inside the reactor. The helical structures were 3D-printed with an acrylnitrile-butadiene-styrene copolymer filament (ABS, 3D Composite GmbH, Cologne, Germany) with a helix pitch of 50 mm. However, the helix was approximately 8 mm thick, reducing the outer helix pitch to 42 mm. Since there were small gaps between the outer edge of the printed helical structures and the inner diameter of the reactor column, PTFE strips were used as a seal. The tube was filled with tap water and supplied with air, while the liquid phase was pumped in a loop. The laminar flow of the liquid phase was adjusted inside the reactor column (6 L/min). When the water level did not change any further, the volume of the gas phase was calculated. Therefore, the water level was measured via image processing using the Fiji software, as shown in Figure 4 [30].
The volume of the liquid phase V l i q u i d was calculated based on Equation (1):
V l i q u i d = L · r 2 · a r c c o s r h r r h · 2 · r · h h 2
V l i q u i d = V o l u m e   l i q u i d   p h a s e ;   L = T u b e   l e n g t h = H e l i x   p i t c h = 0.042   m   ;   r = R a d i u s = 0.025   m ; h = w a t e r   l e v e l
The gas volume fraction was calculated by subtracting the volume of the liquid phase (Equation (1)) from the total volume (Equation (3)) of the tube, neglecting the volume of the helix according to Equation (2).
V o l . % g a s = V t o t a l V l i q u i d V t o t a l · 100 %
V t o t a l = π r 2 × L
V o l . % g a s = G a s   v o l u m e   f r a c t i o n ;   V t o t a l = T o t a l   v o l u m e ;   V l i q u i d = V o l u m e   l i q u i d   p h a s e ; L = T u b e   l e n g t h    

2.4. Construction of the Meandering Column Reactor

Based on the results of the simulations and the experiments, a meandering column reactor that was approximately 14 m in length and 22.5 L in volume was designed. Figure 1 provides a schematic diagram of the reactor. The meandering reactor was constructed from PVC tubing mounted in a frame with tube brackets. Three dimensionally printed helical structures of ABS (3D Composite GmbH, Cologne, Germany) were integrated into the reactor (Figure 1, No. 7). Ethylene-propylene-diene monomer rubber seals (EPDM, V11, SMI—Gräwe & Sohn GmbH, Brandenburg, Germany) were used to prevent unwanted flow patterns. The reactor was housed in an expanded polystyrene (EPS, 60 mm, WLG 035) enclosure. Four temperature controllers (ITC-308, Inkbird, Shenzhen, China) with 100 W thermos cables (10 m, Lucky reptile) each were used. The thermoelectric cables were wrapped around the tubes. A pump (12 V, cut-off pressure 6.9 bar, max. 6.8 L/min, LS543238, Lilie GmbH & Co. KG, Besigheim, Germany, Figure 1, No. 6) circulated the liquid phase. A gas flow controller (D-6311-DR, Bronkhorst Deutschland Nord GmbH, Kamen, Germany, Figure 1, No. 8) was used to control the gas flow, which was injected into the liquid at the bottom of the reactor. The gas–liquid mixture was transported to the top of the reactor, where the gas was separated from the liquid phase via a cyclone (Alfaturbo Hydrocyclone Filter 1, Plastica Alfa, Caltagirone, Italy, cyclone detached from the vessel, max. operating pressure 5 bar, Figure 1, No. 5). The separated gas is the product gas. Water is formed during methanation, so excess liquid must be removed. The excess liquid was discharged with the product gas flow from the gas separator and collected in a 0.5 L borosilicate bottle (VWR International GmbH, Darmstadt, Germany, Figure 1, No. 4). The product gas was passed through a 1 L borosilicate bottle (VWR International GmbH, Darmstadt, Germany) and cooled to 5 °C using a wine cooler (WineCase One, CASO, Arnsberg, Germany, Figure 1, No. 3) to condense water. The product gas was then quantified using a gas flow meter (F-101EI-AGD-00-K, Bronkhorst Deutschland Nord GmbH, Kamen, Germany, Figure 1, No. 2). The hydrogen content of the gas was measured with a gas analyzer (BCP-H2, BlueSens gas sensor GmbH, Herten, Germany, Figure 1, No. 1). Data from all sensors were collected using a Raspberry Pi 4 and stored on a server in an InxluxDB database. A Grafana dashboard was used to monitor the data.

2.5. Step Experiment

The reactor described in 2.4 was used to perform the step experiment. First, methane was injected into the reactor; then, a mixture of 20% CO2 and 80% H2 was injected at a flow rate of 12 L/h at a temperature of 8.2 °C. The gas composition was measured to determine the residence time distribution. The flow rate of the recirculated liquid phase was 4.3 L/min. The flow directions of the liquid and gas phases were identical.
The different velocities of the liquid and gas phases lead to a slip, which can be calculated using Equation (4). The velocities of the gas phase and the liquid phase can be calculated using Equations (5) and (6) [31].
v S = v G v L
v G = q G A G
v L = q L A L
v L = L i q u i d   p h a s e   v e l o c i t y ;   v G = G a s   p h a s e   v e l o c i t y ; q L   q G = G a s   p h a s e   V o l u m e t r i c   f l o w   g a s   p h a s e ;   A L = C r o s s   s e c t i o n   a r e a   l i q u i d   p h a s e ; A G = C r o s s   s e c t i o n   a r e a   g a s   p h a s e
The PFR-like design and the laminar flow in this system indicate that the model for CSTR cascades taken from Equation (7) can be used to determine the residence time distribution ( F t τ ) . The mean residence time can be calculated using Equation (8).
F t τ = 1 e K τ t k = 1 K ( K t τ ) k 1 k 1 !
τ = V R V ˙
K = A m o u n t   o f   c a s c a d e s ; t = T i m e ;   τ = M e a n   r e s i d e n c e   t i m e ; V ˙ = V o l u m e   f l o w ;   V R = R e a c t o r   v o l u m e  
To determine the kLa, dissolved hydrogen was measured with a dissolved hydrogen sensor (AMT Analysemesstechnik GmbH, Germany). A two-point calibration was performed with methane at 0% dissolved hydrogen and with 80% hydrogen, and 20% carbon dioxide at 100% dissolved hydrogen. The kLa was determined in the exponential phase of the step experiment by calculating the ln of the quotient of the difference between the maximal dissolved hydrogen concentration ( C * ) and the dissolved hydrogen concentration at t0 ( C 0 ) and the difference between the maximal dissolved hydrogen concentration and the dissolved hydrogen concentration at tn ( C n , Equation (9), and plotting it against the time difference (tn- t0). The slope of the regression line from the regression analysis expresses the kLa value [32].
l n C * C 0 C * C n C * = M a x i m a l   d i s s o l v e d   h y d r o g e n   c o n c e n t r a t i o n ;   C 0 = D i s s o l v e d   h y d r o g e n   c o n c e n t r a t i o n   a t   t 0 ;   C n = D i s s o l v e d   h y d r o g e n   c o n c e n t r a t i o n   a t   t n

3. Results and Discussion

3.1. Computational Model

The simulated streamline flow of the gas–liquid phase is shown in Figure 5. Domain 1 (Figure 5a) without an integrated helical structure and domain 2 (Figure 5b) with an integrated helical structure at 20 s are shown. It is clear from Figure 5a that neither of the two streamlines in domain 1 intersected; instead, they were parallel and thus did not form vortices. No disruption or mixing of the streamlines indicates laminar flow. The streamlines are mainly in the lower half and the top of the tube, indicating less flow in the upper half of the tube.
A large part of domain 1 shows smooth laminar flow (Figure 5a). A slightly wavy laminar flow can also be observed at the inlet of domain 1 due to the difference in the inlet flow rate of gas–liquid. When laminar, the liquid–gas displacement pattern can be concentric or segregated depending on the effect of buoyancy forces. Due to buoyancy, the liquid and gas phases completely separate into two continuous phases in domain 1, so the interference between the two phases is relatively smooth. Due to the helical structure in domain 2 (Figure 5b), the streamlines show more vortices compared with those in domain 1. The flow regime in domain 2 is also stratified but segregated by the helical structure. The streamline flow in domain 2 with an integrated helical structure is also assumed to be a laminar flow.
Comparing Figure 5 and Figure 6 shows that waves and ripples appear at the phase boundaries at higher velocities. The waves travel in the direction of the fluid. Similarly, the streamlines in domain 2 spiral along the helix shape in the flow regime towards the exit. Individual vortices formed in the upper part of domain 2, which signifies mixing with the gas phase. The vortex formation also indicates a stratified displacement pattern. The lighter (gas) material tends to occupy the upper part of the tube when buoyancy forces are sufficiently large, resulting in a stratified displacement pattern [33]. In addition, liquid waves reach the top of the tube, cutting off the cross-section of the gas in certain cases at higher velocities. The difference in momentum between the phases (due to different phase velocities) results in sudden pressure changes when the path closes. A larger difference in the momentum of the phases can lead to shocks and vibrations. Nevertheless, vortices at the top of the helical structure in the upper part of domain 2 (Figure 5b) indicate a desirable mixture of liquid and gas phases, which is very important for the biological methanation process.
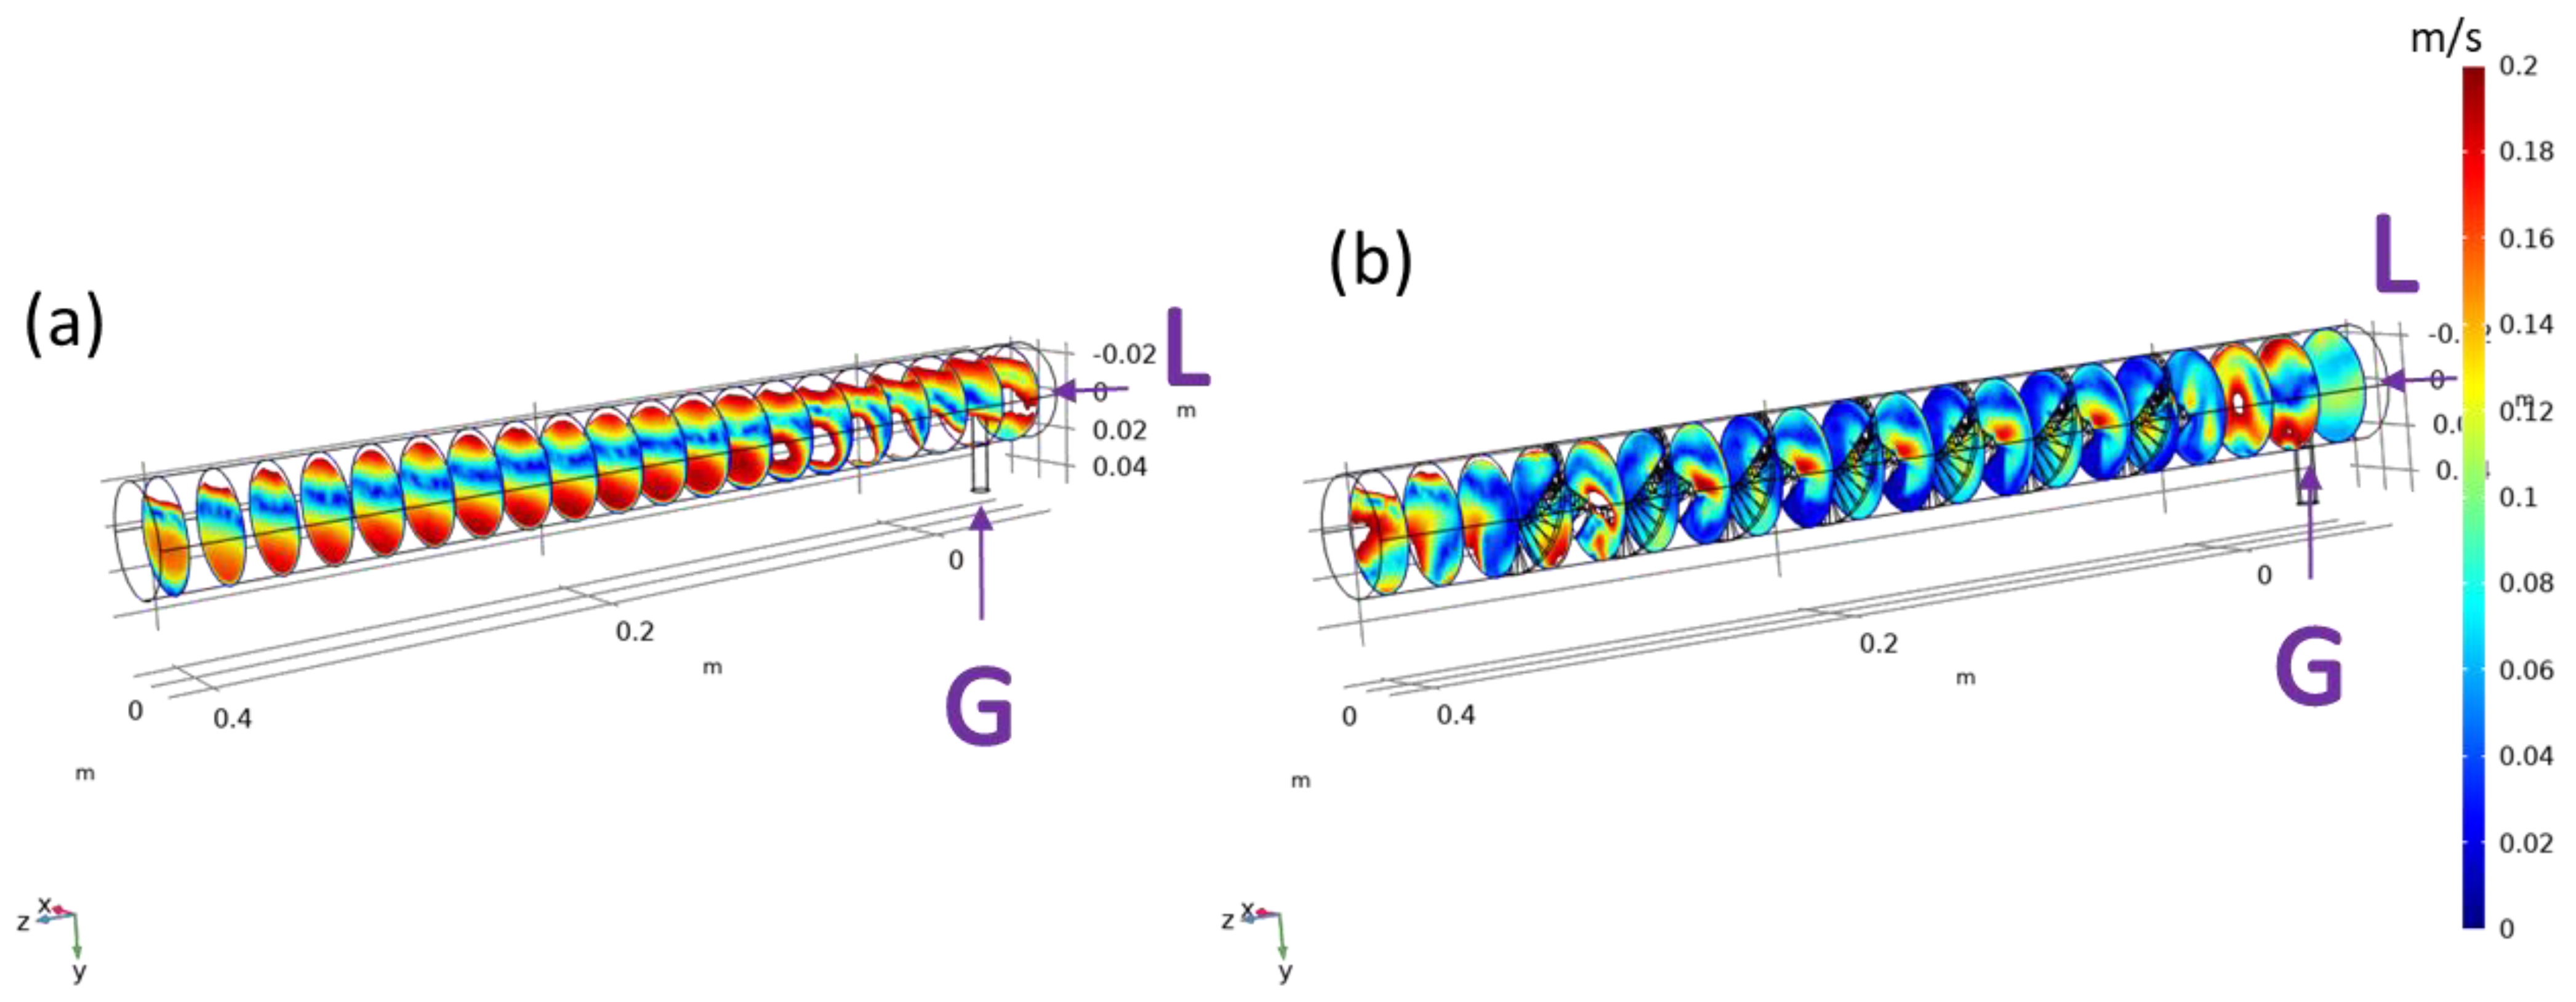
Although both the reactor columns with and without helical inlays were given the same physical characteristics and settings, the distribution of velocity in the two domains differs, as shown in Figure 6a,b. In domain 1, the highest velocities are at the top, driven by the gas phase, and at the bottom, driven by the liquid phase. In the upper center, there is a low-velocity phase. The liquid in domain 2 reaches the highest velocities in the center of the helix, while lower velocities prevail at the upper and lower edge regions. At the inlet and the outlet, the velocity is not equally distributed for domains 1 and 2. The equilibrium of the velocity distribution develops at a shorter tube distance in domain 2 compared with in domain 1.
Figure 7 compares the radial velocity distribution to analyze the influence of the integrated helical structure further. Domains 1 and 2 were intersected by 20 cross-sections spaced 25 mm apart. The radial velocity distribution appears to be equally distributed along domain 1. The radial velocity distribution in domain 1 shows patterns similar to the axial velocity distribution. The velocity is evenly distributed in the x direction, while in the y direction, a higher velocity can be seen at the top (gas driven) and at the bottom (liquid driven). A higher resolution was needed to discuss domain 2 because the more complex helical structure affects the velocity distribution in smaller increments.
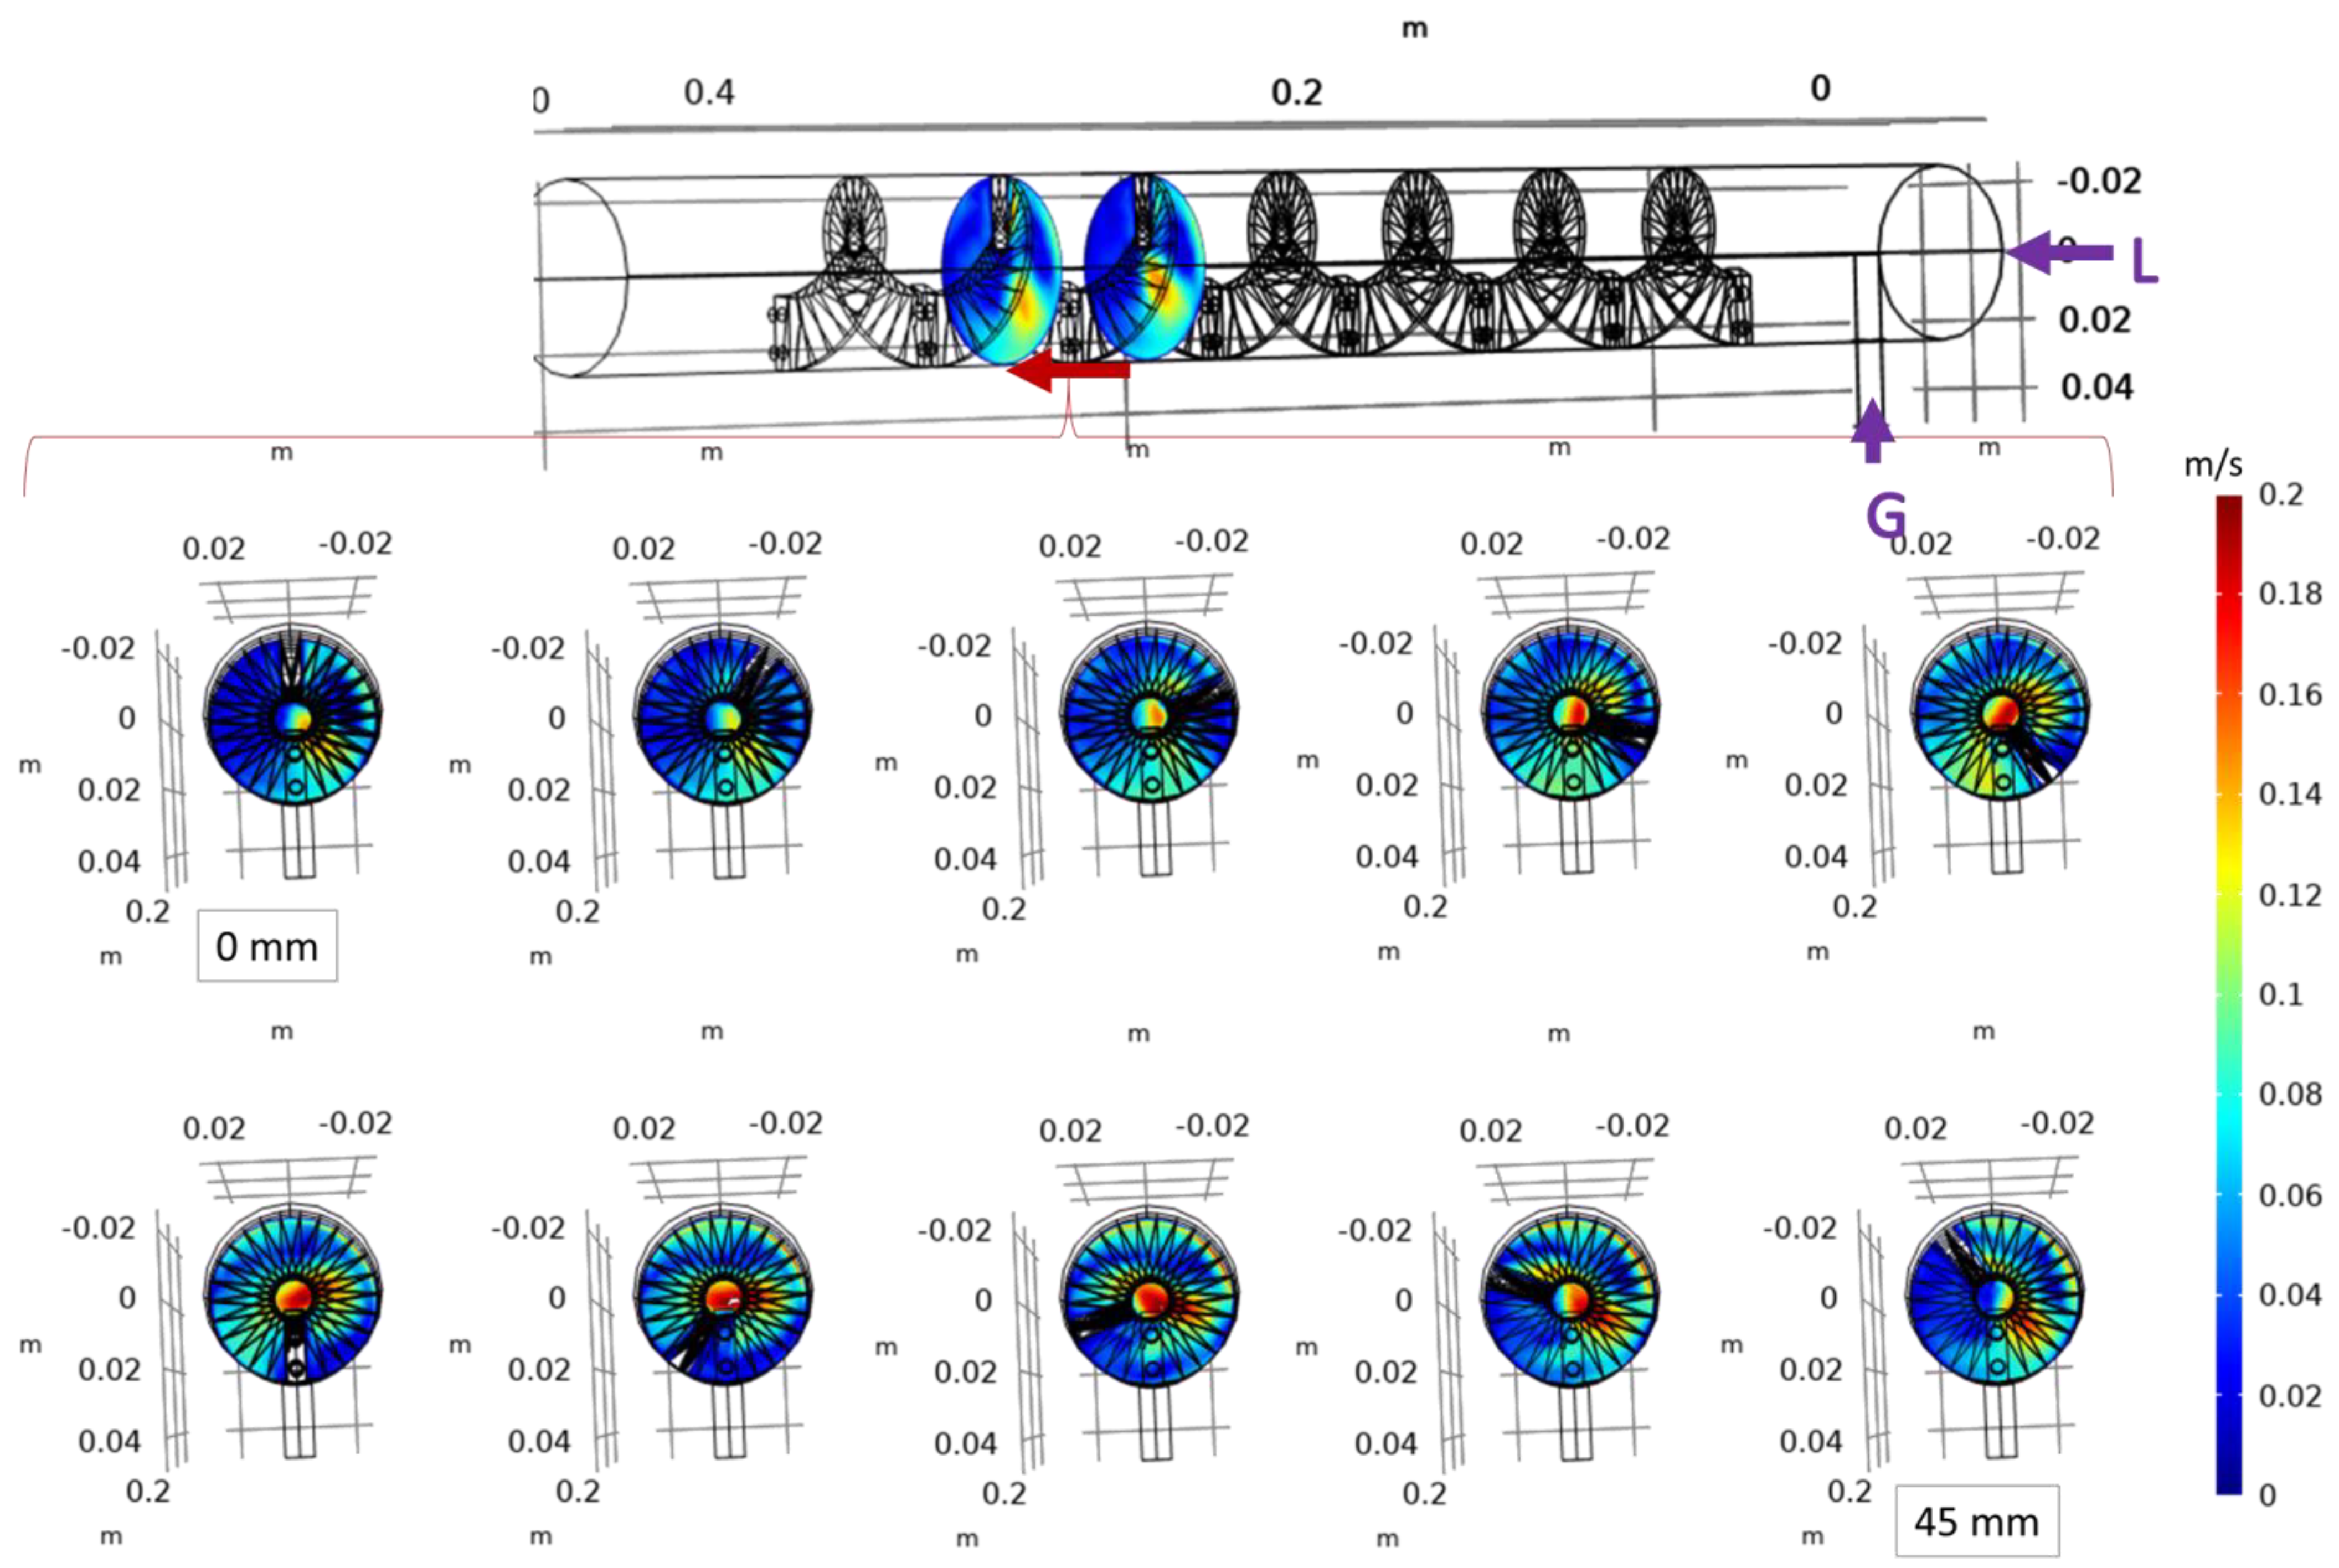
Figure 8 shows the radial velocity distribution for a single coil of the helix in 5 mm increments. When the intersection of the helical structure is in the upper half of the tube, the radial velocity is almost uniformly distributed. When the intersection of the helical structure enters the lower half of the tube, the velocity increases in the center of the helix. This is because the liquid phase can only flow along the helix or through the center since the upper part of the tube is occupied by the gas phase. It seems that the liquid phase flows through both the center and along the helix as the velocity also increases at the surface of the helical structure, but the velocity in the center appears to be higher than that along the helix. The velocity appears to increase at or near the phase boundary. This would improve the mixing of the gas and liquid phases. In coiled PFR, also known as coiled flow inverters, there are good radial mixing properties due to Dean vortices [34,35]. The helical structure of our study mimics this design, but the hole in the center of the helix also allows axial flow. This limits the effect seen in the coiled flow inverter.
When comparing the properties of the reactor design with and without an integrated helical structure in the simulation, the mixing properties seem to be improved, especially at the gas–liquid interface. Proper liquid–gas mixing allows for better hydrogen uptake and, thus, improved methane production during biological methanation. The helical structure was selected for further testing based on the simulation data. Compared with the well-established static mixers, it shares some characteristics with a Kenics mixer. However, Kenics mixers are more commonly used for gas–liquid mixing with laminar flow for liquids with higher viscosity compared with water [29,36,37]. For laminar-stratified flow methanation processes, where a low-pressure drop is required to reduce the parasitic energy for process operation, the availability of static mixers is scarce. The proposed static mixer in the form of a helical structure is a good compromise between improved mixing properties and a slightly increased pressure drop.

3.2. Experimental Results

The integrated helical structure leads to the formation of gas cavities, which affects the volume fraction of the liquid and gas phases. The water level of the four cavities of the helical inlays was measured to estimate the volume fraction in the meandering column reactor with helical inlays, as shown in Figure 4. The gas fraction was 29 ± 5% of the total volume and was determined as described in 2.3.
The flow regime observed in the experiments was stratified. The average water level was estimated to be 3.25 cm (average of all h values from Equation (1)). The highest possible water level is 5 cm and is defined by the tube’s inner diameter. The distance from the bottom of the tube to the upper edge of the hole in the center of the helical structure is 3.1 cm. The upper edge of the hole defines the limits of the gas cavity since the gas must pass through the center of the helical structure in the axial direction so that the determined water level is consistent with the geometry of the helix structure. Measurements without integrated helical structures could not be evaluated because no cavity formation was observed, and therefore, no decrease in water level could be detected. The size of the gas cavity mainly defines the boundary layer between the gas and liquid phases of the column reactor without an integrated helical structure. The stratified flow was observed with and without helical structures.
The behavior observed in the experiments corresponds well with the behavior observed in the simulations. Furthermore, the volume fraction of the gas and liquid phases was determined, which is needed to ascertain the boundary layer between the liquid and gas phases. In addition, the volume fraction could be used to calculate the residence time of the gas phase.

3.3. Reactor Setup

Assuming that the experimentally determined gas fraction applies to the reactor design, the area of the boundary layer of the gas–liquid phase is 0.7 m², with 6.5 L of a gas phase and 16 L of a liquid phase. The helical structure reduces the total volume by approximately 14%. Increasing the area of the boundary layer also increases the hydrogen mass transfer into the liquid phase. Nevertheless, in terms of mass transfer, bubble flow would further increase the kLa and thus the mass transfer [21]. However, the bubble flow regime would have required higher gas and liquid phase velocities, resulting in a higher pressure drop and a more energy-consuming operation [31]. The helical structure avoids back mixing and forms cavities in the tube so that the area of the boundary layer remains large. In addition, the simulation results show good mixing. The cavities can also be viewed as a cascade of small reactors. Since the mixing takes place in each cavity and not in the whole system, which means that the concentration of methane increases with each step, high conversion rates are assumed. The meandering column reactor with integrated helical structures proposes a compromise between the low-energy-consuming trickle bed reactor and the space-efficient but much more energy-consuming CSTR.

3.4. Step Experiment

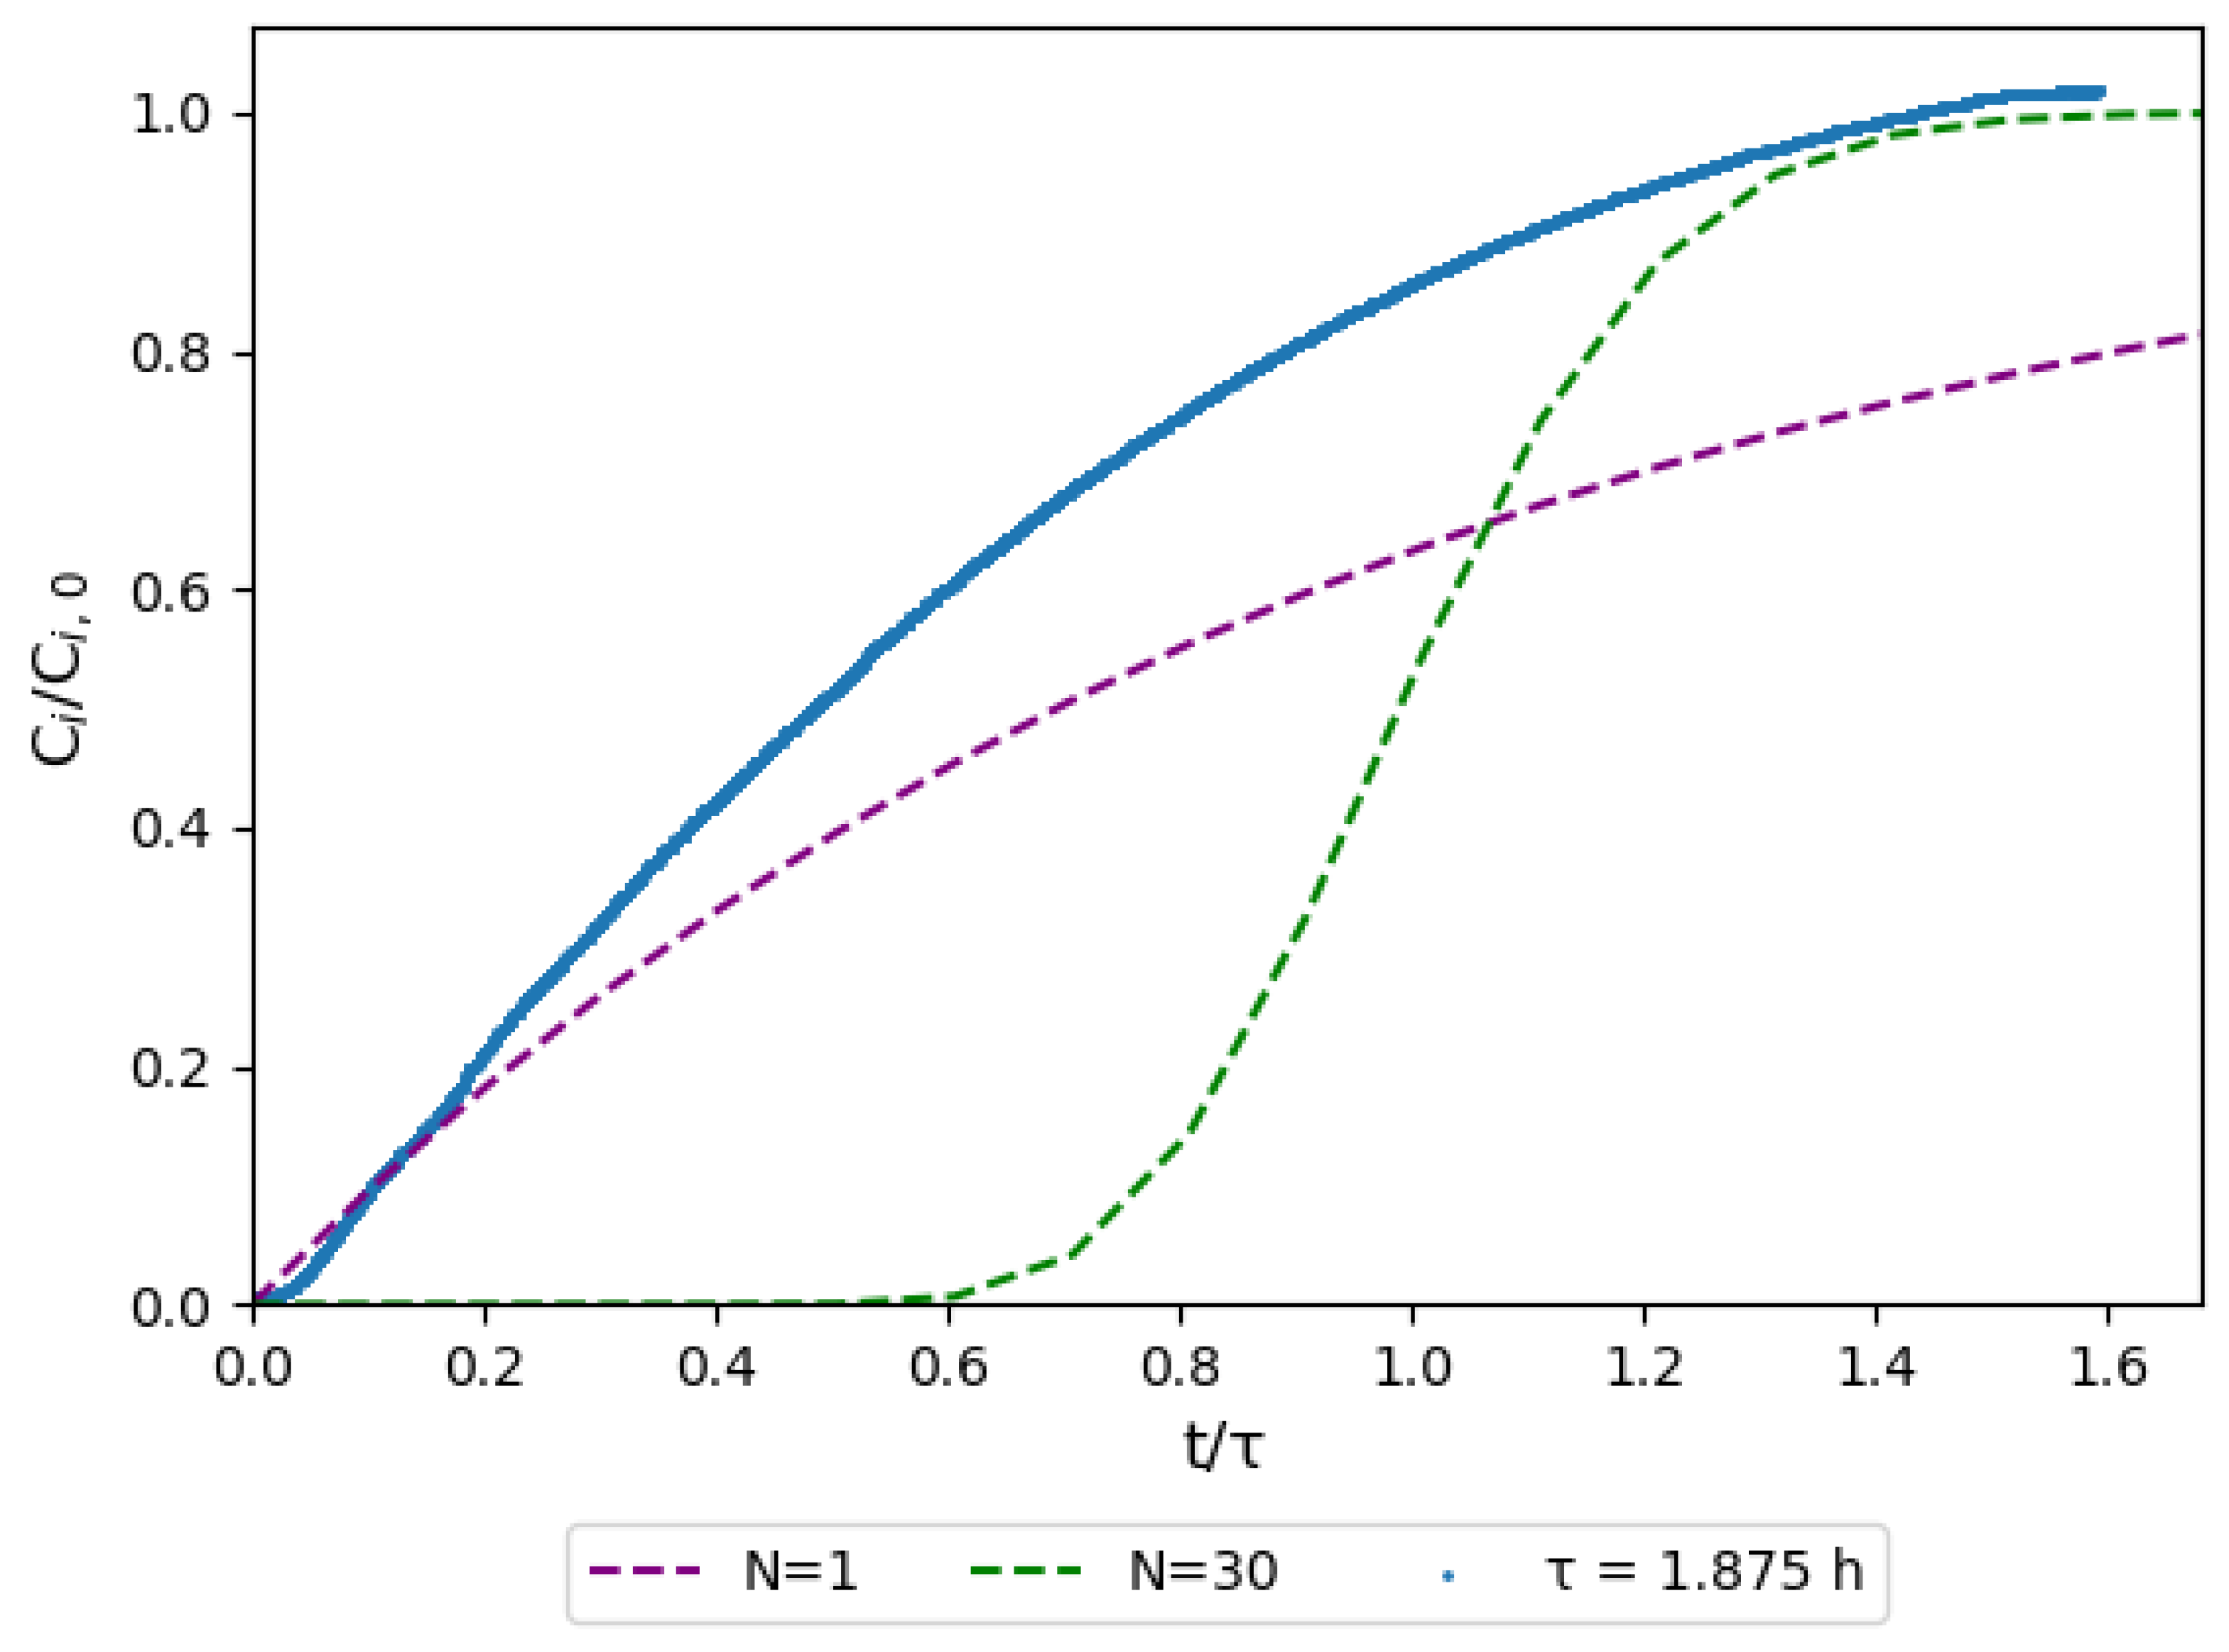
Since the flow of the liquid phase is slower than that of the gas phase, a slip occurs. Based on the flow rates of the gas and liquid phases, the slip was calculated to be −0.05 m/s. Due to the slip induced via recirculation of the liquid phase in the same axial direction as the gas phase, dissolved hydrogen is carried faster in the liquid phase than in the gas phase. The dissolved hydrogen can diffuse back into the gas phase in later cavities of the reactor so that a hydrogen sensor signal can be detected earlier than without recirculation. The slip carries only the soluble hydrogen in the reactor. As the archaea will consume hydrogen along the reactor, the overall hydrogen concentration decreases during operation. This suggests that either the slipping hydrogen is directly consumed or a substrate is supplied via the liquid phase to stages with lower hydrogen content in the gas phase, which is favorable. Consequently, there is likely minimal to no dilution of the product gas by hydrogen slipping through the liquid phase. The retention time of the gas mixture is τ = 1.84 h with VR = 22.5 L. If the volume fraction is considered, the retention time is described by τg = 0.54 h with VRG = 6.5 L. Thus, the gas phase is exchanged after 32 min.
The washout function of hydrogen, which washes out methane, was used to determine the residence time distribution, shown in Figure 9. A model based on Equations (7) and (8) for cascaded CSTR was applied to estimate the number of theoretical cascades. The residence time distribution behavior is more similar to that of a single CSTR than that of a cascaded CSTR, but there is a short delay in the response at the beginning of the experiment, which is typical of PFR or cascaded reactors. Thus, both CSTR-like and PFR-like behavior can be seen, which can be explained by the novel design of the reactor.
The CSTR cascade model is not sufficient to model the residence time distribution of the given reactor. More complex models that account for the two phases and the liquid phase recirculation loop may be investigated in the future to model the residence time distribution. This could help predict certain reactor properties when parameters such as gas flow rate, reactor volume, or gas fraction are changed. This could be useful for the technical optimization of the reactor.
To better understand the gas mass transfer from the gas phase into the liquid phase, the kLa was determined during the step experiment. Figure 10 presents the results. The kLa corresponds to the slope of the regression line, and it was 1 h−1 in the reactor with helical structures. However, the kLa value measured in the study was not obtained under operating conditions. It is expected that the kLa value may vary under actual operating conditions due to the effect of temperature on kLa. While increasing temperature leads to a decrease in hydrogen solubility, it has recently been discussed that increasing diffusion rates may counteract the decreased solubility and may even lead to an increase in mass transfer at higher temperatures [21]. This effect would lead to slightly higher kLa values under thermophilic conditions. Temperature and pressure are limiting factors, as available sensors for the detection of dissolved hydrogen are not designed for high temperatures or pressures. For example, the dissolved hydrogen sensor used in this work is designed for operating temperatures up to 40 °C and pressures of up to 10 bar. Thus, it is challenging to detect dissolved hydrogen under operating conditions outside of this range [18]. Many biomethanation reactors are operated under thermophilic conditions between 55 and 65 °C [20,21,38].
In the CSTR, kLa values ranging from 1 to 3750 h−1 have been obtained at 500 to 1010 rpm under operating conditions [20]. On the downside, it has been suggested that CSTRs may not be sufficient, especially in reactors with high gas volume fractions relative to the total volume flow. A PFR U-loop reactor with similar helical structures integrated and operated under turbulent flow showed kLa values of 400–3000 h−1, which are similar to the kLa values measured in CSTRs. However, to achieve such high kLa values, high-pressure drops of up to 4 × 10⁵ Pa and high energy consumption were also considered [39]. PFR coiled flow inverters could also be a promising approach for sufficient mass transfer, as they show good mixing properties, and a kLa value of 26.6 h−1 has been reported [35]. In bubble column reactors, kLa values of up to 210 h−1 [18] and, in trickle bed reactors, kLa values of up to 1024 h−1 have been reported with low parasitic energy consumption [18]. Thus, the measured kLa is low compared with the kLa reported in the literature. However, the kLa is dependent on many factors, such as temperature, pressure, and feed flow rate, which can make it difficult to compare [32]. The actual performance of the system will be defined by the methane production rate, which will be determined in future experiments.

4. Conclusions

This study successfully constructed a new reactor design and implemented monitoring and data processing. Helical structures were also designed and integrated based on simulations and experimental data. The results of the simulations and experiments corresponded. It was found that a helix pitch of 5 cm in the helical structure is sufficient for a uniform radial velocity distribution. The CFD model was validated and used to understand the basic properties of the reactor, such as mixing properties based on streamlines and velocity distribution.
The step experiments showed that future research should obtain a deeper understanding of the proposed design for flexible methanation. The remaining challenges include the lack of dissolved hydrogen sensors for operating conditions and sufficient modeling of the reactor. Nevertheless, the novel PFR design with reasonable mixing properties indicates good conversion rates. The further advantage of the compact meander design is that it allows a 14 m long reactor to be installed in a 1.3 × 0.3 × 2.0 m space. Therefore, scale-up can be achieved by stacking several reactor modules. Although the kLa values were rather low compared with those in other reactor systems, the PFR design can be advantageous because the residence time is dependent on the tube length, which can lead to improved behavior in the start-up phase. Thus, the new reactor design for flexible biomethanation represents a promising solution to the storage capacity challenges in renewable energy systems. The applicability and advantages of the novel design, especially on flexibility issues, will be tested in bioreactor systems with the implemented reactor design elements.

Author Contributions

Conceptualization: K.H. and I.K.; Data curation: D.C., K.H. and S.K.; Formal analysis: D.C. and K.H.; Funding acquisition: I.K.; Investigation: K.H.; Methodology: D.C. and K.H.; Project administration: I.K.; Resources: I.K.; Software: K.H.; Supervision: H.H., I.K., M.N. and S.K.; Validation: D.C. and K.H.; Visualization: D.C. and K.H.; Writing—original draft preparation: D.C. and K.H.; Writing—review and editing: H.H., I.K., K.H., M.N. and S.K. All authors have read and agreed to the published version of the manuscript.

Funding

This research was funded by the European Regional Development Fund (ERDF), grant number KESW-1-2-032A-B.

Institutional Review Board Statement

Not applicable.

Informed Consent Statement

Not applicable.

Data Availability Statement

The data are contained within the article.

Acknowledgments

Special thanks to the students and research assistants who supported this work: Vivekanantha Kumar, Ali Sadeghzadehgomari, Steven Staudt, Gokul Shivakumar, Abdulaziz Azouz, Axel Joris Diyou Ngoh, Ivan Semchuk, and Marco Karber.

Conflicts of Interest

The authors declare no conflict of interest. The funders had no role in the design of the study; in the collection, analysis, or interpretation of data; in the writing of the manuscript; or in the decision to publish the results.

References

  1. IPCC Summary for Policymakers. Climate Change 2022: Impacts, Adaptation, and Vulnerability; Contribution of Working Group II to the Sixth Assessment Report of the Intergovernmental Panel on Climate Change 2022; IPCC: Geneva, Switzerland, 2022; in press.
  2. International Energy Agency. Electricity Market Report—July 2021; OECD Publishing: Paris, France, 2021.
  3. Johnson, S.C.; Rhodes, J.D.; Webber, M.E. Understanding the Impact of Non-Synchronous Wind and Solar Generation on Grid Stability and Identifying Mitigation Pathways. Appl. Energy 2020, 262, 114492. [Google Scholar] [CrossRef]
  4. Maurer, F.; Rieke, C.; Schemm, R.; Stollenwerk, D. Analysis of an Urban Grid with High Photovoltaic and E-Mobility Penetration. Energies 2023, 16, 3380. [Google Scholar] [CrossRef]
  5. Zhang, M.; Millar, M.-A.; Yu, Z.; Yu, J. An Assessment of the Impacts of Heat Electrification on the Electric Grid in the UK. Energy Rep. 2022, 8, 14934–14946. [Google Scholar] [CrossRef]
  6. Rekioua, D. Energy Storage Systems for Photovoltaic and Wind Systems: A Review. Energies 2023, 16, 3893. [Google Scholar] [CrossRef]
  7. Hossain, E.; Faruque, H.; Sunny, M.; Mohammad, N.; Nawar, N. A Comprehensive Review on Energy Storage Systems: Types, Comparison, Current Scenario, Applications, Barriers, and Potential Solutions, Policies, and Future Prospects. Energies 2020, 13, 3651. [Google Scholar] [CrossRef]
  8. Zakeri, B.; Gissey, G.C.; Dodds, P.E.; Subkhankulova, D. Centralized vs. Distributed Energy Storage—Benefits for Residential Users. Energy 2021, 236, 121443. [Google Scholar] [CrossRef]
  9. Sterner, M.; Stadler, I. (Eds.) Energiespeicher—Bedarf, Technologien, Integration; Springer: Berlin/Heidelberg, Germany, 2017; ISBN 978-3-662-48892-8. [Google Scholar]
  10. Ueckerdt, F.; Bauer, C.; Dirnaichner, A.; Everall, J.; Sacchi, R.; Luderer, G. Potential and Risks of Hydrogen-Based e-Fuels in Climate Change Mitigation. Nat. Clim. Chang. 2021, 11, 384–393. [Google Scholar] [CrossRef]
  11. Ogden, J.; Jaffe, A.M.; Scheitrum, D.; McDonald, Z.; Miller, M. Natural Gas as a Bridge to Hydrogen Transportation Fuel: Insights from the Literature. Energy Policy 2018, 115, 317–329. [Google Scholar] [CrossRef]
  12. You, Y.; Kim, S.; Lee, J.C. Comparative Study on Ammonia and Liquid Hydrogen Transportation Costs in Comparison to LNG. Int. J. Nav. Archit. Ocean Eng. 2023, 15, 100523. [Google Scholar] [CrossRef]
  13. Evans, P.N.; Boyd, J.A.; Leu, A.O.; Woodcroft, B.J.; Parks, D.H.; Hugenholtz, P.; Tyson, G.W. An Evolving View of Methane Metabolism in the Archaea. Nat. Rev. Microbiol. 2019, 17, 219–232. [Google Scholar] [CrossRef]
  14. Wahid, R.; Mulat, D.G.; Gaby, J.C.; Horn, S.J. Effects of H2:CO2 Ratio and H2 Supply Fluctuation on Methane Content and Microbial Community Composition during in-Situ Biological Biogas Upgrading. Biotechnol. Biofuels 2019, 12, 104. [Google Scholar] [CrossRef]
  15. Logroño, W.; Kleinsteuber, S.; Kretzschmar, J.; Harnisch, F.; De Vrieze, J.; Nikolausz, M. The Microbiology of Power-to-X Applications. FEMS Microbiol. Rev. 2023, 47, fuad013. [Google Scholar] [CrossRef] [PubMed]
  16. Wahid, R.; Horn, S.J. Impact of Operational Conditions on Methane Yield and Microbial Community Composition during Biological Methanation in in Situ and Hybrid Reactor Systems. Biotechnol. Biofuels 2021, 14, 170. [Google Scholar] [CrossRef] [PubMed]
  17. Van Hecke, W.; Bockrath, R.; De Wever, H. Effects of Moderately Elevated Pressure on Gas Fermentation Processes. Bioresour. Technol. 2019, 293, 122129. [Google Scholar] [CrossRef] [PubMed]
  18. Ale Enriquez, F.; Ahring, B.K. Strategies to Overcome Mass Transfer Limitations of Hydrogen during Anaerobic Gaseous Fermentations: A Comprehensive Review. Bioresour. Technol. 2023, 377, 128948. [Google Scholar] [CrossRef] [PubMed]
  19. Savvas, S.; Donnelly, J.; Patterson, T.; Chong, Z.S.; Esteves, S.R. Biological Methanation of CO2 in a Novel Biofilm Plug-Flow Reactor: A High Rate and Low Parasitic Energy Process. Appl. Energy 2017, 202, 238–247. [Google Scholar] [CrossRef]
  20. Rusmanis, D.; O’Shea, R.; Wall, D.M.; Murphy, J.D. Biological Hydrogen Methanation Systems—An Overview of Design and Efficiency. Bioengineered 2019, 10, 604–634. [Google Scholar] [CrossRef]
  21. Jensen, M.B.; Ottosen, L.D.M.; Kofoed, M.V.W. H2 Gas-Liquid Mass Transfer: A Key Element in Biological Power-to-Gas Methanation. Renew. Sustain. Energy Rev. 2021, 147, 111209. [Google Scholar] [CrossRef]
  22. Dehkordi, A.M.; Savari, C. Determination of Interfacial Area and Overall Volumetric Mass-Transfer Coefficient in a Novel Type of Two Impinging Streams Reactor by Chemical Method. Ind. Eng. Chem. Res. 2011, 50, 6426–6435. [Google Scholar] [CrossRef]
  23. Logroño, W.; Popp, D.; Nikolausz, M.; Kluge, P.; Harms, H.; Kleinsteuber, S. Microbial Communities in Flexible Biomethanation of Hydrogen Are Functionally Resilient Upon Starvation. Front. Microbiol. 2021, 12, 619632. [Google Scholar] [CrossRef]
  24. Jønson, B.D.; Tsapekos, P.; Tahir Ashraf, M.; Jeppesen, M.; Ejbye Schmidt, J.; Bastidas-Oyanedel, J.-R. Pilot-Scale Study of Biomethanation in Biological Trickle Bed Reactors Converting Impure CO2 from a Full-Scale Biogas Plant. Bioresour. Technol. 2022, 365, 128160. [Google Scholar] [CrossRef] [PubMed]
  25. Strübing, D.; Moeller, A.B.; Mößnang, B.; Lebuhn, M.; Drewes, J.E.; Koch, K. Anaerobic Thermophilic Trickle Bed Reactor as a Promising Technology for Flexible and Demand-Oriented H2/CO2 Biomethanation. Appl. Energy 2018, 232, 543–554. [Google Scholar] [CrossRef]
  26. Youssef, A.A.; Al-Dahhan, M.H.; Dudukovic, M.P. Bubble Columns with Internals: A Review. Int. J. Chem. React. Eng. 2013, 11, 169–223. [Google Scholar] [CrossRef]
  27. Kantarci, N.; Borak, F.; Ulgen, K.O. Bubble Column Reactors. Process Biochem. 2005, 40, 2263–2283. [Google Scholar] [CrossRef]
  28. Nandagopal, N.S. Chemical Engineering Principles and Applications; Springer International Publishing: Cham, Switzerland, 2023; ISBN 978-3-031-27878-5. [Google Scholar]
  29. Valdés, J.P.; Kahouadji, L.; Matar, O.K. Current Advances in Liquid–Liquid Mixing in Static Mixers: A Review. Chem. Eng. Res. Des. 2022, 177, 694–731. [Google Scholar] [CrossRef]
  30. Schindelin, J.; Arganda-Carreras, I.; Frise, E.; Kaynig, V.; Longair, M.; Pietzsch, T.; Preibisch, S.; Rueden, C.; Saalfeld, S.; Schmid, B.; et al. Fiji: An Open-Source Platform for Biological-Image Analysis. Nat. Methods 2012, 9, 676–682. [Google Scholar] [CrossRef]
  31. Bahadori, A. Single-Phase and Multiphase Flow in Natural Gas Production Systems. In Natural Gas Processing; Elsevier: Amsterdam, The Netherlands, 2014; pp. 59–150. ISBN 978-0-08-099971-5. [Google Scholar]
  32. Shin, W.-S. Application of Scale-Up Criterion of Constant Oxygen Mass Transfer Coefficient (KLa) for Production of Itaconic Acid in a 50 L Pilot-Scale Fermentor by Fungal Cells of Aspergillus Terreus. J. Microbiol. Biotechnol. 2013, 23, 1445–1453. [Google Scholar] [CrossRef]
  33. Tardy, P.M.; Flamant, N.C.; Lac, E.; Parry, A.; Sutama, C.S.; Almagro, S.P. New Generation 3D Simulator Predicts Realistic Mud Displacement in Highly Deviated and Horizontal Wells. In Proceedings of the Day 2 Wed, The Hague, The Netherlands, 14–15 March 2017; p. D021S011R004. [Google Scholar]
  34. Kockmann, N. Entwurf und Betrieb eines Rohrreaktors mit enger Verweilzeitverteilung. Chem. Ing. Tech. 2020, 92, 685–691. [Google Scholar] [CrossRef]
  35. Grühn, J.; Behr, A.S.; Eroglu, T.H.; Trögel, V.; Rosenthal, K.; Kockmann, N. From Coiled Flow Inverter to Stirred Tank Reactor—Bioprocess Development and Ontology Design. Chem. Ing. Tech. 2022, 94, 852–863. [Google Scholar] [CrossRef]
  36. Hobbs, D.M.; Muzzio, F.J. Reynolds Number Effects on Laminar Mixing in the Kenics Static Mixer. Chem. Eng. J. 1998, 70, 93–104. [Google Scholar] [CrossRef]
  37. Meng, H.; Jiang, X.; Yu, Y.; Wang, Z.; Wu, J. Laminar Flow and Chaotic Advection Mixing Performance in a Static Mixer with Perforated Helical Segments. Korean J. Chem. Eng. 2017, 34, 1328–1336. [Google Scholar] [CrossRef]
  38. Rafrafi, Y.; Laguillaumie, L.; Dumas, C. Biological Methanation of H2 and CO2 with Mixed Cultures: Current Advances, Hurdles and Challenges. Waste Biomass Valorization 2021, 12, 5259–5282. [Google Scholar] [CrossRef]
  39. Petersen, L.A.H.; Villadsen, J.; Jørgensen, S.B.; Gernaey, K.V. Mixing and Mass Transfer in a Pilot Scale U-Loop Bioreactor: Mixing and Mass Transfer in a Pilot Scale U-Loop Bioreactor. Biotechnol. Bioeng. 2017, 114, 344–354. [Google Scholar] [CrossRef] [PubMed]
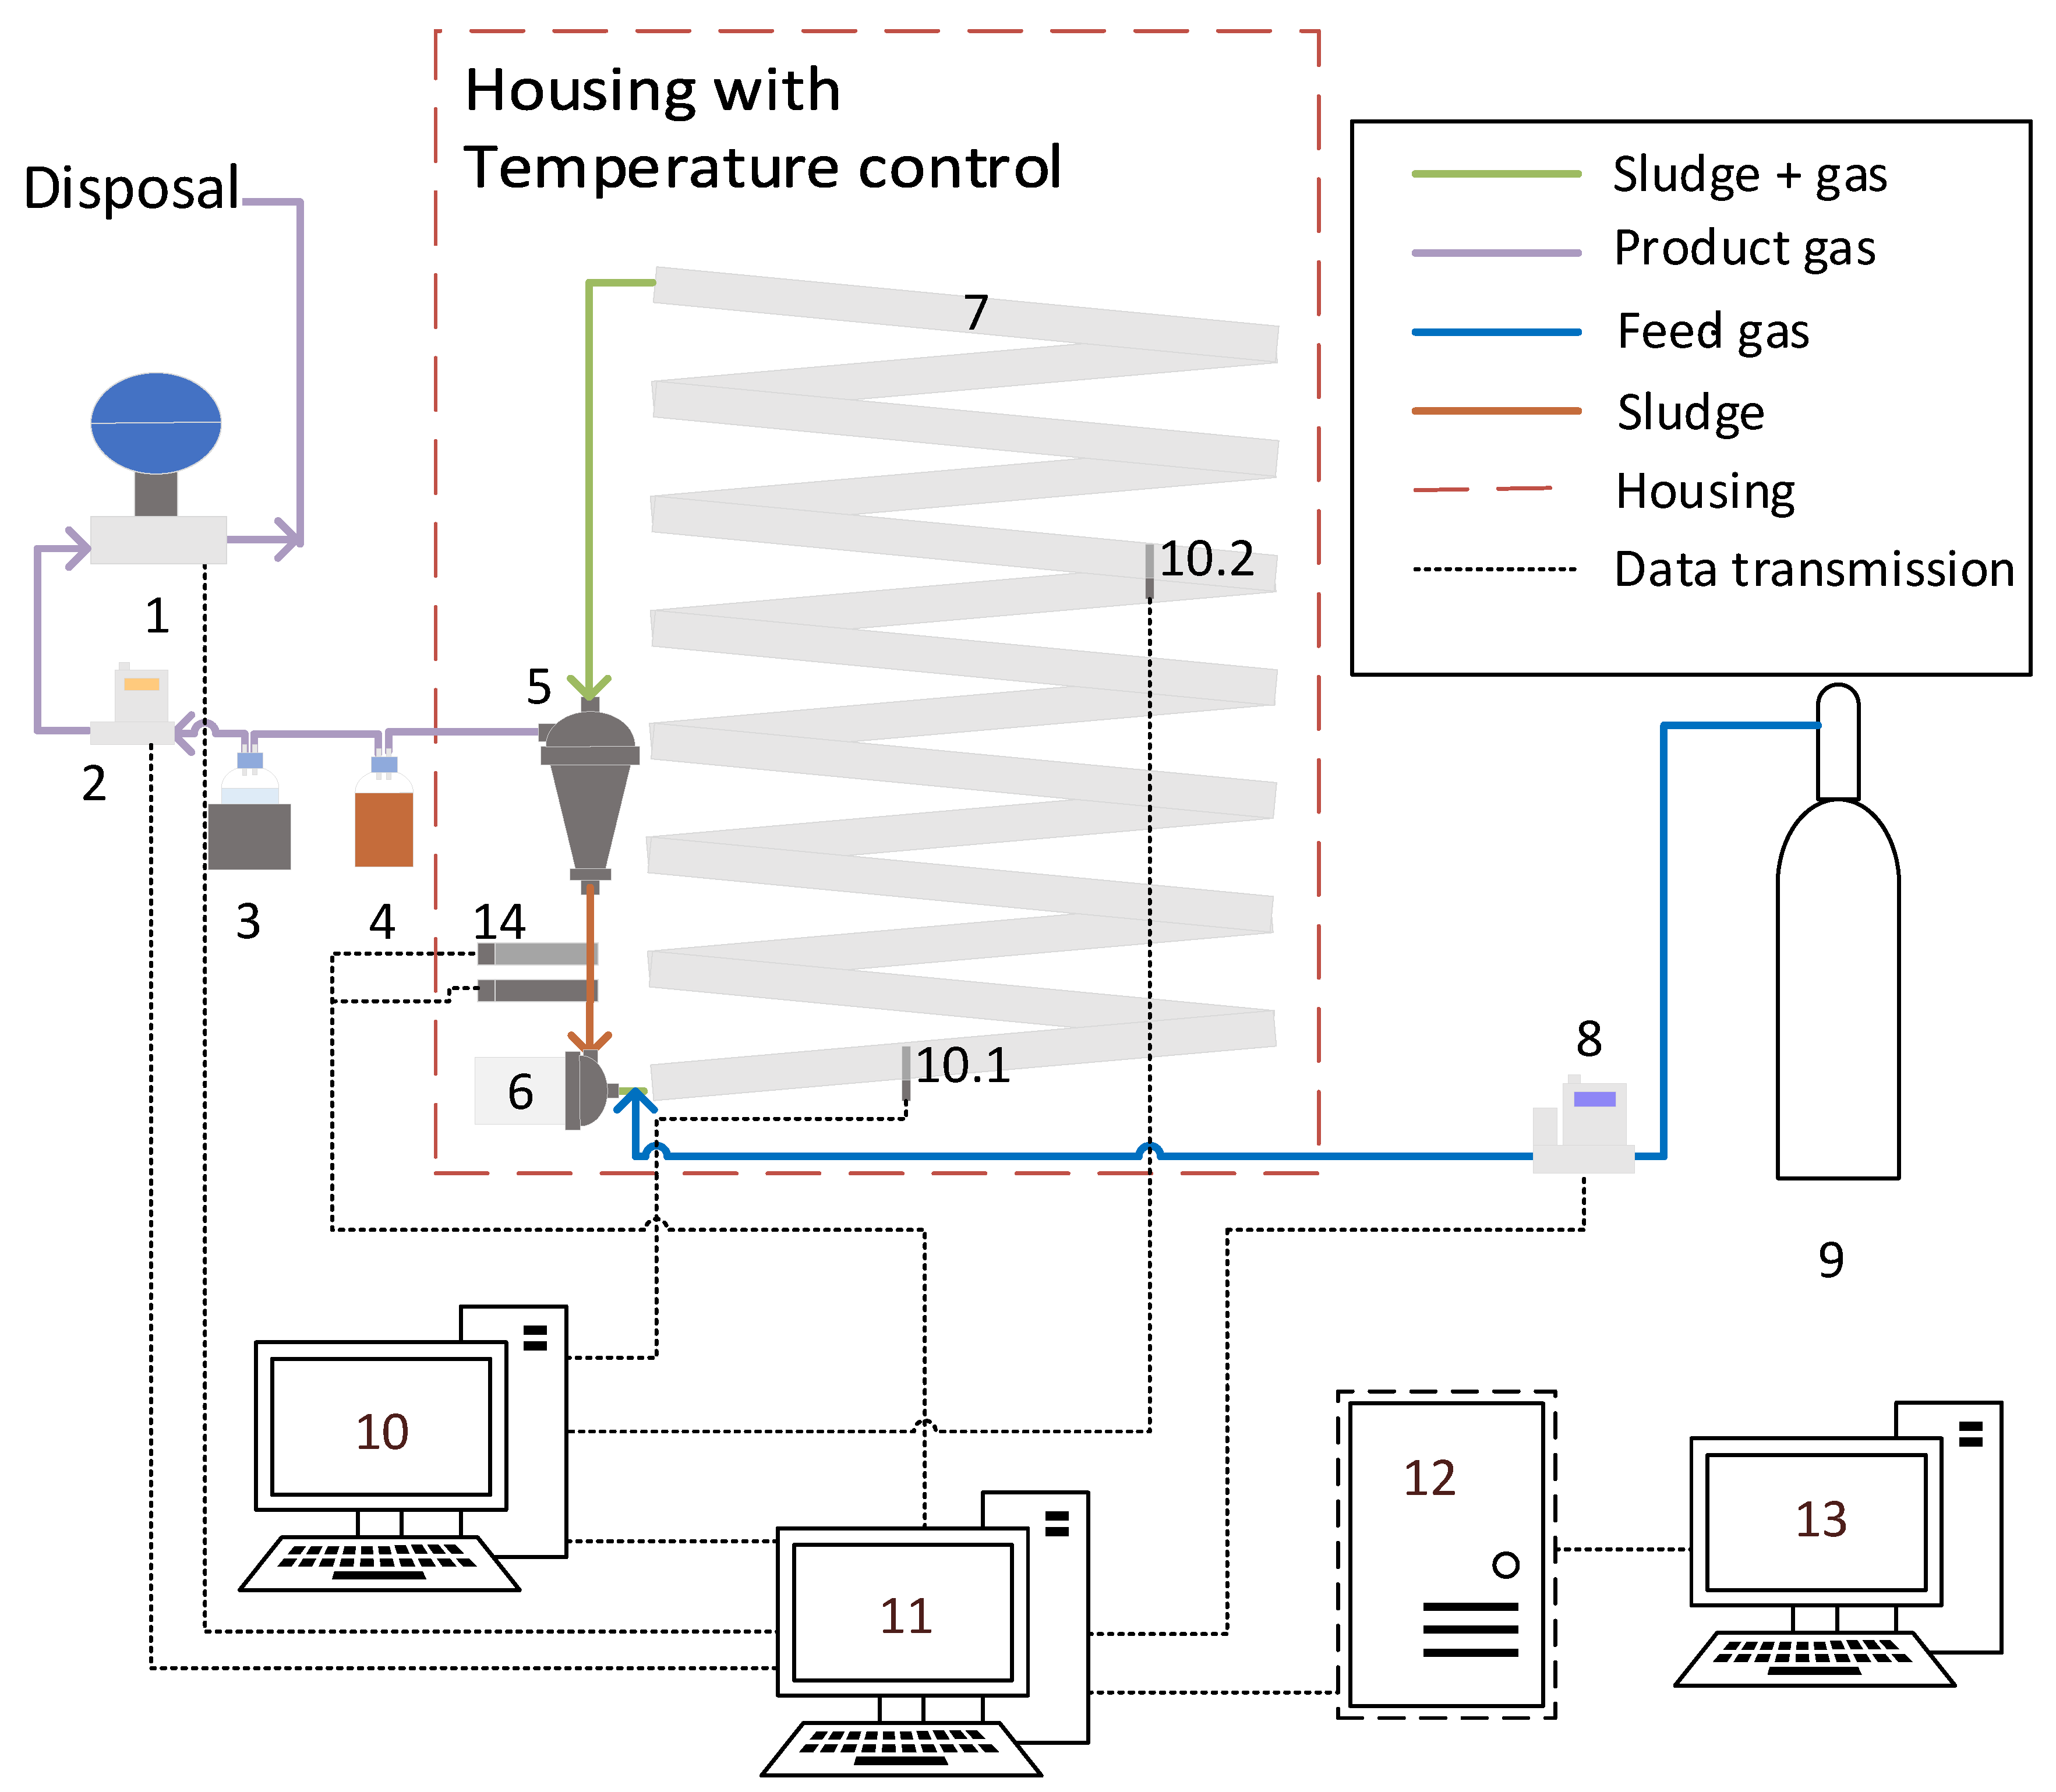
Figure 1. Schematic diagram of the reactor. 1: gas analyzer (BCP-H2, BlueSens gas sensor GmbH, Herten, Germany); 2: gas flow meter (F-101EI-AGD-00-K, Bronkhorst Deutschland Nord GmbH, Kamen, Germany); 3: chiller 5 °C (WineCase One, CASO, Arnsberg, Germany), 1 L borosilicate bottle (VWR International GmbH, Darmstadt, Germany); 4: 0.5 L borosilicate bottle as sludge container (VWR International GmbH, Darmstadt, Germany); 5: gas–liquid separator (Hydrocyclone Filter 1″, Alfaturbo, Plastica Alfa, Caltagirone, Italy); 6: pump (LS543238, Lilie, GmbH & Co. KG, Besigheim, Germany); 7: tubular reactor with integrated helical structure; 8: gas flow controller (D-6311-DR, Bronkhorst Deutschland Nord GmbH, Kamen, Germany); 9: gas bottle (80% H2, 20% CO2, Westfalen AG, Muenster, Germany); 10: raspberry Pi 4 Model B for temperature measurement; 10.1: temperature sensor (ds18b20); 10.2: temperature sensor (ds18b20); 11: raspberry Pi 4 Model B for data processing; 12: data server; 13: computer for monitoring; 14: dissolved hydrogen sensor (AMT Analysemesstechnik GmbH, Rostock, Germany).
Fermentation 09 00774 g001
Figure 2. Mesh independence test of the helical model on pressure drop and velocity after 20 s.
Fermentation 09 00774 g002
Figure 3. Computational domain 1 (a) without helical structure with the applied mesh design, and computational domain 2 (b) with helical structure with the applied mesh design. L = input liquid phase; G = input gas phase.
Fermentation 09 00774 g003
Figure 4. Water level estimation in the experimental setup with Fiji 3 = radius (r); 10, 11, and 12 = distance from center; 6, 7 (hc), and 8 = estimated water level (h = r + hc).
Fermentation 09 00774 g004
Figure 5. Simulated streamline flow of liquid–gas phase in domain 1 (a) without helical structure and domain 2 (b) with helical structure at 20 s. L = input liquid phase; G = input gas phase; streamlines in red.
Fermentation 09 00774 g005
Figure 6. Simulated axial velocity distribution in domains 1 (a) without helical structure and 2 (b) with helical structure at 20 s. L = input liquid phase; G = input gas phase.
Fermentation 09 00774 g006
Figure 7. Simulated radial velocity distribution in domain 1 without helical structure at 9 s (a) and domain 2 (b) with helical structure at 20 s. L = input liquid phase; G = input gas phase.
Fermentation 09 00774 g007
Figure 8. Simulated velocity distribution in domain 2 at 20 s in equidistant sections in 5 mm steps from 0 mm to 45 mm. L = input liquid phase; G = input gas phase.
Fermentation 09 00774 g008
Figure 9. Residence time distribution ( F t τ = C i C i , 0 ) at a retention time of τ = 1.84 h. Washout function was determined with a mixture of hydrogen (80%) and carbon dioxide (20%) fed to a reactor, washing out methane. Residence time distribution model for CSTR cascades with N steps with N = 1 (violet) and N = 30 (green).
Fermentation 09 00774 g009
Figure 10. Experimental data for kLa determination at hydrogen feed of 10.24 L N L R d and a carbon dioxide feed of 2.56 L N L R d .
Fermentation 09 00774 g010
Table 1. Properties, settings, and boundary conditions of the two computational domain systems in COMSOL Multiphysics®.
Properties and SettingsBoundary Conditions
VariableValueBoundaryVelocity (V)
TemperatureT = 313.15 KInlet A (liquid) v 1 = 0.02 m/s
Liquid densityρ1 = 992.63 kg/m3Inlet B (gas) v 2 = 0.1 m/s
Liquid dynamic viscosityμ1 = 6.66 × 10⁻⁴ Pa·sWallNo slip condition,
v 3 = 0
Gas densityρ2 = 0.441 kg/m3
Gas dynamic viscosityμ2= 1.05 × 10⁻⁵ Pa·s
Gravity (y-component)g = −9.806 m/s2
Disclaimer/Publisher’s Note: The statements, opinions and data contained in all publications are solely those of the individual author(s) and contributor(s) and not of MDPI and/or the editor(s). MDPI and/or the editor(s) disclaim responsibility for any injury to people or property resulting from any ideas, methods, instructions or products referred to in the content.