Article

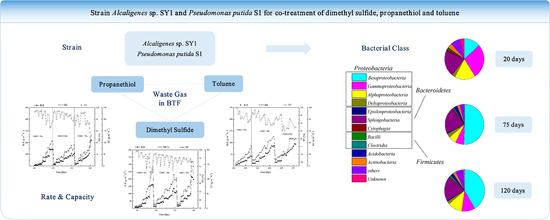
Co-Treatment with Single and Ternary Mixture Gas of Dimethyl Sulfide, Propanethiol, and Toluene by a Macrokinetic Analysis in a Biotrickling Filter Seeded with Alcaligenes sp. SY1 and Pseudomonas Putida S1

1
College of Chemical and Biological Engineering, Zhejiang University, Hangzhou 310027, China
2
Key Laboratory of Biomass Chemical Engineering of Ministry of Education, Zhejiang University, Hangzhou 310027, China
3
Department of Chemical Engineering, University of Washington, Seattle, WA 98195, USA
4
Shaoxing Environmental Monitoring Central Station, Shaoxing 312000, China
5
College of Biological and Environmental Engineering, Zhejiang University of Technology, Hangzhou 310014, China
6
China Aerospace Kaitian Environmental Technology Co., Ltd., Changsha 410100, China
*
Author to whom correspondence should be addressed.
These authors contributed equally to this work.
Fermentation 2021, 7(4), 309; https://doi.org/10.3390/fermentation7040309
Submission received: 28 October 2021 / Revised: 2 December 2021 / Accepted: 7 December 2021 / Published: 14 December 2021

Abstract

:
The biotrickling filter (BTF) treatment is an effective way of dealing with air pollution caused by volatile organic compounds (VOCs). However, this approach is typically used for single VOCs treatment but not for the mixtures of VOC and volatile organic sulfur compounds (VOSCs), even if they are often encountered in industrial applications. Therefore, we investigated the performance of BTF for single and ternary mixture gas of dimethyl sulfide (DMS), propanethiol, and toluene, respectively. Results showed that the co-treatment enhanced the removal efficiency of toluene, but not of dimethyl sulfide or propanethiol. Maximum removal rates (rmax) of DMS, propanethiol and toluene were calculated to be 256.41 g·m−3·h−1, 204.08 g·m−3·h−1 and 90.91 g·m−3·h−1, respectively. For a gas mixture of these three constituents, rmax was measured to be 114.94 g·m−3·h−1, 104.17 g·m−3·h−1 and 99.01 g·m−3·h−1, separately. Illumina MiSeq sequencing analysis further indicated that Proteobacteria and Bacteroidetes were the major bacterial groups in BTF packing materials. A shift of bacterial community structure was observed during the biodegradation process.

Graphical Abstract

1. Introduction

The removal of odorous waste, including volatile organic sulfur compounds (VOSCs) has been paid increasing attention for air pollution control solutions, considering their aqueous solubility and gradual diffusion into the atmosphere [1,2,3]. VOSCs are extremely toxic, corrosive, and malodorous compounds, which have significant effects on animal and human health as well as the environment [4]. Moreover, VOSCs very often co-exist with volatile organic compounds (VOCs). BTEX, including benzene, toluene, ethylbenzene, and xylene as paint thinner, are widely applied in machining operations and plating shops. The mixture of dimethyl sulfide (DMS), propanethiol, and toluene can be found in the exhaust gas from pharmaceutical, pesticide, and rubber industries. For example, an exhaust gas from a pesticide company can contain DMS (C DMS = 100 mg·m−3~300 mg·m−3), propanethiol (C Propanethiol = 30 mg·m−3~150 mg·m−3), and toluene (C Toluene = 100 mg·m−3~400 mg·m−3). Thus, it is worthwhile to focus on some typical VOSCs and VOCs, such as DMS, propanethiol, and toluene. As a result, the development of highly efficient, economically feasible, and environmentally friendly technologies of odor removal is in urgent demand.
The traditional approaches for the removal of VOSCs and VOCs from a gas stream are mostly physical methods (filtration, adsorption, dilution by clean air, and condensation) and chemical methods (chemical oxidation, thermal oxidation, chemical adsorption, and UV activation method) [5,6,7]. Recently, these methods have been used as a pretreatment, in terms of their removal mechanism. The transformation of pollutants from the gas phase to other phases or breaking down long chemical chains to short chemical chains is not a complete removal of pollutants. Although chemical solutions are efficient for gaseous pollutant removal, some of them are expensive, non-recyclable, or introduce secondary pollution, even for a new green chemical called ionic liquid [8]. Moreover, the waste gas in the pharmaceutical, pesticide, and rubber industries not only contains VOCs and VOSCs, it also contains dichloromethane. BTF compares with the other conventional approaches, such as regenerative thermal oxidization (RTO) or regenerative catalytic oxidation (RCO), which have their own limitations, including the chlorine being corrosive against metal and the operation cost of RTO or RCO is expensive. BTF not only transfers VOCs or VOSCs to CO2 and H2O, it also transfers to the intermediates and biomass in an eco-friendly way. (4) Comparing BTF with other popular approaches, such as RTO or RCO, shows that biotrickling will not generate secondary air pollutants, such NOx. In addition, it also reduces the CO2 content in products.
In comparison, biopurification (biofilters, bioscrubbers, biotrickling filters) is a practical and preferred approach for the treatment of VOSCs and VOCs [9,10,11,12], and the key difference between biotrickling filters and bioscrubbers are that they target different application scenarios in the field. Biotrickling filters are suitable for factories treated with a mixture of VOCs, and bioscrubbers are suitable for centralized wastewater treatment scenarios treated with hydrophilic VOCs. Among these various types of biological treatment, biotrickling filters (BTFs) are preferred in many cases due to their stable operation, low-cost, and easy processing control [13,14,15,16,17,18]. Therefore, biotrickling filter has an advantage over many biological treatment technologies in the control of operating parameters and mineralized efficiency, especially for high concentration acidified contaminants containing waste gas streams, such as sulfur, chlorine, or nitrogen containing compounds [19,20,21]. It has been reported to be effective for treating single VOSC, such as methanethiol or dimethyl sulfide [22,23]. Few papers have been published using an aerobic biotrickling filter system for removal of waste gas containing ethanethiol [10,24,25] besides our previous paper [26]. And few studies have been conducted to purify waste gas containing DMDS (dimethyl disulfide) via biofilter [27,28,29,30,31]. Little research has been reported to get thioanisole waste gas biologically treated. It is worthwhile pointing out that various odorous pollutants always co-exist in a real environment [32,33]. Nevertheless, in strong contrast to the level of understanding towards the degradation of single organic compound, little is known regarding the biotreatment of waste gas mixture, especially the binary mixture gas of ethanethiol and DMDS and ternary mixture gas of ethanethiol, DMDS, and thioanisole, which are more often encountered in practical applications.
In previous studies about biopurification for gaseous pollutants, various types of single VOSC or VOC have received extensive attention [34,35,36,37], but very little attention has been paid to control mixtures of VOSC and VOC from industries. Furthermore, very few have been understood towards the co-treatment of VOSCs and VOCs, especially the mixture gas which is very often found in real cases. It has been reported that a single substrate, such as DMS, propanethiol, or toluene can be removed efficiently from BTFs [29,38]. Although, few papers have been published using an aerobic BTF to remove VOCs and VOSCs together [22,23]. Few papers have investigated single pollutant performance co-existing with others [39,40]. However, the mechanism for how the mixture of contaminants affects the kinetics of the individual remains unclear. Therefore, it is worth focusing on the co-treatment of typical VOSCs and VOCs in terms of those contaminants, which are common in reality.
In this work, a BTF, inoculated with the DMS isolator Alcaligenes sp. SY1 [23], propanethiol isolator Pseudomonas putida S1 [41], and the acclimated activated sludge with toluene degradability, was set up for the treatment of the mixture containing DMS, propanethiol, and toluene. Furthermore, the biofilms from three different periods were collected and sequenced using the Illumina MiSeq platform for a comprehensive understanding of microbial compositions and structures.

2. Experimental Methods

2.1. Microorganism Culture and Medium Preparation

The microorganism seeding method and the degradation ability for DMS and propanethiol of Alcaligenes sp. SY1 and Pseudomonas putida S1, were the same methods utilized in our previous research [26,41]. A few acclimatized activated sludges were also used in system.
A mineral salt medium (MSM) was contained: 4.5 g Na2HPO4·12H2O, 2.5 g KH2PO4, 1.0 g NH4HCO3, 0.2 g MgCl2·7H2O, 0.03 g CaCl2·2H2O, 0.01 g FeCl2·4H2O in 1 L deionized water and 1 mL of trace element stock solution. The trace element stock solution contained 1.0 g·L−1 FeCl2·7H2O, 0.02 g·L−1 CuCl2·5H2O, 0.014 g·L−1 H3BO3, 0.10 g·L−1 MnCl2·4H2O, 0.10 g·L−1 ZnCl2 7H2O, 0.02 g·L−1 Na2MoO4·2H2O, and 0.02 g·L−1 CoCl2·6H2O in a 250 mL flask and the flask was sealed with a rubber stopper [38]. 12 L DMS and propanethiol was injected into each flask and the total volume of solution was 500 mL for each bacteria strain. After being cultured at 30 °C and 160 r/min, suspension containing a specific bacteria strain was obtained as the inoculant for the biofilter.

2.2. BTF Setup and Operation Condition

The schematic of a multi-layer BTF is shown in Supplementary Materials Figure S1; the BTF was constructed using a plexi-glass with a total height of 90 cm, an inner diameter 12 cm, an outer diameter of 15 cm, and the height of 25 cm for each layer. The BTF was packed with a polyurethane pall ring, which has an initial porosity 0.91. Gas sampling ports were located along the height of the biofilter, with another two sampling ports located in each layer for the collection of biomass samples.
The air stream for the BTF was built from two sub air streams. One air stream carries pollutants by passing air through a glass bubbler of 250 mL containing liquid VOCs at room temperature and then mixed with major air stream in mixture reactor in order to homogeneous mixing trough BTF reactor. Concentrations of VOCs in the synthetic gas stream were varied by changing the air flow rate through the bubbler. The pH of the system was adjusted by HCl (10%) solution through an auto-pH adjustor (Kesheng, Hangzhou, China) and was controlled in the range of 6.86 to 7.20. Pressure drop in the gas phase through the fixed bed reactor was measured by a manometer (AZ8252, Guangzhou, China). The nutrient solution was sprayed over the top of the column at 6 L·h−1 by a peristaltic pump (Longerpump® BT600-2J, Hangzhou, China). Gas samples were collected by gas tight syringes (Gaoge, Shanghai, China) fitted with 3-way luer-lock and measured by GC analysis. The measurement procedure for weight of packing material, porosity, and liquid maintaining capacity was based on our previous work [32].
During the startup period, BTFs were operated in a continuous manner, i.e., the nutrient liquid trickled through the packing for 24 h. The trickling rate was controlled at 6 L·h−1. 50% of the trickling liquid was replaced every 5 days. The reactor was operated in a closed loop mode with respect to liquid to maximize cell adhesion to the packing material. The start-up method of the BTF was the method reported by Jin [34]. The BTF was initially started up with synthesized gas flow and the corresponding empty bed retention time (EBRT) was 56 s. Initial concentrations were 200.0 mg·m−3 for DMS and 100.0 mg·m−3 for propanethiol.

2.3. Analytical Method

DMS, propanethiol, and toluene were measured by gas chromatography (SHIMADZU GC-14B, Kyoto, Japan,) coupled with flame photometric detector (FPD, SHIMADZU, Japan) and flame ionization detector (FID, SHIMADZU, Japan). Hydrogen and air flow rates for FPD and FID were 50 mL·min−1 and nitrogen used as carrier gas was 200 mL·min−1. Temperatures of the injection, oven, and detection were 180 °C, 100 °C, and 180 °C, respectively.
The CO2 content was determined through GC9790 gas chromatograph (Fuli TDX-01, 30 m × 0.32 mm × 20µm, Technologies, Taizhou, China). The pH value of the sample was adjusted to 2.0, making sure the inorganic HCO3 transfer to CO2 completely. The detected samples were collected by the microsampler from headspace vapors of closed system and analyzed by using thermal conductivity detector (TCD). The temperature of the oven and detection were 100 °C and 150 °C, separately. The column flow rate was set as 5 mL·min−1. The external standard method was utilized to calculate CO2 concentration.
The startup period of BTF was from days 0–days 20, the steady period was from days 21–days 140, the end period was from days 141–days 252.

2.4. Biofilm Formation and Microbial Analyses

DMS (J&K®, Beijing, China), propanethiol (J&K®, Beijing, China) and toluene (Aladdin®, Shanghai, China) were utilized in this study. All other chemicals were high performance liquid chromatography (HPLC) grade. Biofilm formation of samples on day 20, 77 and 240 were observed by using Field Emission Scanning Electron Microscope (FESEM) (HITACHI, SU8010, Kyoto, Japan,). The samples were sent to Sangon Biotech Co., Ltd., (Shanghai, China) for high-throughput sequencing. DNA samples were amplified using the primers 515F (5′-GTGCCAGCMGCCGCGG-3′), and 806R (5′-GGACTACHVGGGTWTCTAAT-3′), targeting the V4 hypervariable regions of 16S rRNA genes [37,42,43].
Operational taxonomic units (OTUs) were assigned by applying UPARSE, and with 97% of sequences similarity were clustered into OTUs. Each OTU was assigned by using the Ribosomal Database Project (RDP) classifier to identify the typical sequence [44].

2.5. Operation Parameters of BTF

The inlet loading rate (ILR) of BTF is defined as,
I L R = ( C i V ) × Q
where Ci and Q are the mass concentration of the contaminants (%) and the mass flow rate of the inlet stream (g·h−1), respectively. V is the volume of BTF bioreactor (m3).
The performance of the BTF is evaluated by eliminate capacity (EC) (g·m−3·h−1), EBRTs, and RE (%). EC is the measurement of contaminant removal capacity at a given ILR. EBRT is the measurement of gas residence time within the reactor medium. ILR, EC, EBRT, and RE were calculated using the following equations:
Eliminate Capacity:
E C = ( C i C o V ) × Q
Empty bed resistance time:
E B R T = V Q
Removal efficiency:
R E = ( C i C o C i ) × 100

2.6. BTFs Operation and Startup Period

BTFs operated for 252 days to treat individual and synthesis gas. The study was performed for individual and ternary co-treatment with various parameters, such as inlet loading rate (ILR) and empty bed retention time (EBRT). The ILR and EBRT experiment conditions changes are presented in detail in Table S1.
During the startup period (day 1 to day 22), the inlet concentration of the mixture pollutants was maintained around 200.0 mg·m−3 at the ratio of DMS, propanethiol and toluene at 2:1:1 with a gas flow rate of 0.2 m3·h−1. In other words, the ILR and EBRT were maintained at 11.4 g·m−3·h−1 and 56 s, respectively. Over 80.0% of removal efficiency (RE) was observed in the BTF treating DMS on day 20, while the removal efficiency of propanethiol and toluene was stable after 14 and 19 days, respectively. The system was seeded with Alcaligenes sp. SY1 and Pseudomonas putida S1.

2.7. Kinetic Analysis

At the steady state, the growth rate of biofilms was equaled by their decay rate, the biological system was balanced. Therefore, a Michaelis–Menten (M–M) model can be applied as a macrokinetic analysis to the BTF system, which in terms of kinetic constants, was stable during the period. The degradation rate of contaminants within the biofilms was investigated in the gas-phase BTF and could be estimated by following equation:
V Q ( C i C o ) = K s r m a x C l n + 1 r m a x
in which rmax is the maximum biodegradation rate (g·m−3·h−1) and Ks is the saturation M–M model constant (mg·L−1) in the gas phase. Cln is the natural logarithm mean concentration [(CiCo)/ln(Ci/Co)]. According to the linear relationship between 1/Cln and [V/Q(CiCo)] could be calculated from the intercept and slope, respectively [45,46].

3. Results and Discussion

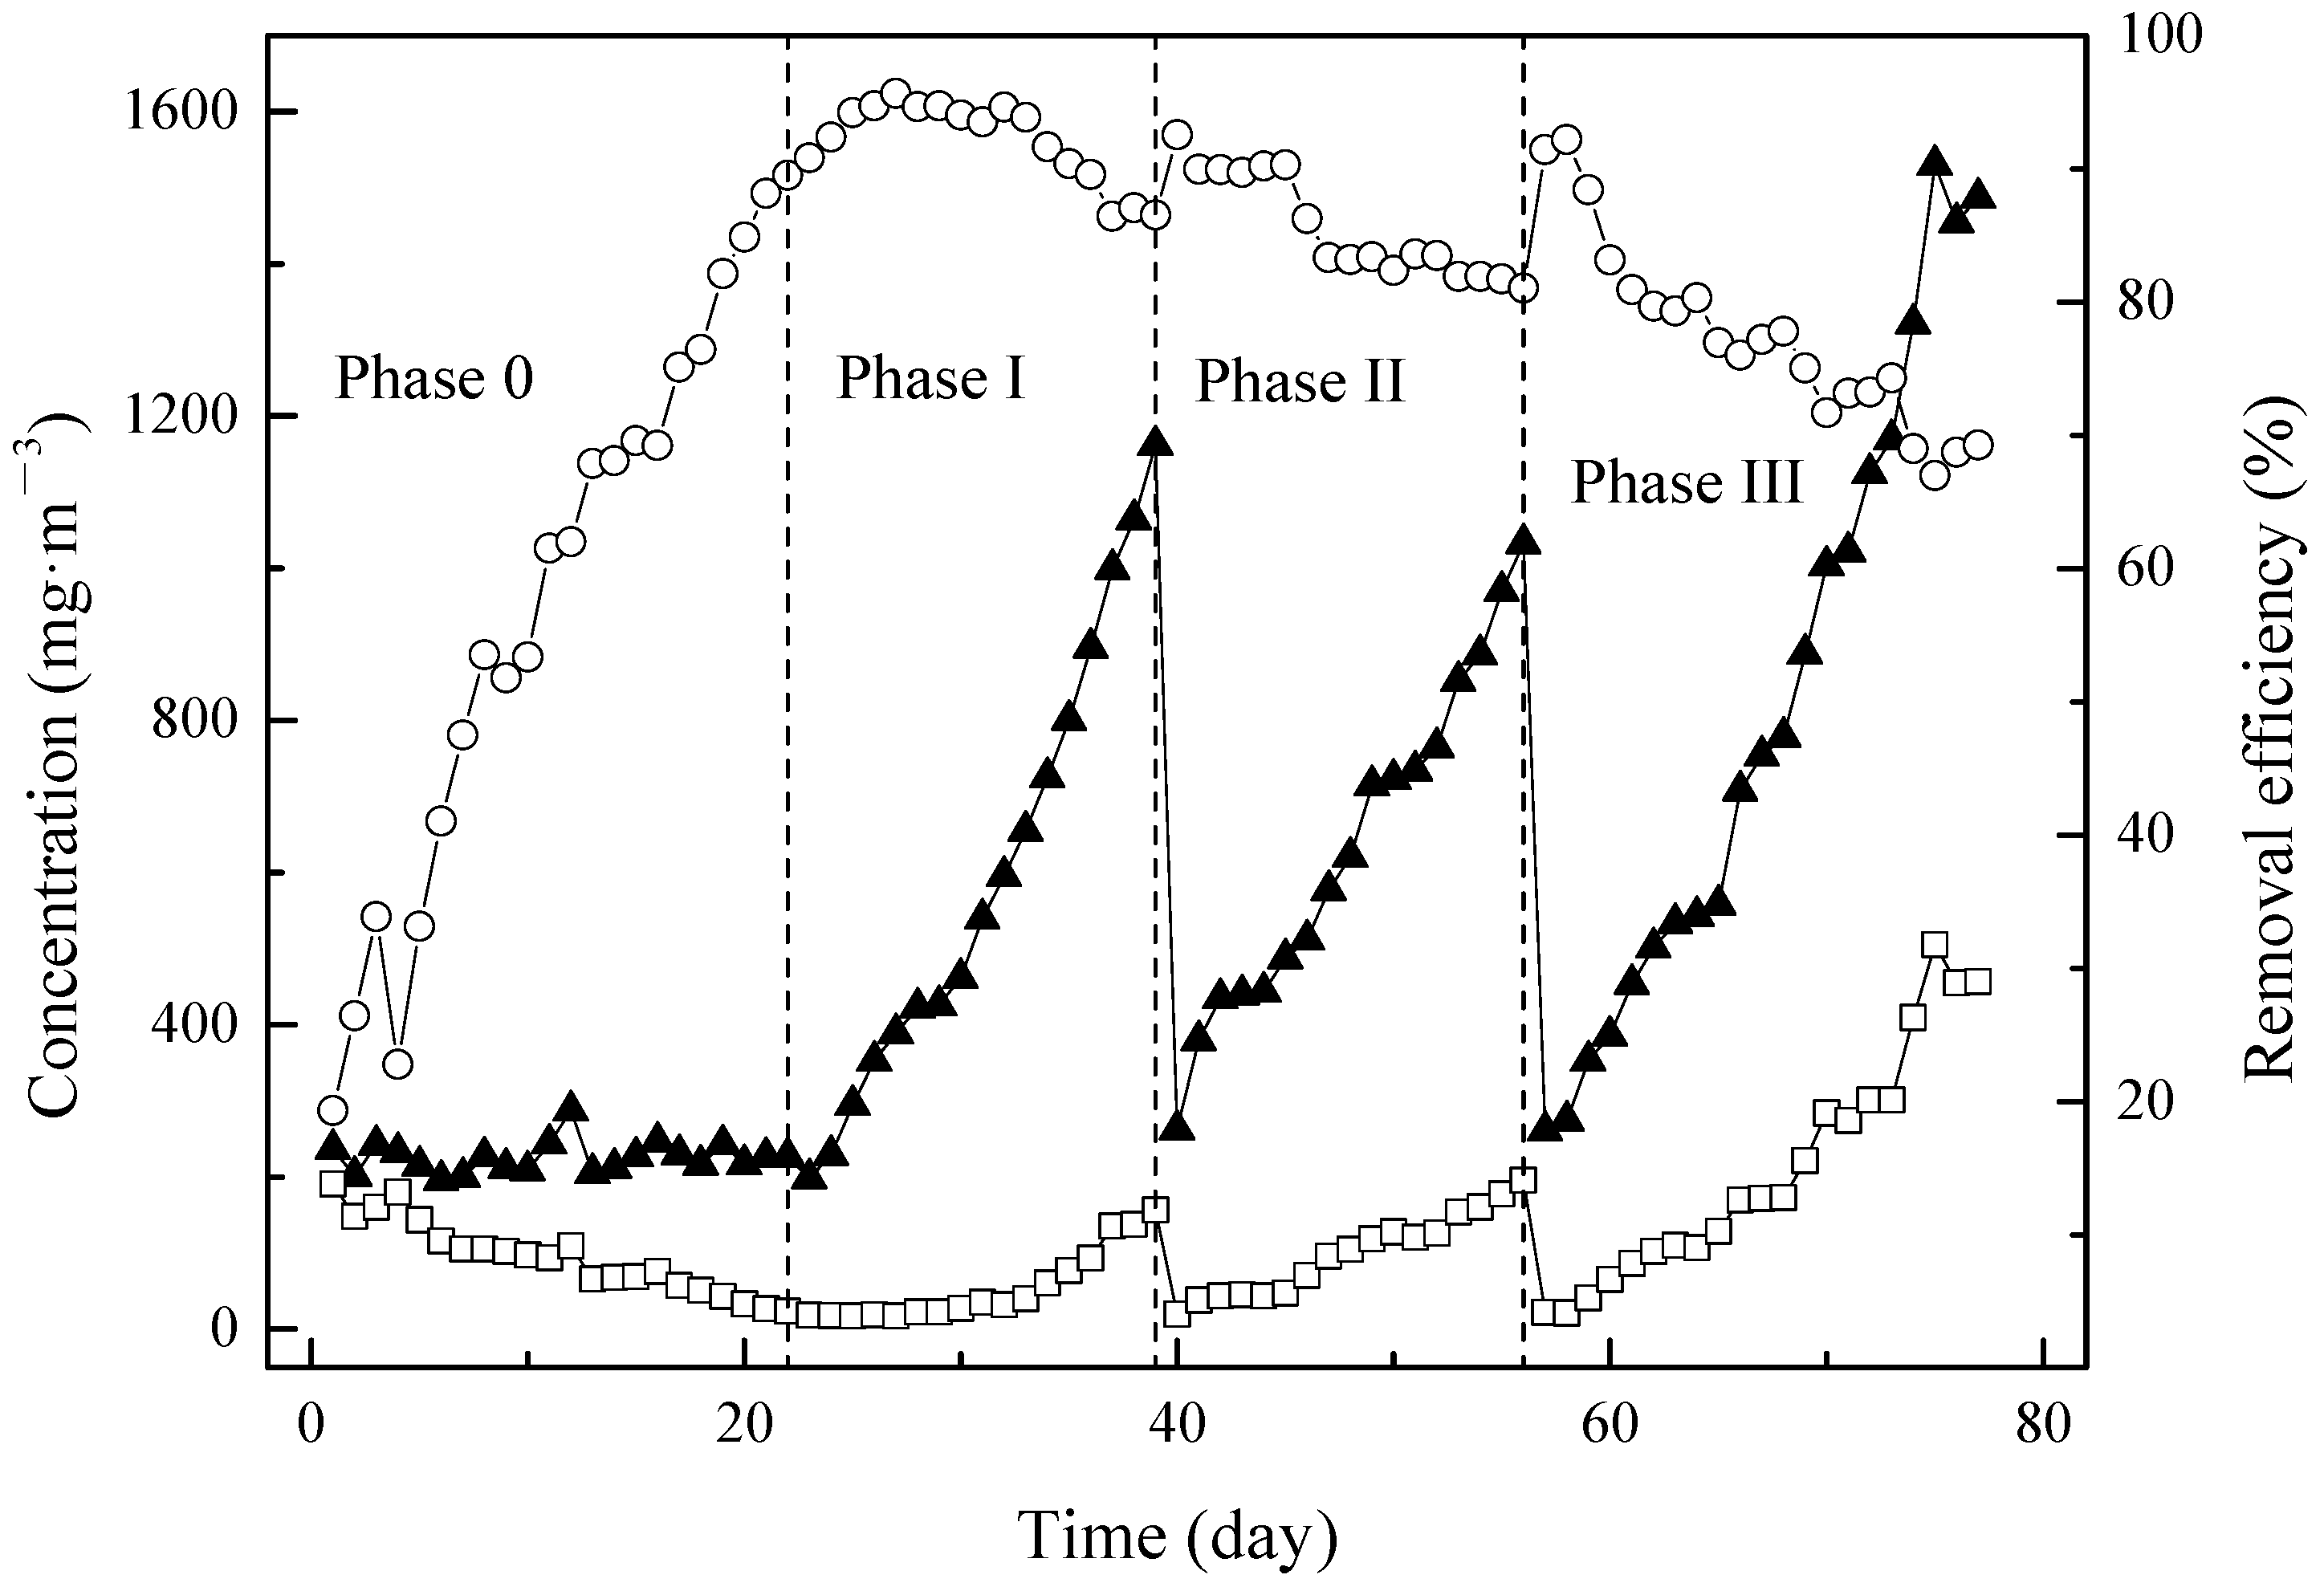
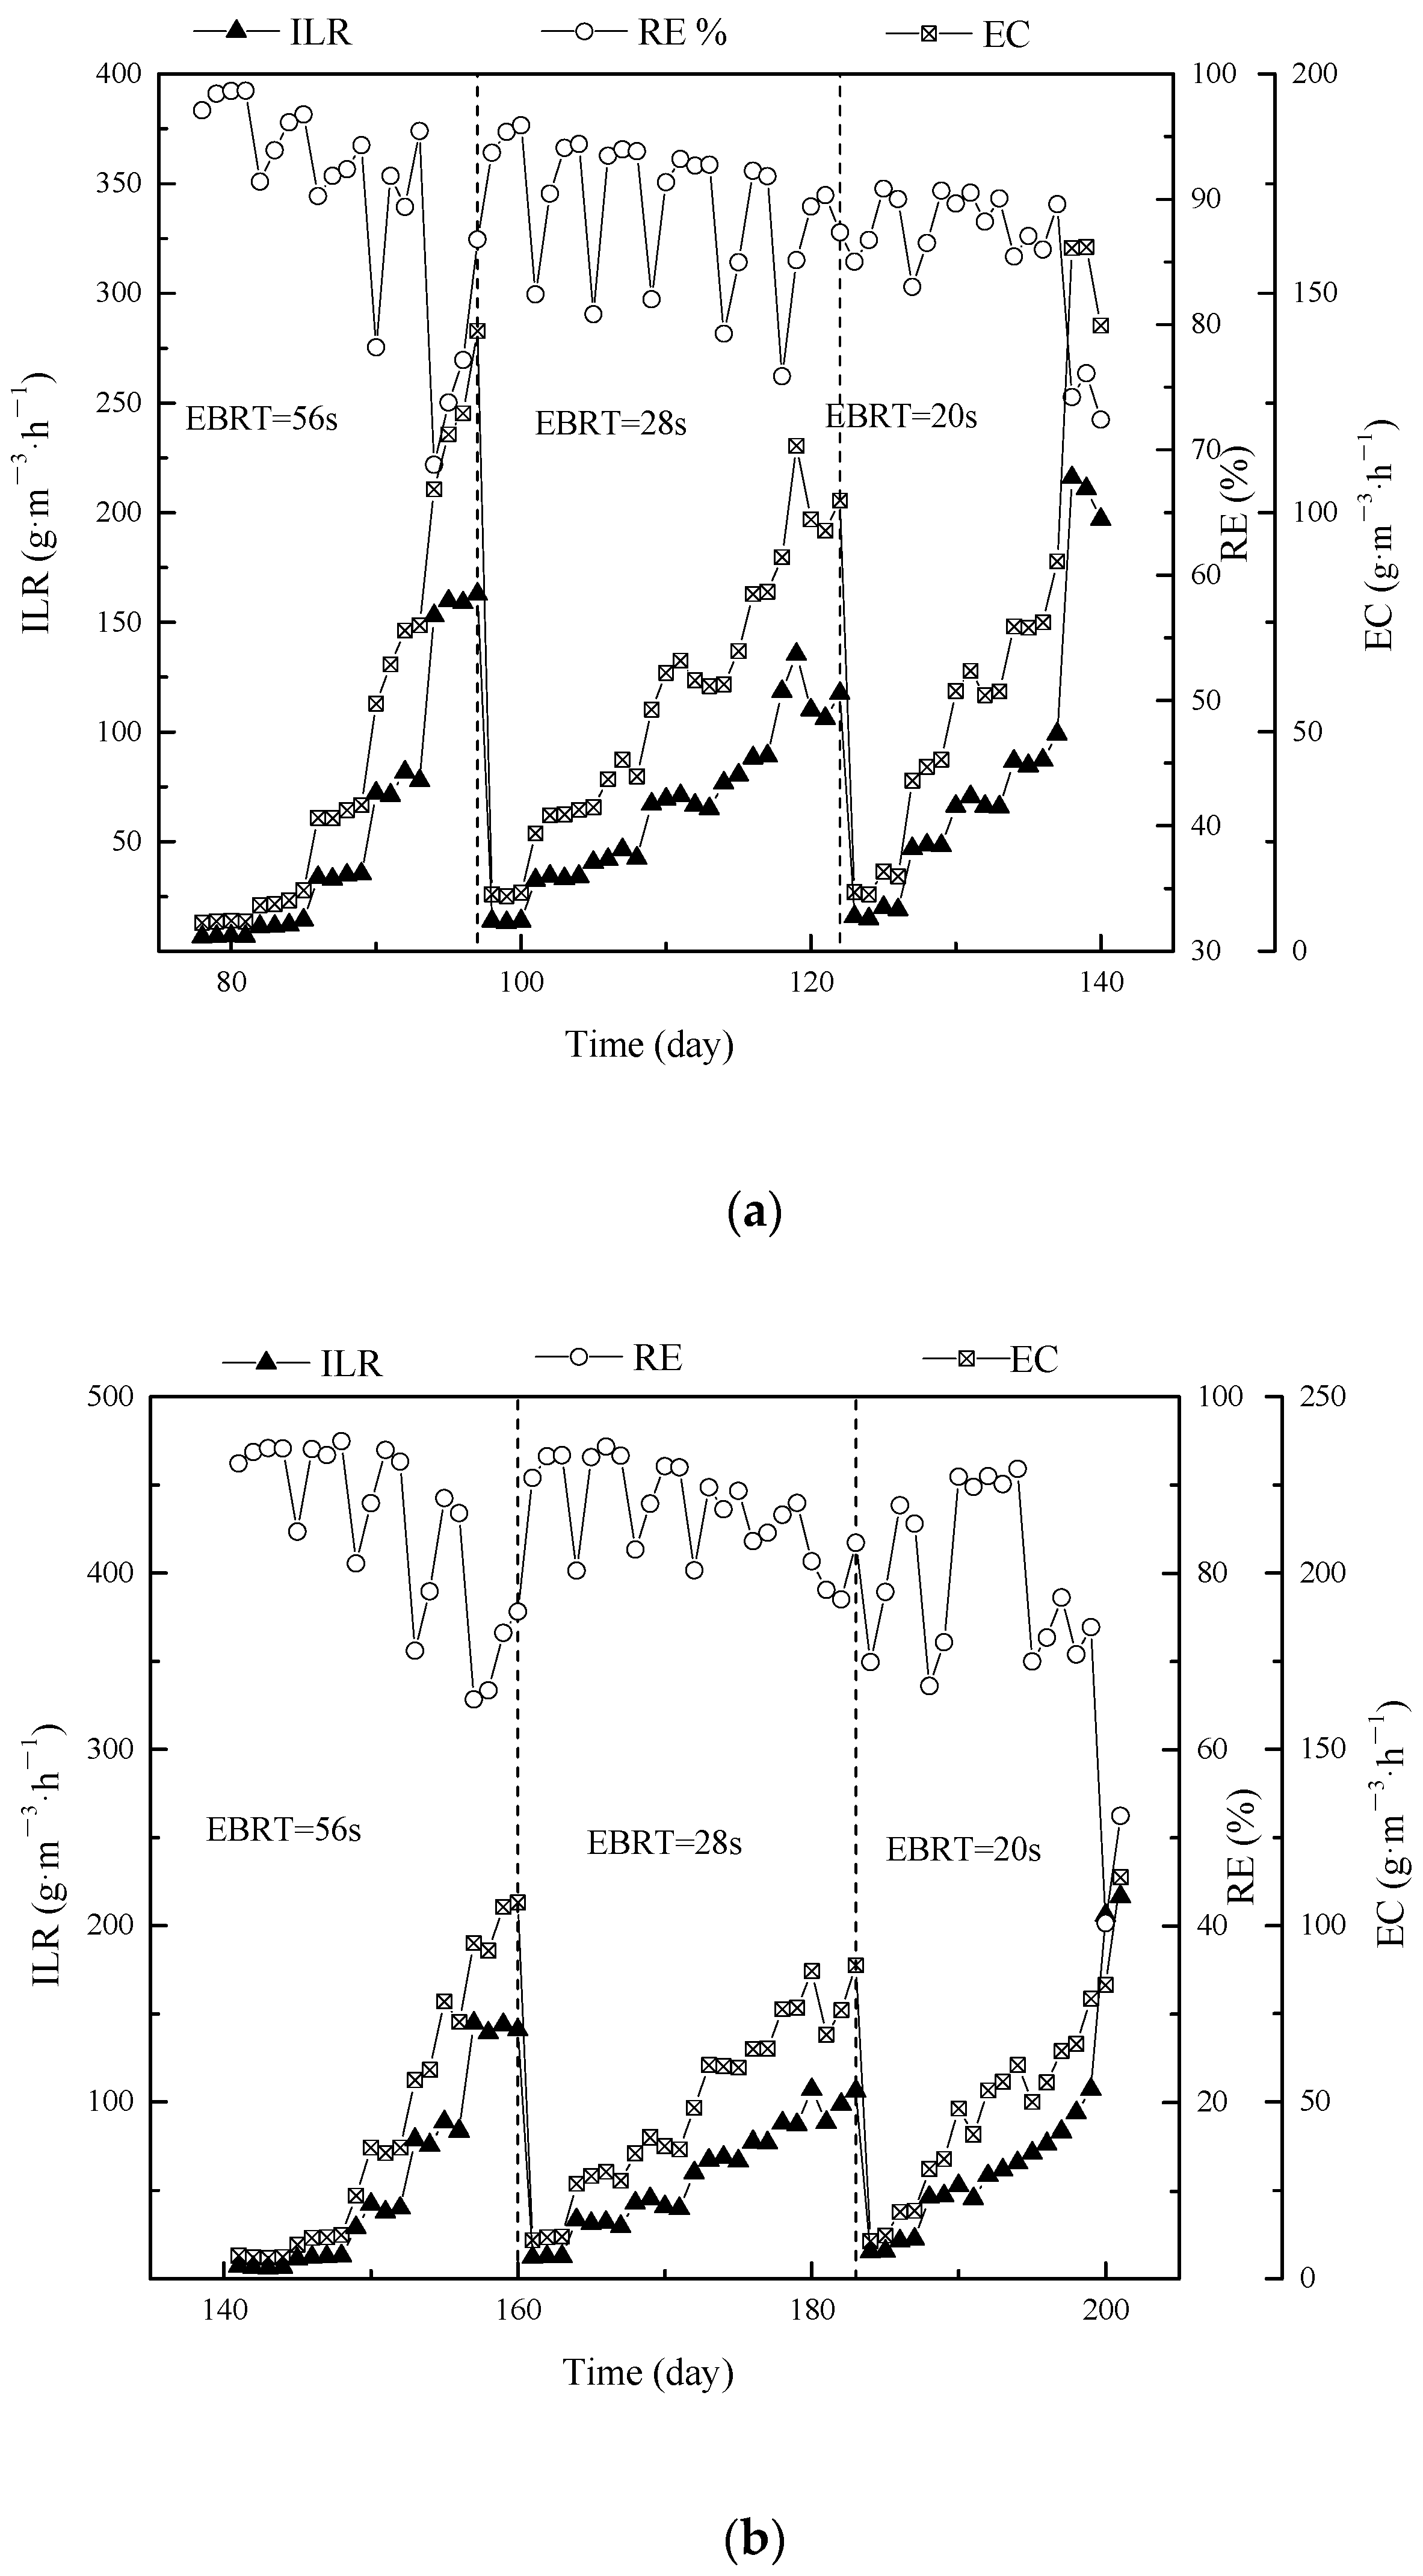
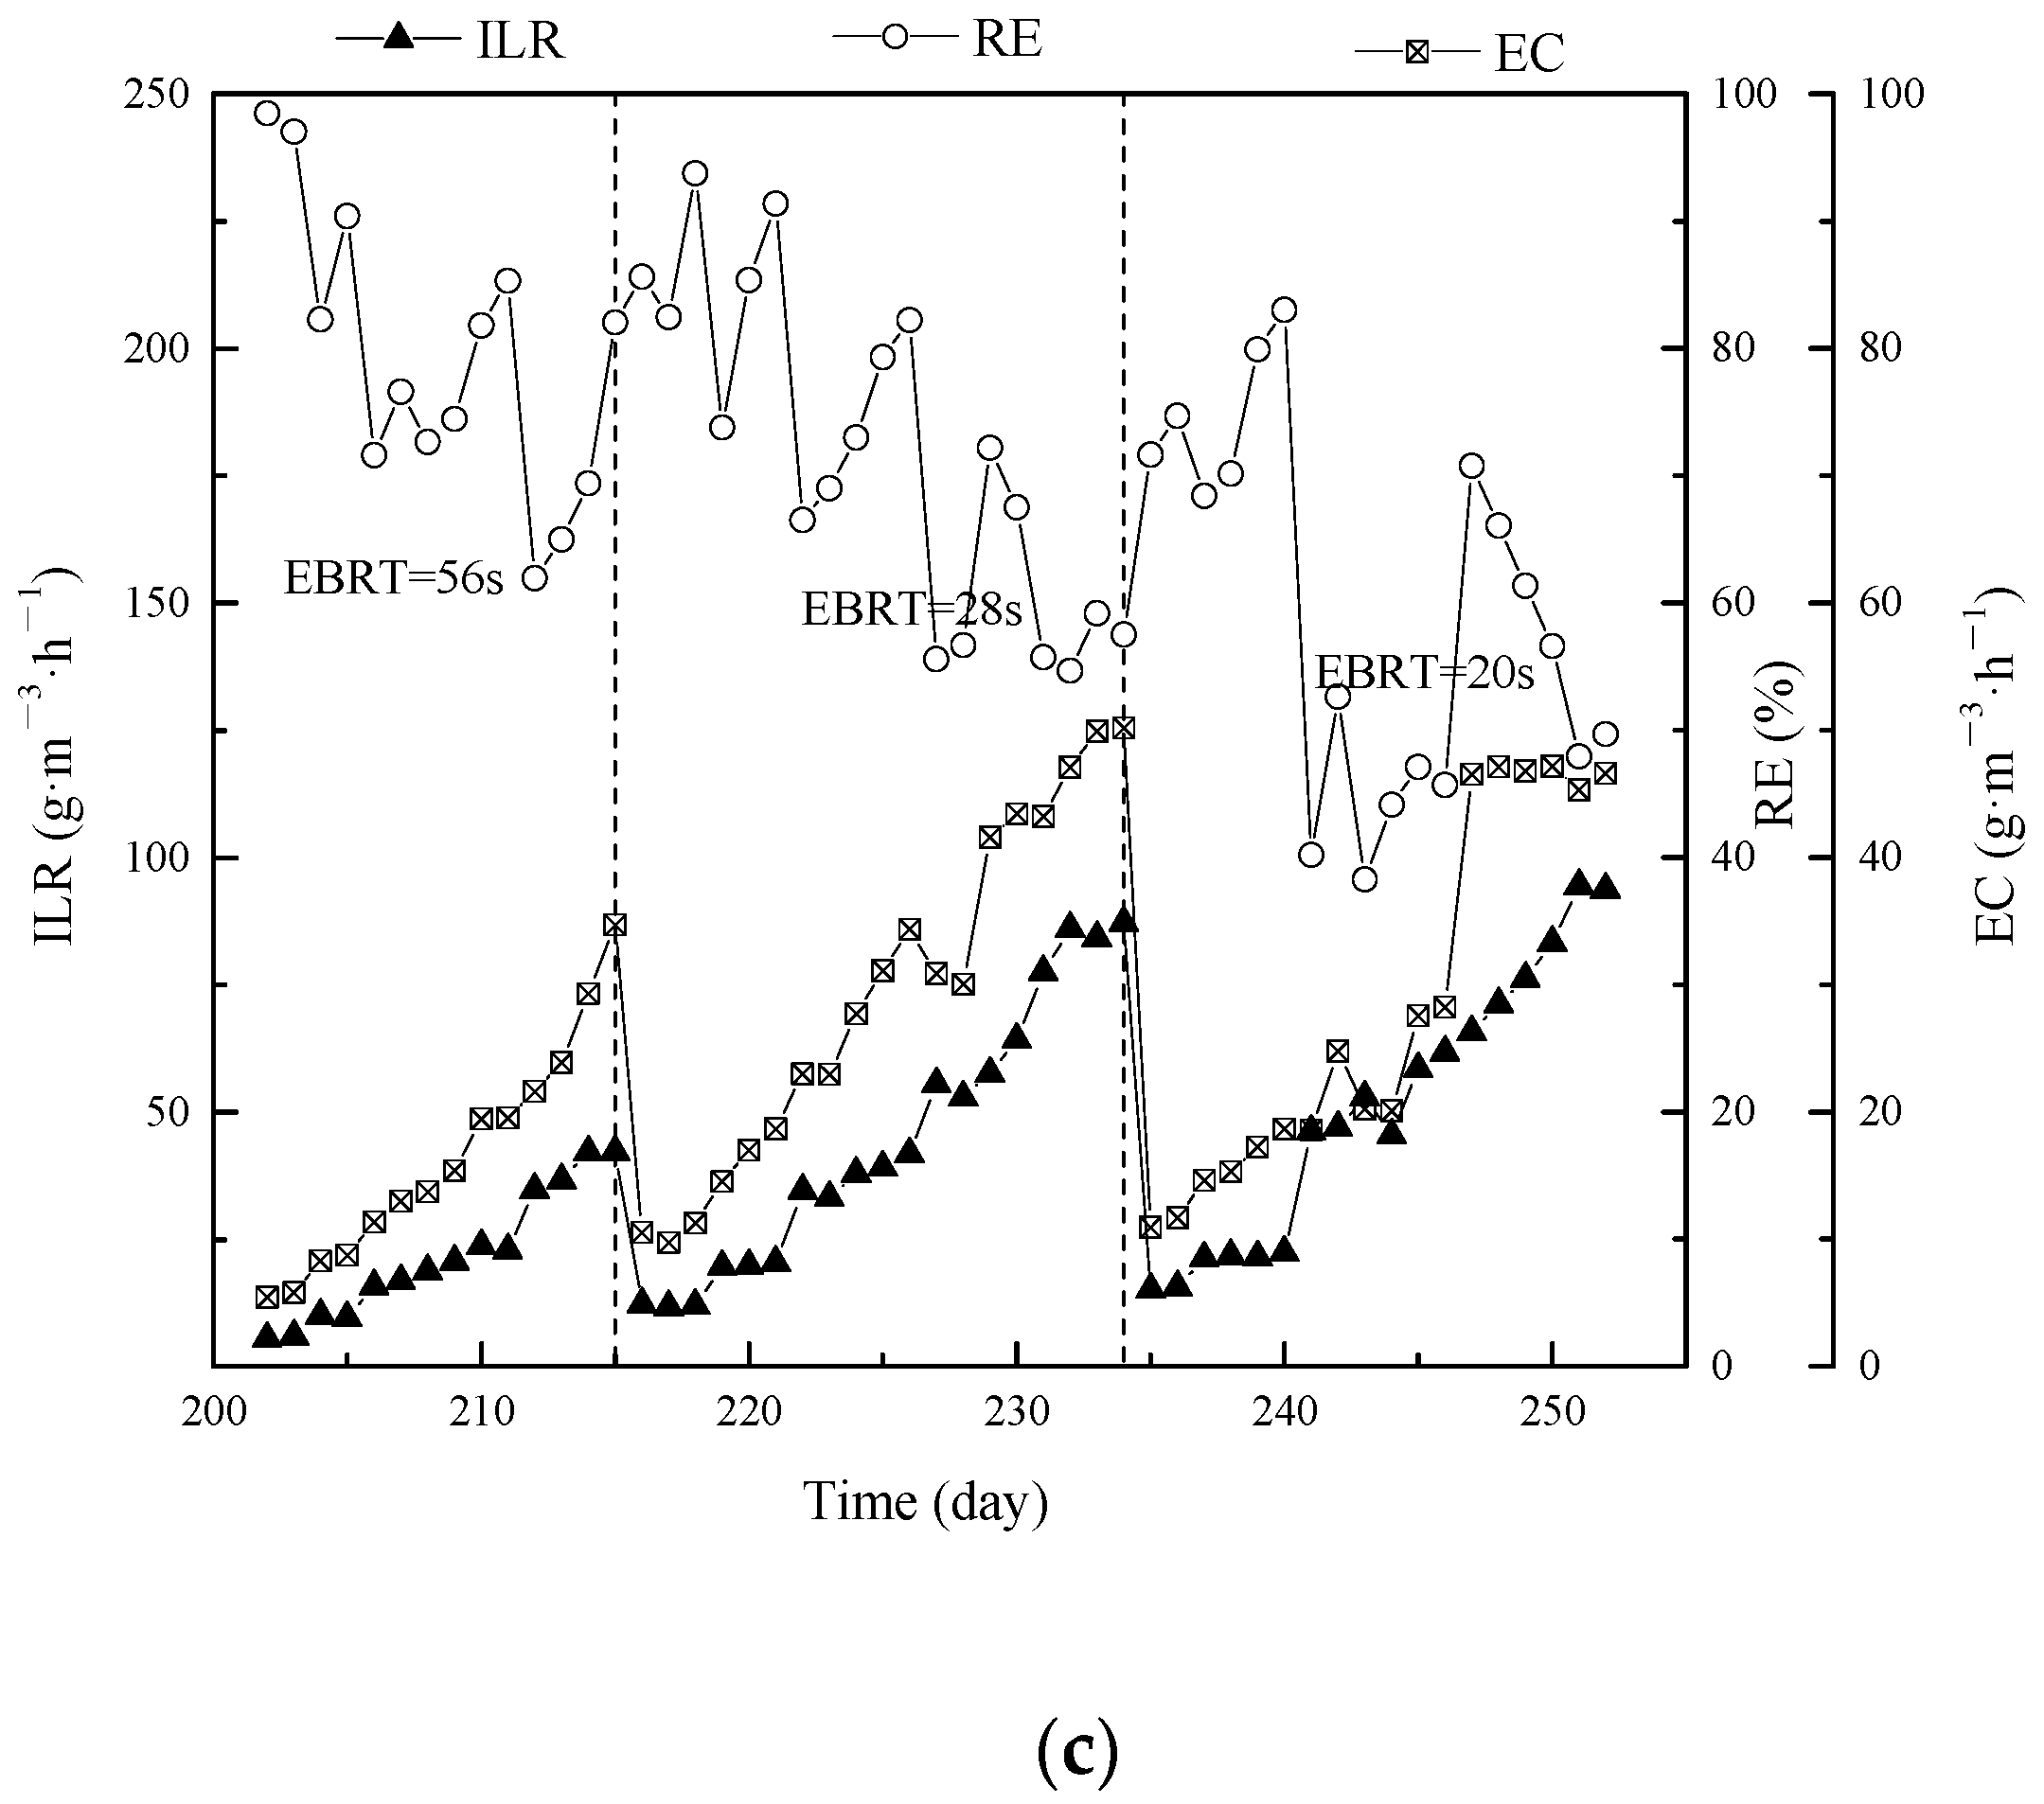
3.1. Performance of BTF for Mixed Gas during Different Phases

After the startup period, the BTF was tested under different conditions from phase I to phase III. The variations of inlet and outlet concentration of mixture pollutants in different phases are shown in Figure 1. EBRTs of 56 s, 28 s and 20 s were designed for phase I to phase III.
During phase I (from day 23 to day 39), initially, RE was increased with the growth of inlet concentration. However, due to sudden enhancement of inlet concentration to 998.67 mg·m−3 from 895.64 mg·m−3 on day 37, the RE was decreased from 89.56% to 86.45% and maintained constantly until the end of phase I. The similar tendency was observed during phase II (day 40 to day 56), RE was slightly increased with an enhancement of inlet concentration until day 46. When the inlet concentration was enhanced from 621.07 mg·m−3 to 714.70 mg·m−3, RE was suddenly dropped from 90.30% to 86.20% and keep gradually decreased to the end of phase II at 81.10%. During the phase III (day 57 to day 77), the tendency was different. An obvious outlet concentration increase was observed during phase III, while no significant outlet concentration enhancement was observed during phase I and phase II. Moreover, RE drops from 88.41% to 80.90% without an obvious increasing period during phase III.

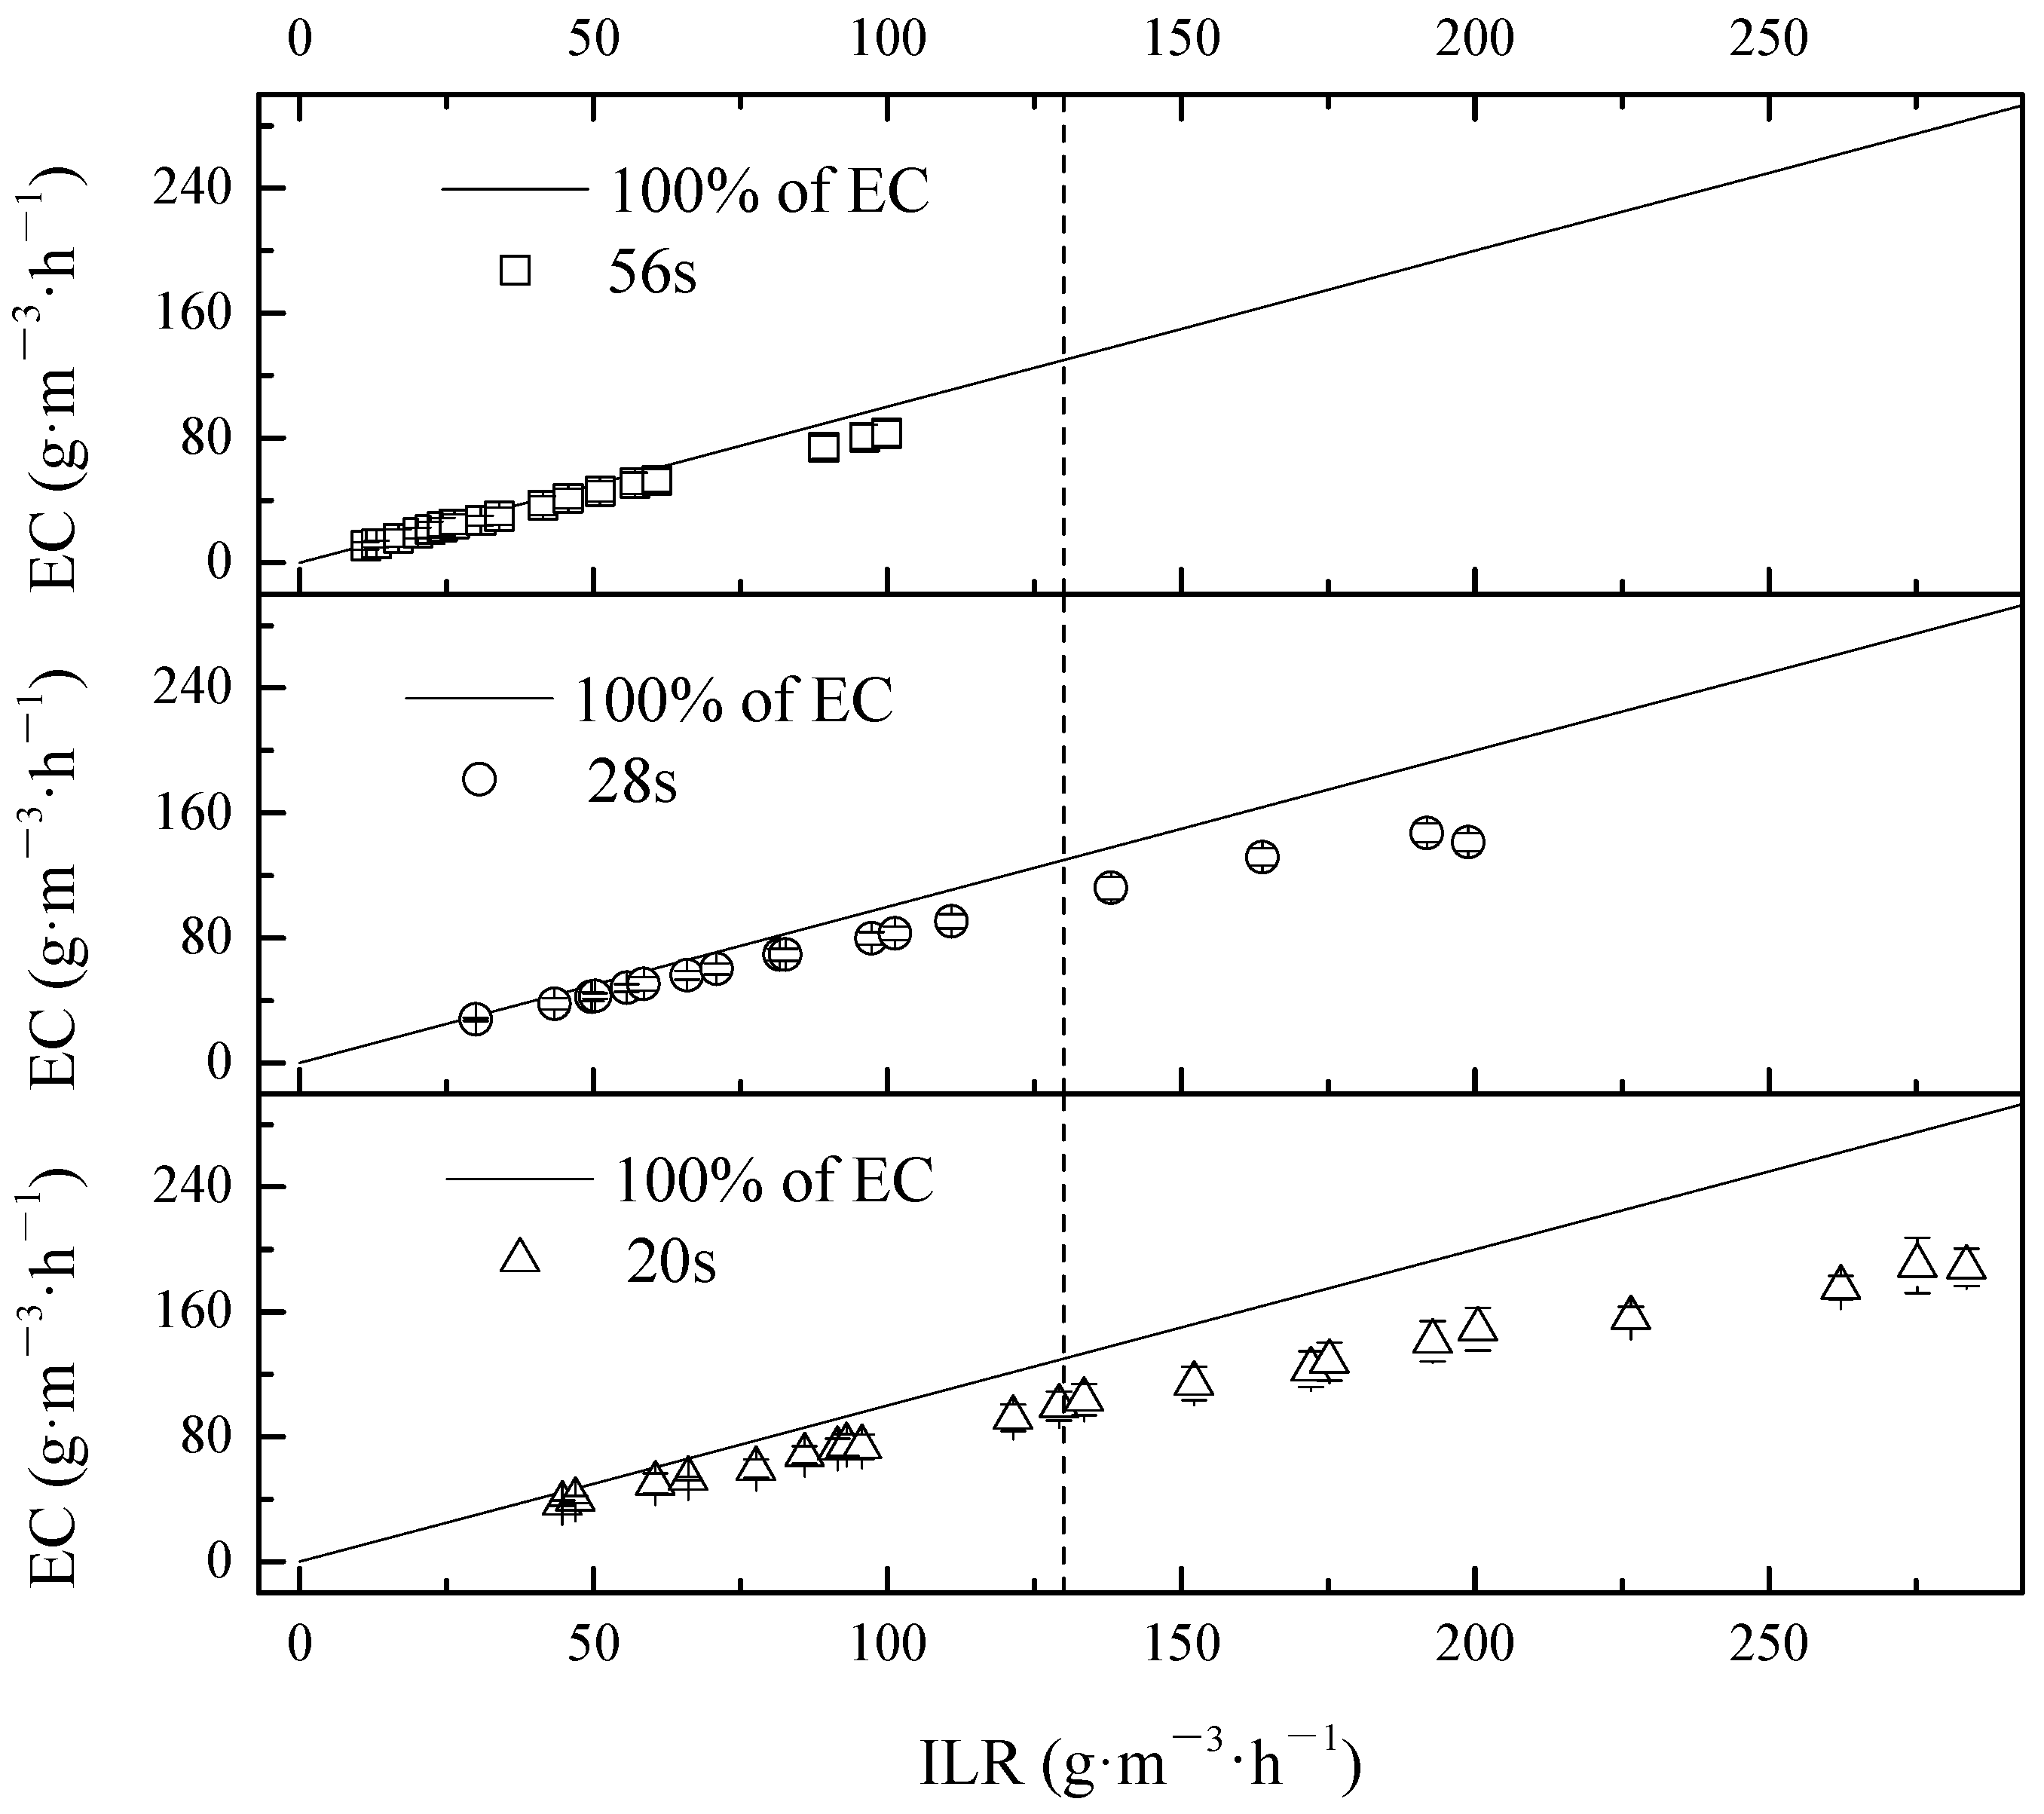
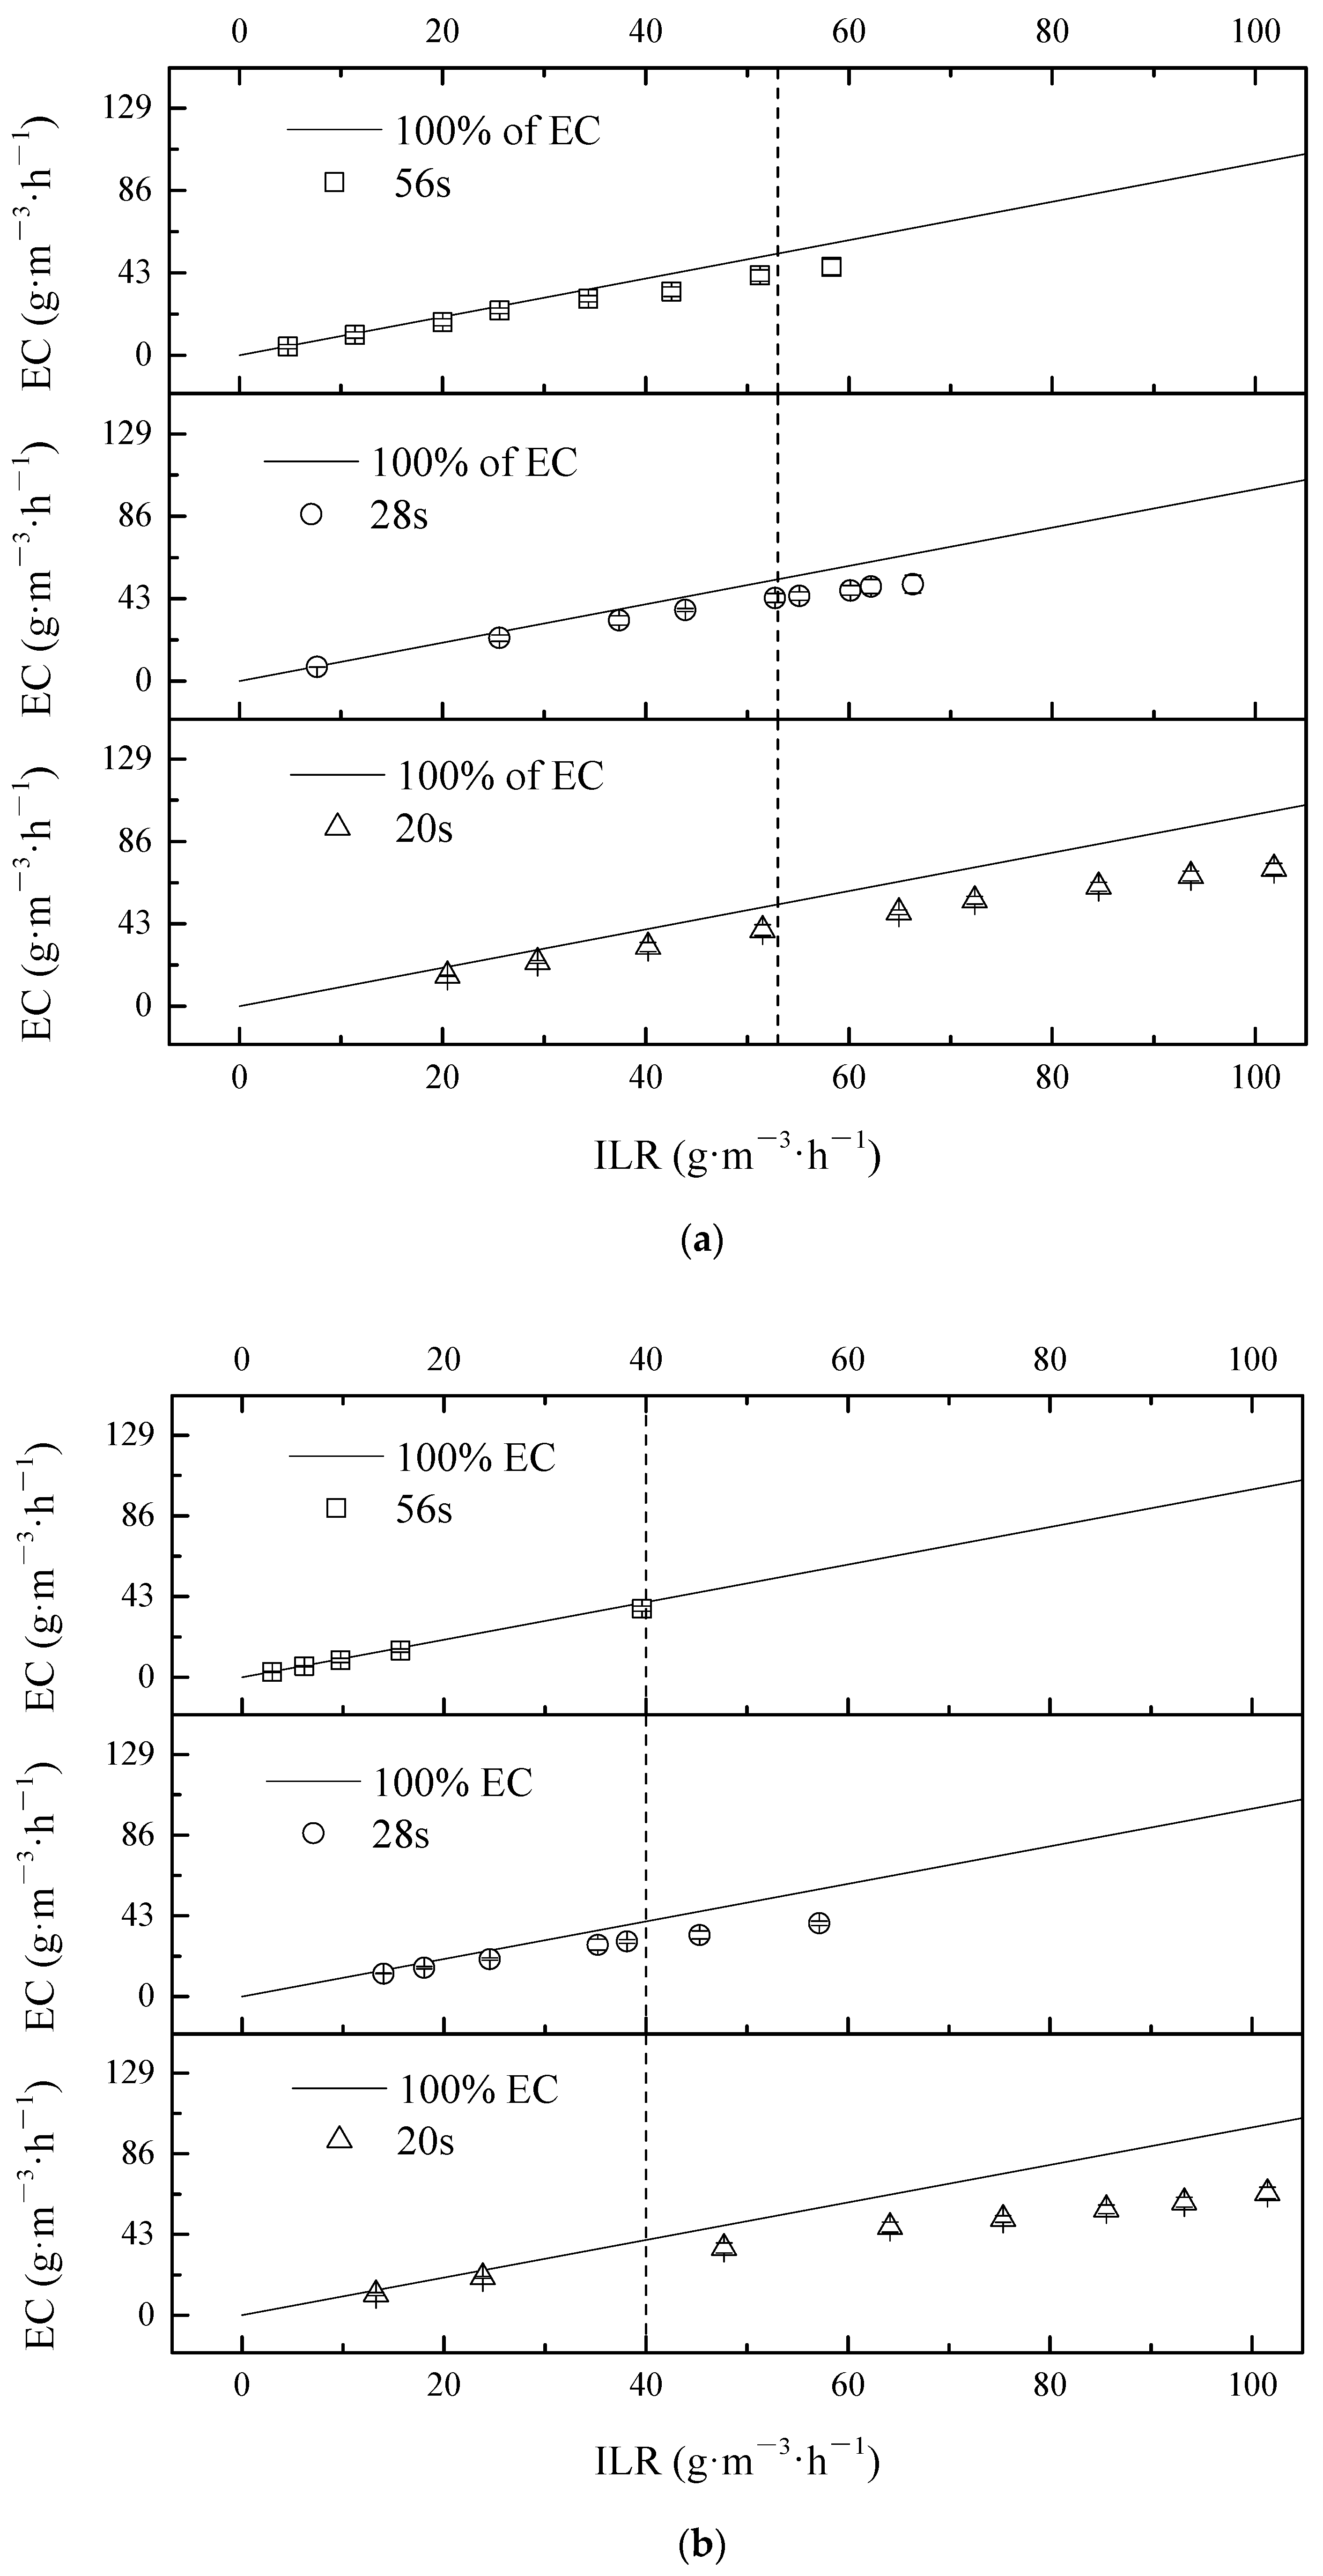
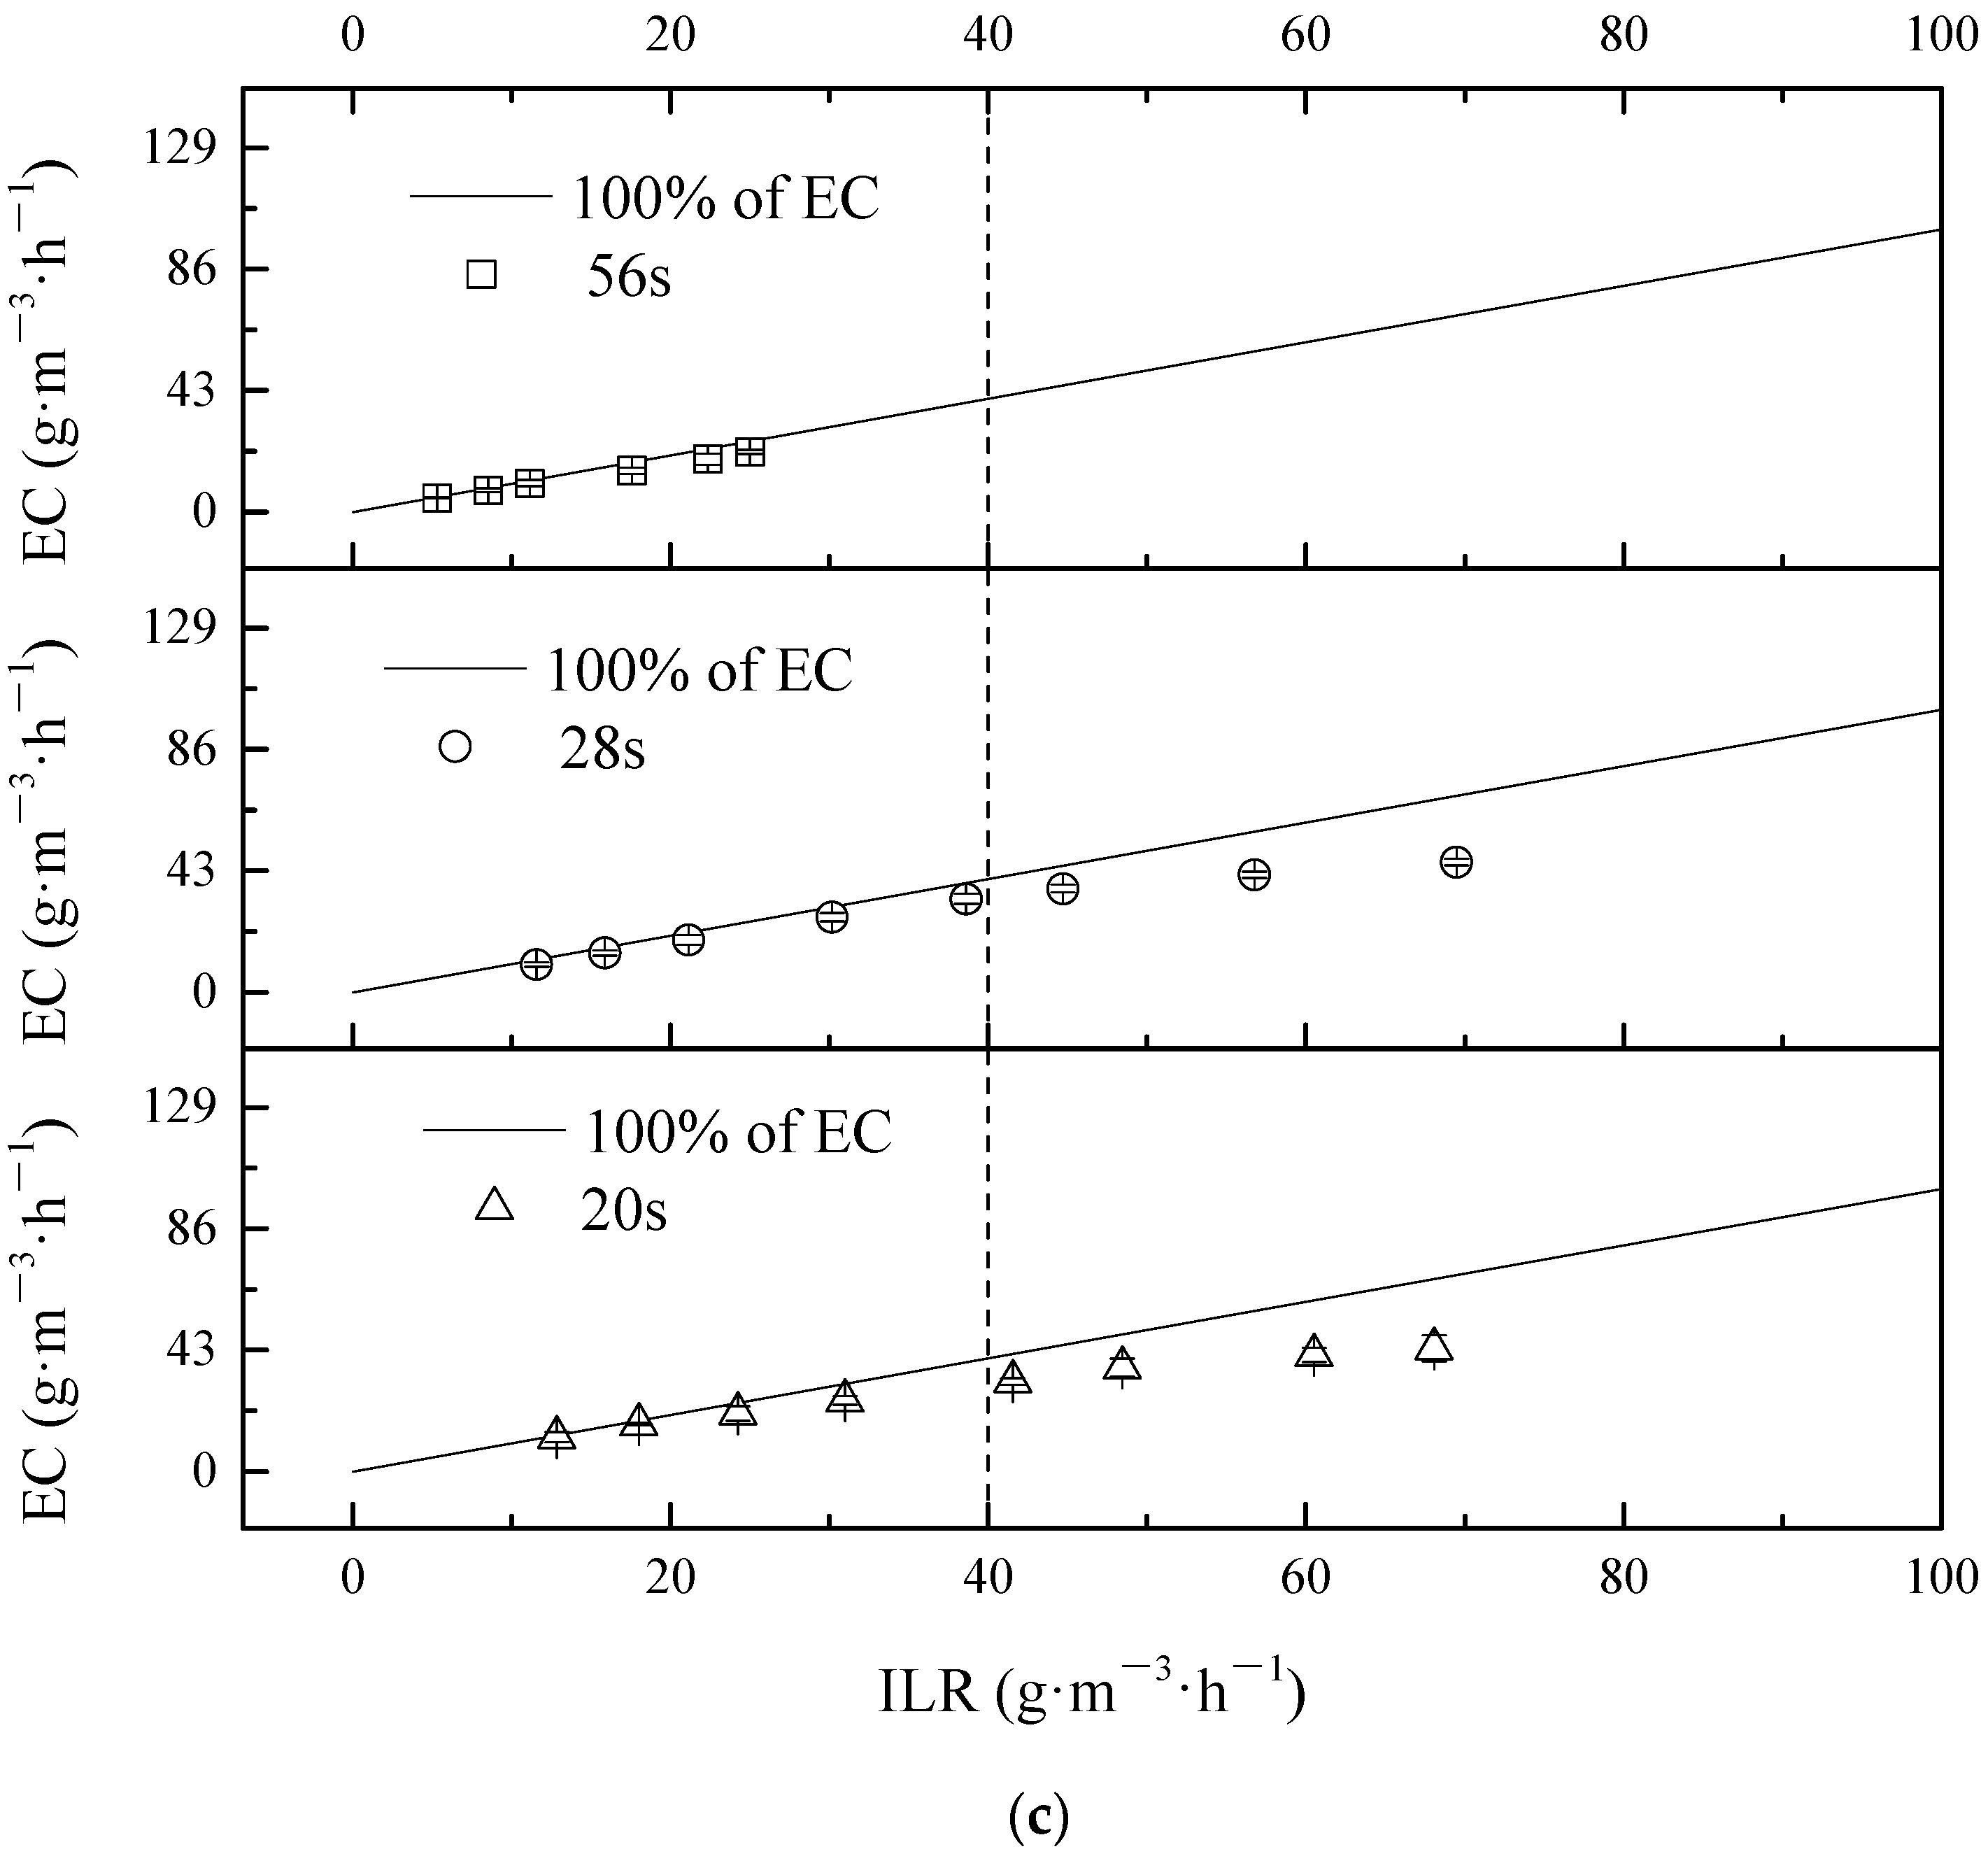
3.1.1. Effect of ILR (Inlet Loading Rate) on the EC of Mixture Treatment

The different EC corresponding to ILR variations for the mixed pollutants treatment is presented in Figure 2. The behavior of BTF in mixture pollutants treatment also can be categorized into two parts according to liner regression: (I) diffusion constraints (DC, up to 130.00 g·m−3·h−1 of ILR according to Figure 2); and (II) reaction constraints (RC, ILRs greater than 130.00 g·m−3·h−1). Diffusion rate and reaction rate both significantly affected the total behavior of BTF during the operation [47,48,49]. In DC, reaction rate in the biofilm was greater than the diffusion rate from the gaseous phase to aqueous phase, and as a result, diffusion rate was the limiting factor, in terms of a lower ILR. Contrarily, with a higher ILR, the diffusion rate was greater than the reaction rate; the resulting reaction rate was to be the control factor. Thus, it could be due to the restriction of reaction rate, data slightly deviated from line of 100% of EC when ILR grew higher.
The variation of EC with different ILR under different EBRTs for DMS, propanethiol, and toluene in mixture treatment by BTF is presented in Figure 3a–c. At high ILR, ECs of DMS did not deviate far from the ideal line of the 100% removal line. The tendency of propanethiol and toluene were similar. As shown in Figure 3a–c, the maximum EC of DMS and propanethiol were observed on maximum ILR under EBRT of 20 s; however, the maximum EC of toluene occurred under EBRT of 28 s. It confirmed that marginal toluene ILR of RC was lower than the other two contaminants.
Figure 2 and Figure 3 show that the total maximum EC of overall contaminants were achieved at 80.70 g·m−3·h−1 (DMS 50.4%, propanethiol 31.3%, toluene 18.2%), 145.91 g·m−3·h−1 (DMS 37%, propanethiol 28.9%, toluene 34.1%) and 189.70 g·m−3·h−1 (DMS 40.0%, propanethiol 36.3%, toluene 24.0%) at different EBRTs of 56 s, 28 s, and 20 s, respectively. Among these pollutants, the value of ILR in terms of certain EC followed the order: DMS > propanethiol > toluene; DMS was thus the most stubborn chemical among these three in treatment.

3.1.2. Effect of ILR on the RE

According to Figure 2, total RE of mixture contaminants was maintained above 83.10%, 74.00%, and 68.90%, corresponding with EBRTs of 56 s, 28 s, and 20 s, respectively.
The variation of RE in mixture was affected not only by ILR, but also by the chemical property of individual contaminant. According to our experiment, the EC of toluene in mixture is enhanced in comparison with the performance as sole treatment in BTF, because of the existing co-metabolism during the mixture contaminant degradation process. Moreover, there are also competitive interactions among different contaminates as Amani has previously indicated [50]. Nevertheless, a competitive effect was not only dependent on the nature of contaminants but also relying on the structure of micro-communities in the environment. Deshusses stated that toluene could be co-treated well with H2S in order to enhance the performance of BTF [51]. On the contrary, Bentley has reported that VOSCs would have a competitive inhibition by other contaminants during the mixture treatment [23], which was also confirmed by Shu during DMS degradation by BTF system [44]. To conclude, RE was affected by ILR, chemical properties of contaminants, and structure of micro-communities.

3.2. Performance of BTF for Single Pollutant Degradation

To compare between degradation of single contaminants and mixtures, each contaminant was tested under different operating parameters (phase I to phase III). The ILR, EC, and RE of DMS are shown in Figure 4a. Due to the sudden increases in ILR on day 82, 86, 90, and 94, there are several RE drops and EC increases suddenly. The flow rate was increased to 0.40 m3·h−1 in order to achieved EBRTs of 28 s in phase II on day 98. ILR was decreased to 13.08 g·m−3·h−1 from 162.89 g·m−3·h−1. The similar RE tendency was observed in terms of ILR was suddenly increased. In phase III (day 123 to day 140), the air stream was adjusted to 0.60 m3·h−1 to achieve EBRT of 20 s. Difference appeared when the RE was not able to recover by time on day 138, an eliminated capacity was saturated. The maximum EC were observed 141.39 g·m−3·h−1 (phase I), 115.20 g·m−3·h−1 (phase II) and 160.54 g·m−3·h−1 (phase III).
The description propanethiol and toluene are shown in Figure 4b,c. Compared with EC and RE of propanethiol, toluene was more sensitive with suddenly enhanced ILR, and the variation gaps of EC and RE were amplified. Figures indicated that the BTF was saturated at the end of phase III (day 248), so that continued increasing ILR was not able to enhance EC. On the contrary, an inhibition effect was not negligible in terms of high inlet concentration. The maximum EC of propanethiol and toluene were observed 106.49 g·m−3·h−1 and 34.69 g·m−3·h−1 (phase I); 88.65 g·m−3·h−1 and 50.19 g·m−3·h−1 (phase II); 113.64 g·m−3·h−1 and 47.17 g·m−3·h−1 (phase III). According to Figure 4, the lowest EC was toluene. There are two main reasons: (1) As mentioned in Section 3.5.2, Betaproteobacteria (35.61%) and Gammaproteobacteria (15.56%) was correlated with DMS and propanehtiol biodegradation. Sphingobacteriia (20.54%) and Alphaproteobacteria (11.9%) was correlated with toluene biodegradation. (2) The BTF was overall operated 248 days, toluene was exposure up to days 77, and then switched to DMS (days 78–140), propanthiole (days 141–200), finally toluene (days 201–248). Thus there is a starving period 123 days for toluene, it also affected toluene biodegradation performance.
As discussed earlier in Section 3.1, DMS and propanethiol actually performed better in the single treatment process, while toluene was preferred in the ternary treatment rather than single treatment. As shown in Figure 3 and Figure 4, the value of ECmax in terms of this study was in order as follows: DMS single > propanethiol single > DMS in mixture > propanethiol in mixture > toluene in mixture > toluene single. This indicated that toluene was the most difficult pollutant to degrade among the three pollutants in either single or mixture system; however, its EC was larger under mixture circumstances revealing that the co-metabolism happened rather than competitive inhibition. Corresponding maximum EC data in previous studies was shown in Table 1.

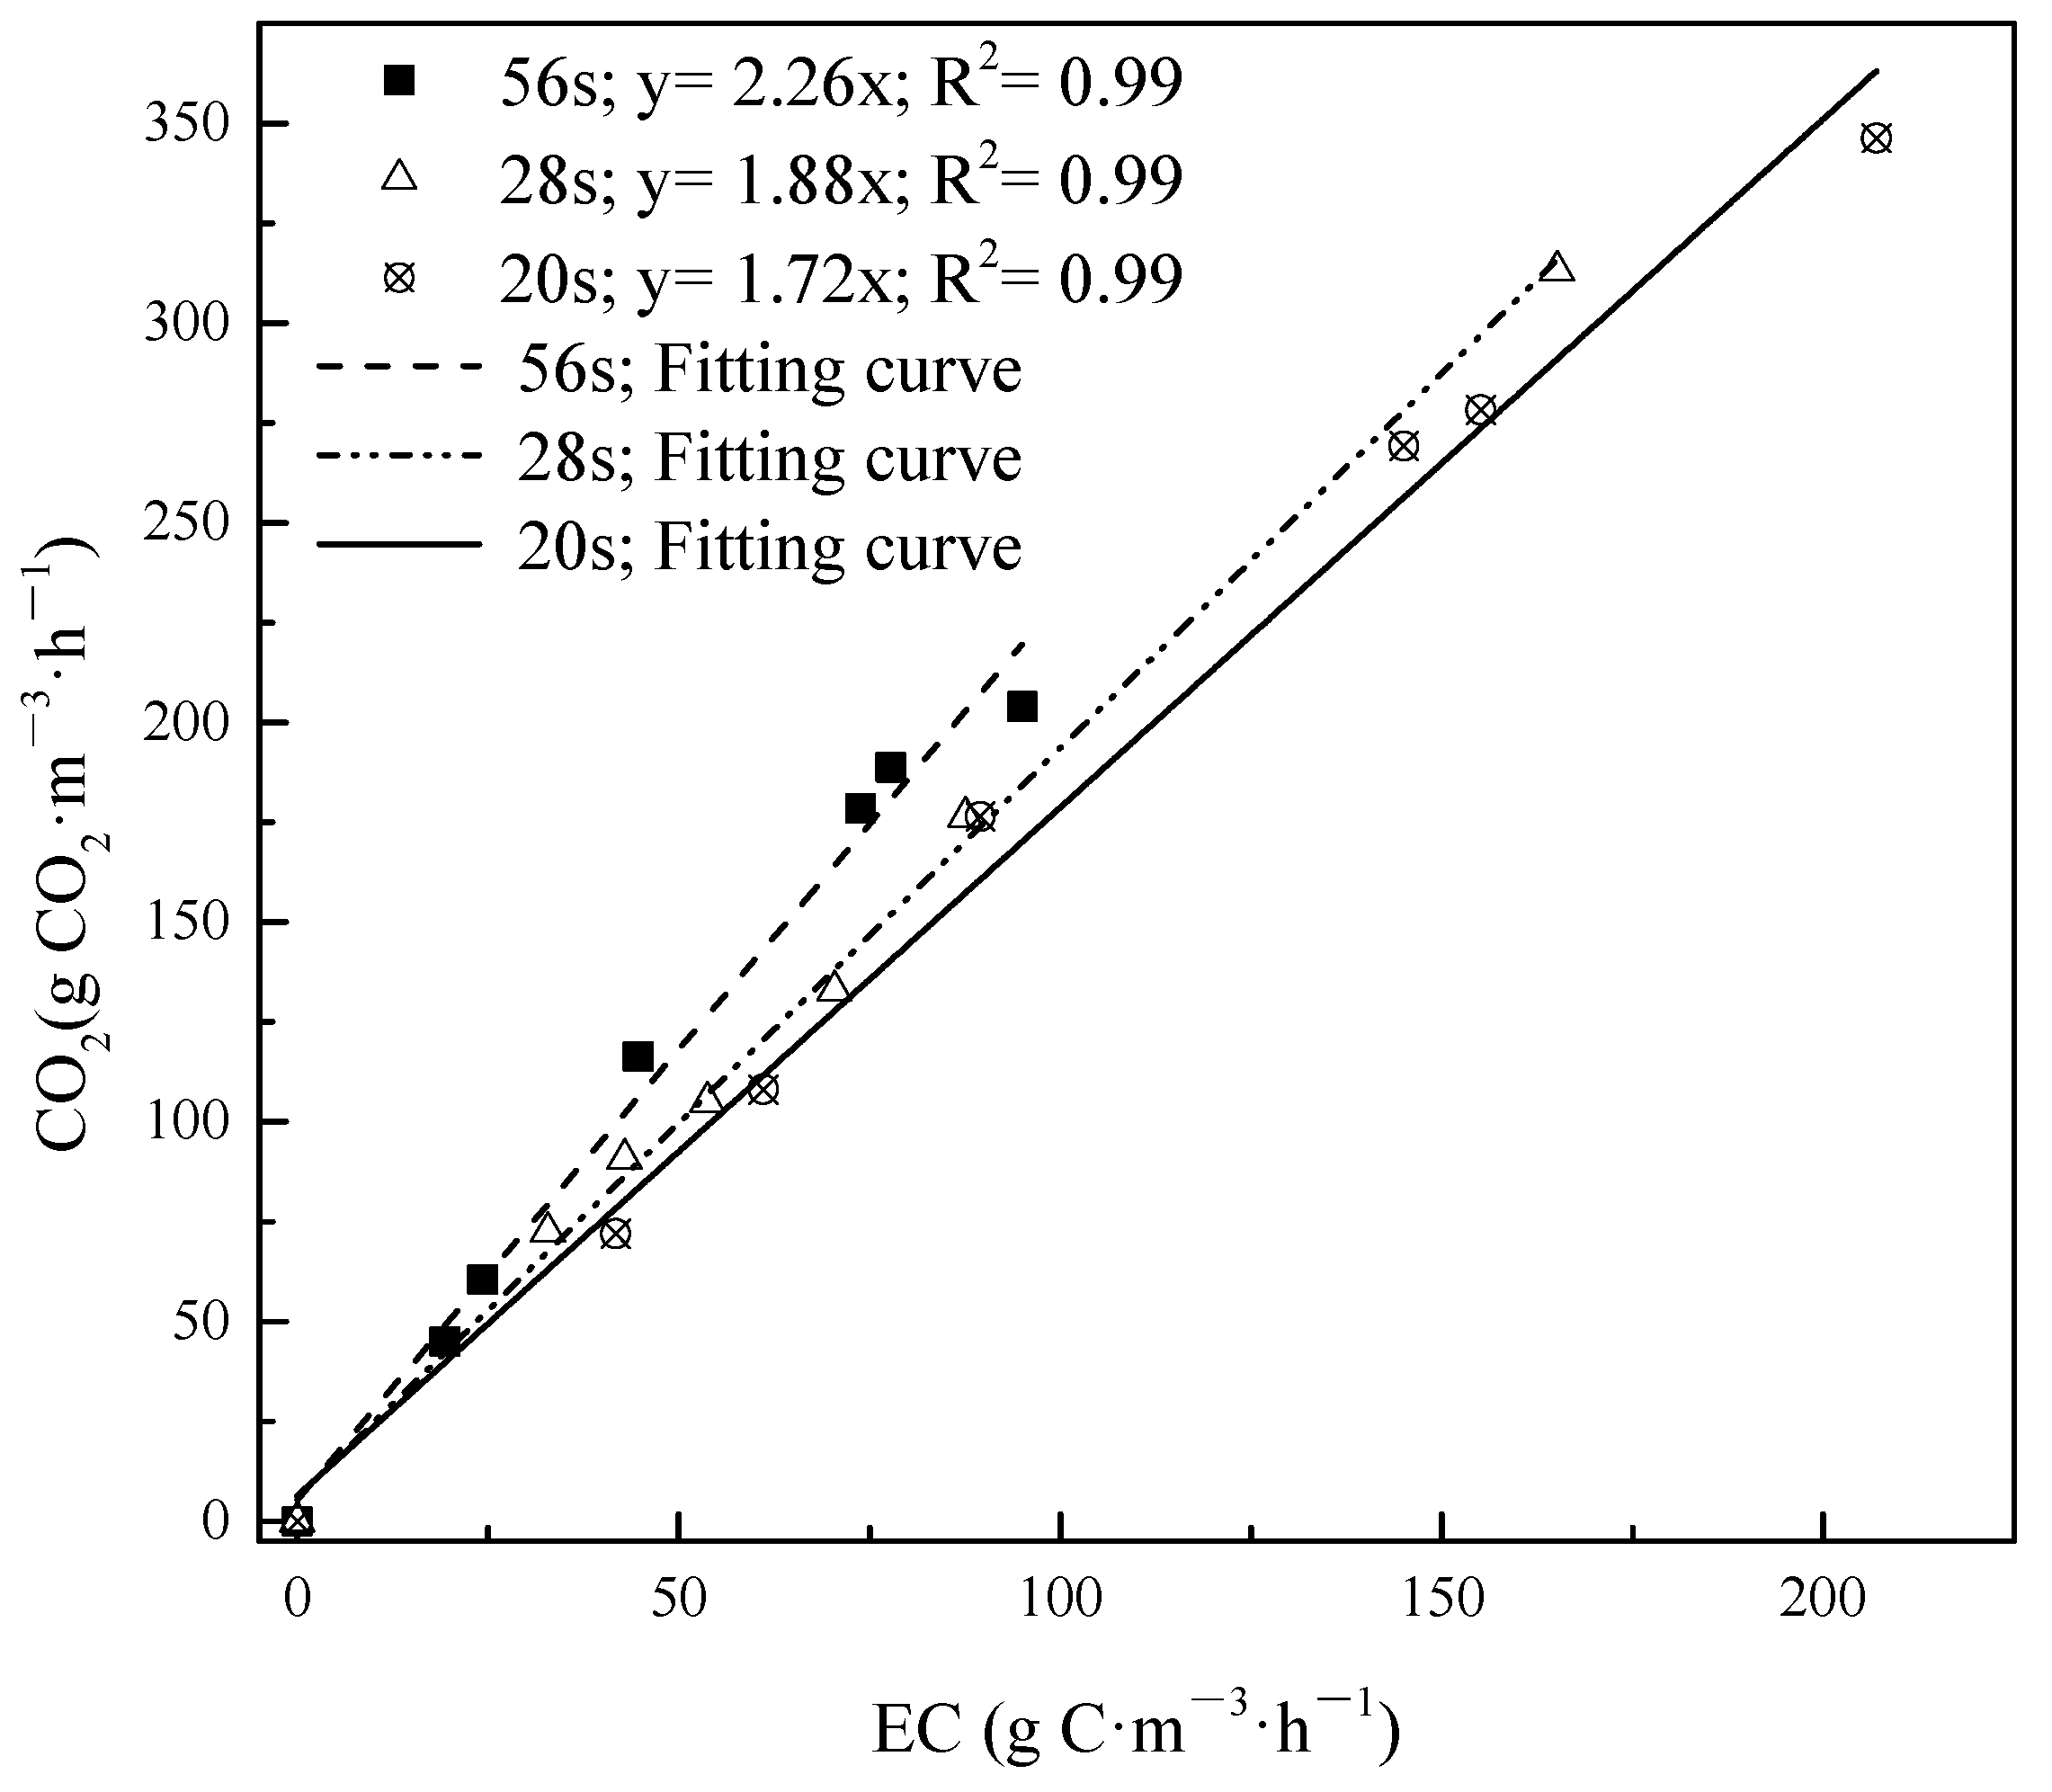
3.3. Carbon Dioxide Production

In the biofiltration process, the organic contaminants are eventually converted to either water and carbon dioxide or biomass. Therefore, the CO2 production (P CO2) is an essential parameter corresponding with mineralization level. The effect of P CO2 on the EC for various EBRTs is presented in Figure 5. The linear fitting of experiment data under different EBRTs during the mixture gas treatment were y = 2.26x (EBRT of 56 s), y = 1.88x (EBRT of 28 s), and y = 1.72x (EBRT of 20 s). In case of the inlet concentration ratio of DMS, propanethiol and toluene were 2:1:1; therefore, the stoichiometric ratios of P CO2 per mass of completely degradation of mixture contaminants were 2.0, 3.0 and 7.0 respectively. Maximum ECs and P CO2 coefficients of different individual pollutants and mixtures were as shown in Table S2, and among them P CO2 of toluene was studied in various research. Compared to the results in the present study, the P CO2 values in this study were relatively high, in terms of difference between three typical contaminants. The high mineralization rate of mixture contaminants revealed these compounds were entirely converted to water and CO2. The discrepancy between experimental data and stoichiometric values were sensible to explain as an accumulation of biomass in BTFs and partial CO2 was dissolved in the MSM as formed H2CO3, HCO32−, or CO32−, in terms of the degradation process taking place in the aqueous phase.

3.4. Biodegradation Kinetics for Single and Ternary Mixture Gas

The rmax and Ks under different EBRTs for DMS, propanethiol and toluene either in a single or in a mixture gas supply were calculated via Equation (5). As shown in Figure 6a,b, the variation of rmax value and Ks corresponded with EBRTs in single and mixture treatment during three phases. For single treatment, rmax of DMS, propanethiol and toluene were initially enhanced since EBRT decreased from 56 s to 28 s, and declined with continued decrease of EBRT from 28 s to 20 s. Ks of DMS and toluene followed the rmax tendency. However, Ks of propanethiol decreased straight if EBRT dropped. The Ks value indicated that during the single contaminant condition, propanethiol > DMS > toluene. However, during mixture conditions the comparison was complex, under EBRT 56 s, propanethiol > DMS > toluene, under EBRT 28 s DMS > toluene > propanethiol, under EBRT 20 s propanethiol > toluene > DMS. The solubility of contaminants was propanethiol > DMS > toluene. This confirmed that in a single condition, the solubility would positively relate to Ks [52]. But in mixture conditions, the Ks value was not only related with solubility but also related with other facts such as reaction effect, and the intermediates would also influence the results.
In previous studies, Shu calculated that a rmax of 115.7 g·m−3·h−1 and Ks of 1.56 g·m−3 during single DMS biofiltration treatment [53], and Menard reported a rmax of 39.4 g·m−3·h−1 and Ks of 4.6 g·m−3 for toluene degradation [48]. As shown in Table 1, our rmax data of DMS (single) and toluene (single) were all apparently higher than previous studies, while rmax data of DMS mixture and toluene (mixture) were a bit lower than previous studies. rmax value. the maximum amount of DMS degrade per unit of bio-filter volume, estimated from the Michaelis–Menten model was higher than that from the Haldane model (0.63 gs·gx−1·h−1), which is consistent with those reported by a previous study [41]. This result also confirmed by other odor gas degradation through BTF system fitting by the Michaelis–Menten model [50].
The value of rmax and Ks are shown in Table 1. Compared with single treatment of DMS, either rmax or Ks decreased in the mixture treatment of DMS, in terms of the additional carbon resource not only available for microbial communities, it also leads to a reaction effect between different contaminants, resulting in reaction constraints; however, the value of toluene was increased. rmax and Ks of DMS and toluene were both initially enhanced from phase I to phase II, and then declined from phase II to phase III. It is possible that the benefit of the intermediates was to enhance the solubility of toluene. These results of rmax and Ks are comparable within previous studies of rmax of 24.18 g·m−3·h−1 and 31.10 g·m−3·h−1, and Ks of 0.62 g·m−3 and0.57 g·m−3 for DMS and toluene, respectively [45,54,55].
In general, a sensible inferring of physical identity for Ks is homoplastically to kinetics of enzyme, hence the lower Ks value and the higher enzymatic affinity for contaminants [56]. This explained treatment performance of toluene was better in mixture treatment rather than single treatment. A possible co-metabolism with toluene was the main mechanism during DC area, in terms of its solubility increasing, resulting in the rmax enhancement during this stage and Ks decreased under EBRTs 20 s. Co-metabolism/enzymatic affinity is a possible reason why the EC for toluene was enhanced when it was introduced along with the other sulfur-containing compounds. As inlet concentration of mixture gas was continuously increasing and the EBRT was decreasing, co-metabolism plus an occurrence of a reaction effect were both intensified; however, co-metabolism would not compensate the performance loss due to the reaction effect [8,57]. Thus, rmax and Ks both declined.

3.5. Analysis of Microbial Communities

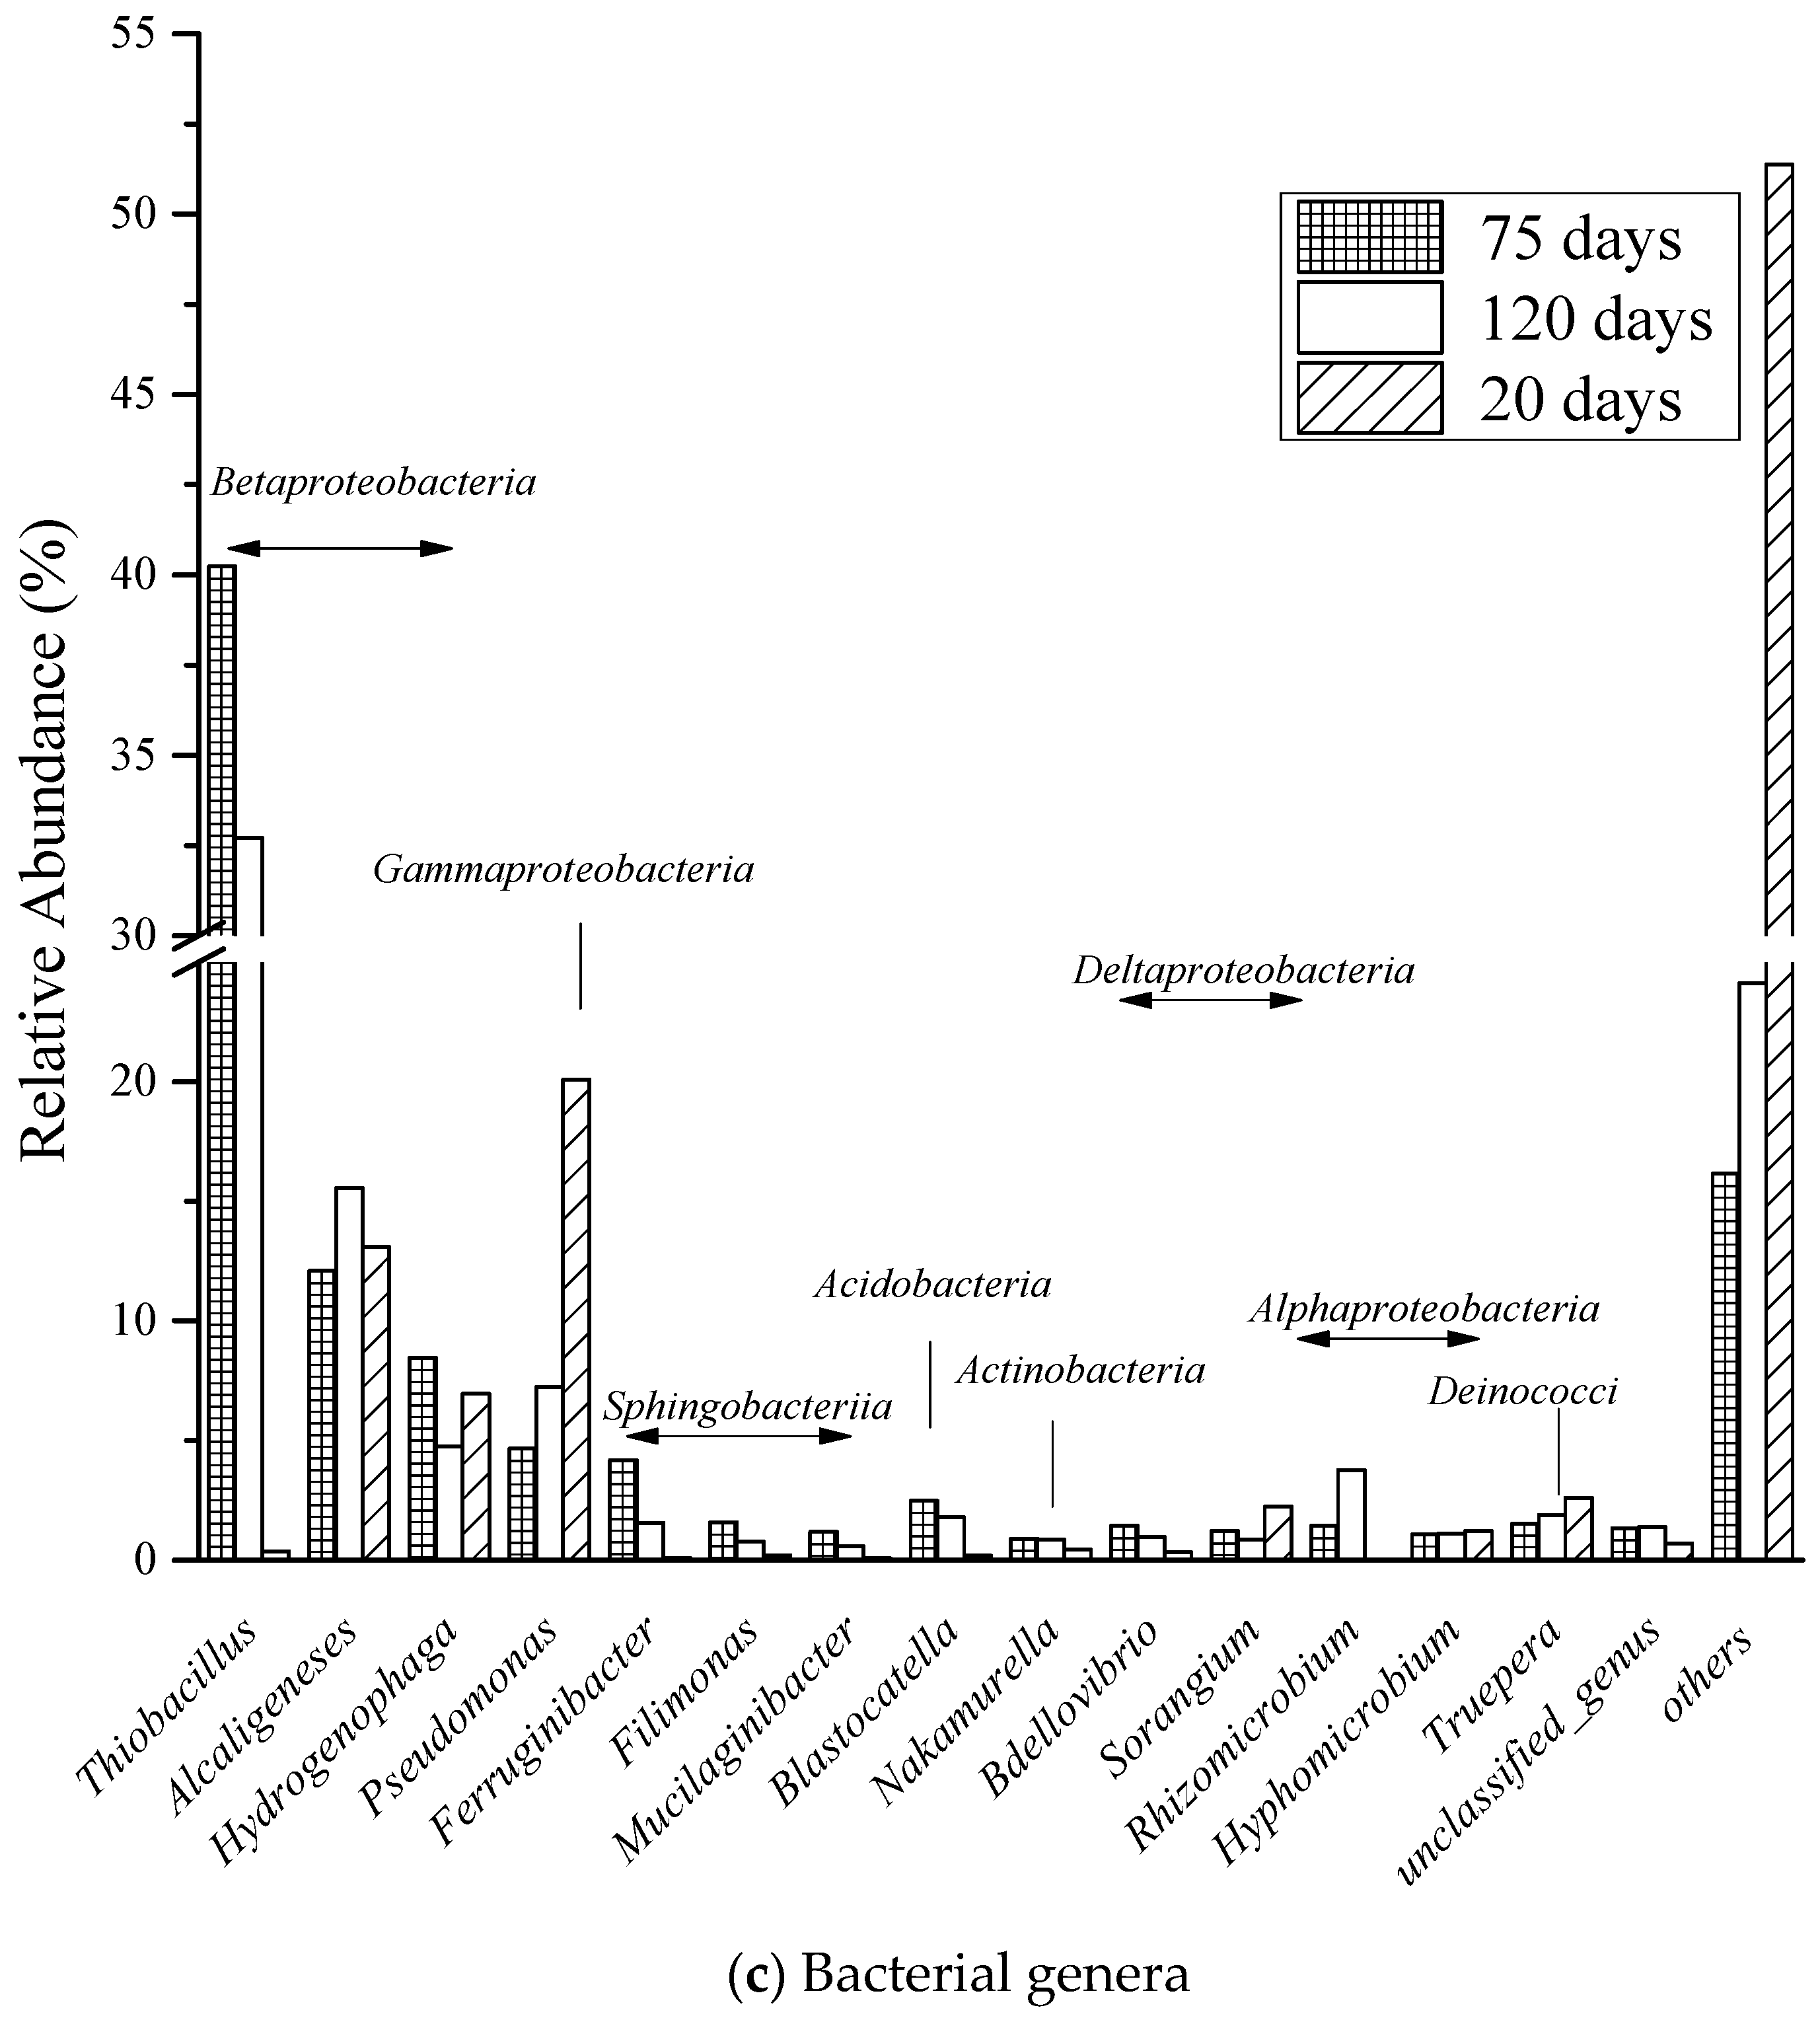
3.5.1. Bacterial Community Diversity and Composition

Three samples from the BTF system of 20 days, 75 days, and 120 days were analyzed by Illumina high-throughput sequencing, with every length 430 bp and at least 49,515 sequences obtained for each sample. The objective for this comparison was to understand how residence time and the other simulated conditions, such as concentration, components will affect the microbial colonies. The number of OTUs and α-diversity of these samples were shown in Table S3. Previously, Ma indicated that larger Shannon index values and smaller Simpson index values were both representative of the higher α-diversity [58]. Wang found that bacterial structure became simpler after contaminants degradation [59], which could lead to lower α-diversity and OUT number with time passing by the similar trend being observed: the biofilm sampled at 120 days contained the lowest α-diversity (Shannon index 4.08), while the initial biofilm had the highest α-diversity (Shannon index 5.03) and richness (OTU number 2599). After, microbial diversity had been changed. A large number of secondary intermediate products have been produced in the process of microbial degradation of DMS, propyl mercaptan, and toluene [38,41]. A large number of intermediate products generated from the degradation process made the microbial population keep in dynamic equilibrium.

3.5.2. Microbial Community Structures at the Phylum Level

In the present study, the microbial analysis was focus on bacteria, and over 99.99% of obtained sequences were assigned bacteria. On average, 3.05% of the sequences were not classified at the phylum level. As shown in Figure 7a, the seven major phyla were Proteobacteria (66.42% on average), Bacteroidetes (21.76%), Gemmatimonadetes (2.00%), Acidobacteria (1.89%), Deinococcus-Thermus (1.87%), Firmicutes (1.38%), and Candidate (0.69%). The most abundant phylum was Proteobacteria, which ranged from 63.01% to 68.28% in the samples. Among the Proteobacteria as shown in Figure 7b, Betaproteobacteria ranked first with an average percentage of 35.61%, followed by Sphingobacteriia (20.54%), Gammaproteobacteria (15.56%) and Alphaproteobacteria (11.91%). The high percentage of Betaproteobacteria and Grammaproteobaceria was as a result of anthropogenic inoculation of Alcaligenes sp. SY1 and Pseudomonas.putia S1, which was belonged to these classes [23]. Sphingobacteriia and Alphaproteobacteria were also reported as main class to degrade toluene in bioreactor [60,61]. Thus, these bacteria play key role during VOCs and VOC treatment [62]. As shown in Figure 7b, during the first 20 days operation period, Gammaproteobacteria (28.75%) Sphingobacteriia (21.57%), Alphaproteobacteria (17.63%), Betaproteobacteria (13.84%) were the most abundant bacterial class. However, Betaproteobacteria would dramatically increase to 42.25%, with the decrease percentage of Gammaproteobacteria and Alphaproteobacteria to 10.80% and 11.78% for the next 55 days of operation period. At this period, the Sphingobacteriia class was slightly declined to 2.00%. In the last 45 days of operation, Betaproteobacteria still kept the increased tendency to 50.74%, while Gammaproteobacteria and Alphaproteobacteria continued declined slightly to 7.12% and 6.32%. Sphingobacteriia was increased by 1.50% during this period.
In Figure 7c, Thiobacillus, Pseudomonas, and Alcaligenes were the most abundant genera in this BTF. Thiobacillus was dramatically increased from 0.37% (20 days) to 40.24% (75 days) and then slightly declined to 32.72% (120 days). which correlated with toluene in the mixture of VOCs aeration to BTF from day 1 to days 77, then to DMS aeration from days 78 to days 140. Pseudomonas was declined from 20.08% (20 days) to 4.67% (75 days) and then recovered to 7.25% (120 days). The drop of Pseudomonas is due to Alcaligenes inoculation from day 1 to days 20 in startup period, and Thiobacillus fast growth from day 1 to day 77 and recovered on day 120 was correlated with DMS aeration. Alcaligenes was the most stable genera during three periods, the percentage of Alcaligenes was kept from 13.08% (20 days) to 12.09% (75 days) and then reached to 15.55% (120 days), which was under inoculation Alcaligenes at startup period and DMS single aeration from days 78 to days 140 are reasonable.
The predominant of Gammaproteobacteria during all three periods explained the maximum EC of DMS is relatively higher than the other two contaminants in bottom and middle layer, and also confirmed that Alcaligenes sp. SY1 is a promising strain during co-treatment of DMS removal. Sphingobacteriia remained constant from the beginning to the end of treatment; consequently, the toluene performance of EC and RE were keep stable in either single or ternary treatment of contaminants in upper layer. The initial deterioration of Gammaproteobacteria could be explained the inoculated Pseudomonas putida. S1 was affected either by inhibition in the higher inlet load of contaminants or competition effect by other microbial communities. However, the propanethiol performance of EC and RE was not significantly influenced by deterioration due to the ILR was mostly under DC area. The significant enhancement of Betaproteobacteria was mainly because of the growth of Thiobacillus, which was reported to apply in VOSCs degradation and toluene degradation [63,64].

3.5.3. Microscopic Observations

FESEM was used to observe the biofilm formation and mature as time went by. And The sample for FESEM observation was obtained from the bottom of the first packing layer. As shown in Figure S2a, after 20 days of inoculation, normal density cells number could be observed on the surface of packing material, and between bacterial unit mycelial structures, non-colonized regions on the surface could also be observed. In Figure S2b, high cell growth was observed after 77 days operation, and more than one layer of biofilm adhered on packing material. Globular bacterium and rod-shaped bacterium were predominant in the field. In Figure S2c, the bacterial colonies showed that several layers keep adhesion together with a mycelial structure, could not even distinguish the boundary of a single bacteria unit. The presence of an intensive number of microbial communities was also observed in terms of high density of cell growth. This phenomenon was also observed in toluene and VOCs removal in the BTF system [60,65].

4. Conclusions

BTF with Alcaligenes sp. SY1 was shown to effectively degrade DMS, propanethiol and, toluene with stable performance. The maximum removal rate (rmax) for single DMS, propanethiol, and toluene was calculated as 256.41 g·m−3·h−1, 204.08 g·m−3·h−1, and 90.91 g·m−3·h−1, respectively. When they were mixed with the other two, VOC or VOSC, the rmax increased for toluene, but decreased for DMS and propanethiol. Proteobacteria and Bacteroidetes were the major bacterial groups in BTF packing materials, which confirmed that the inoculation did succeed during the BTF process. Therefore, Alcaligenes sp. SY1 and Pseudomonas putida S1 has significant potential for treating DMS, propanethiol, and toluene either individually or collectively.

Supplementary Materials

The following are available online at https://www.mdpi.com/article/10.3390/fermentation7040309/s1, Figure S1: The schematic of the multi-layer BTF. (1) Air pump, (2,3) rotor meter, (4) sample flask, (5) mixture flask, (6) air inlet, (7) sampling port, (8) Nutrition flask, (9) packing port, (10) spray header, (11) air outlet, (12) packing material, (13) packing material sampling port, (14) air sampling port, (15) pH detector, (16) Auto-pH adjustor, (17) control panel, (18) NaOH solution flask, Figure S2: FESEM microphotographs of the packing material (a); sample of the biofilter on day 20 during startup period (b) sample on day 77 during operational period (c) sample on day 240 during end period, Table S1: Operation condition of BTF treatment, Table S2: Comparison CO2 production of recent results of removal of single or mixed pollutants with present study, Table S3: α-Diversity of each sample.

Author Contributions

Y.S. (Yiming Sun), conducted the experiments and wrote the manuscript; X.L., analyzed the results and revised the manuscript; H.L. and S.Z., discussed the results; J.C., designed the experiment and discussed the results; Y.H. and L.Q., participated in the discussion of the manuscript; Y.S. (Yao Shi), designed the experiment and discussed the results. All authors have read and agreed to the published version of the manuscript.

Funding

This research was funded by the National Key Research and Development Program of China (grant number 2018YFC0213806), and the National Natural Science Foundation of China (grant number 51308502, 21676245 and 51750110495) for financial support. The work was also sponsored by Key Research and Development Program of HeBei Province (grant number 19273904D), and Postdoctoral Program of China Aerospace KaiTian Environmental Technology (grant number YQB-2017-001). And The APC was funded by Key Research and Development Program of China Aerospace KaiTian Environmental Technology (grant number YQB-2021-001).

Institutional Review Board Statement

The study was conducted according to the guidelines of the Ethics Committee of Lincoln University for sensory analysis (Application No: 2020-35, Approved on 14 August 2020).

Informed Consent Statement

Informed consent was obtained from all subjects involved in the study.

Acknowledgments

The authors would like to thank the National Key Research and Development Program of China (grant number 2018YFC0213806), and the National Natural Science Foundation of China (grant number 51308502, 21676245 and 51750110495) for financial support. The work was also sponsored by Key Research and Development Program of HeBei Province (grant number 19273904D), and Postdoctoral Program of China Aerospace Kaitian Environmental Technology (grant number YQB-2017-001). And the APC was funded by Key Research and Development Program of China Aerospace KaiTian Environmental Technology (grant number YQB-2021-001).

Conflicts of Interest

The authors declare no conflict of interest.

References

  1. Giri, B.S.; Mudliar, S.N.; Deshmukh, S.C.; Banerjee, S.; Pandey, R.A. Treatment of Waste Gas Containing Low Concentration of Dimethyl Sulphide (DMS) in a Bench-Scale Biofilter. Bioresour. Technol. 2010, 101, 2185–2190. [Google Scholar] [CrossRef]
  2. Fortuny, M.; Gamisans, X.; Deshusses, M.A.; Lafuente, J.; Casas, C.; Gabriel, D. Operational Aspects of the Desulfurization Process of Energy Gases Mimics in Biotrickling Filters. Water Res. 2011, 45, 5665–5674. [Google Scholar] [CrossRef]
  3. Rappert, S.; Muller, R. Microbial Degradation of Selected Odorous Substances. Waste Manag. 2005, 25, 940–954. [Google Scholar] [CrossRef]
  4. Karine, K.; Magali, P.; Dimitry, Y.S.; Jelmer, D.; Johannes, B.M.; Pawel, R. Effect of Dimethyl Disulfide on the Sulfur Formation and Microbial Community Composition during the Biological H2S Removal from Sour Gas Streams. J. Hazard. Mater. 2020, 385, 121916. [Google Scholar]
  5. Bruneel, J.; Walgraeve, C.; Dumortier, S.; Stockman, J.; Demeyer, P.; Van Langenhove, H. Increasing Mass Transfer of Volatile Organic Compounds in Air Scrubbers: A Fundamental Study for Different Gas–liquid systems. J. Chem. Technol. Biotechnol. 2017, 93, 1468–1476. [Google Scholar] [CrossRef]
  6. Dobslaw, D.; Schulz, A.; Helbich, S.; Dobslaw, C.; Engesser, K.H. Voc Removal and Odor Abatement by a Low-Cost Plasma Enhanced Biotrickling Filter Process. J. Environ. Chem. Eng. 2017, 5, 5501–5511. [Google Scholar] [CrossRef]
  7. Dobslaw, D.; Ortlinghaus, O. Biological Waste Air and Waste Gas Treatment: Overview, Challenges, Operational Efficiency, and Current Trends. Sustainability 2020, 12, 8577. [Google Scholar] [CrossRef]
  8. Chan, W.C.; Lai, T.Y. Interaction of Compounds on Biodegradation of Ketone Mixtures in a Biofilter. J. Chem. Technol. Biotechnol. 2011, 85, 416–422. [Google Scholar] [CrossRef]
  9. Zhu, G.Y.; Liu, J.X. Investigation of Factors on a Fungal Biofilter to Treat Waste Gas with Ethyl Mercaptan. J. Environ. Sci. 2004, 16, 898–900. [Google Scholar]
  10. Hernandez, J.; Lafuente, J.; Prado, Q.J.; Gabriel, D. Simultaneous Removal of H2S, NH3, and Ethyl Mercaptan in Biotrickling Filters Packed with Poplar Wood and Polyurethane Foam: Impact of pH During Startup and Crossed Effects Evaluation. Water Air Soil Pollut. 2012, 223, 3485–3497. [Google Scholar] [CrossRef]
  11. Liu, J.; Liu, J.; Li, L. Performance of Two Biofilters with Neutral and Low pH Treating Off-Gases. J. Environ. Sci. 2008, 20, 1409–1414. [Google Scholar] [CrossRef]
  12. Leszek, T.; Anna, C.K.; Agata, D.; Czestawa, S.; Jolanta, S.; Grazyna, C. Efficacy of a Novel Biofilter in Hatchery Sanitation: II. Removal of Odorogenous Pollutants. Ann. Agric. Environ. Med. 2007, 14, 151–157. [Google Scholar]
  13. García-Peña, E.I.; Hernández, S.; Favela-Torres, E.; Auria, R.; Revah, S. Toluene Biofiltration by the Fungus Scedosporium apiospermum TB1. Biotechnol. Bioeng. 2001, 76, 61–69. [Google Scholar] [CrossRef] [PubMed]
  14. Pol, A.; Op den Camp, H.M.; Mees, S.M.; Kersten, M.S.H.; van der Drift, C. Isolation of a Dimethylsulfide-Utilizing Hyphomicrobium Species and Its Application in Biofiltration of Polluted Air. Biodegradation 1994, 5, 105–112. [Google Scholar] [CrossRef] [PubMed]
  15. Tresse, O.; Lorrain, M.J.; Rho, D. Population Dynamics of Free-Floating and Attached Bacteria in a Styrene-Degrading Biotrickling Filter Analyzed by Denaturing Gradient Gel Electrophoresis. Appl. Microbiol. Biotechnol. 2002, 59, 585–590. [Google Scholar]
  16. Park, B.G.; Shin, W.S.; Chung, J.S. Simultaneous Biofiltration of H2S, NH3 and Toluene Using an Inorganic/Polymeric Composite Carrier. Environ. Eng. Res. 2008, 13, 19–27. [Google Scholar] [CrossRef]
  17. Amarsanaa, A.; Shin, W.S.; Choi, A.; Choi, S.J. Biofiltration of Gaseous Toluene Using Adsorbent Containing Polyurethane from Media. Environ. Eng. Res. 2006, 11, 1–13. [Google Scholar] [CrossRef]
  18. Kim, J.H.; Rene, E.R.; Park, S.H.; Park, H.S. Effect of Inlet Loading Rate on the Elimination of Hydrogen Sulfide and Ammonia in Immobilized Cell Biofilters. Environ. Eng. Res. 2006, 11, 285–291. [Google Scholar] [CrossRef]
  19. Zhang, L.L.; Leng, S.Q.; Zhu, R.Y.; Chen, J.M. Degradation of Chlorobenzene by Strain Ralstonia Pickettii L2 Isolated from a Biotrickling Filter Treating a Chlorobenzene-Contaminated Gas Stream. Appl. Microbiol. Biotechnol. 2011, 91, 407. [Google Scholar] [CrossRef]
  20. Dobslaw, D.; Engesser, K.H. Biodegradation of Gaseous Emissions of 2-Chlorotoluene by Strains of Rhodococcus sp. in Polyurethane Foam Packed Biotrickling Filters. Sci. Total Environ. 2018, 639, 1491–1500. [Google Scholar] [CrossRef] [PubMed]
  21. Aguirre, A.; Bernal, P.; Maureira, D.; Ramos, N.; Vásquez, J.; Urrutia, H. Biofiltration of Trimethylamine in Biotrickling Filter Inoculated with Aminobacter Aminovorans. Electron. J. Biotechnol. 2018, 33, 63–67. [Google Scholar] [CrossRef]
  22. Sercu, B.; Núñez, D.; Van Langenhove, H.; Aroca, G.; Verstraete, W. Operational and Microbiological Aspects of a Bioaugmented Two-Stage Biotrickling Filter Removing Hydrogen Sulfide and Dimethyl Sulfide. Biotechnol. Bioeng. 2005, 90, 259–269. [Google Scholar] [CrossRef]
  23. Bentley, R.; Chasteen, T.G. Environmental VOSCs—Formation and Degradation of Dimethyl Sulfide, Methanethiol and Related Materials. Chemosphere 2004, 55, 291–317. [Google Scholar] [CrossRef]
  24. Wan, S.; Li, G.; An, T.; Guo, B.; Sun, L.; Lei, Z. Biodegradation of Ethanethiol in Aqueous Medium by a New Lysinibacillus Sphaericus Strain Rg-1 Isolated from Activated Sludge. Biodegradation 2010, 21, 1057–1066. [Google Scholar] [CrossRef] [PubMed]
  25. Tu, X.; Xu, M.; Li, J.; Li, E.; Feng, R.; Zhao, G. Enhancement of Using Combined Packing Materials on the Removal of Mixed Sulfur Compounds in a Biotrickling Filter and Analysis of Microbial Communities. BMC Biotechnol. 2019, 19, 52. [Google Scholar] [CrossRef]
  26. Chen, D.Z.; Sun, Y.M.; Han, L.; Chen, J.; Ye, J.; Chen, J. A Newly Isolated Pseudomonas putida S-1 Strain for Batch-Mode-Propanethiol Degradation and Continuous Treatment of Propanethiol-Containing Waste Gas. J. Hazard. Mater. 2016, 302, 232–240. [Google Scholar] [CrossRef]
  27. Arellano-García, L.; Revah, S.; Ramírez, M.; Gómez, J.M.; Cantero, D. Dimethyl Sulphide Degradation Using Immobilized Thiobacillus Thioparus in a Biotrickling Filter. Environ. Technol. 2009, 30, 1273–1279. [Google Scholar] [CrossRef] [PubMed]
  28. Arellano-García, L.; González-Sánchez, A.; Langenhove, H.V.; Kumar, A.; Revah, S. Removal of Odorant Dimethyl Disulfide under Alkaline and Neutral Conditions in Biotrickling Filters. Water Sci. Technol. 2012, 66, 1641–1646. [Google Scholar] [CrossRef]
  29. Liang, Z.; An, T.; Li, G.; Zhang, Z. Aerobic Biodegradation of Odorous Dimethyl Disulfide in Aqueous Medium by Isolated Bacillus Cereus Gigan2 and Identification of Transformation Intermediates. Bioresour. Technol. 2015, 175, 563–568. [Google Scholar] [CrossRef]
  30. Chen, X.Q.; Liang, G.Y.; Zhi, S.; Tai, C. Comparative Elimination of Dimethyl Disulfide by Maifanite and Ceramic-Packed Biotrickling Filters and Their Response to Microbial Community. Bioresour. Technol. Biomass Bioenerg. Biowastes Convers. Technol. Biotransform. Prod. Technol. 2016, 202, 76–83. [Google Scholar] [CrossRef] [PubMed]
  31. Luvsanjamba, M.; Sercu, B.; Peteghem, J.V.; Langenhove, H.V. Long-Term Operation of a Thermophilic Biotrickling Filter for Removal of Dimethyl Sulfide. Chem. Eng. J. 2008, 142, 248–255. [Google Scholar] [CrossRef]
  32. Chen, J.M.; Zhu, R.Y.; Yang, W.B.; Zhang, L. Treatment of a BTo-X-Contaminated Gas Stream with a Biotrickling Filter Inoculated with Microbes Bound to a Wheat Bran/Red Wood Powder/Diatomaceous Earth Carrier. Bioresour Technol. 2010, 101, 8067–8073. [Google Scholar] [CrossRef]
  33. Wu, H.; Yan, H.Y.; Quan, Y.; Zhao, H.Z.; Jiang, N.Z.; Yin, C.R. Recent Progress and Perspectives in Biotrickling Filters for VOCs and Odorous Gases Treatment. J. Environ. Manag. 2018, 222, 409–419. [Google Scholar] [CrossRef] [PubMed]
  34. Jin, Y.; Veiga, M.C.; Kennes, C. Co-Treatment of Hydrogen Sulfide and Methanol in a Single-Stage Biotrickling Filter under Acidic Conditions. Chemosphere 2007, 68, 1186–1193. [Google Scholar] [CrossRef]
  35. Álvarez-Hornos, F.J.; Gabaldón, C.; Martínez-Soria, V.; Marzal, P.; Penya-roja, J.M. Mathematical Modeling of the Biofiltration of Ethyl Acetate and Toluene and Their Mixture. Biochem. Eng. J. 2009, 43, 169–177. [Google Scholar] [CrossRef]
  36. Das, K.; Melear, N.; Kastner, J.; Buquoi, J. Influence of Ash Amendment on Odor Emissions and Aerobic Biodegradation of Biosolids Mixes. Trans. ASAE 2003, 46, 1185–1191. [Google Scholar]
  37. Estrada, J.M.; Quijano, G.; Lebrero, R.; Munoz, R. Step-Feed Biofiltration: A Low-Cost Alternative Configuration for Off-Gas Treatment. Water Res. 2013, 47, 4312–4321. [Google Scholar] [CrossRef]
  38. Wang, X.; Wu, C.; Liu, N.; Li, S.; Li, W.; Chen, J. Degradation of Ethyl Mercaptan and Its Major Intermediate Diethyl Disulfide by Pseudomonas sp. Strain WL2. Appl. Microbiol. Biotechnol. 2015, 99, 3211–3220. [Google Scholar] [CrossRef]
  39. Jung, I.G.; Lee, I.H.; Choung, S.J.; Chang, N.K.; Koo, Y.M.; Kim, E. Biodegradation of Toluene and Dimethyl Sulfide in a Cocultured Biofilter. Korean J. Chem. Eng. 2006, 23, 34–37. [Google Scholar] [CrossRef]
  40. Yang, C.; Hui, Q.; Xiang, L.; Yan, C.; Xi, J. Simultaneous Removal of Multicomponent Vocs in Biofilters. Trends Biotechnol. 2018, 36, 673–685. [Google Scholar] [CrossRef]
  41. Sun, Y.; Qiu, J.; Chen, D.; Ye, J.; Chen, J. Characterization of the Novel Dimethyl Sulfide-Degrading Bacterium Alcaligenes sp. SY1 and Its Biochemical Degradation Pathway. J. Hazard. Mater. 2016, 304, 543–552. [Google Scholar] [CrossRef]
  42. Dorado, A.D.; Baeza, J.A.; Lafuente, J.; Gabriel, D.; Gamisans, X. Biomass Accumulation in a Biofilter Treating Toluene at High Loads—Part 1: Experimental Performance from Inoculation to Clogging. Chem. Eng. J. 2012, 209, 661–669. [Google Scholar] [CrossRef]
  43. Caporaso, J.G.; Lauber, C.L.; Walters, W.A.; Berg-Lyons, D.; Huntley, J.; Fierer, N. Ultra-High-Throughput Microbial Community Analysis on the Illumina HiSeq and MiSeq Platforms. ISME J. 2012, 6, 1621–1624. [Google Scholar] [CrossRef] [PubMed] [Green Version]
  44. Liao, X.; Chen, C.; Zhang, J.; Dai, Y.; Zhang, X.; Xie, S. Operational Performance, Biomass and Microbial Community Structure: Impacts of Backwashing on Drinking Water Biofilter. Environ. Sci. Pollut. Res. Int. 2015, 22, 546–554. [Google Scholar] [CrossRef] [PubMed]
  45. Gallastegui, G.; Avalos Ramirez, A.; Elias, A.; Jones, J.P.; Heitz, M. Performance and Macrokinetic Analysis of Biofiltration of Toluene and P-Xylene Mixtures in a Conventional Biofilter Packed with Inert Material. Bioresour. Technol. 2011, 102, 7657–7665. [Google Scholar] [CrossRef]
  46. Ménard, C.; Ramirez, A.A.; Heitz, M. Kinetics of Simultaneous Methane and Toluene Biofiltration in an Inert Packed Bed. J. Chem. Technol. Biotechnol. 2014, 89, 597–602. [Google Scholar] [CrossRef]
  47. Hamdi, M. Biofilm Thickness Effect on the Diffusion Limitation in the Bioprocess Reaction: Biofloc Critical Diameter Significance. Bioprocess. Eng. 1995, 12, 193–197. [Google Scholar] [CrossRef]
  48. Willaert, R.; Smets, A.; De Vuyst, L. Mass Transfer Limitations in Diffusion-Limited Isotropic Hollow Fiber Bioreactors. Bioprocess. Eng. 1999, 13, 317–323. [Google Scholar]
  49. Zhang, T.; Pabst, B.; Klapper, I.; Stewart, P.S. General Theory for Integrated Analysis of Growth, Gene, and Protein Expression in Biofilms. PLoS ONE 2013, 8, e83626. [Google Scholar] [CrossRef]
  50. Amani, T.; Nosrati, M.; Mousavi, S.M. Using Enriched Cultures for Elevation of Anaerobic Syntrophic Interactions between Acetogens and Methanogens in a High-Load Continuous Digester. Bioresour. Technol. 2011, 102, 3716–3723. [Google Scholar] [CrossRef]
  51. Cox, H.H.; Deshusses, M.A. Co-Treatment of H2S and Toluene in a Biotrickling Filter. Chem. Eng. J. 2002, 87, 101–110. [Google Scholar] [CrossRef]
  52. Shu, C.; Chen, C. Enhanced Removal of Dimethyl Sulfide from a Synthetic Waste Gas Stream Using a Bioreactor Inoculated with Microbacterium sp. NTUT26 and Pseudomonas putida. J. Ind. Microbiol. Biotechnol. 2009, 36, 95–104. [Google Scholar] [CrossRef]
  53. Andriamanohiarisoamanana, F.; Yasui, S.; Iwasaki, M.; Yamashiro, T.; Ihara, I.; Umetsu, K. Performance Study of a Bio-Trickling Filter to Remove High Hydrogen Sulfide Concentration from Biogas: A Pilot-Scale Experiment. J. Mater. Cycles Waste Manag. 2020, 22, 1390–1398. [Google Scholar] [CrossRef]
  54. Alonso, C.; Suidan, M.T.; Kim, B.R.; Kim, B.J. Dynamic Mathematical Model for the Biodegradation of VOCs in a Biofilter:  Biomass Accumulation Study. Environ. Sci. Technol. 1998, 32, 3118–3123. [Google Scholar] [CrossRef]
  55. De Zwart, J.; Sluis, J.; Kuenen, J.G. Competition for Dimethyl Sulfide and Hydrogen Sulfide by Methylophaga sulfidovorans and Thiobacillus thioparus T5 in Continuous Cultures. Appl. Environ. Microbiol. 1997, 63, 3318–3322. [Google Scholar] [CrossRef] [Green Version]
  56. Wan, S.; Li, G.; An, T.; Guo, B. Co-Treatment of Single, Binary and Ternary Mixture Gas of Ethanethiol, Dimethyl Disulfide and Thioanisole in a Biotrickling Filter Seeded with Lysinibacillus sphaericus RG-1. J. Hazard. Mater. 2011, 186, 1050–1057. [Google Scholar] [CrossRef] [PubMed]
  57. Kim, Y.M.; Murugesan, K.; Schmidt, S.; Bokare, V.; Jeon, J.R.; Kim, E.J. Triclosan Susceptibility and Co-Metabolism—A Comparison for Three Aerobic Pollutant-Degrading Bacteria. Bioresour. Technol. 2011, 102, 2206–2212. [Google Scholar] [CrossRef] [PubMed]
  58. Ma, Q.; Qu, Y.Y.; Zhang, X.W.; Shen, W.L.; Liu, Z.Y.; Wang, J.W. Identification of the Microbial Community Composition and Structure of Coal-Mine Wastewater Treatment Plants. Microbiol. Res. 2015, 175, 1–5. [Google Scholar] [CrossRef]
  59. Wang, Z.; Yang, Y.; Dai, Y.; Xie, S. Anaerobic Biodegradation of Nonylphenol in River Sediment under Nitrate- or Sulfate-Reducing Conditions and Associated Bacterial Community. J. Hazard. Mater. 2015, 286, 306–314. [Google Scholar] [CrossRef] [PubMed]
  60. Wang, X.; Wang, Q.; Li, S.; Li, W. Degradation Pathway and Kinetic Analysis for P-Xylene Removal by a Novel Pandoraea sp. Strain WL1 and Its Application in a Biotrickling Filter. J. Hazard. Mater. 2015, 288, 17–24. [Google Scholar] [CrossRef]
  61. Acuña, M.E.; Pérez, F.; Auria, R.; Revah, S. Microbiological and Kinetic Aspects of a Biofilter for the Removal of Toluene from Waste Gases. Biotechnol. Bioeng. 1999, 63, 175–184. [Google Scholar] [CrossRef]
  62. Sardessai, Y.; Bhosle, S. Tolerance of Bacteria to Organic Solvents. Res. Microbiol. 2002, 153, 263–268. [Google Scholar] [CrossRef]
  63. Kim, C.W.; Park, J.S.; Cho, S.K.; Oh, K.J.; Kim, Y.S.; Kim, D. Removal of Hydrogen Sulfide, Ammonia, and Benzene by Fluidized Bed Reactor and Biofilter. J. Microbiol. Biotechnol. 2003, 13, 301–304. [Google Scholar]
  64. Ryu, H.; Kim, S.; Cho, K.S.; Lee, T. Toluene Degradation in a Polyurethane Biofilter at High Loading. Biotechnol. Progr. Eng. 2008, 13, 360–365. [Google Scholar] [CrossRef]
  65. Acuña, M.E.; Villanueva, C.; Cárdenas, B.; Christen, P.; Revah, S. The Effect of Nutrient Concentration on Biofilm Formation on Peat and Gas Phase Toluene Biodegradation under Biofiltration Conditions. Process. Biochem. 2002, 38, 7–13. [Google Scholar] [CrossRef]
Figure 1. Inlet (▲) and outlet (□) concentrations corresponding with removal efficiency (○) of mixture contaminants in BTF during different phases. (0): startup period EBRT 28 s (I): EBRT 56 s (II): EBRT 28 s (III): EBRT 20 s.
Fermentation 07 00309 g001
Figure 2. Effect of ILR on RE of BTF in mixture treatment during different phases.
Fermentation 07 00309 g002
Figure 3. Effect of ILR on EC of individual contaminants: (a) DMS; (b) propanethiol and (c) toluene in mixture treatment during different phases.
Fermentation 07 00309 g003aFermentation 07 00309 g003b
Figure 4. Effect of ILR on EC of BTF in single (a) DMS; (b) propanethiol and (c) toluene treatment during different phases.
Fermentation 07 00309 g004aFermentation 07 00309 g004b
Figure 5. Effect of eliminated capacity on CO2 production rate under EBRT of 56 s, 28 s, and 20 s in mixture contaminant BTF treatment during phase I to phase III.
Fermentation 07 00309 g005
Figure 6. Macrokinetic determination of Michaelis–Menten kinetic constant for (a) single treatment and (b) mixture treatment during different phases.
Fermentation 07 00309 g006
Figure 7. Comparison to quantitative contribution of the sequences affiliated with different (a) phyla, (b) class, and (c) genera to the total number of sequences from microcosm samples at 20 days, 75 days, and 120 days.
Fermentation 07 00309 g007aFermentation 07 00309 g007b
Table 1. Macrokinetic determination of Michaelis–Menten kinetic constant of DMS, propanethiol and toluene in single and mixture treatment under different EBRTs.
SubstratermaxKsEquationR2
DMS (single)
EBRT 56 s103.090.40Y = 0.00399x + 0.008020.996
EBRT 28 s256.410.67Y = 0.00265x + 0.003750.999
EBRT 20 s232.560.44Y = 0.00259x + 0.001530.995
Propanethiol (single)
EBRT 56 s149.250.88Y = 0.00602x + 0.005110.997
EBRT 28 s204.080.65Y = 0.00319x + 0.004390.989
EBRT 20 s196.080.53Y = 0.00274x + 0.003880.964
Toluene (single)
EBRT 56 s39.840.22Y = 0.00554x + 0.023990.994
EBRT 28 s90.910.33Y = 0.00357x + 0.010990.990
EBRT 20 s82.640.31Y = 0.00385x + 0.008650.982
DMS (mixture)
EBRT 56 s57.800.28Y = 0.00493x + 0.017300.982
EBRT 28 s114.940.38Y = 0.00328x + 0.009170.999
EBRT 20 s97.090.19Y = 0.00510x + 0.003190.999
Propanethiol (mixture)
EBRT 56 s63.690.34Y = 0.00534x + 0.015660.990
EBRT 28 s76.340.27Y = 0.00404x + 0.007130.980
EBRT 20 s104.170.31Y = 0.00296x + 0.009640.983
Toluene (mixture)
EBRT 56 s47.390.27Y = 0.00585x + 0.021110.985
EBRT 28 s99.010.33Y = 0.00430x + 0.004000.985
EBRT 20 s88.500.21Y = 0.00274x + 0.008810.986
Publisher’s Note: MDPI stays neutral with regard to jurisdictional claims in published maps and institutional affiliations.

