Article

Hydrodynamics of an OWC Device in Irregular Incident Waves Using RANS Model

by
Kshma Trivedi
1,
Amya Ranjan Ray
1,
Parothidil Anjusree Krishnan
1,
Santanu Koley
1,* and
Trilochan Sahoo
2
1
Department of Mathematics, Birla Institute of Technology and Science—Pilani, Hyderabad Campus, Hyderabad 500078, India
2
Department of Ocean Engineering and Naval Architecture, Indian Institute of Technology Kharagpur, Kharagpur 721302, India
*
Author to whom correspondence should be addressed.
Fluids 2023, 8(1), 27; https://doi.org/10.3390/fluids8010027
Submission received: 25 October 2022 / Revised: 13 December 2022 / Accepted: 27 December 2022 / Published: 11 January 2023
(This article belongs to the Special Issue Fluid Dynamics: Wave–Structure Interactions)

Abstract

:
This research examines the hydrodynamic performance of an oscillating water column device placed over a sloping seabed under the influence of irregular incident waves. The numerical model is based on the Reynolds-veraged Navier–Stokes (RANS) equations with a modified k ω turbulence model and uses the volume-of-fluid (VOF) approach to monitor the air–water interface. To explore the hydrodynamic performance of the OWC device in actual ocean conditions, the Pierson–Moskowitz (P-M) spectrum was used as the incident wave spectrum, together with the four distinct sea states which occur most often along the western coast of Portugal. The numerical simulation offers a comprehensive velocity vector and streamline profiles inside the OWC device’s chamber during an entire cycle of pressure fluctuation. In addition, the impact of the irregular wave conditions on the free-surface elevation at various places, the pressure drop between the chamber and the outside, and the airflow rate via the orifice per unit width of the OWC device are investigated in detail. The results demonstrate that the amplitudes of the inward and outward velocities via the orifice, free-surface elevations, and flow characteristics are greater for more significant wave heights. Further, it is noticed that the power generation and capture efficiency are higher for a seabed having moderate slopes.

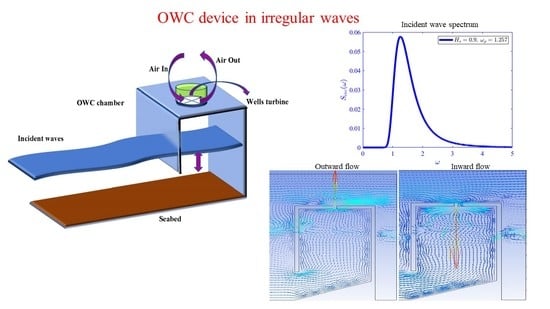
Graphical Abstract

1. Introduction

Socioeconomic development has accelerated, and energy, particularly crude oil, plays a unique role in the expansion and growth of the global economy [1]. This world-renowned expansion, however, has been accomplished at the expense of natural resources and the environment. Moreover, the depletion of non-renewable energy sources, population growth, climate change, and global warming challenges have placed governments in a precarious position regarding the promotion of renewable energy [2]. Renewable energy is garnering more attention and is widely recognized as the greatest solution to the growing cost of fossil fuels and imminent survival issues. In a bid to save the environment from the harmful consequences of fossil fuel emissions, the use of renewable energy sources over the long run is cost-effective [3]. Due to the high energy-density flux of ocean waves relative to other renewables, such as solar and wind, and their lower contribution to environmental contaminants and global warming, the energy linked with ocean waves is of considerable importance to researchers today [4]. In order to convert wave energy into electricity, several wave-power production prototypes have been designed and deployed across the globe. However, the oscillating water column (OWC) wave energy converter device is more popular, owing to its feasibility and simple operating mechanism. The OWC device consists of a partially submerged collector chamber and a power take-off (PTO) system that consists of a Wells turbine located at the top of the chamber to avoid direct contact with seawater. The detailed advantages and working mechanism of the OWC device are provided in [5,6]. The mathematical modeling of the OWC device started with the work of [7,8,9]. The Galerkin method was used by [10] for investigating the hydrodynamic performance of the OWC device in the framework of linear water-wave theory. In this research, numerous critical characteristics relating to the efficiency of OWC devices, such as radiation susceptance and radiation conductance, volume flux inside the chamber, and maximum efficiency of the OWC, were examined for various values of the device’s form parameters. Furthermore, two distinct resonance mechanisms were depicted in order to achieve maximum efficiency in the OWC device. Under the assumptions of linear water-wave theory, most of the studies so far examined the two main components (chamber and turbine) of the OWC device. Note though, that the coupling between the chamber configuration and turbine geometry plays a crucial role in the design and optimization of this type of wave energy converter, since the performances of these two components depend on one another. In order to get the resonant conditions in the chamber, the turbine must provide the optimal pneumatic damping [11,12,13]. Further, to enhance the performance of the turbine, the chamber geometry plays a significant role [14,15,16,17]. In addition, to handle the complex geometries and undulated seabeds, the wave–OWC interactions can be modeled and solved numerically by employing the boundary element method (BEM) [6,18,19]. In all the studies mentioned above, for the linear waves, the analytical two-dimensional linear models were successfully utilized to determine the optimum pneumatic damping and hydrodynamics for every specific wave condition. The drawback of these simulations is that the various flow properties, such as vortex creation and turbulence, cannot be addressed due to the absence of viscosity. However, as the incident wave heights increase, nonlinear numerical models have to be applied to study the nonlinear hydrodynamic phenomena in the OWC device.
In recent decades, computational fluid dynamics (CFD)-based solution approaches have been used as a substantial supplement to conventional physical testing processes in ocean engineering in order to obtain a better knowledge of the flow characteristics surrounding the OWC device and to adequately prepare the most appropriate hydrodynamic and thermodynamic processes involved in the interactions among waves, OWC, and air in the chamber [20]. Some initial work based on the CFD-based technique, the volume of fluid (VOF) approach, was performed by [21] to handle the complex configurations associated with free boundaries and extremely complex free-surface flows. In order to study the effect of viscosity and nonlinear interaction between the incident waves and the OWC device, the CFD-based Open-FOAM program was utilized [22,23,24,25,26,27]. This research demonstrated that the structural configuration and turbine damping factors considerably affected the OWC device’s performance. In all the studies mentioned earlier, the OWC device was placed over the uniform seabed. However, the seabed is not uniform in nature. When ocean waves propagate toward coastline areas, the incident wave energy is constantly modified due to the bottom effects. Bottom friction causes a variety of physical phenomena, such as wave refraction, shoaling, and breaking. Therefore, it is very important to take into account the undulated bottom topography to analyze the hydrodynamic performance of the OWC device, which is placed on a vertical cliff in the shoreline areas.
In each of the preceding investigations, the hydrodynamics of the OWC device was examined in the presence of regular incident waves. However, in actual sea conditions, the ocean is exceedingly unpredictable and irregular. In light of this, it is of utmost import to evaluate the functioning of OWC devices in real sea conditions. CFD-based modeling was used by [28,29,30] to examine the performances of OWC devices under random incident waves. These studies demonstrated that the OWC device is more productive than in the presence of irregular incoming waves for the majority of wave frequencies, especially around the resonating frequencies. It is to be noted that in all the studies mentioned above, either the turbulence effect was ignored or the OWC device was placed over the uniform seabed. This particular gap serves as a motivation for the present study.
In this work, the CFD-based ANSYS Fluent program was used to evaluate the hydrodynamic performance of the OWC device. Major emphasis was put on analyzing the influence of fluid particle motion in the air chamber on the hydrodynamic performance of the OWC device positioned over a sloping seafloor in the presence of irregular incident waves. The overall organization of the paper is as follows: Section 2 contains the modeling of a numerical wave tank, geometry and grid generation, governing equations, and associated boundary conditions. The hydrodynamics of the OWC device in the presence of irregular waves are discussed in Section 3. The associated results and conclusions of the present research are provided in Section 4 and Section 5.

2. Modeling of the Numerical Wave Tank (NWT)

The present section provides the mathematical formulation and boundary conditions corresponding to the 2D NWT model based on the CFD tool ANSYS Fluent.

2.1. Geometry and Grid Generation

The present research was carried out in a numerical wave tank (NWT) for numerical simulation purposes. A detailed working mechanism of the OWC device is provided in [17]. A two-dimensional, multiphase, time-dependent, incompressible CFD model was utilized in ANSYS-Fluent to generate the numerical wave tank (NWT), which acted as a towing tank to replicate the real sea environment artificially. In the present analysis, the wave tank length was selected in such a way that the reflection from the opposite end would not reach the wave-making zone. Here, a substantial portion of the incident wave energy was trapped inside the OWC chamber in the form of an oscillating column of water (see [31]). The computational domain of the physical problem is given in Figure 1. The OWC device was placed over the slopping seabed with the sloping angle θ , as shown in Figure 1. The 2D tank was considered in the x y plane. For a particular wavelength λ , the total length of the tank was considered 10 times the wavelength, and the OWC chamber was placed at a distance of five times the wavelength from the wave inlet (see [32]). The free surface water level lay at y = 5 , making the water depth 5 m. The OWC device was located near the rear end of the tank, as shown in Figure 1, which was sufficiently far away from the incident wave creation zone. The thickness of the OWC’s wall was 0.25 m, and the draft of the front wall into the water was taken to be 2.75 m. The width of the orifice was 0.2 m.
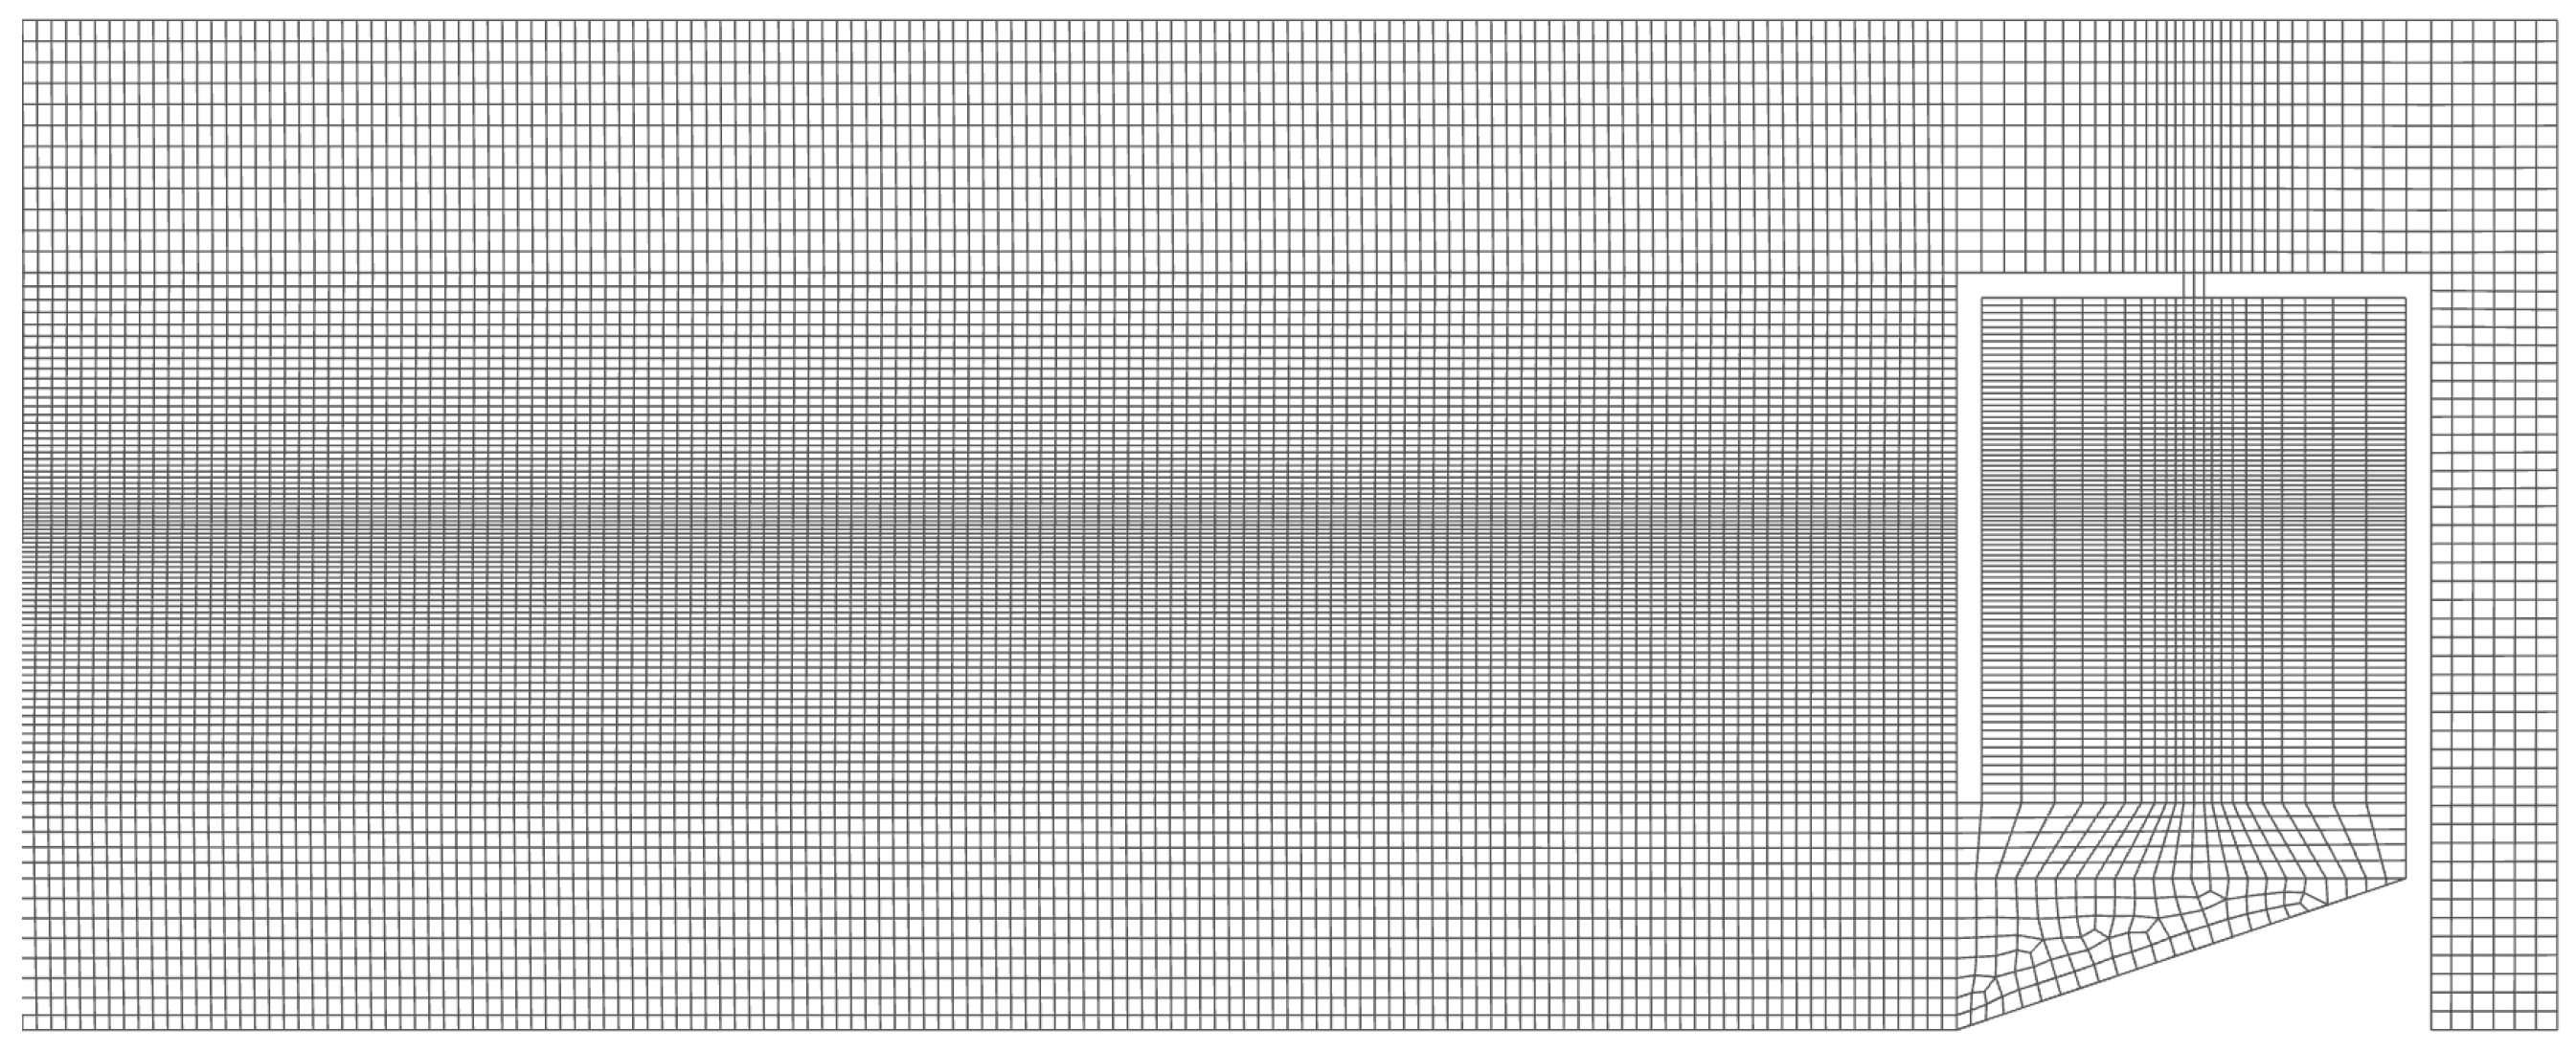
In the present analysis, the computational domain of the physical problem was meshed utilizing the quadrilateral elements, which are appropriate for the VOF (volume of fluid) model in ANSYS Fluent. A sketch of the meshing of the entire domain is provided in Figure 2. Further, the domain was subdivided into different sub-mesh regions, such as the free surface and surfaces near the orifice, allowing for the selection of different cell sizes to define a more refined grid for the representation of specific study zones. Near the upper and lower boundaries of the domain, the cell size was Δ x = 0.14405 m and Δ y = 0.208 m. The cell size decreased gradually towards the air–water interface, where the cell size was Δ x = 0.14405 m and Δ y = 0.0389 m. Further, near the orifice of the OWC device, the cell size was Δ x = 0.078 m and Δ y = 0.074 m. The cell sizes in the remaining portions was adjusted automatically using ANSYS Fluent.

2.2. Governing Equations

The fluid flow problems were governed by the equation of continuity, along with the Reynolds-averaged Navier–Stokes (RANS), given as (see [23])
U i ¯ x i = 0 ,
ρ U i ¯ t + ρ U j ¯ U i ¯ x j = ρ f i P x i + x j μ U i ¯ x j ρ U i U j ¯ ,
where U i ¯ are the average velocities. Further, ρ , f i , and P are termed fluid density, forces acting per unit volume of fluid, and average pressure, respectively. Here, μ is the fluid kinetic viscosity and ρ U i U j ¯ is the measure of Reynold’s stresses.
The real-time oceanic waves are turbulent in nature. The turbulence caused by breaking waves has a significant impact on marine structures. Since the OWC device is placed on the seashore or floats in the sea, the waves can hit it, causing turbulence due to breaking waves. As a result, turbulence must be considered in the hydrodynamics of the OWC device (see [33]). To capture the effect of turbulent flow conditions, the k ω model was used in the present analysis. Further, the k ω model has numerous advantages over the other turbulence models; e.g., under adverse pressure-gradient conditions, the k ω model performs significantly better than the k ϵ model. In addition, another advantage of the k ω model is its ease of formulation in the viscous sublayer. In k ϵ model, the numerical stiffness arises due to the viscous sublayer (see [34] for details). The governing equations for the k ω model are given as follows:
ρ ω t + . ρ U i ¯ ω = α p ω β ρ ω 2 + ρ d ω ρ k . ω T + . μ + σ ω ρ k ω ω ,
ρ k t + . ρ U i ¯ k = p k β * ρ ω k + . μ + σ * μ t k .
Here, k and ω are the turbulent kinetic energy and characteristic eddy frequency. Further, p k and p ω are production terms of k and ω , respectively; and μ t is the dynamic, turbulent eddy viscosity (see [35,36] for details). The expressions for the same are given as
p k = μ t × U i ¯ . × U i ¯ T , p ω = ω k p k , a n d , μ t = ω ˜ k p k ,
where
ω ˜ = m a x ω , C l i m 2 S : S β * .
Now, the specific Reynolds stress tensor T and strain rate tensor S can be expressed as
T = 2 ρ μ t S 2 3 k I , a n d S = 1 2 U i ¯ + ( U i ¯ T ) ,
where I is the identity tensor. Further, the suggested values for the coefficients associated with the k ω model are as follows: α = 13 / 25 , β = 0.072 , β * = 0.09 , ρ ω = 0.5 , σ * = 3 / 5 , and C l i m = 7 / 8 (see [35] for details).

2.3. Boundary Conditions and Generation of Free Surface

The computational domain of the physical problem consists of various boundaries, such as the top boundary, OWC duct boundaries, inlet, and bottom boundary, respectively. No-slip and no-penetration wall boundary conditions were implemented on the bottom, and OWC duct boundaries and the same are given as
U i ¯ . n ^ = 0 , on Γ , ( no   penetration ) , U i ¯ . τ ^ = 0 on Γ , ( no   slip ) .
Here, n ^ and τ ^ represent the outward unit normal and unit tanget vector to the boundary Γ (bottom and OWC duct boundaries), respectively. Moreover, at the top boundary, the pressure outlet condition, i.e., constant pressure (corresponding to zero-gauge pressure), is utilized.
P absolute = P gauge + P operating , P absolute = 101325 Pa .
On the inlet, an open channel boundary condition is used, in which the free surface displacement η , horizontal velocity U 1 , and vertical velocity U 2 are given by
η = A cos k x ω t , U 1 = ω A cosh ( k y ) sinh ( k h ) cos k x ω t , U 2 = ω A sinh ( k y ) sinh ( k h ) sin k x ω t .
To generate the irregular waves, an incident wave spectrum is taken, from which the finite number of A i and ω i are generated. Further, k and ω are wavenumber and angular frequency, respectively. Now, to generate the free surface, the volume of fluids (VOF) approach is employed to incorporate the interaction of two fluids: air and water, in the line of the free surface. The fluid region is defined via the VOF approach using the VOF function q. In particular, a value of q = 1 corresponds to a cell full of water, and a value of q = 0 indicates an air cell. The cells contain the free surface with 0 < q < 1 . If the volume fraction of the phase is represented by q i , then the equation of continuity for the volume fraction is written as (see [37])
q i t + U 1 q i x 1 + U 2 q i x 2 = 0 , i = 1 , 2
The equation mentioned above was subjected to the volume fraction constraint: that the total volume fraction for all the phases is equal to unity. The constraint is given as follows:
i = 1 n q i = 1 .
Further, the compressive scheme in ANSYS Fluent was utilized to track the free surface more accurately.

3. Hydrodynamic Performance of the OWC Device in an Irregular-Wave Environment

This section provides the expressions associated with the hydrodynamic efficiency of the OWC device in the presence of irregular incident waves. The power absorbed by the OWC device is calculated as the time average of the product of pressure drop Δ p (between the OWC device’s chamber and the exterior), and the airflow rate through the orifice per unit width of the OWC device’s chamber q ( t ) can be expressed as
P o u t = 1 t m 0 t m Δ p q ( t ) d t ,
where t m is the maximum run-time of the simulation. Further, the incident wave energy flux P i n c is given as
P i n c = ρ g 0 S i n c ( ω ) C g d ω ,
where C g is group velocity with the expression C g = ω 2 k 1 + 2 k h sinh ( 2 k h ) , and k is the positive real root of the dispersion relation ω 2 = g k tanh ( k h ) . Here, S i n c is the incident wave spectrum, and the expression for the same is written as
S i n c = 5 16 H s 2 ω p 4 ω 5 exp 5 ω p 4 4 ω 4 .
H s and ω p are significant wave height and peak frequency, respectively. Finally, the hydrodynamic efficiency of the OWC device is defined as the ratio of power absorbed by the OWC device and the incident wave energy flux, which can be expressed as
η = P o u t P i n c .

4. Results

The present section yields the influence of the irregular wave conditions on the free-surface elevation at different locations. Vertex-averaged y-velocity inside the orifice and the pressure drop between the chamber and the exterior are analyzed in a detailed manner. The parameters associated with the seabed and incident waves were taken as follows: g = 9.81 m/s 2 , ρ = 1025 kg/m 3 , and angle of the sloping seabed θ = 18 . 6 , unless otherwise mentioned. The characteristics of four different most common sea states on the western coast of Portugal (see [38] for the incoming wave spectrum) associated with Equation (15) are the following: the significant wave heights H s = 0.9 , 1.18 , 1.23 , and 1.88 m; and the corresponding peak frequencies ω p = 1.257 , 0.967 , 0.811 , and 0.993 Hz, respectively. For simulation purposes, parallel computing was utilized in ANSYS Fluent software, in which two of the latest GPU graphics cards (NVIDIA GeForce RTX 2080) and 24 processors (Intel (R) silver 4116 CPU @ 2.10 GHz) were used. The run-time was approximately 8 h for the 210 s simulation with the time step 0.05 s using the aforementioned computer configuration.

4.1. Comparison with the Existing Results

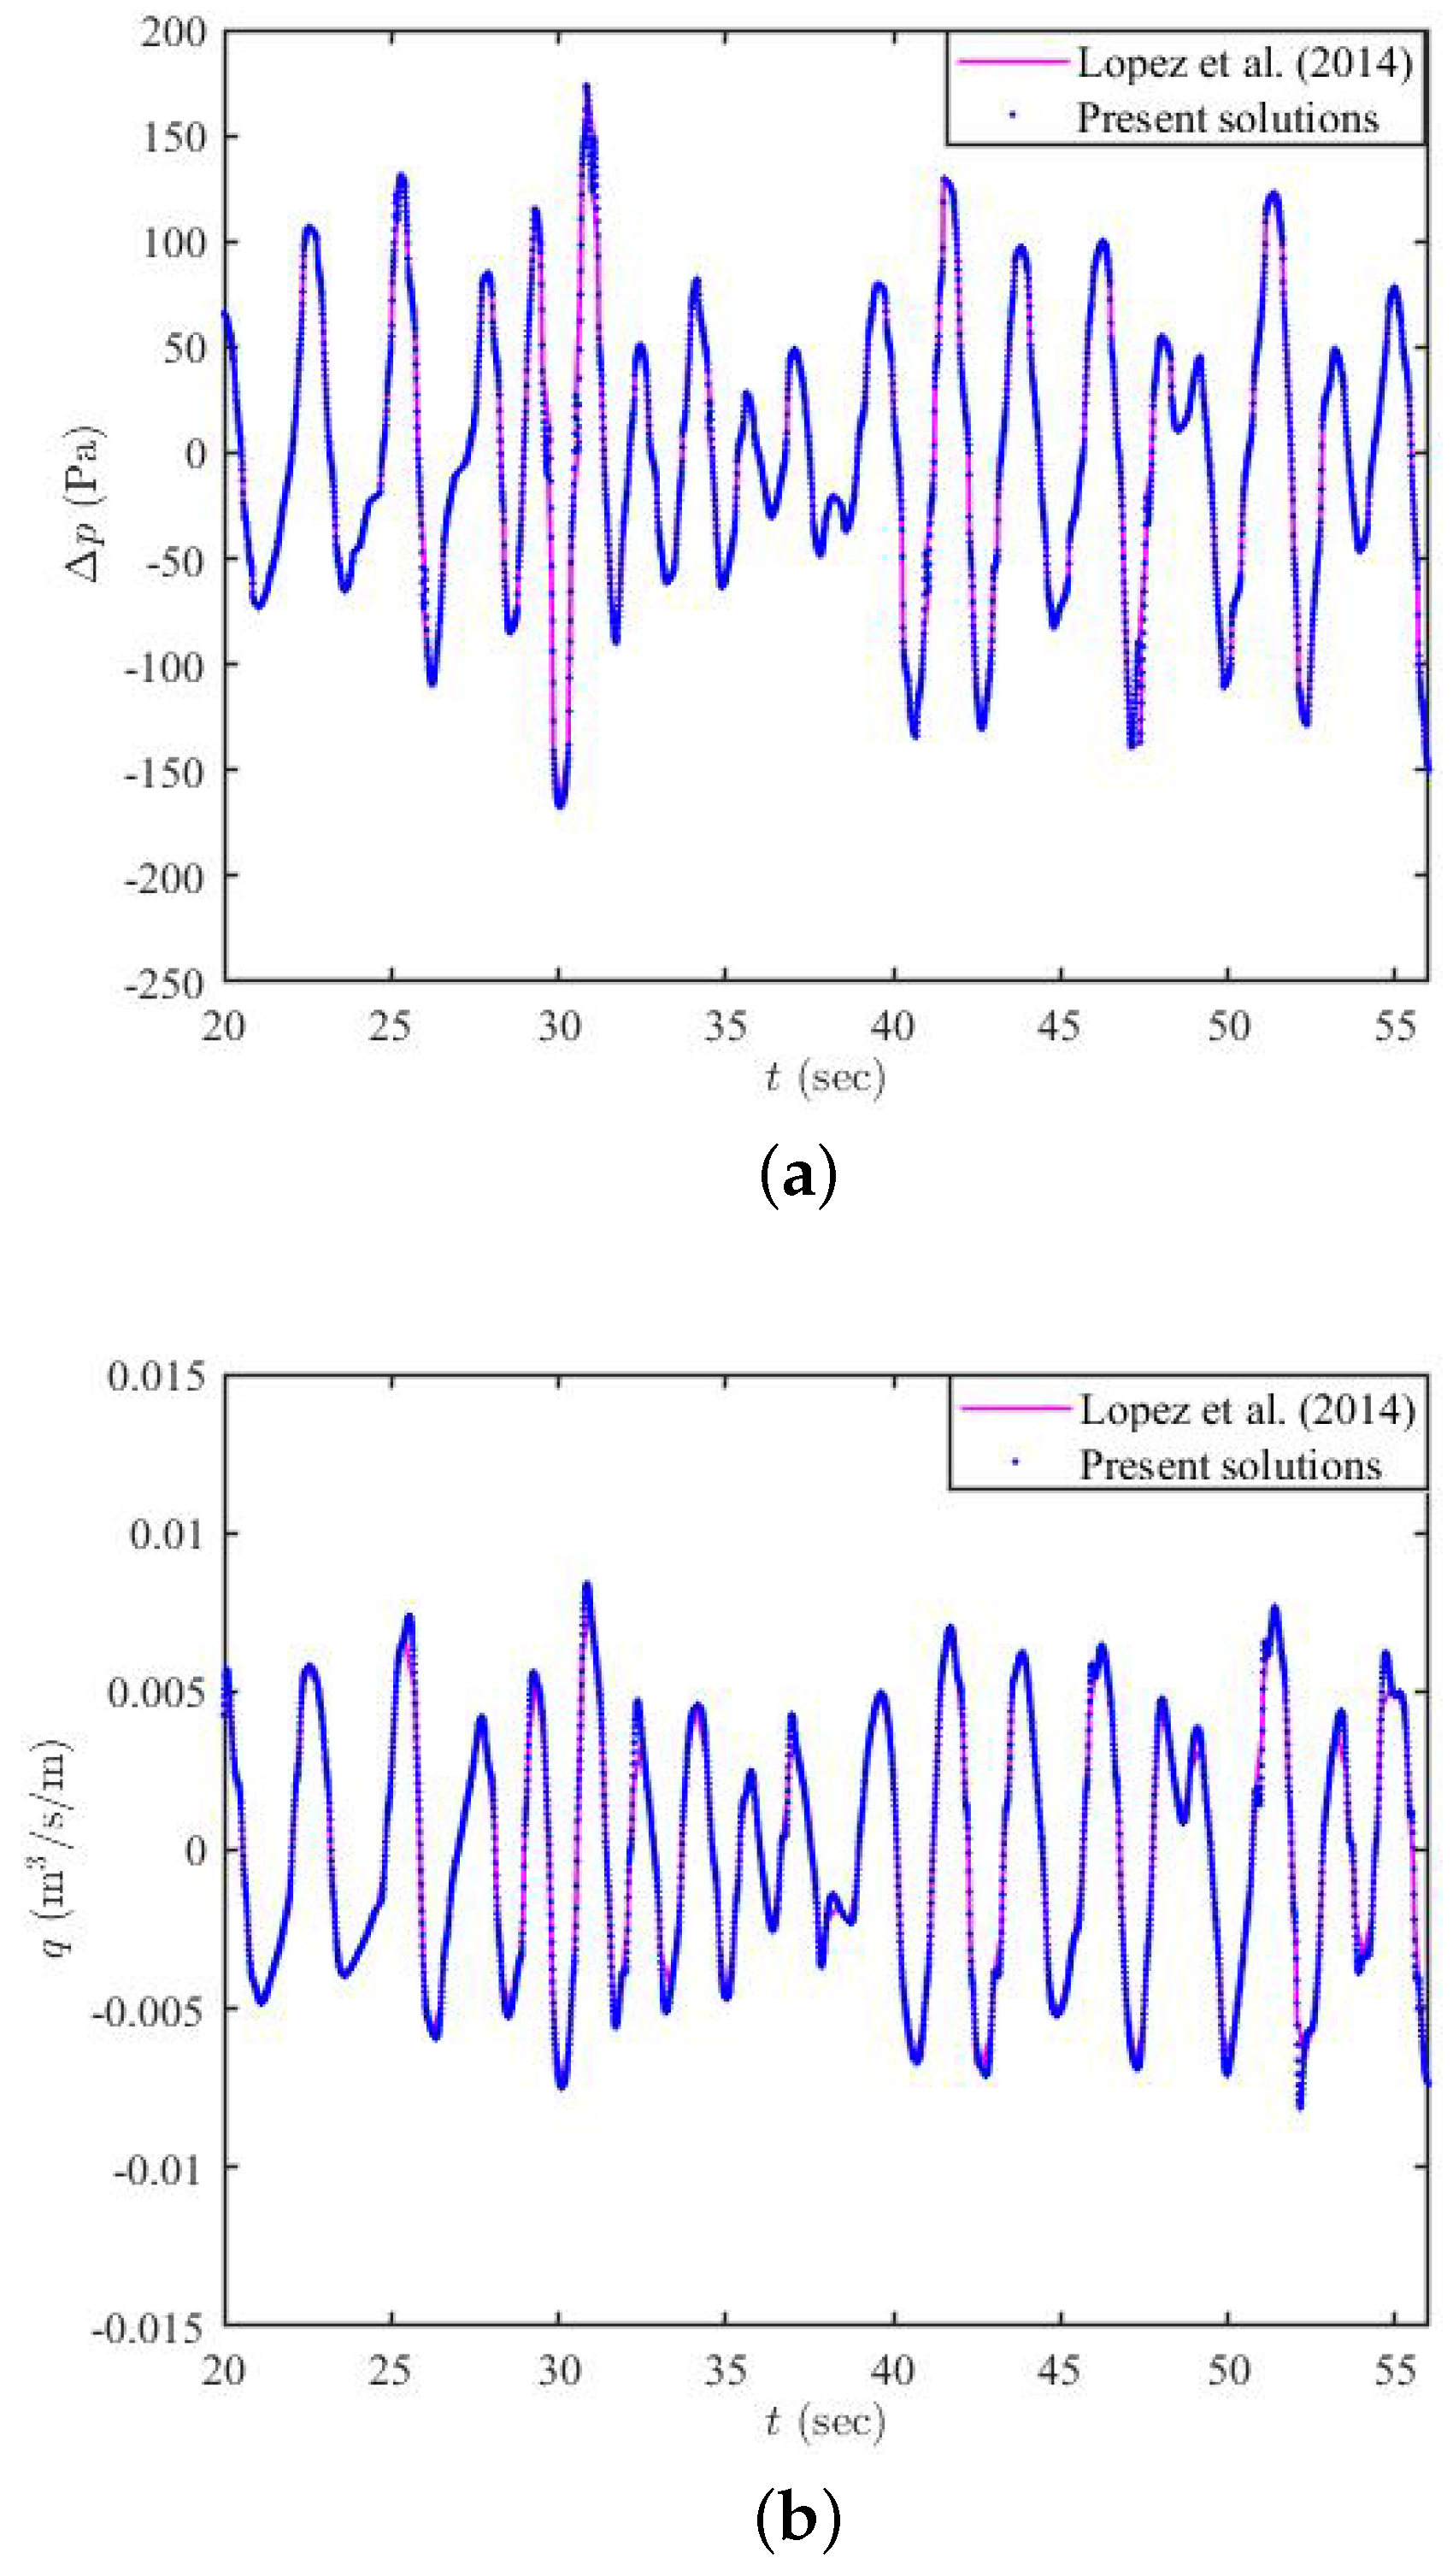
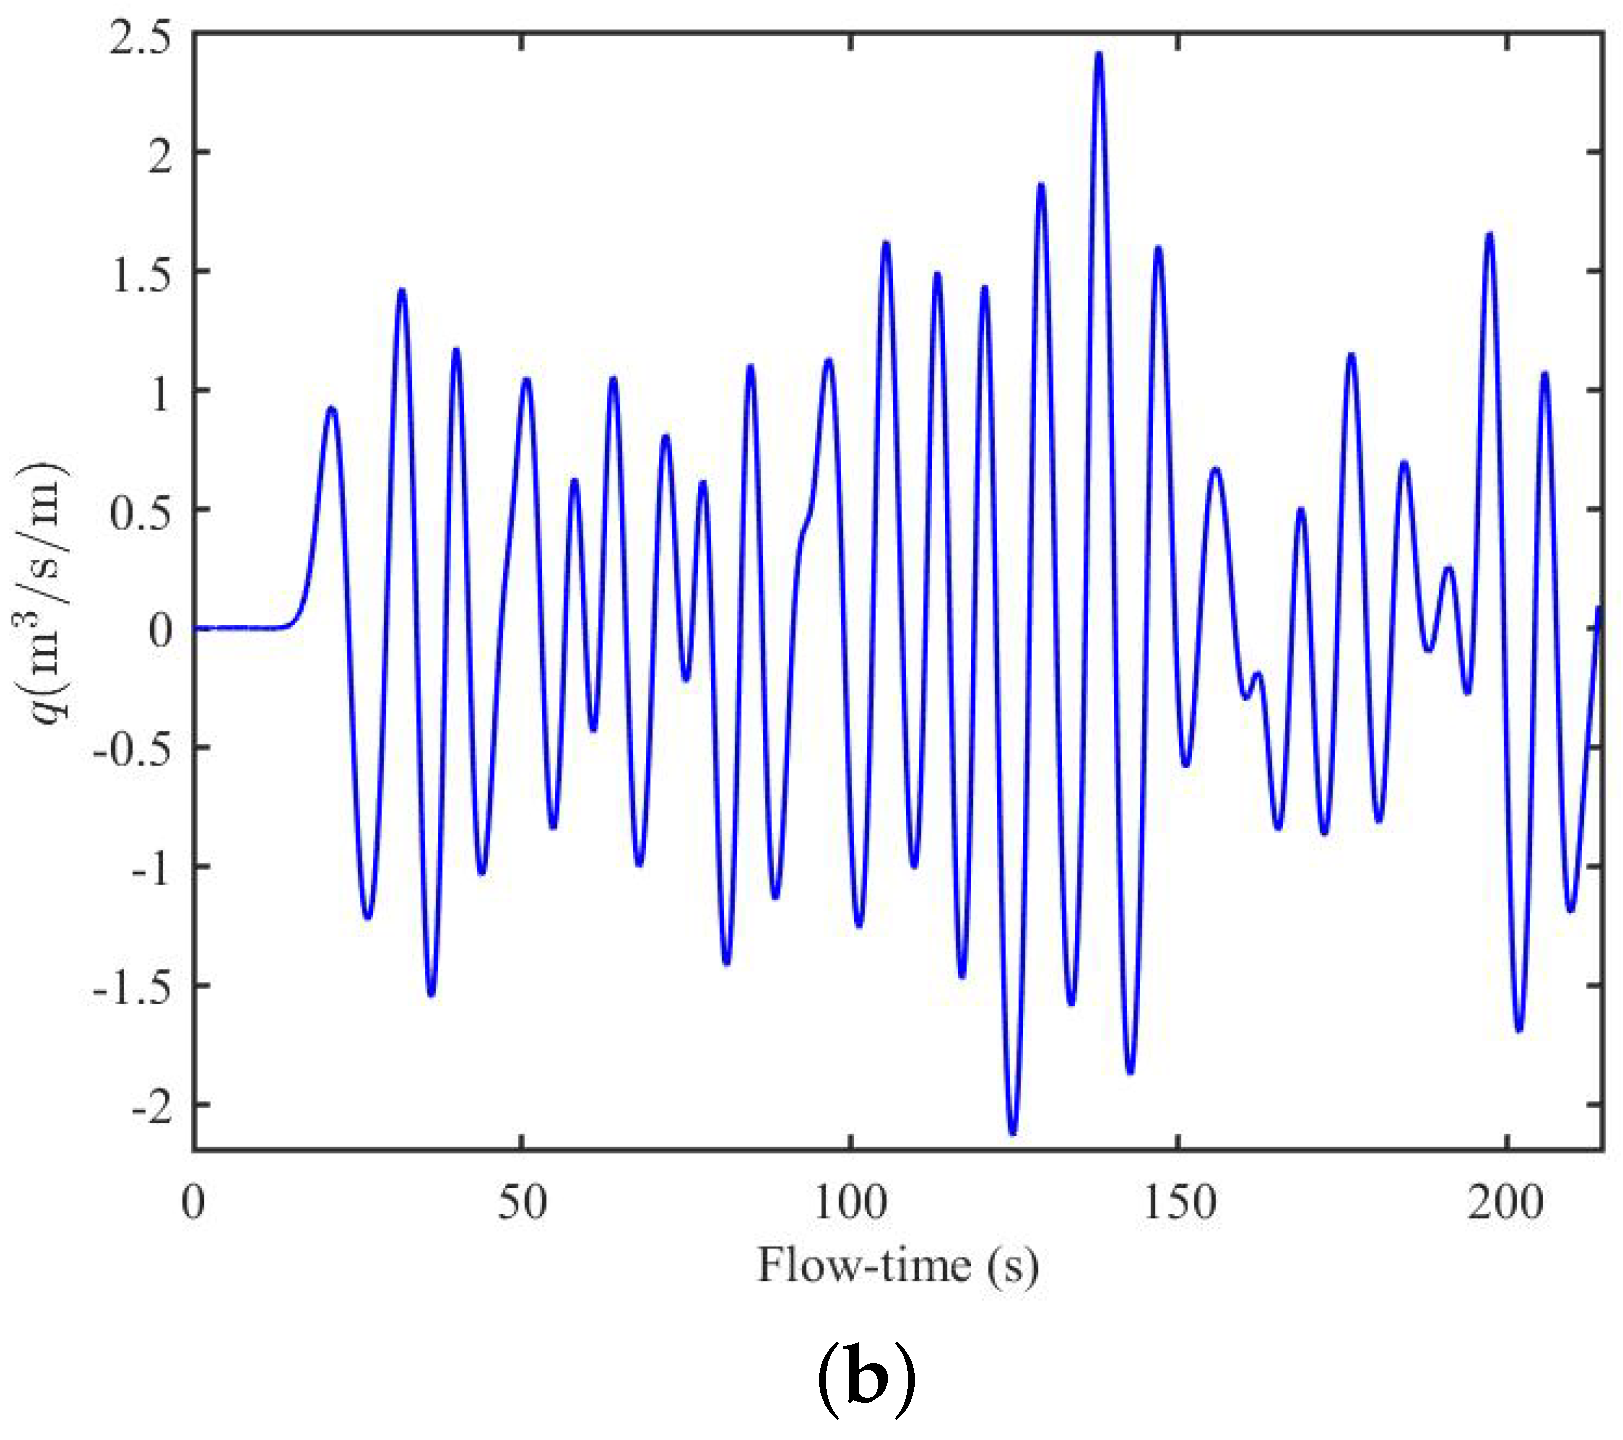
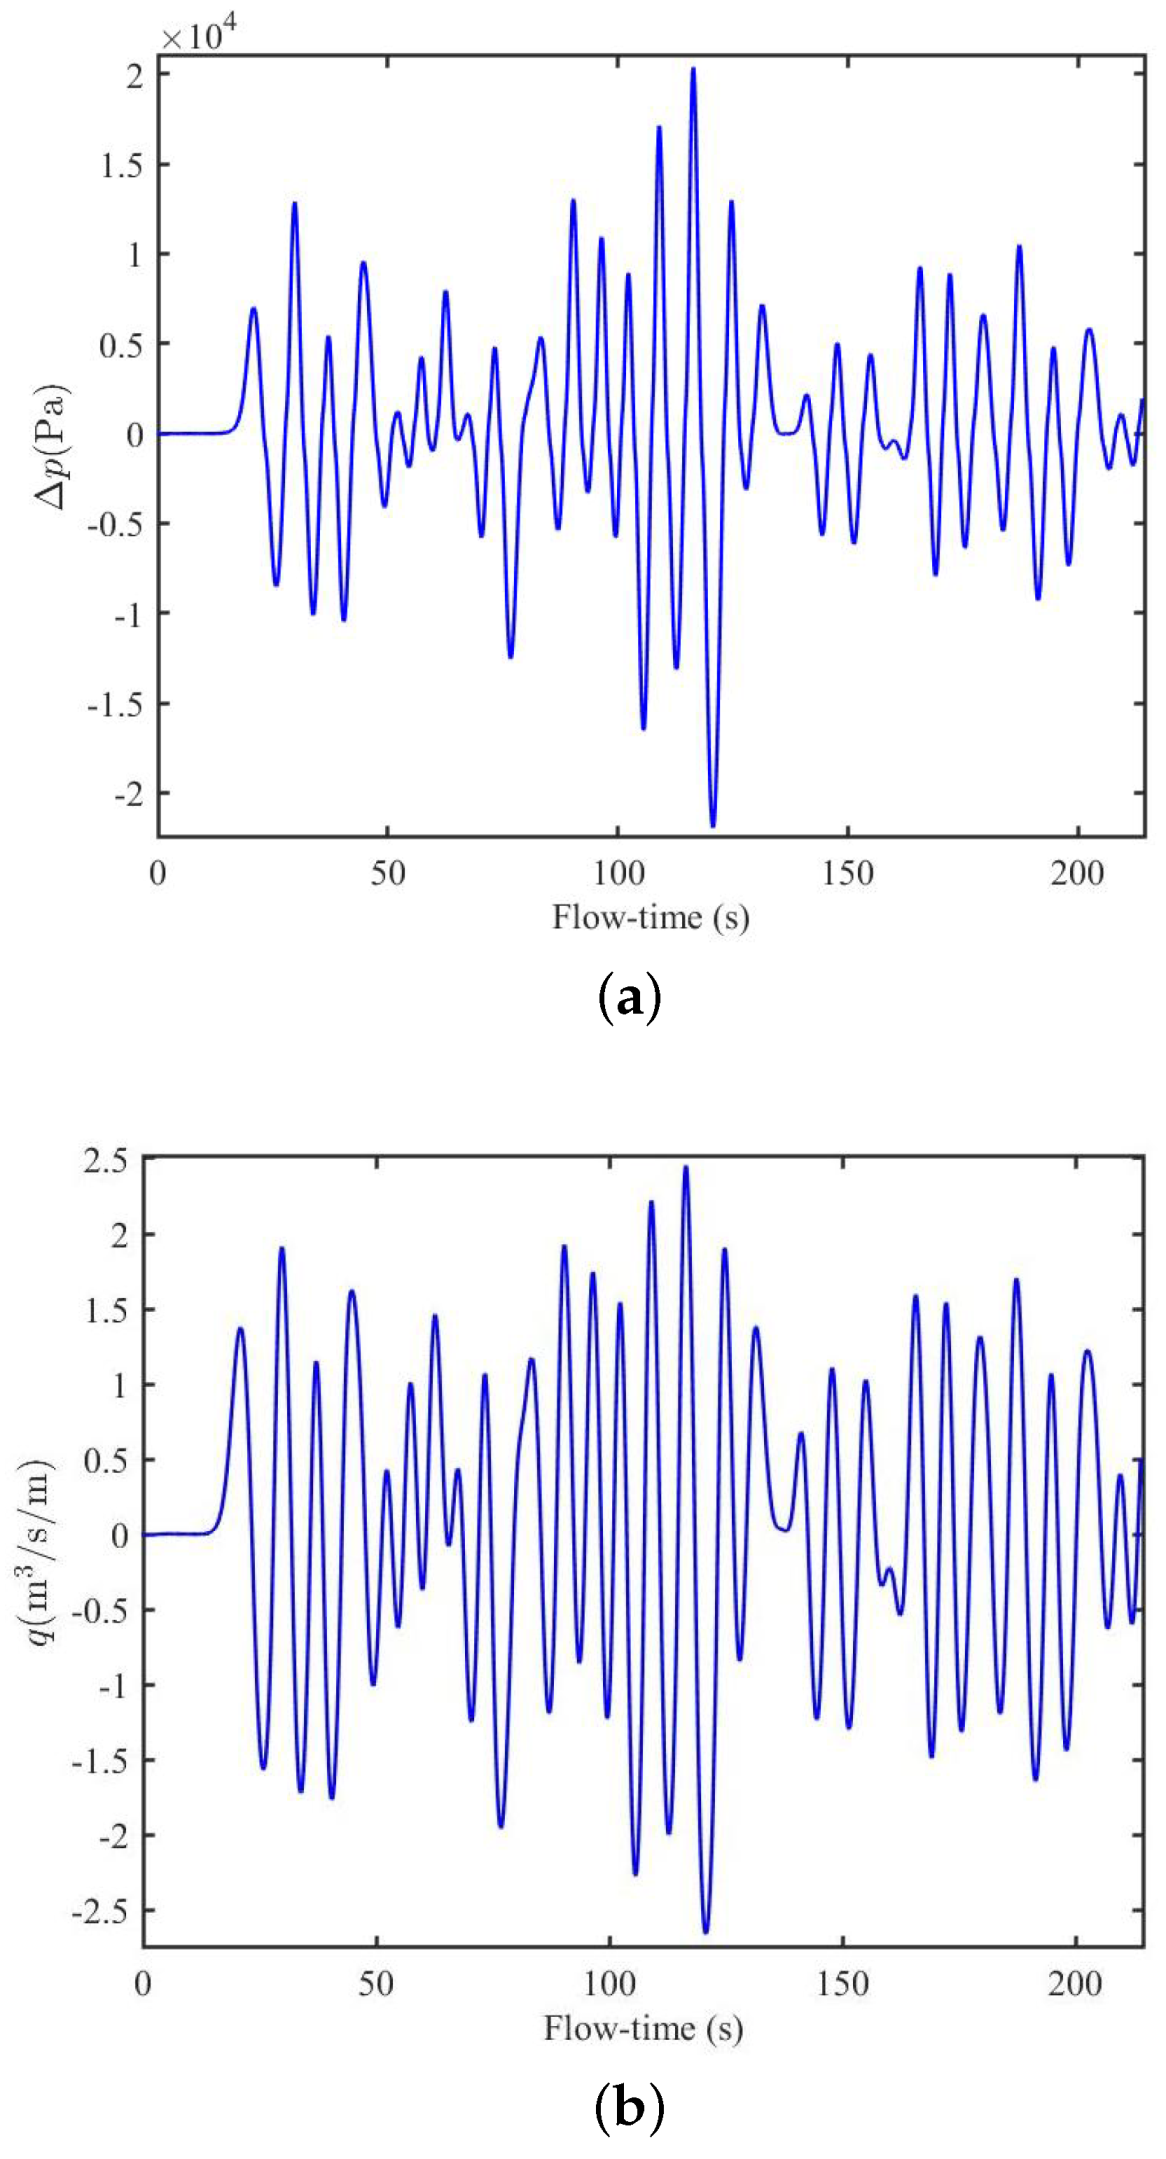
The present section provides the comparison between the present numerical results and the results of [22]. To verify the present computational results, the pressure drop and flow rate as functions of flow-time obtained using the CFD-based tool ANSYS Fluent are compared (see Figure 3a,b) against the numerical results provided in [22] (see Figure 5a,b in [22]). The geometrical and incident wave parameters were the same as those mentioned in [22]. Both the figures show that the results obtained using the present CFD-based tool, ANSYS Fluent, match well with the results of [22].

4.2. Grid-Convergence Analysis

To verify that the desired flow physics were accurately implemented in the computational domain, a grid convergence study was carried out in line with ASME V 20-2009 by considering the pressure and velocity at the PTO inlet as variables. The grid convergence index (GCI), which is used as an indicator of discretization uncertainty, is reported in the following section. The representative grid size "G" is defined as follows.
G = 1 N i = 1 N Δ A i 1 / 2 .
A i is the area of the i t h cell and N is the total number of cells used for the computations. For each grid, the representative grid sizes G 1 = 0.10197 , G 2 = 0.17323 , and G 3 = 0.29441 were evaluated; and the grid refinement ratio "r" was determined as r 21 = G 2 / G 1 and r 32 = G 3 / G 2 . Here, r 21 = r 32 = 1.7 , and the apparent order p was determined using the following expression:
p = 1 l n ( r 21 ) l n | ϵ 32 / ϵ 21 | + q ( p ) .
Here, ϵ 21 = ϕ 2 ϕ 1 , ϵ 32 = ϕ 3 ϕ 2 , and ϕ k denotes the solution on the k th grid. Further, q ( p ) is calculated as
q ( p ) = ln r 21 p s r 32 p s , s = 1 . sin ϵ 32 / ϵ 21 .
In addition, q ( p ) becomes zero when r is constant. Further, the approximate relative error is given as
e 21 a = ϕ 1 ϕ 2 ϕ 1 .
The coarse grid convergence index is calculated as follows:
G C I C o a r s e 21 = 1.25 e 21 a r 21 p r 21 p 1 .
In a similar manner, the fine grid convergence index can be expressed as
G C I F i n e 21 = 1.25 e 21 a r 21 p 1 .
Table 1 demonstrates that all the parameters are well within the asymptotic range. The aforementioned verification shows that the grid convergence is good for pressure drop, volume flux, and free-surface elevation. Hereafter, the representative grid size G 2 = 0.17323 is considered for the numerical simulation.
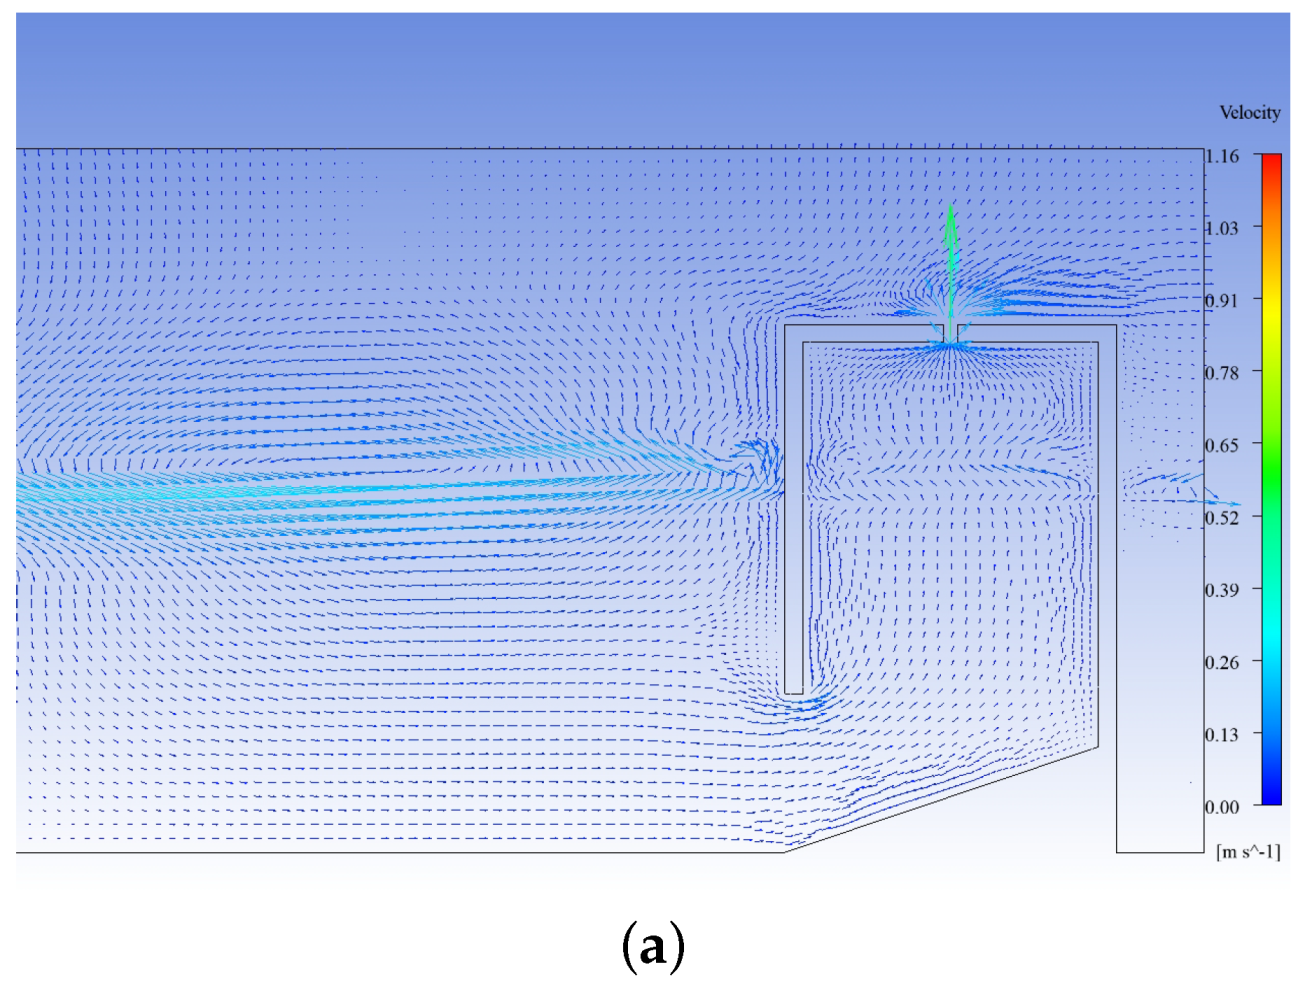
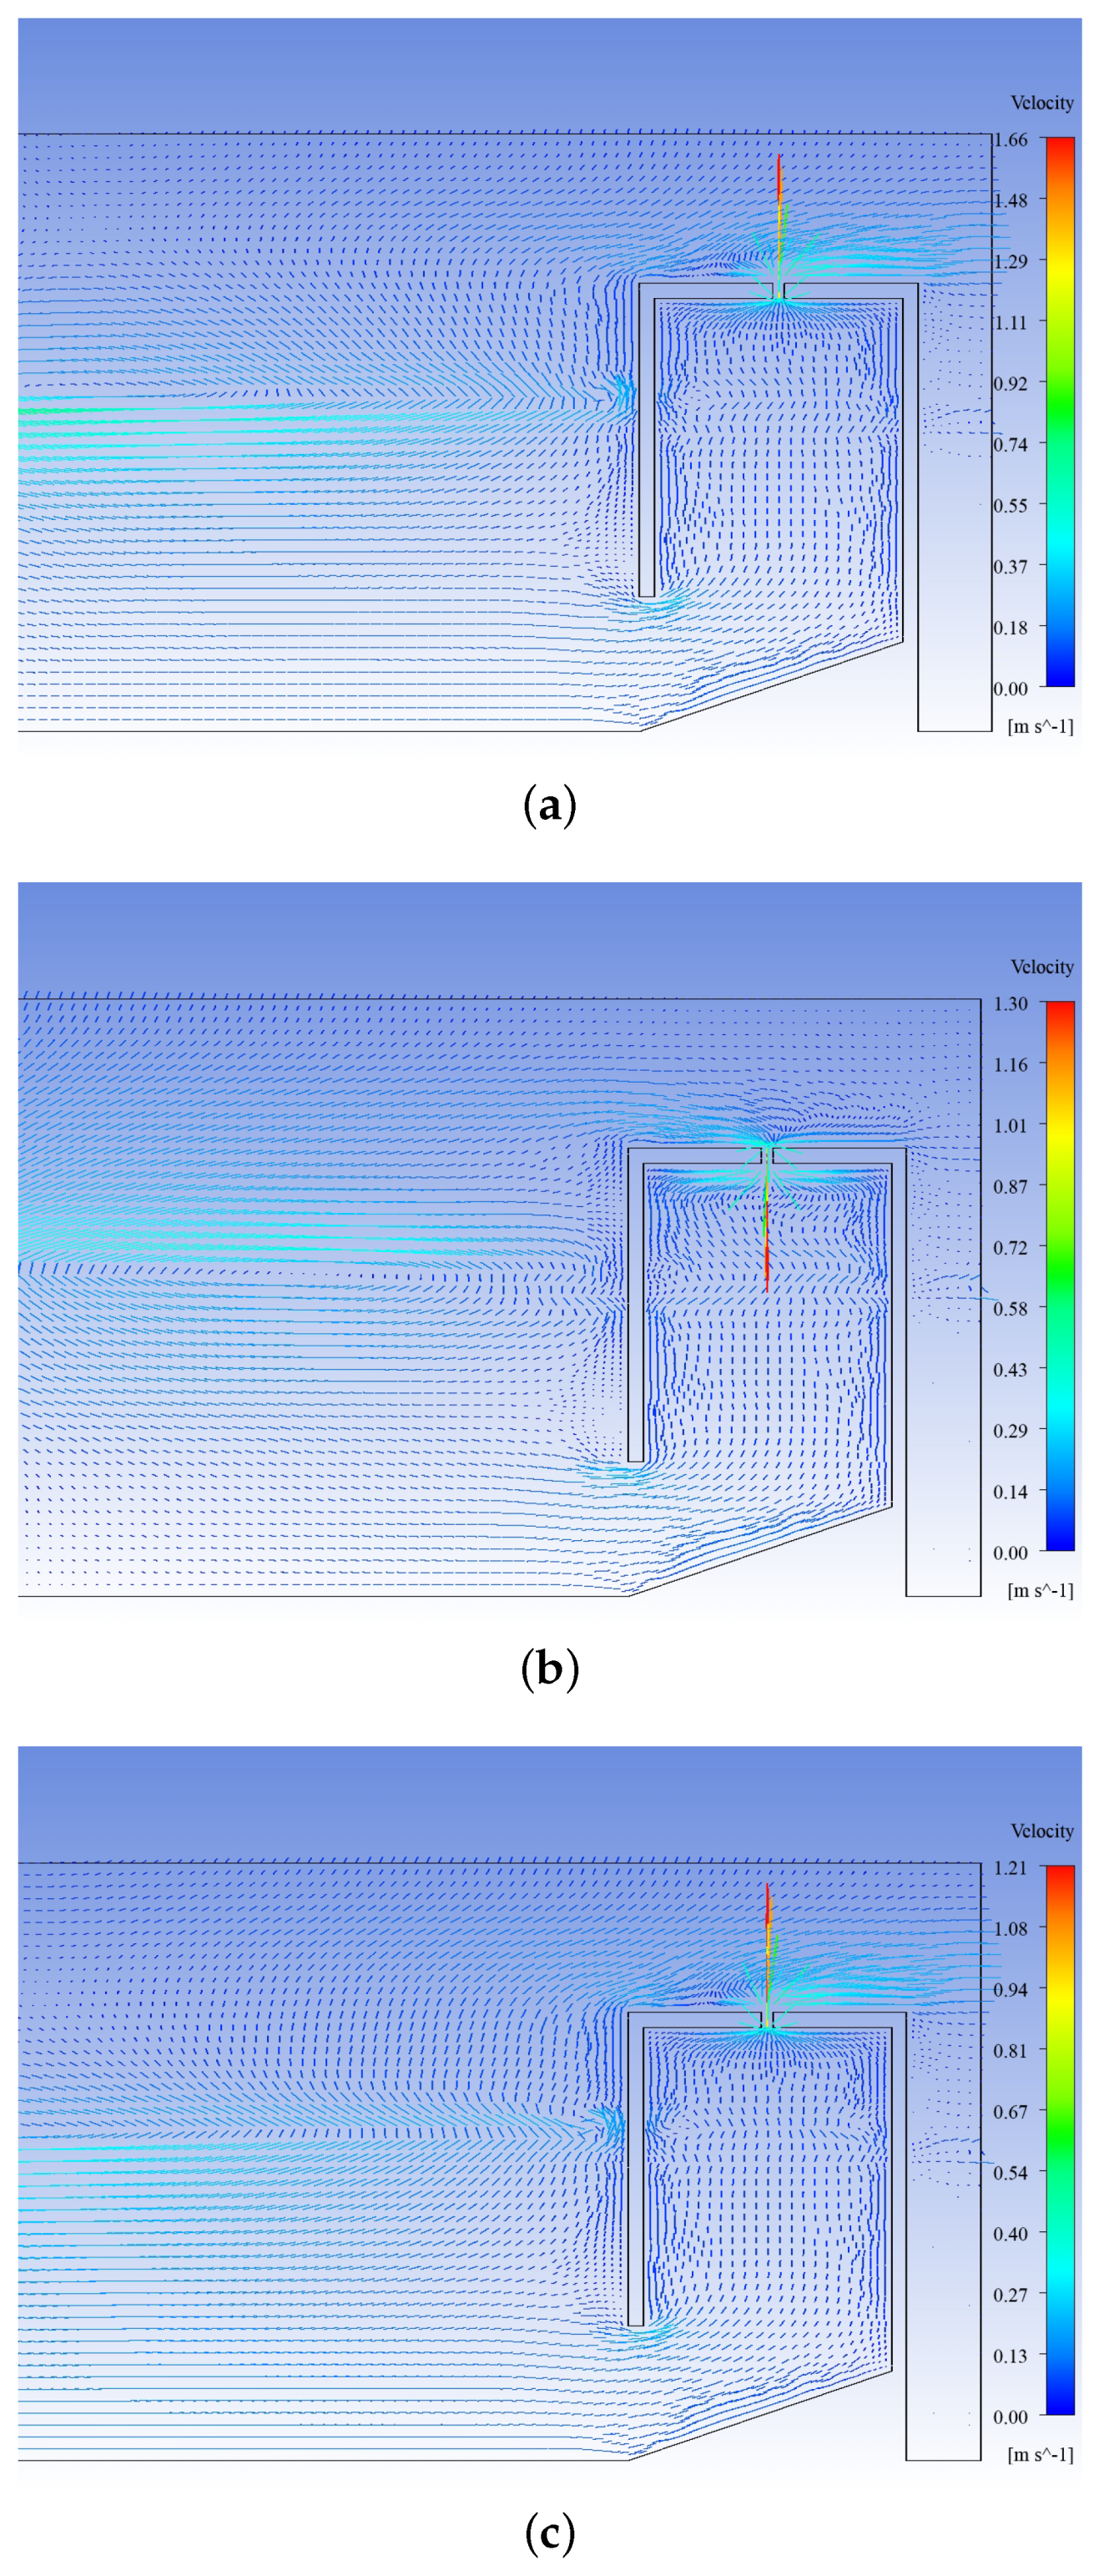
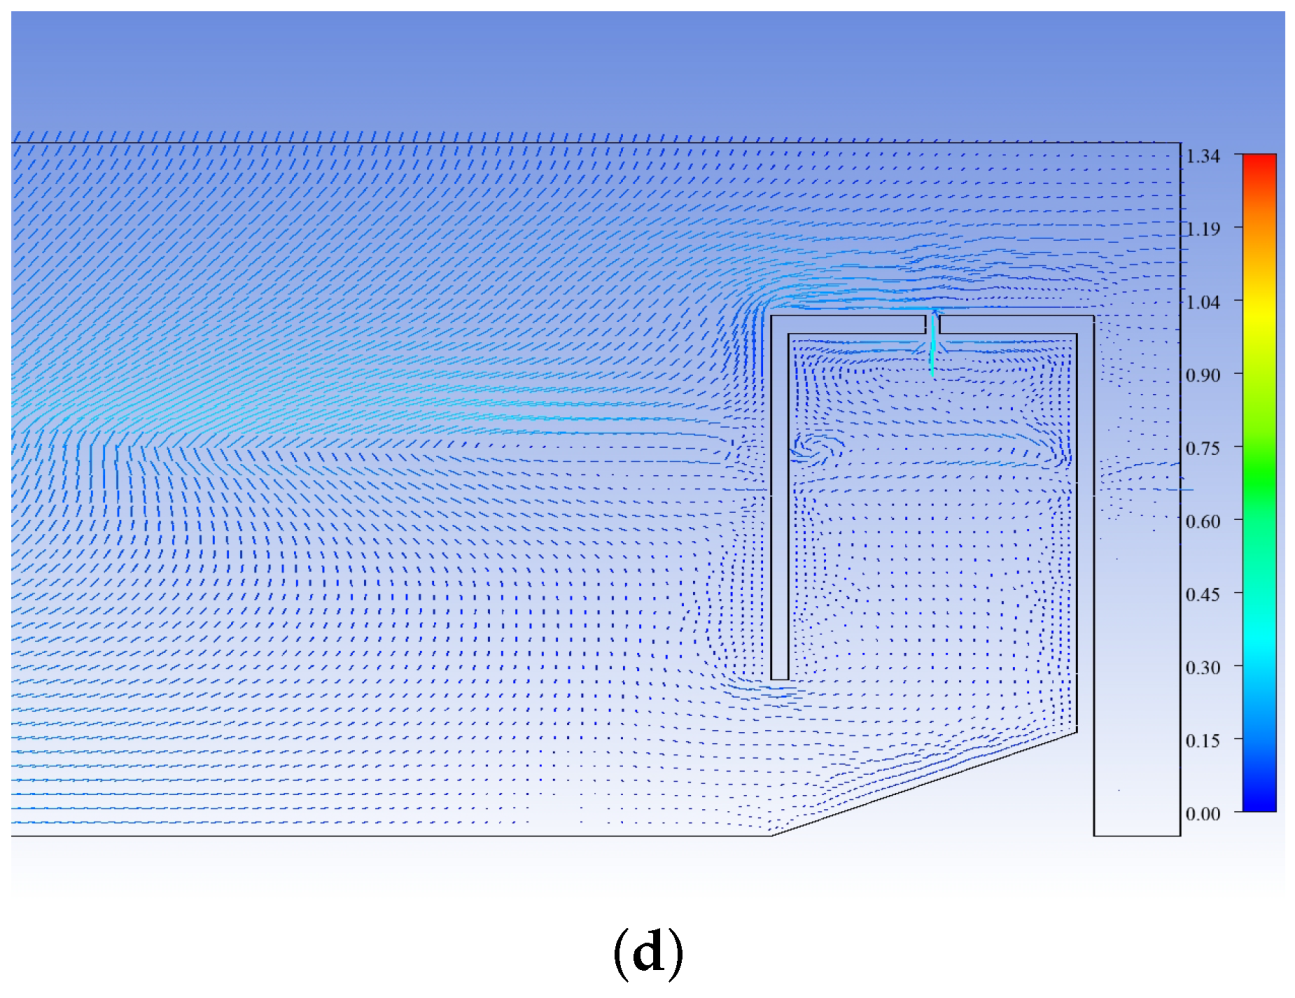
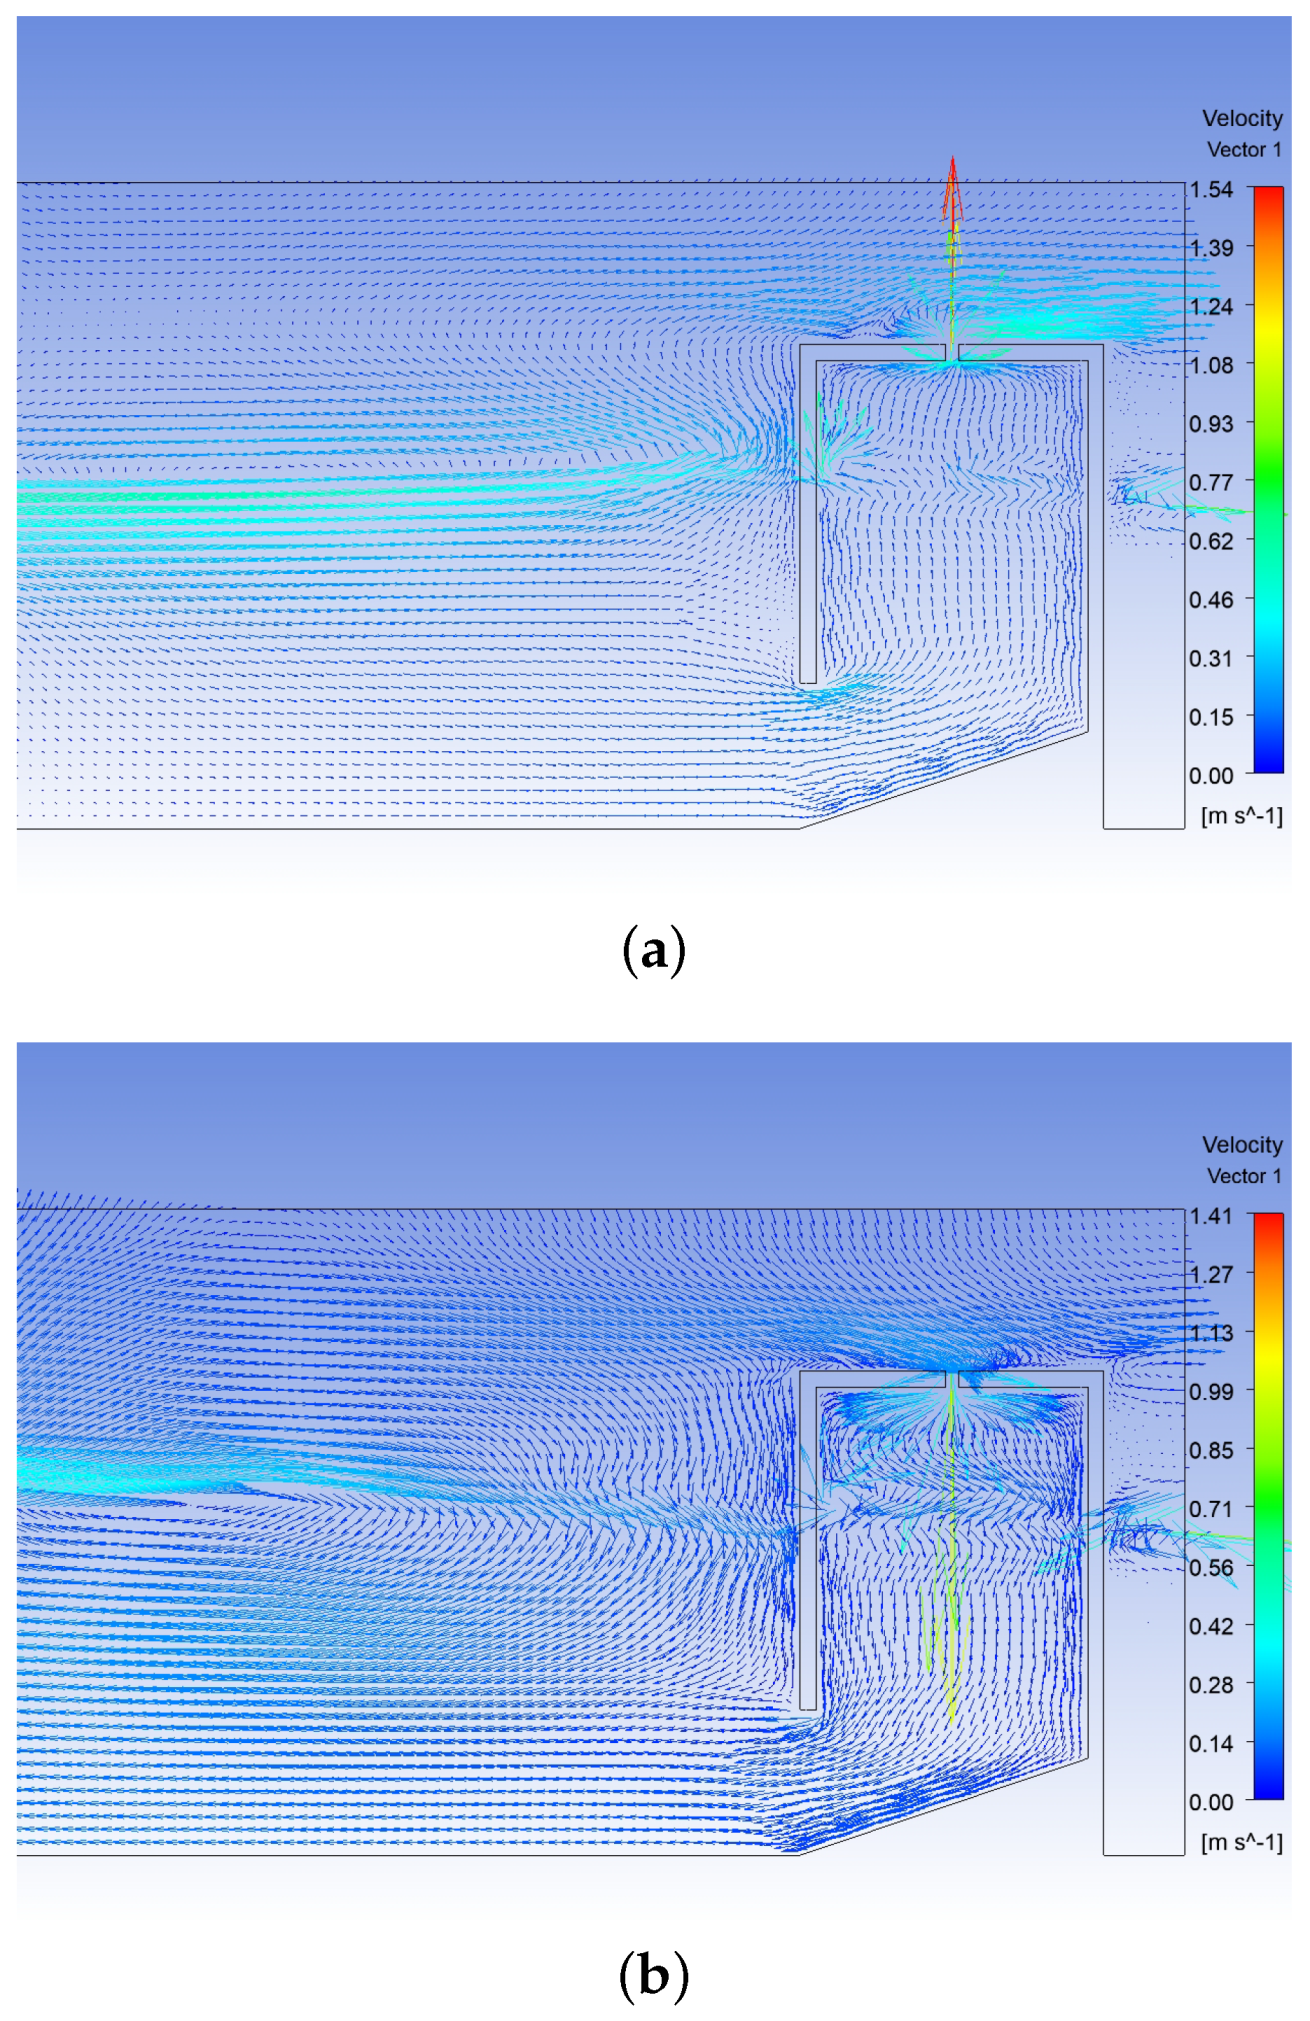
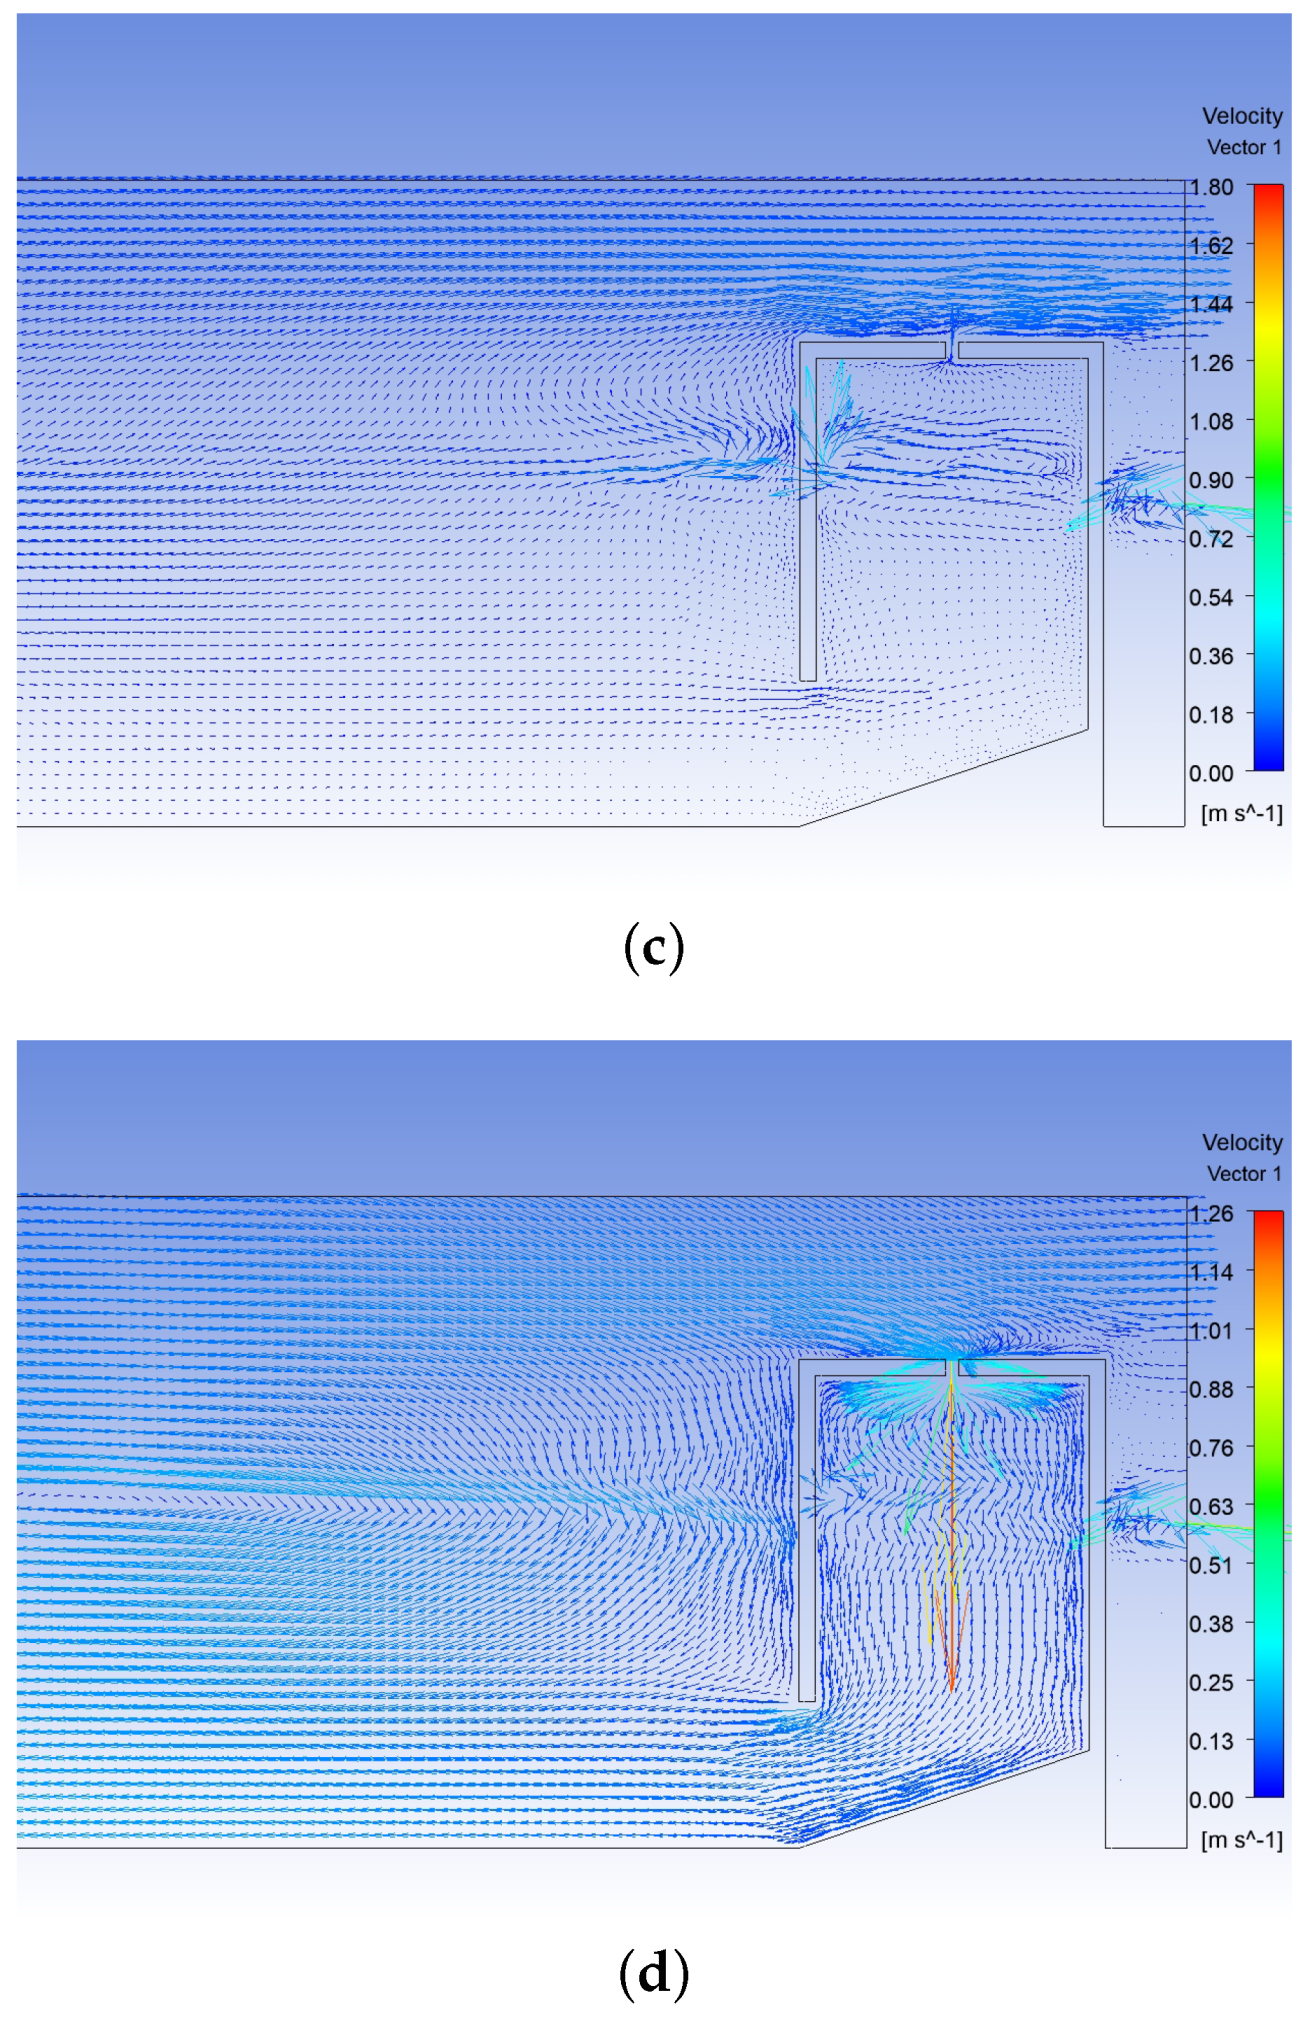
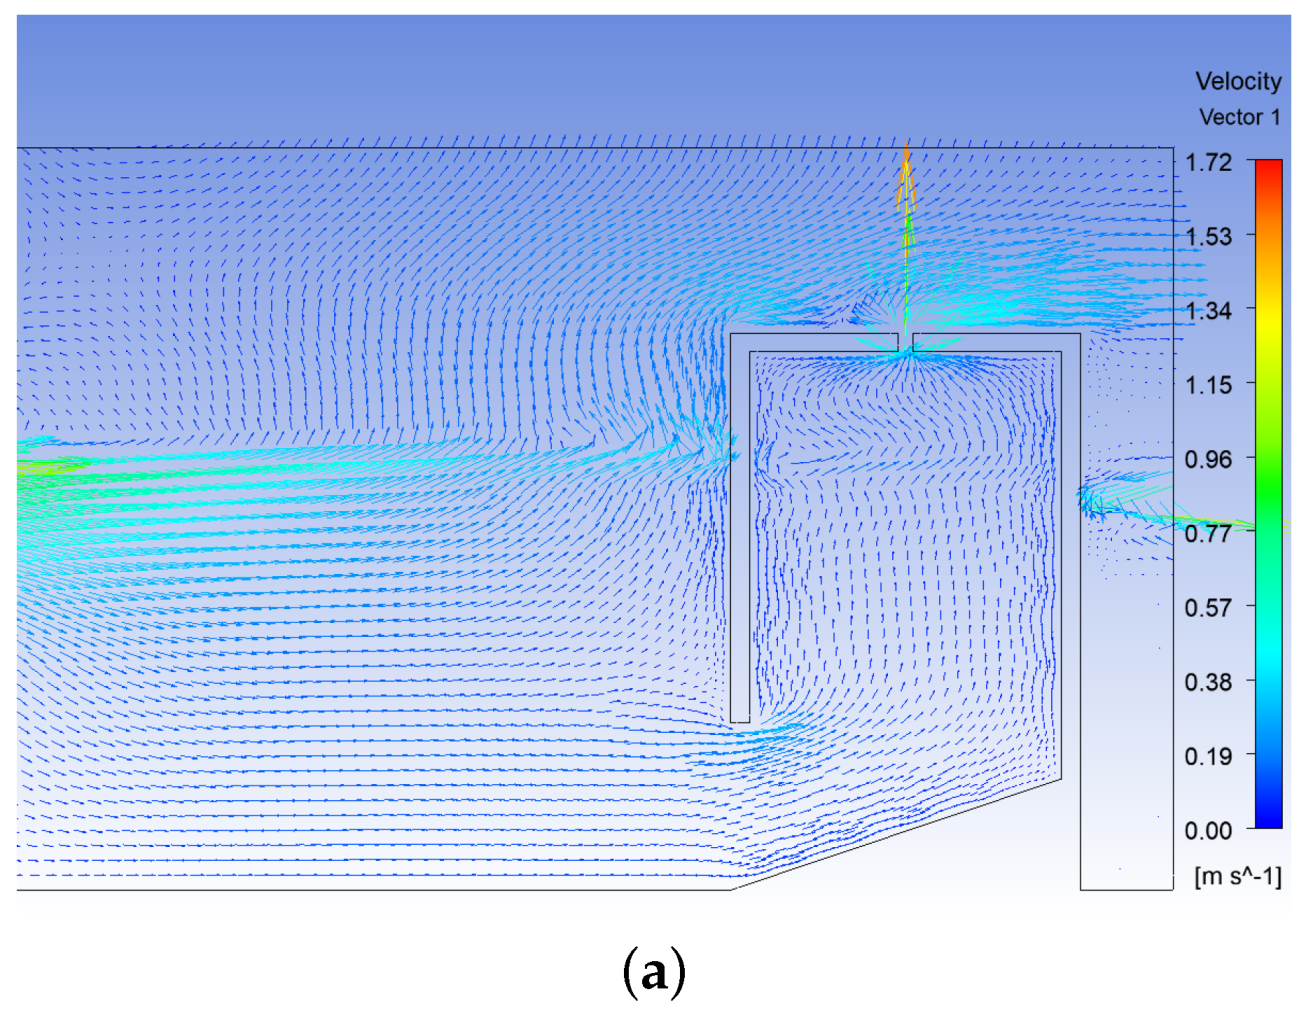
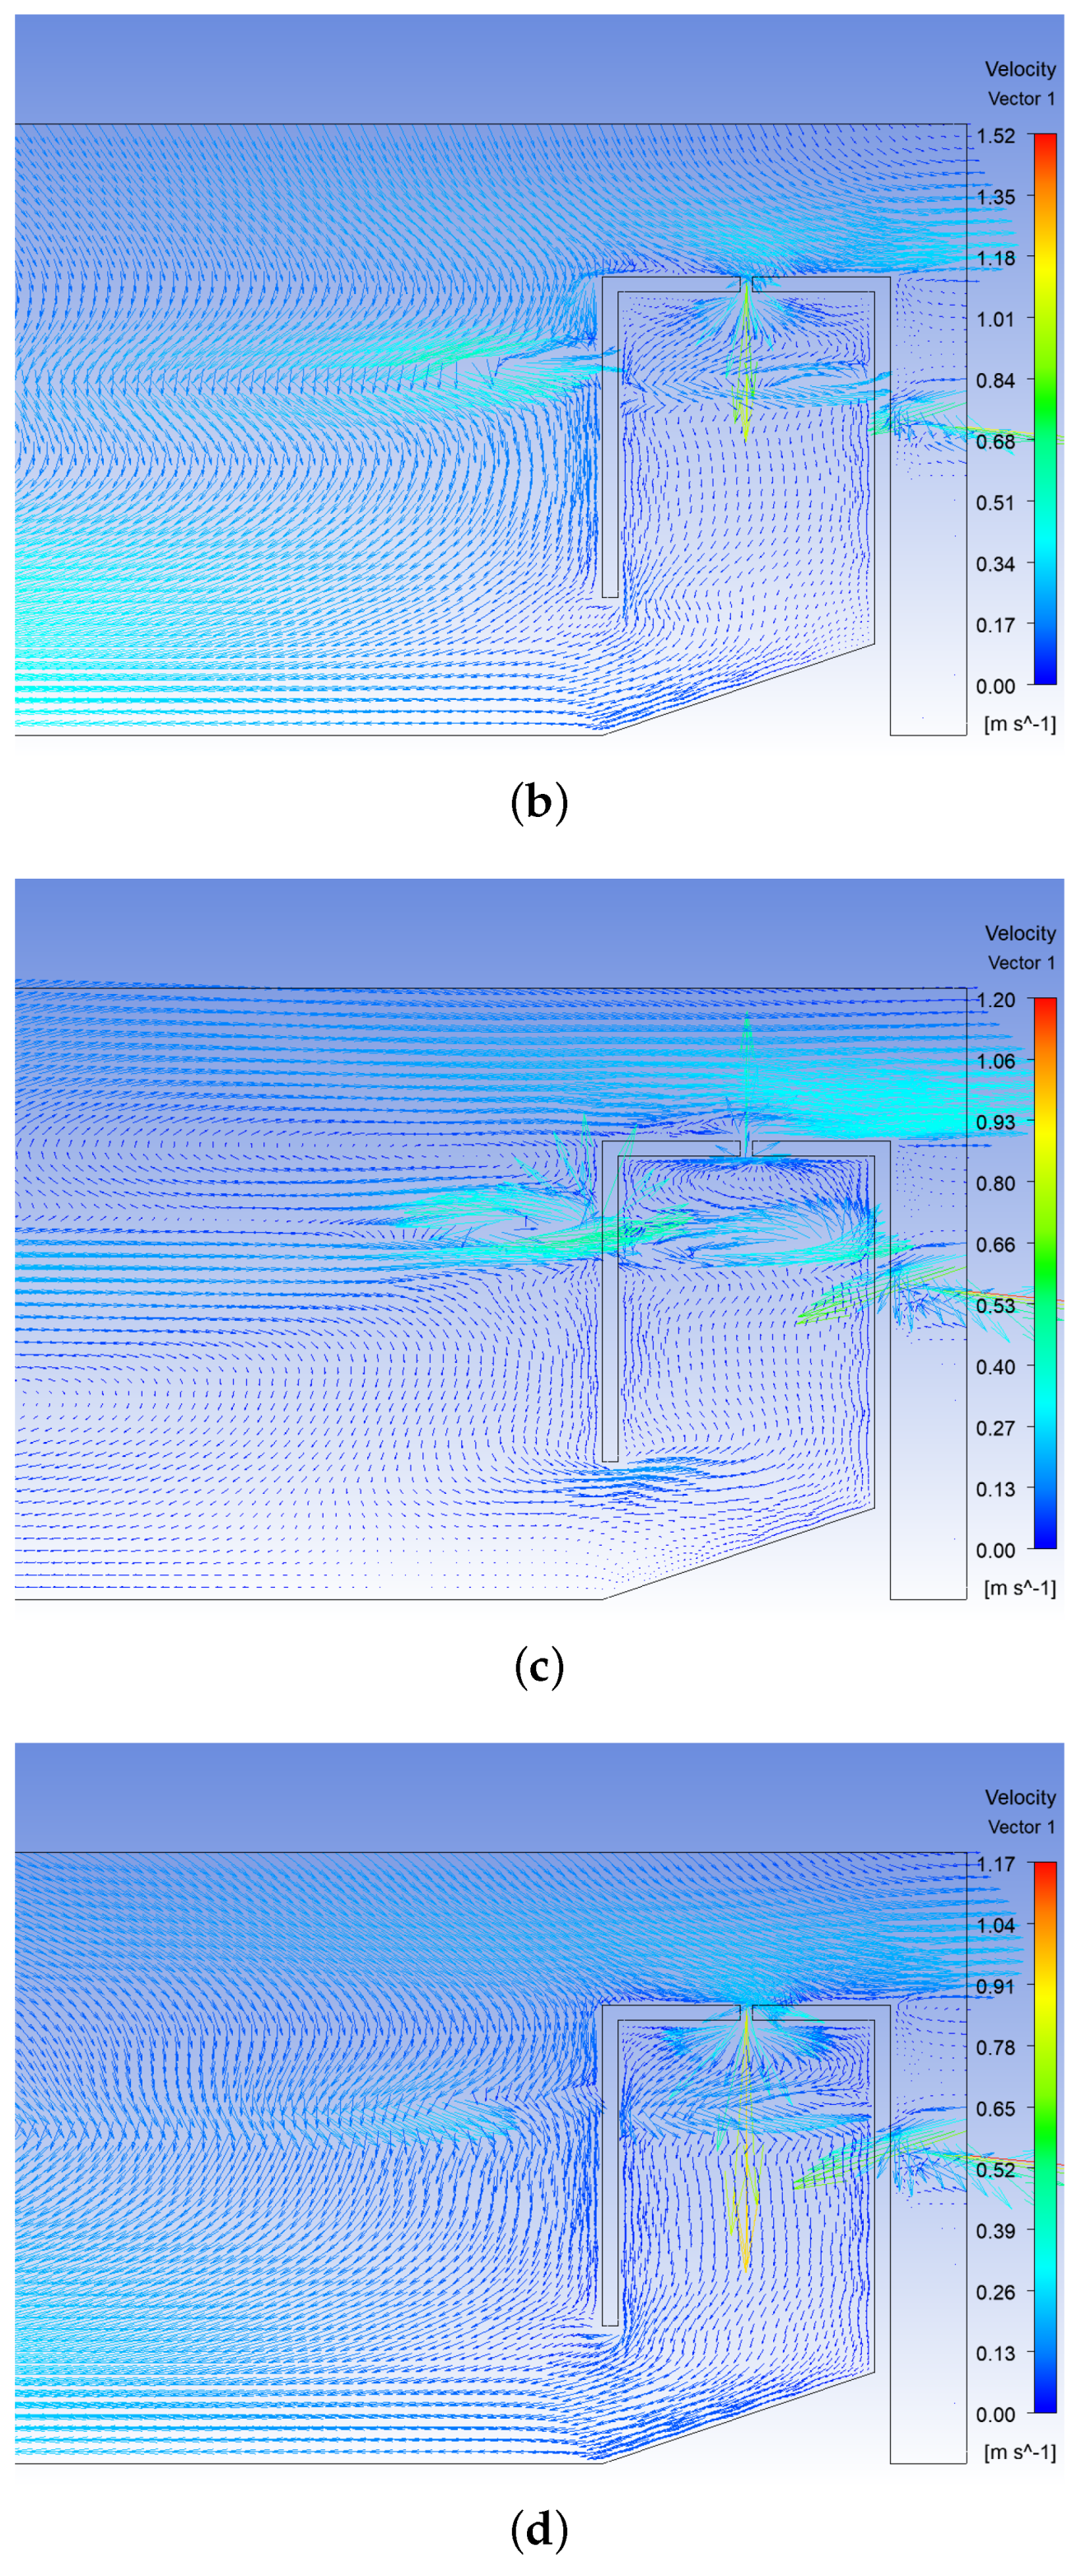
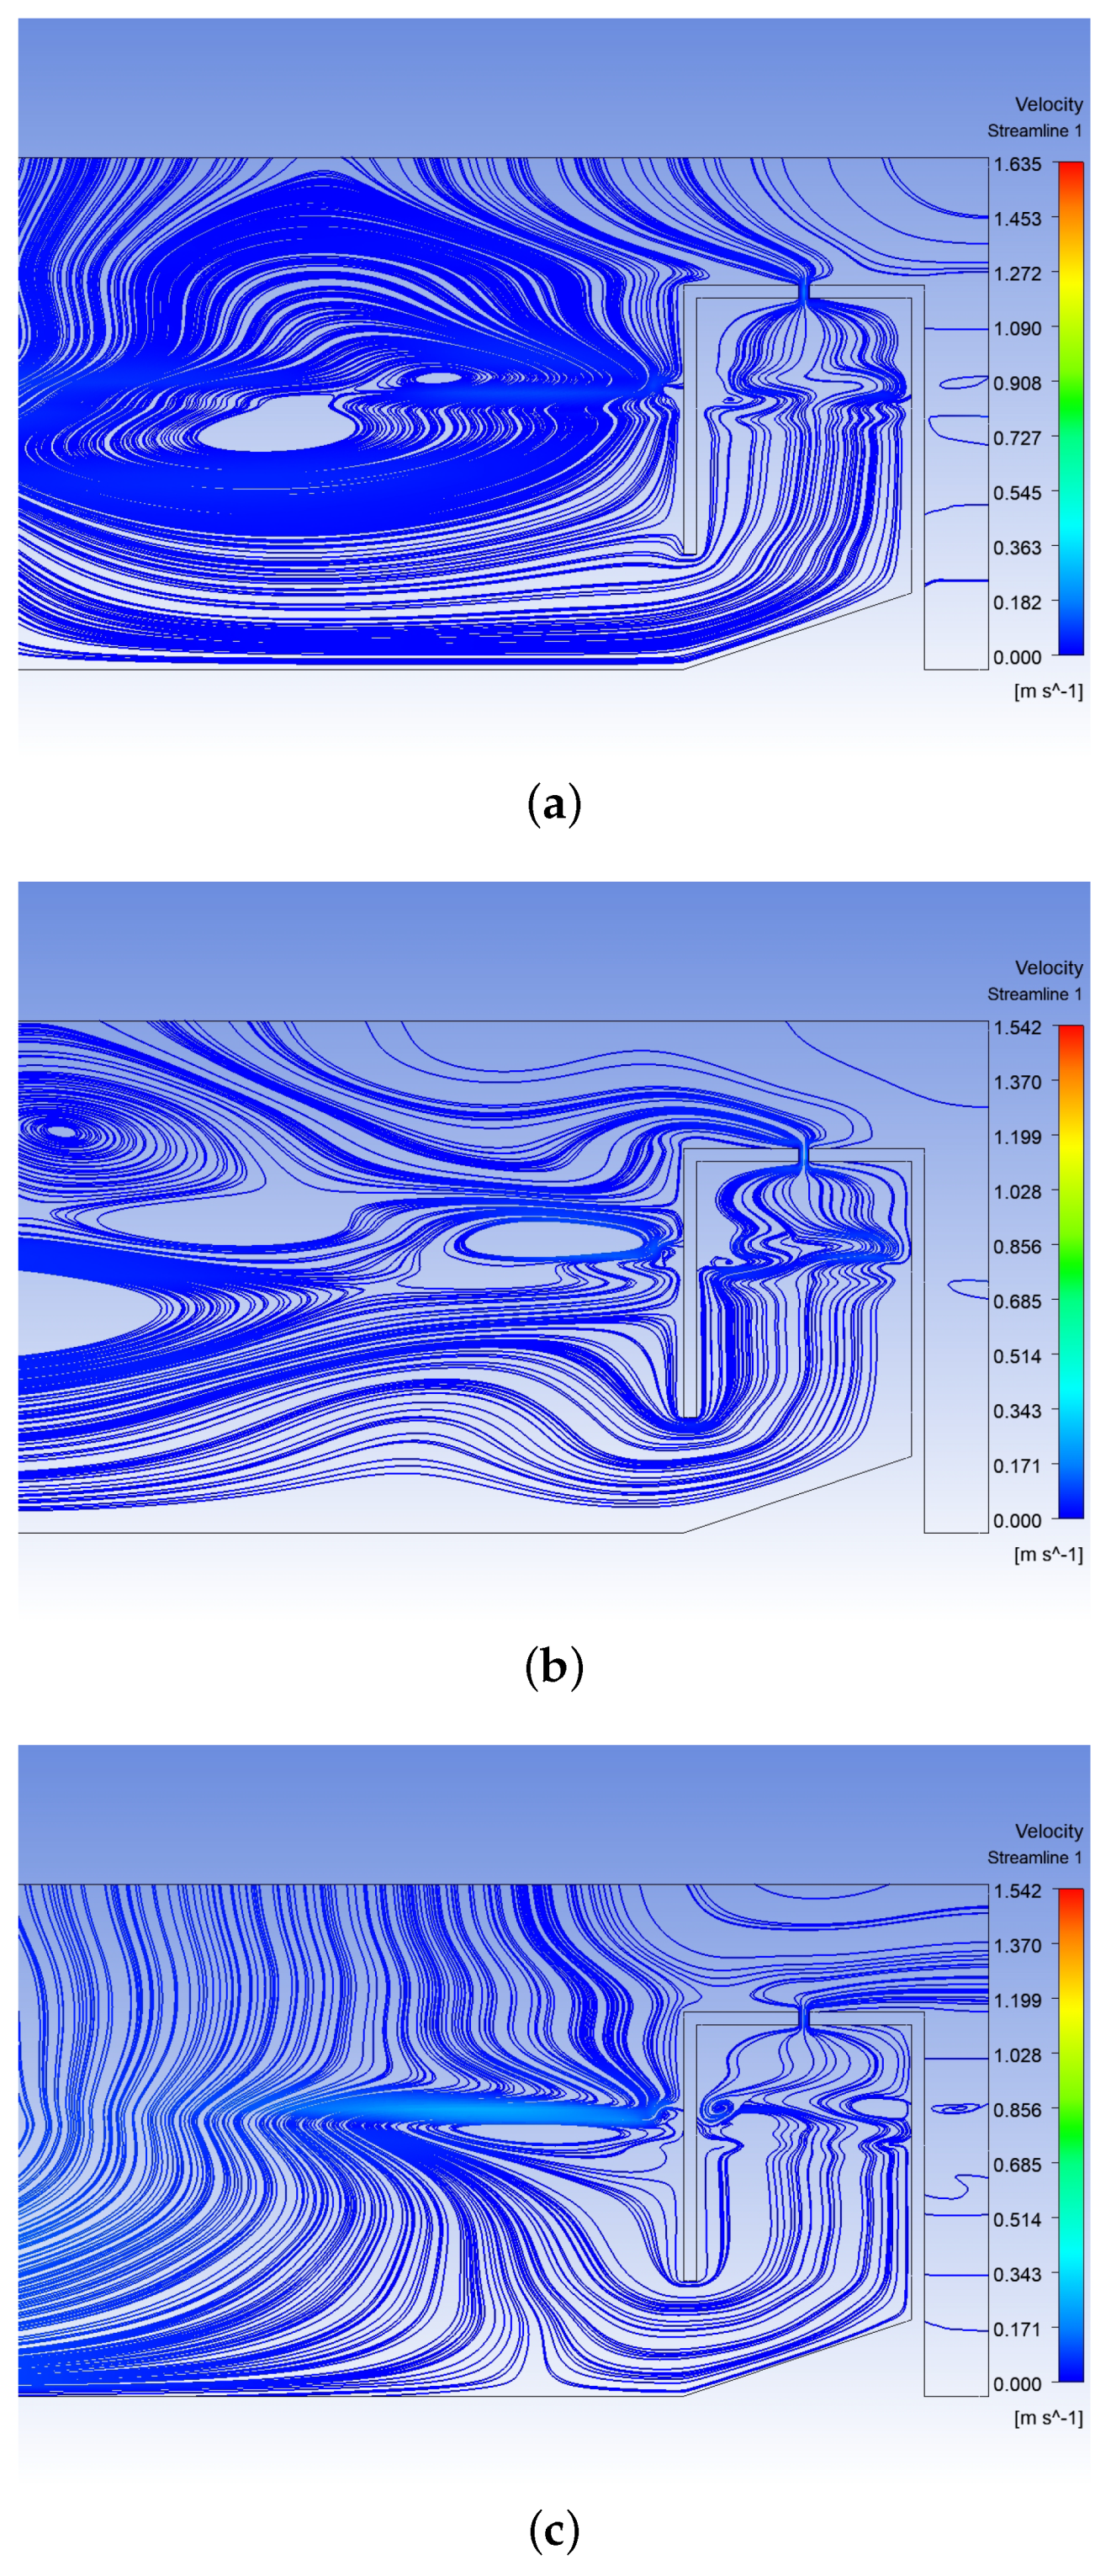
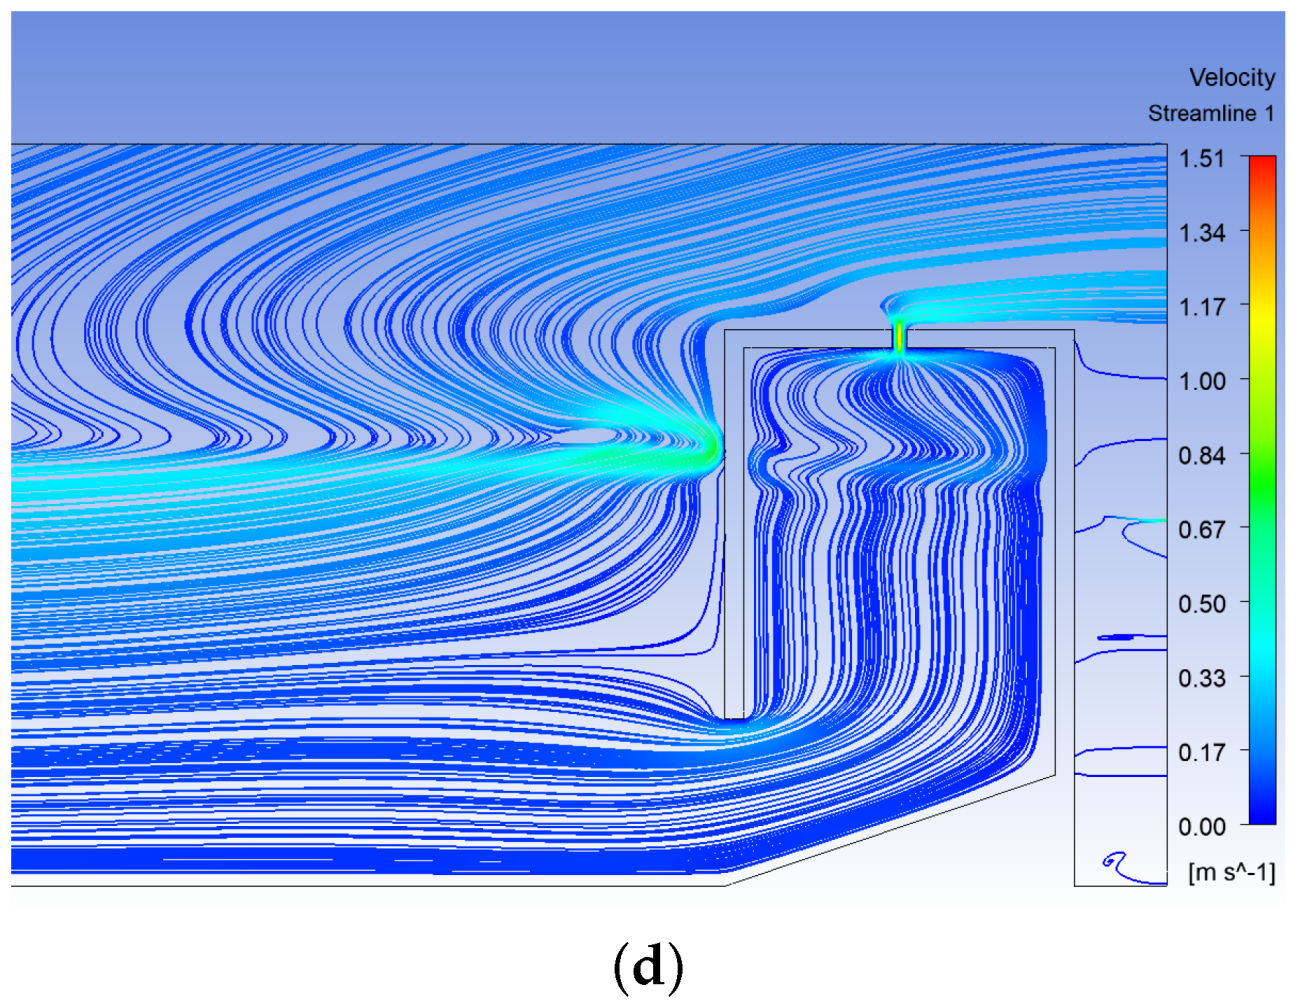
As the incident wave approaches the OWC device, some of its energy is reflected back after interacting with the front wall. The major part of the wave energy incident on the structure is trapped inside the chamber in the form of an oscillating water column. This oscillation of the water column inside the OWC chamber oscillates with maximum amplitudes at the resonating frequencies. The energy transformation from the incident waves into the water column motion involves mass and energy transport, which cannot be explained solely by assuming the oscillatory behavior of the free surface. As a result, it is interesting to investigate the flow patterns and the velocity profiles inside the OWC device’s chamber during an entire cycle of pressure fluctuation. The corresponding velocity vector profiles are presented in Figure 4, Figure 5, Figure 6 and Figure 7, and the streamlines profiles are shown in Figure 8, Figure 9, Figure 10 and Figure 11. It is to be noted that for each set of figures, different values of the significant wave height H s and peak frequencies ω p were used, as mentioned in the caption of each figure. In Figure 4, Figure 5, Figure 6, Figure 7, Figure 8, Figure 9, Figure 10 and Figure 11, the velocity vector profiles and streamlines of the fluid (both air and water) are provided at various instants of time. It is observed that swirling motion in the fluid flow occurs at the tip of the front wall, inside the chamber, and near the front wall surface. A similar observation was found in [39]. The creation of these vortices is most likely one of the causes of energy dissipation during the wave-energy-capture process. The vortices near the front wall occur due to the mutual interaction between the incident and the reflected waves. On the other hand, the vortices at the tip of the front wall occur due to the sharp tip edge of the front wall where the singularity of the flow occurs. Further, the vortices occur within the chamber due to the to-and-fro reflection of the waves by the OWC front and back walls. The velocity vectors in Figure 4, Figure 5, Figure 6 and Figure 7 provide a generalized representation of the velocity field distribution among fluid particles. Further, it is demonstrated that the fluid particles having significantly lower velocity magnitudes are dispersed in various directions. In contrast, particles with higher velocity magnitudes are positioned in a single direction near the orifice of the OWC device’s top wall. A similar observation was reported by [31]. In addition, it is seen that the velocity fields have a higher magnitude in the PTO region due to the presence of the narrow orifice. On the other hand, the streamlined profiles in Figure 8, Figure 9, Figure 10 and Figure 11 depict the formation of vortices at different locations during a fixed time instant. The highly rotating flow field within the chamber arose due to the energy transfer from the water column to the air. Thus, the vortices’ formation can be observed in almost every time instant in the air phase, whereas vortices near the front wall can be observed in only a few cases. The reason for the same is already provided in the [31]. Further, Figure 4, Figure 5, Figure 6 and Figure 7 reveal that with time, an apparent alternatively inward and outward flow of air occurs at the orifice of the device. In addition, it is also seen that the inward and outward velocities through the orifice in Figure 7 are higher than those in Figure 4, Figure 5 and Figure 6. This is because the significant wave height H s is higher in Figure 7 than Figure 4, Figure 5 and Figure 6.
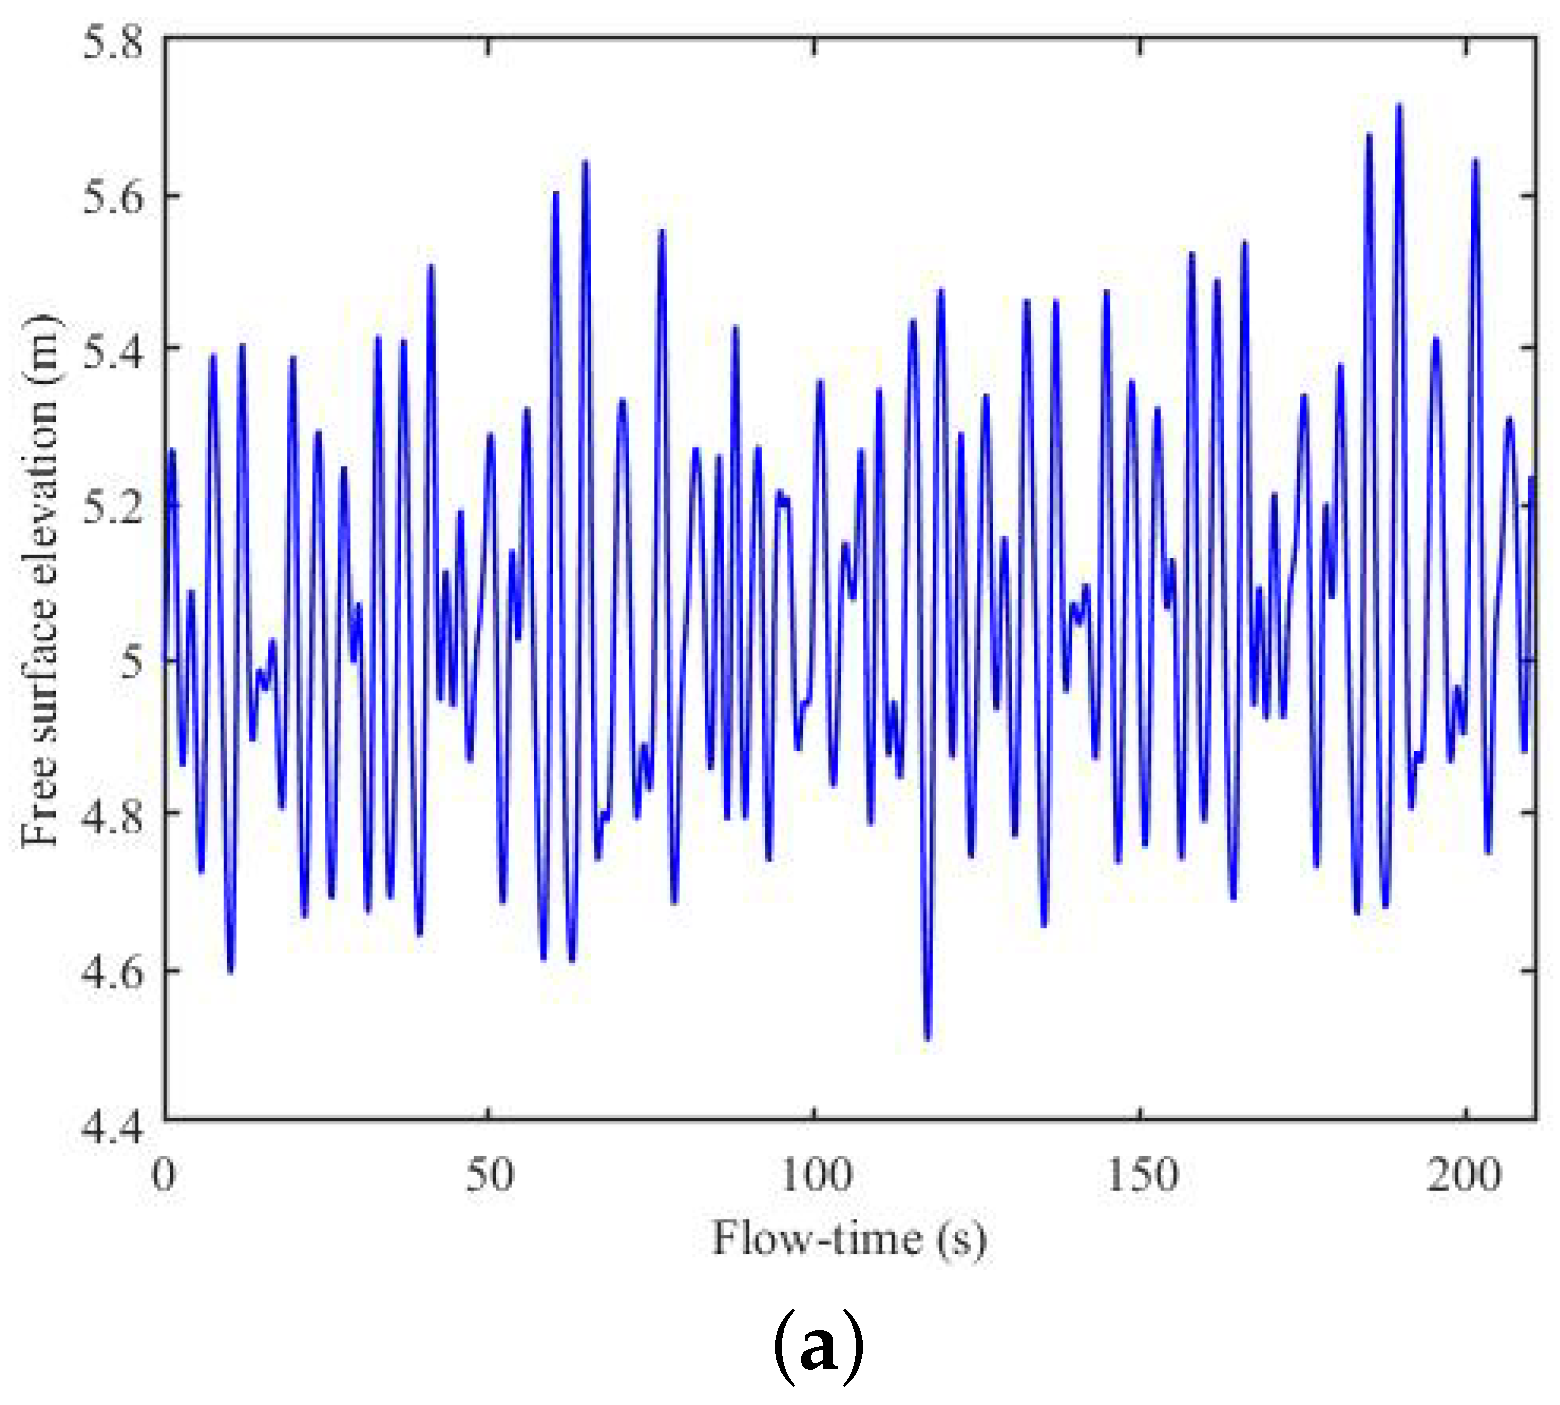
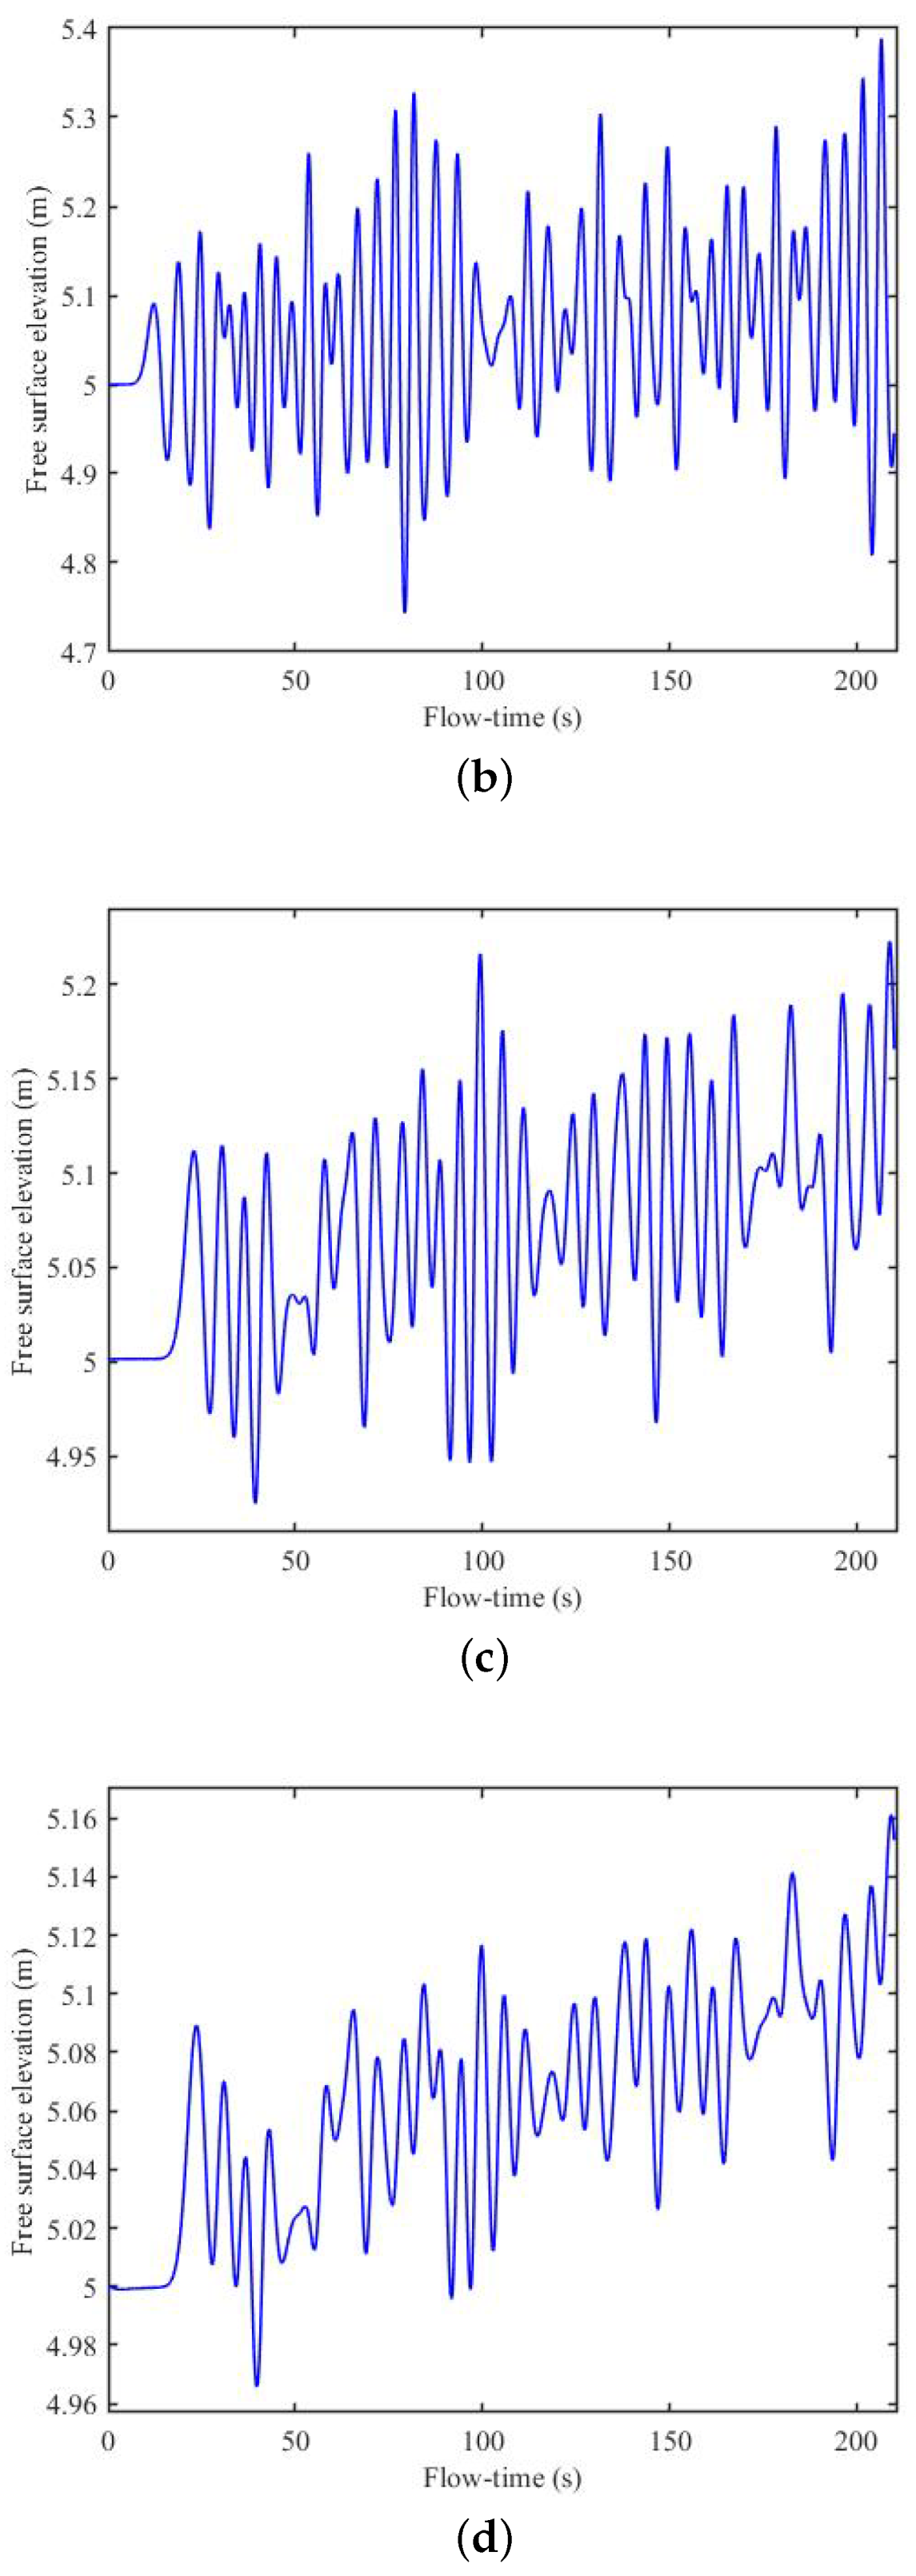
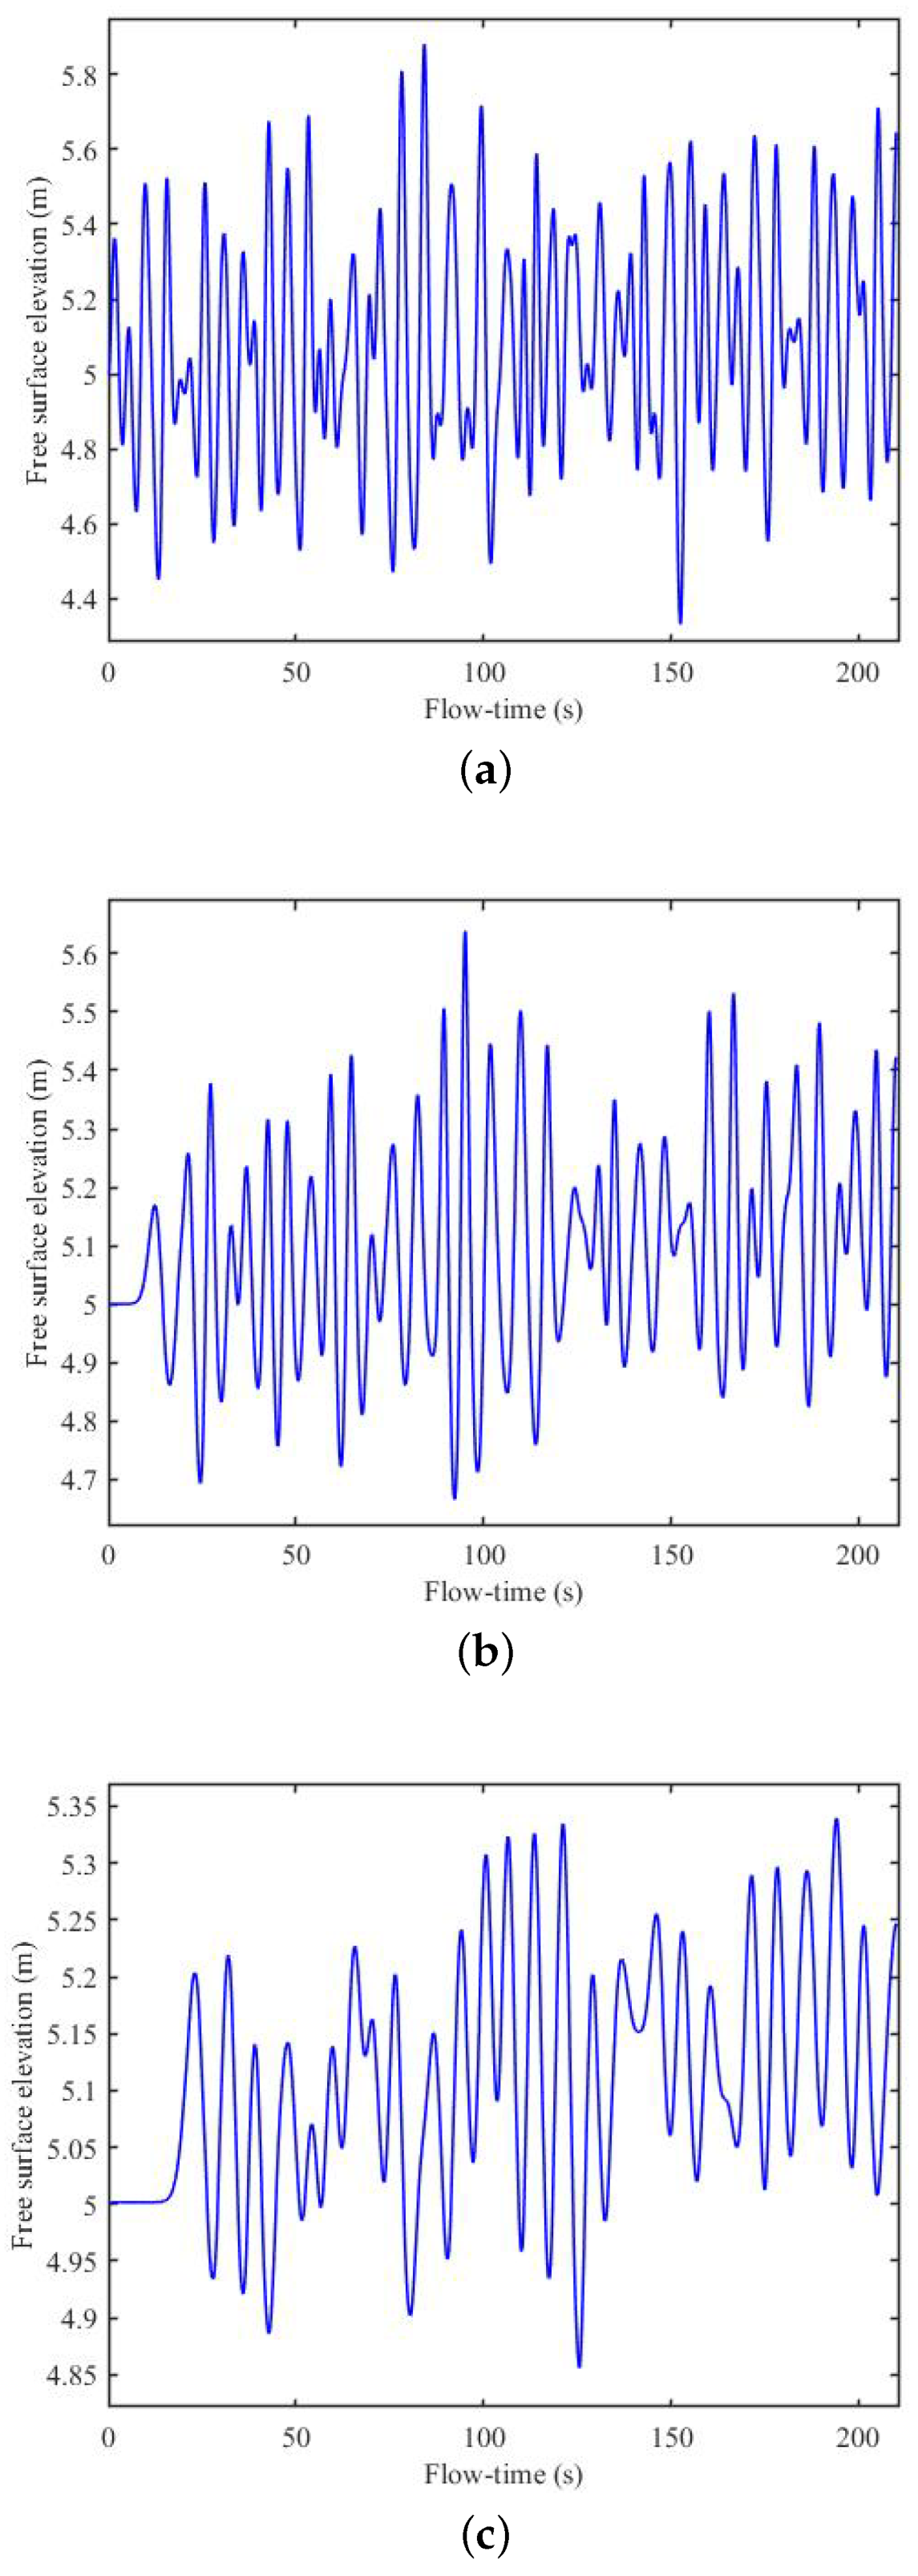
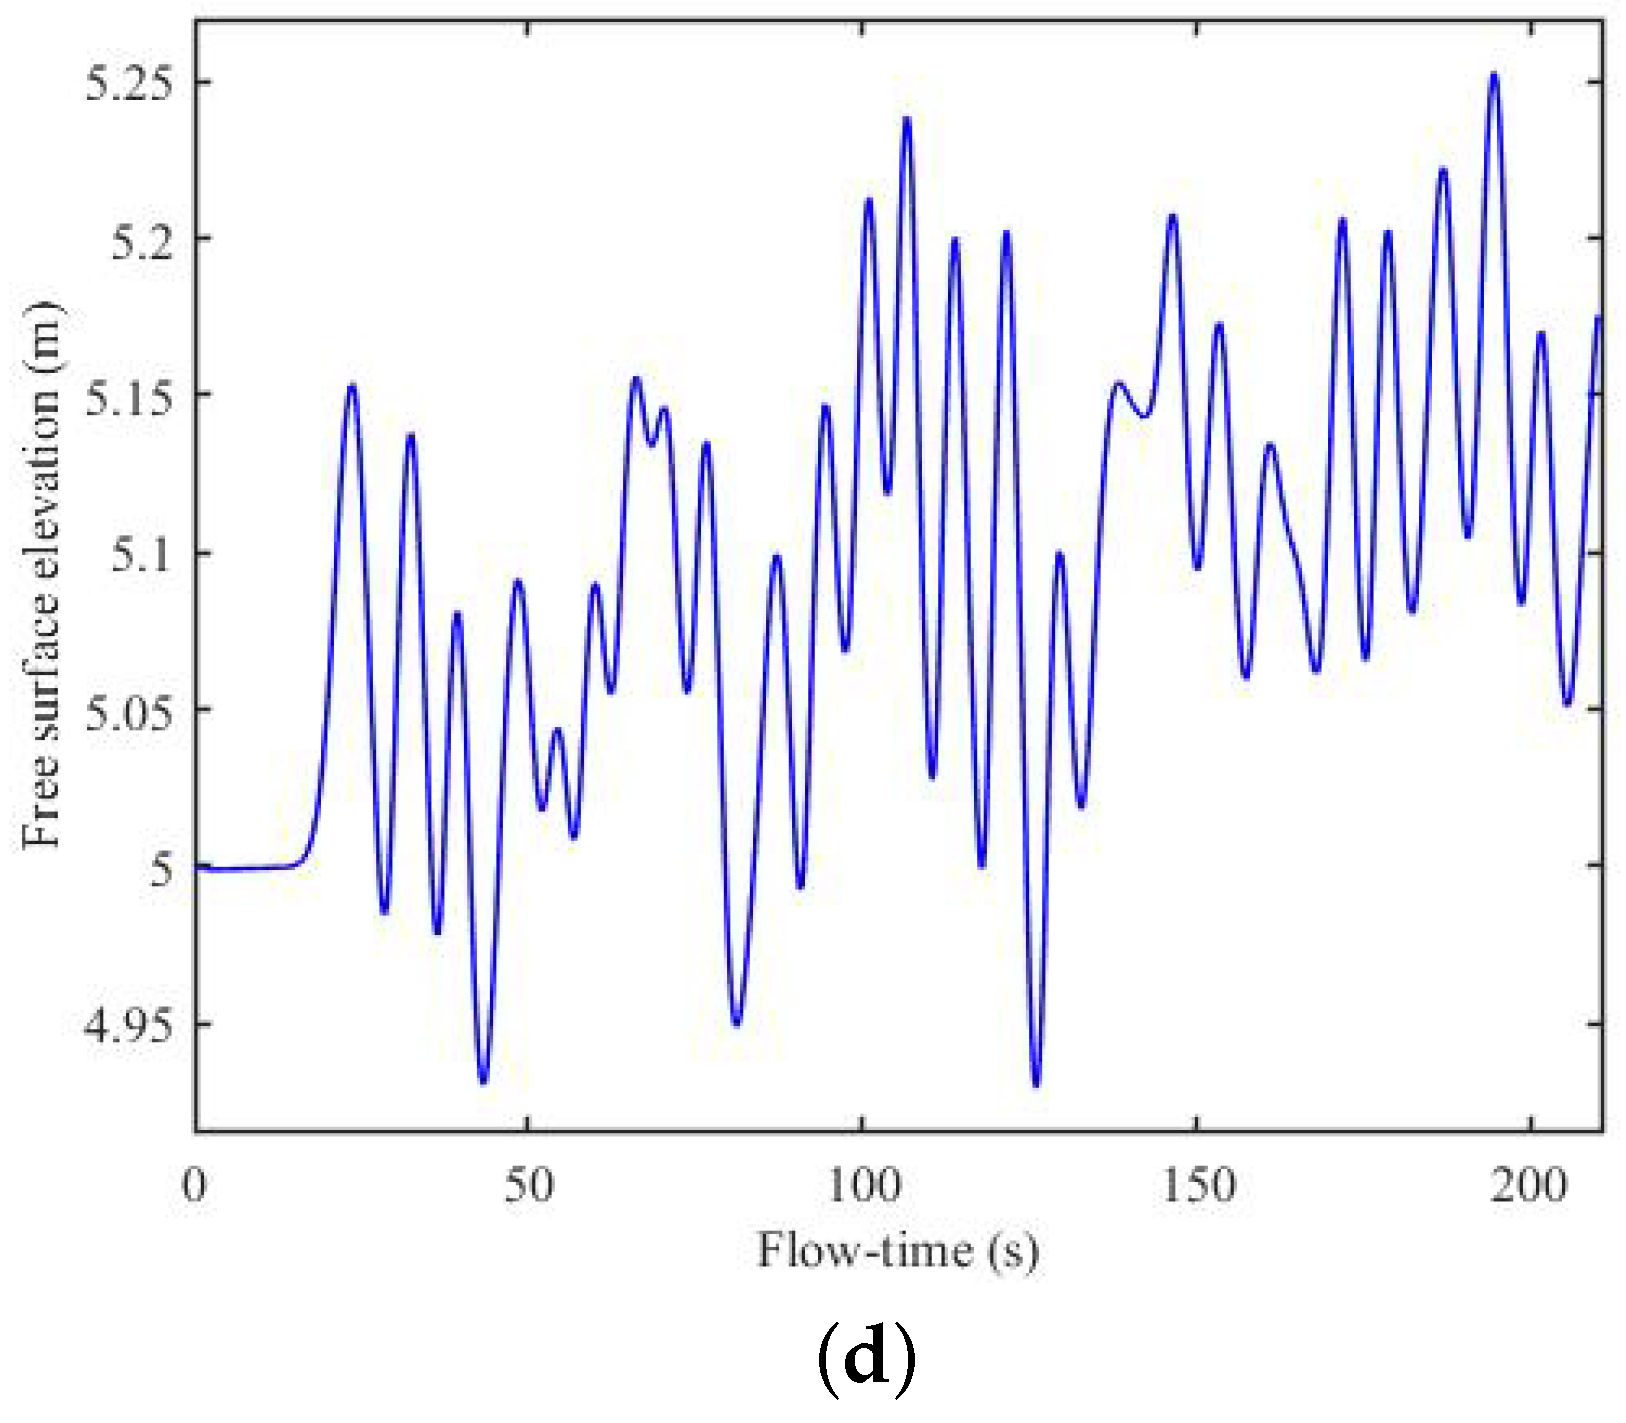
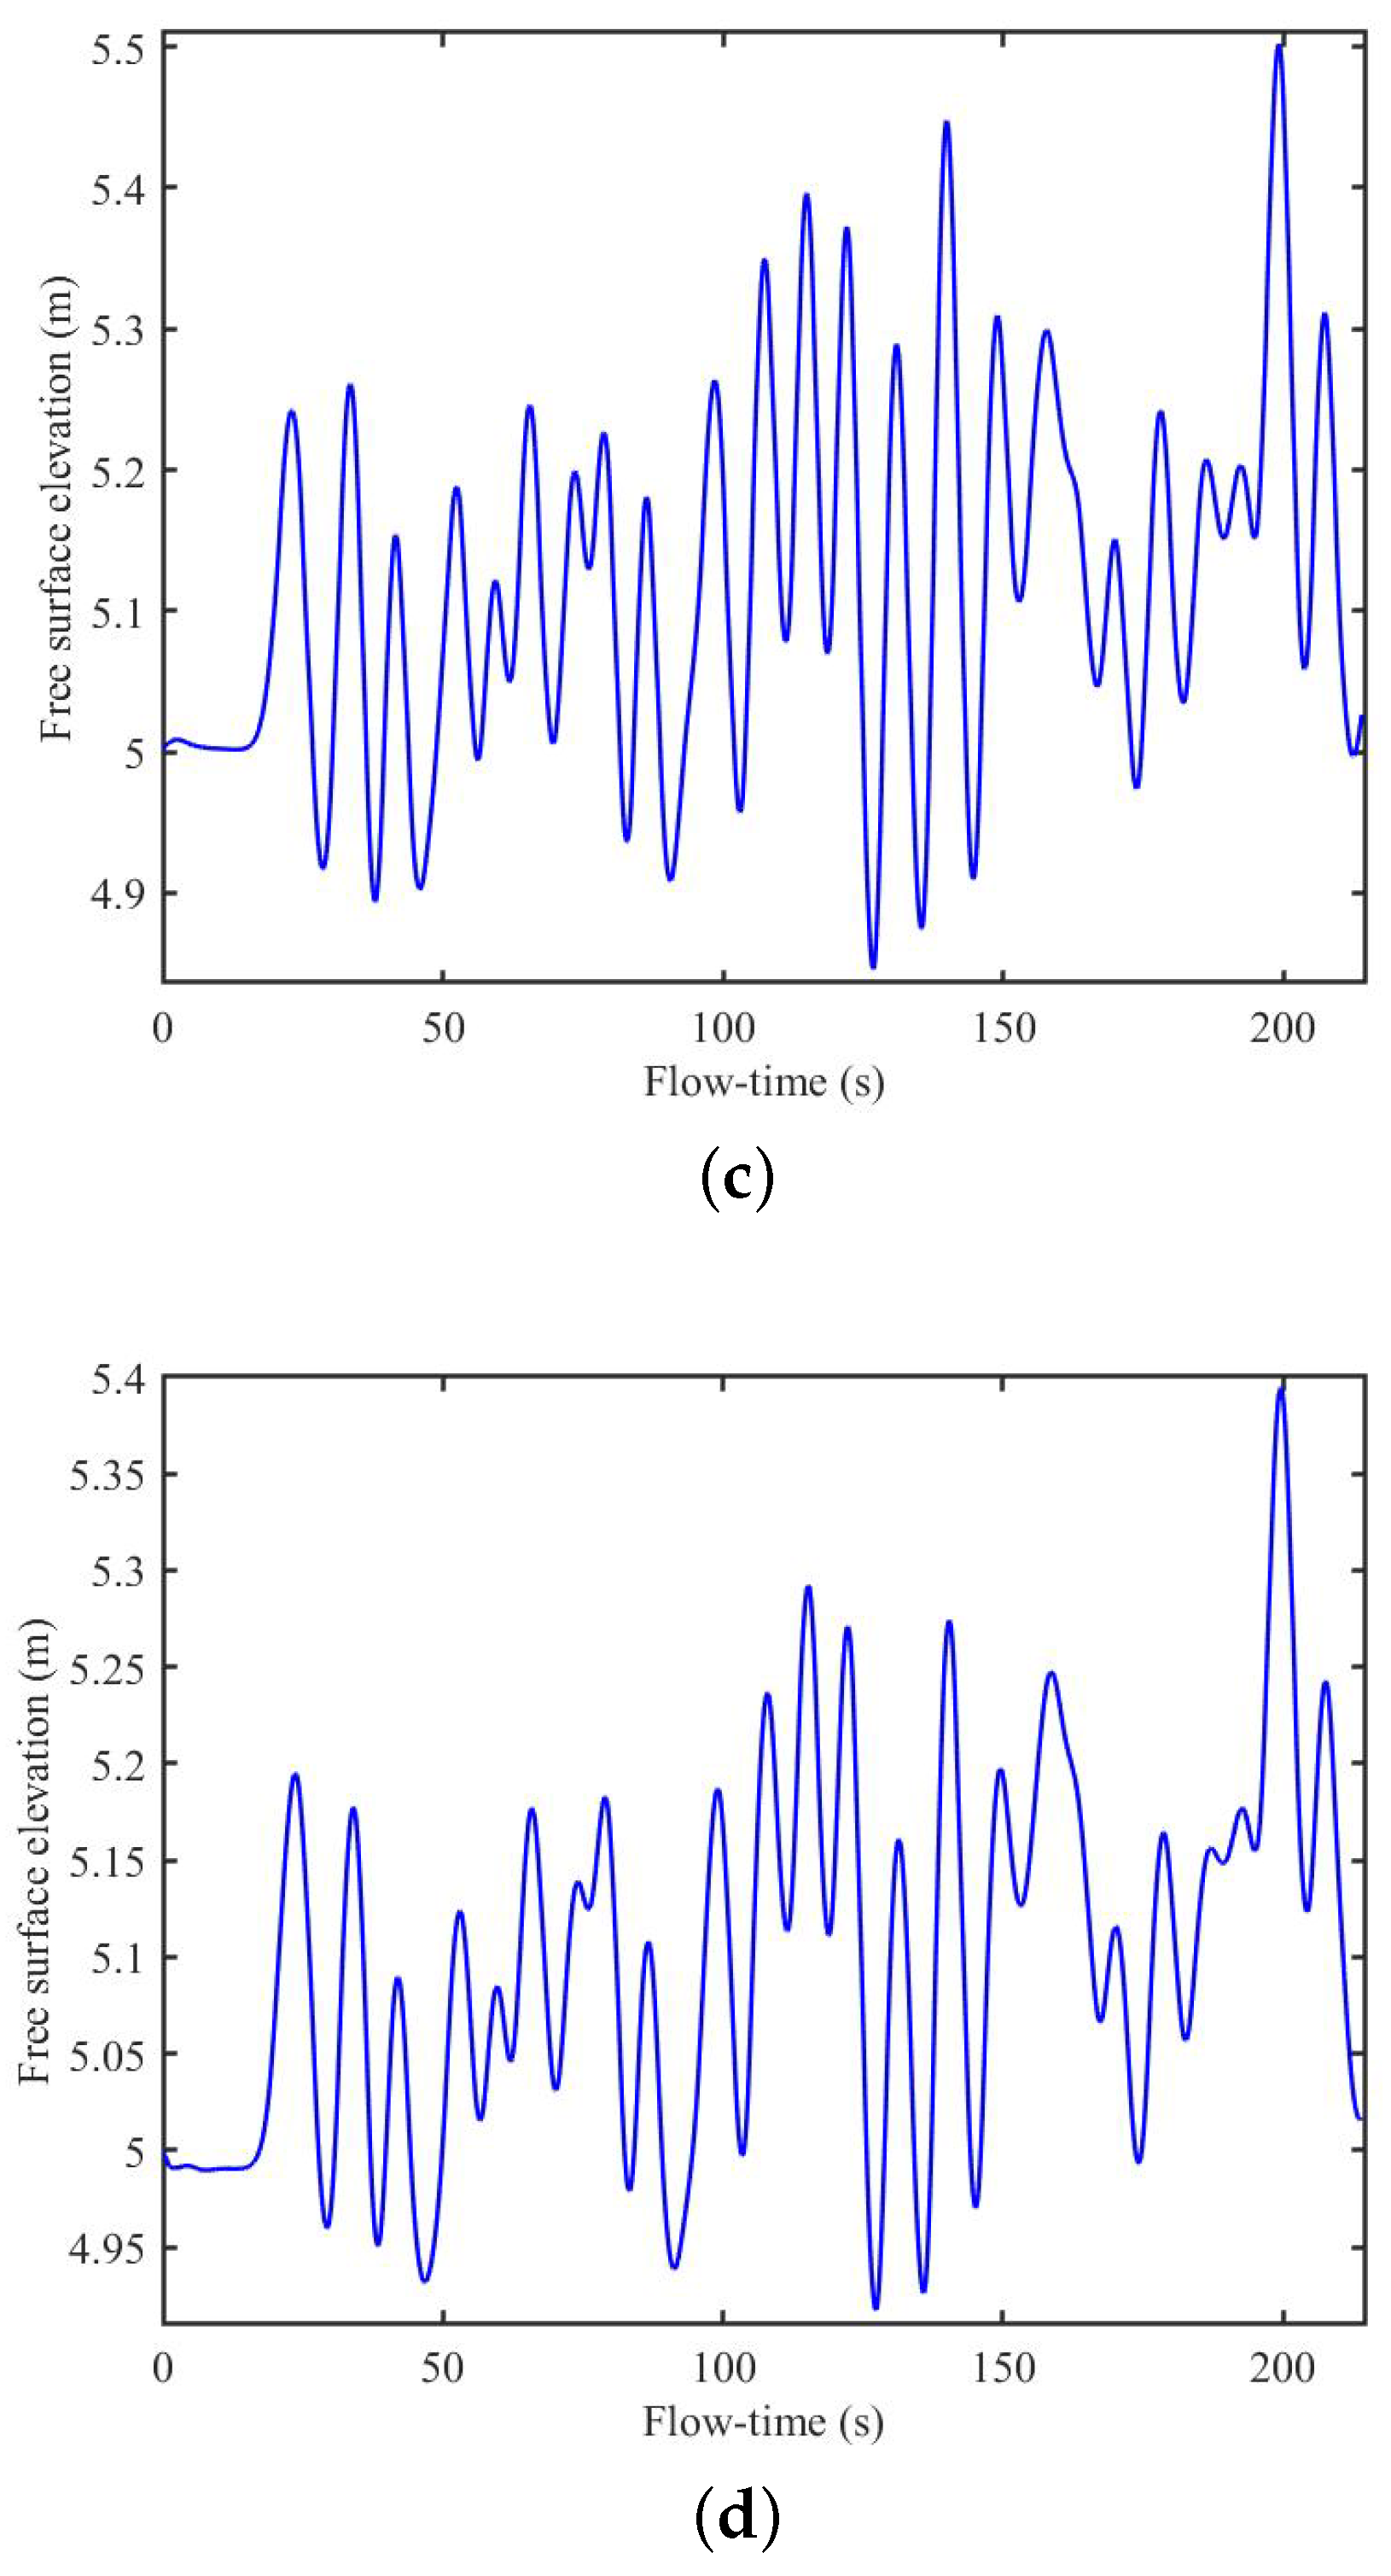
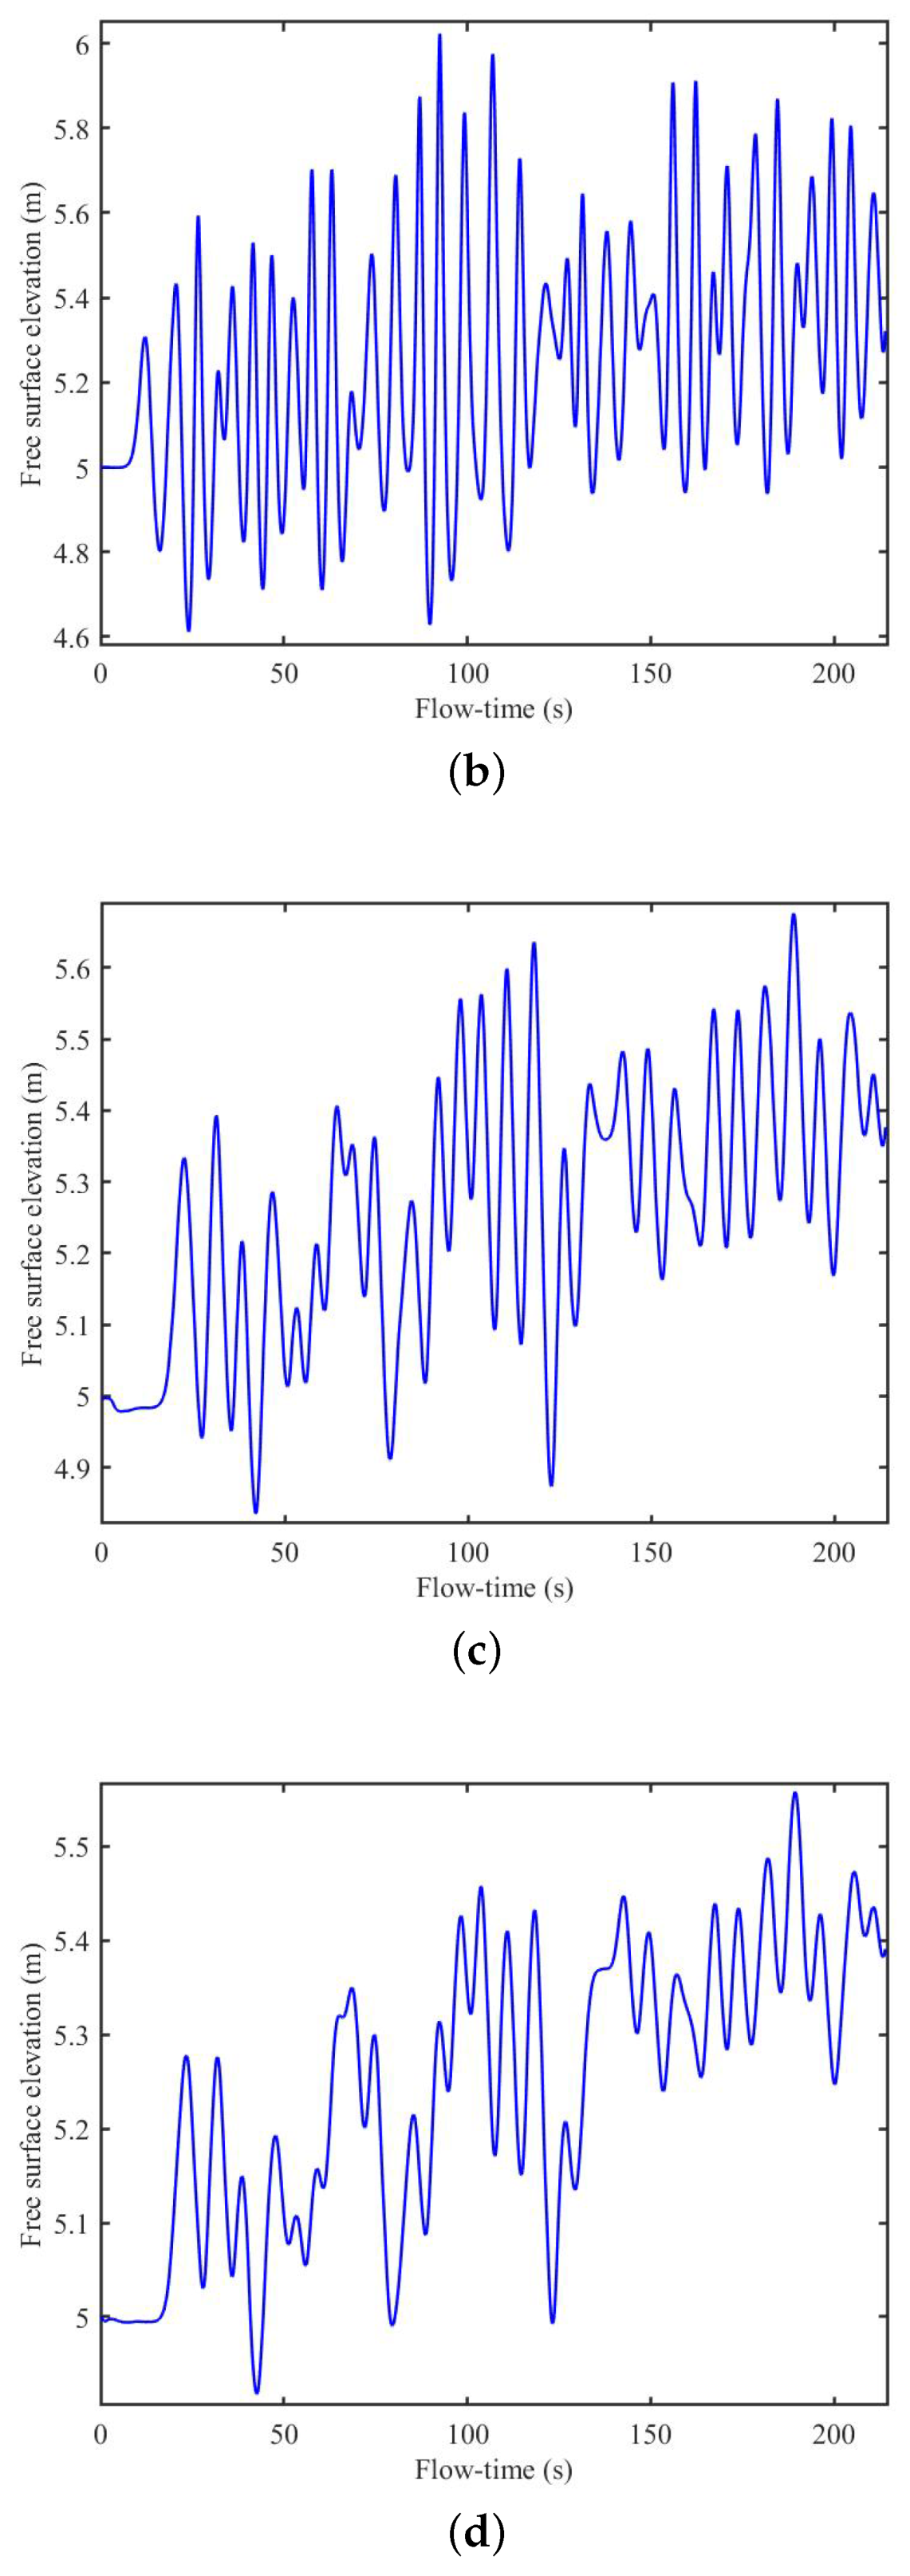
Figure 12, Figure 13, Figure 14 and Figure 15 demonstrate the variation in free-surface elevation at different locations: (a) x = 0.5 m, (b) x = 72.025 m, (c) x = 143.5 m, and (d) x = 146.4 m, as a function of flow time. Figure 12, Figure 13, Figure 14 and Figure 15 depict that the variations of the free-surface elevations follow a highly oscillatory pattern. Further, it is noticed that the amplitude of the free-surface elevation is higher near the wave generation zone, i.e., at x = 0.5 m. However, the amplitude and the oscillatory pattern of the free-surface elevation, decrease inside the OWC device’s chamber. A similar observation was found in [31,40]. This is because wave energy dissipates while propagating in the presence of turbulence damping. Further, careful observation revealed that inside the OWC device’s chamber, the free-surface elevation is shifted towards a higher level. This happens due to the to-and-fro reflection of the waves by the OWC’s front and rear walls. Moreover, it is also seen that the amplitude of the free-surface elevation in Figure 15 is higher compared to Figure 12, Figure 13, Figure 14 and Figure 15. This phenomenon occurs due to the higher significant wave height H s .
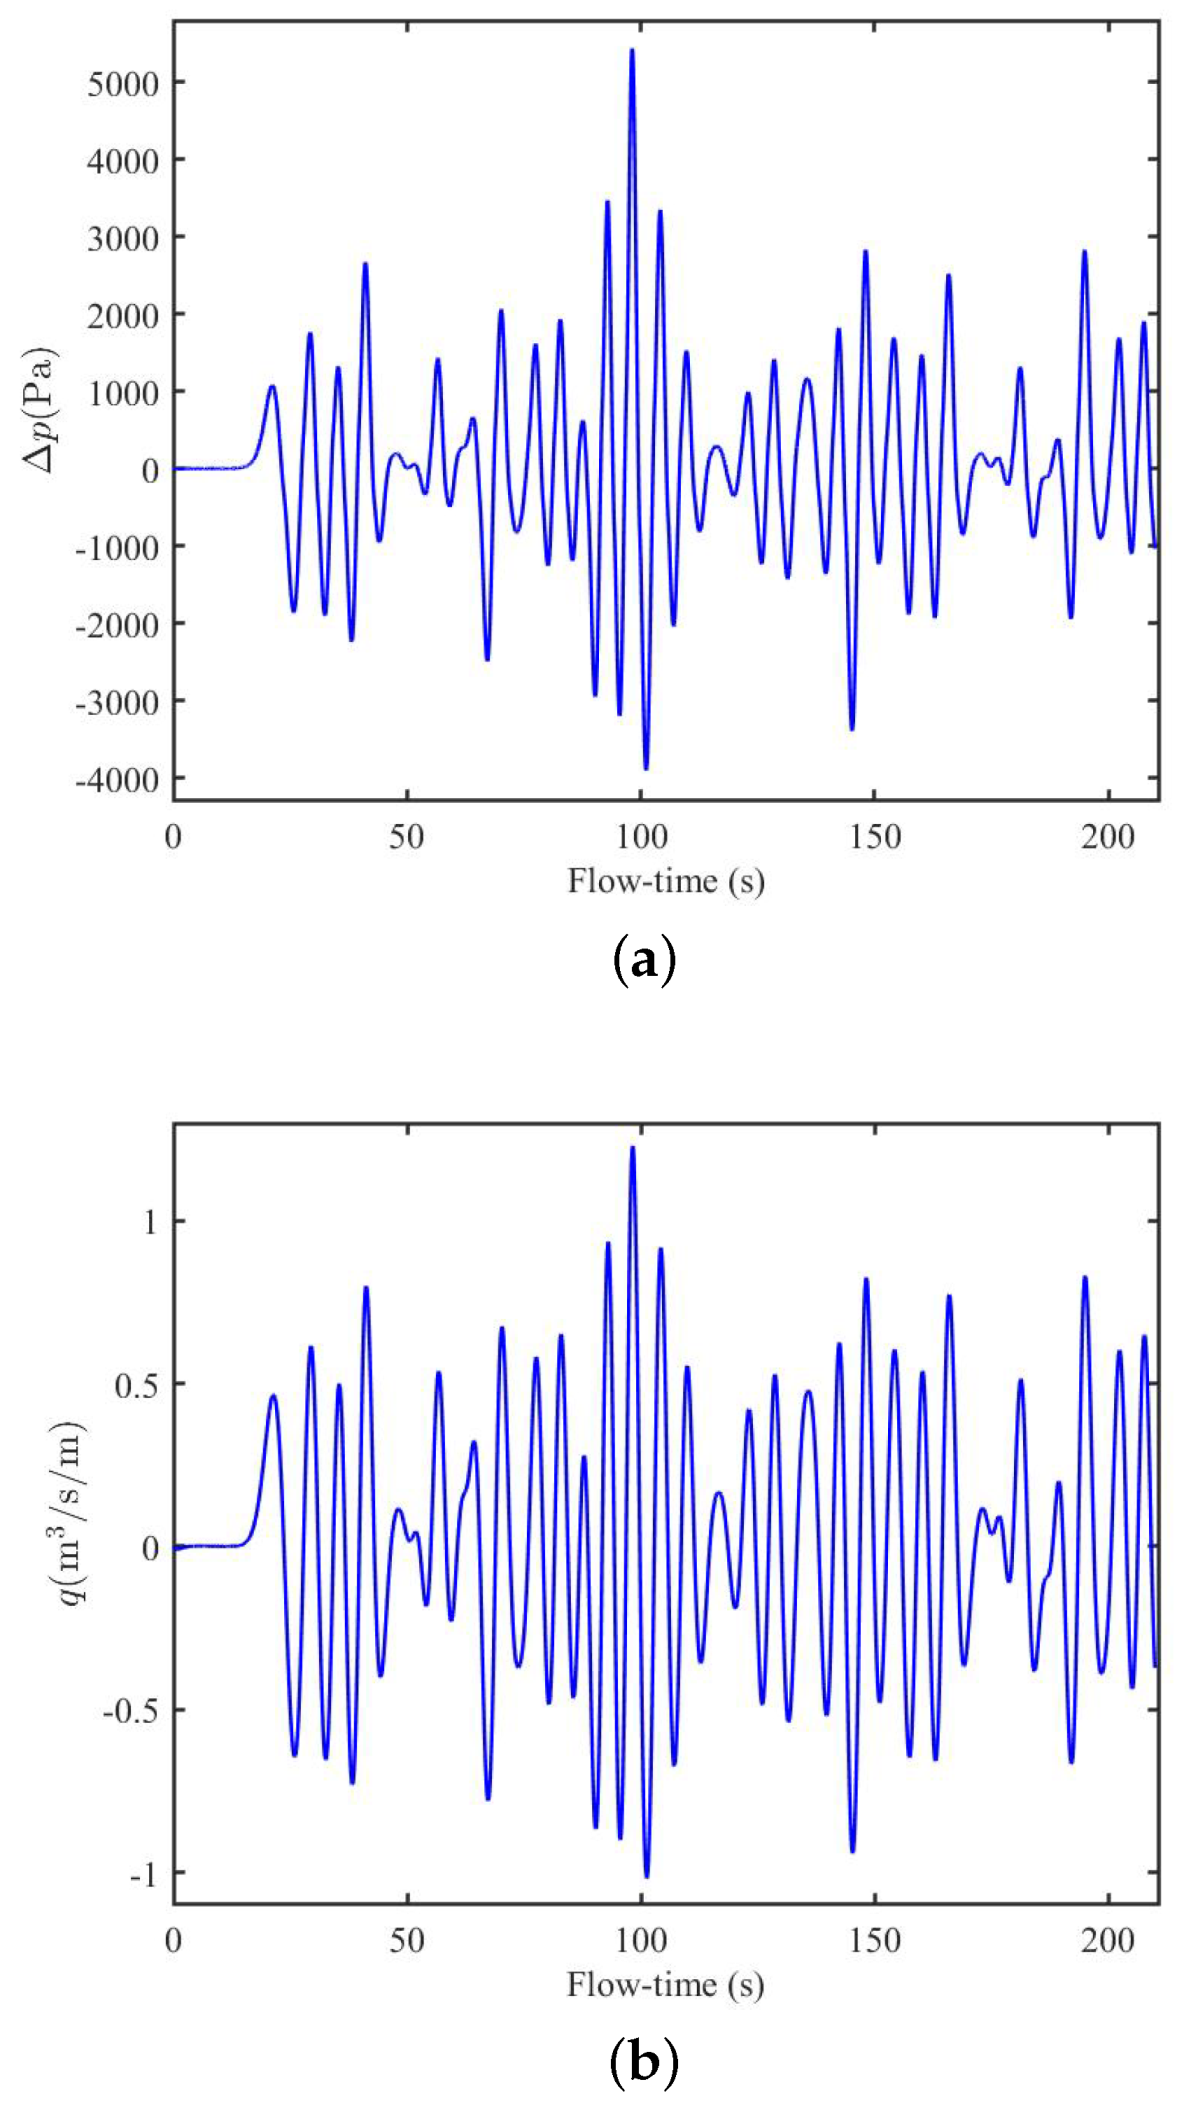
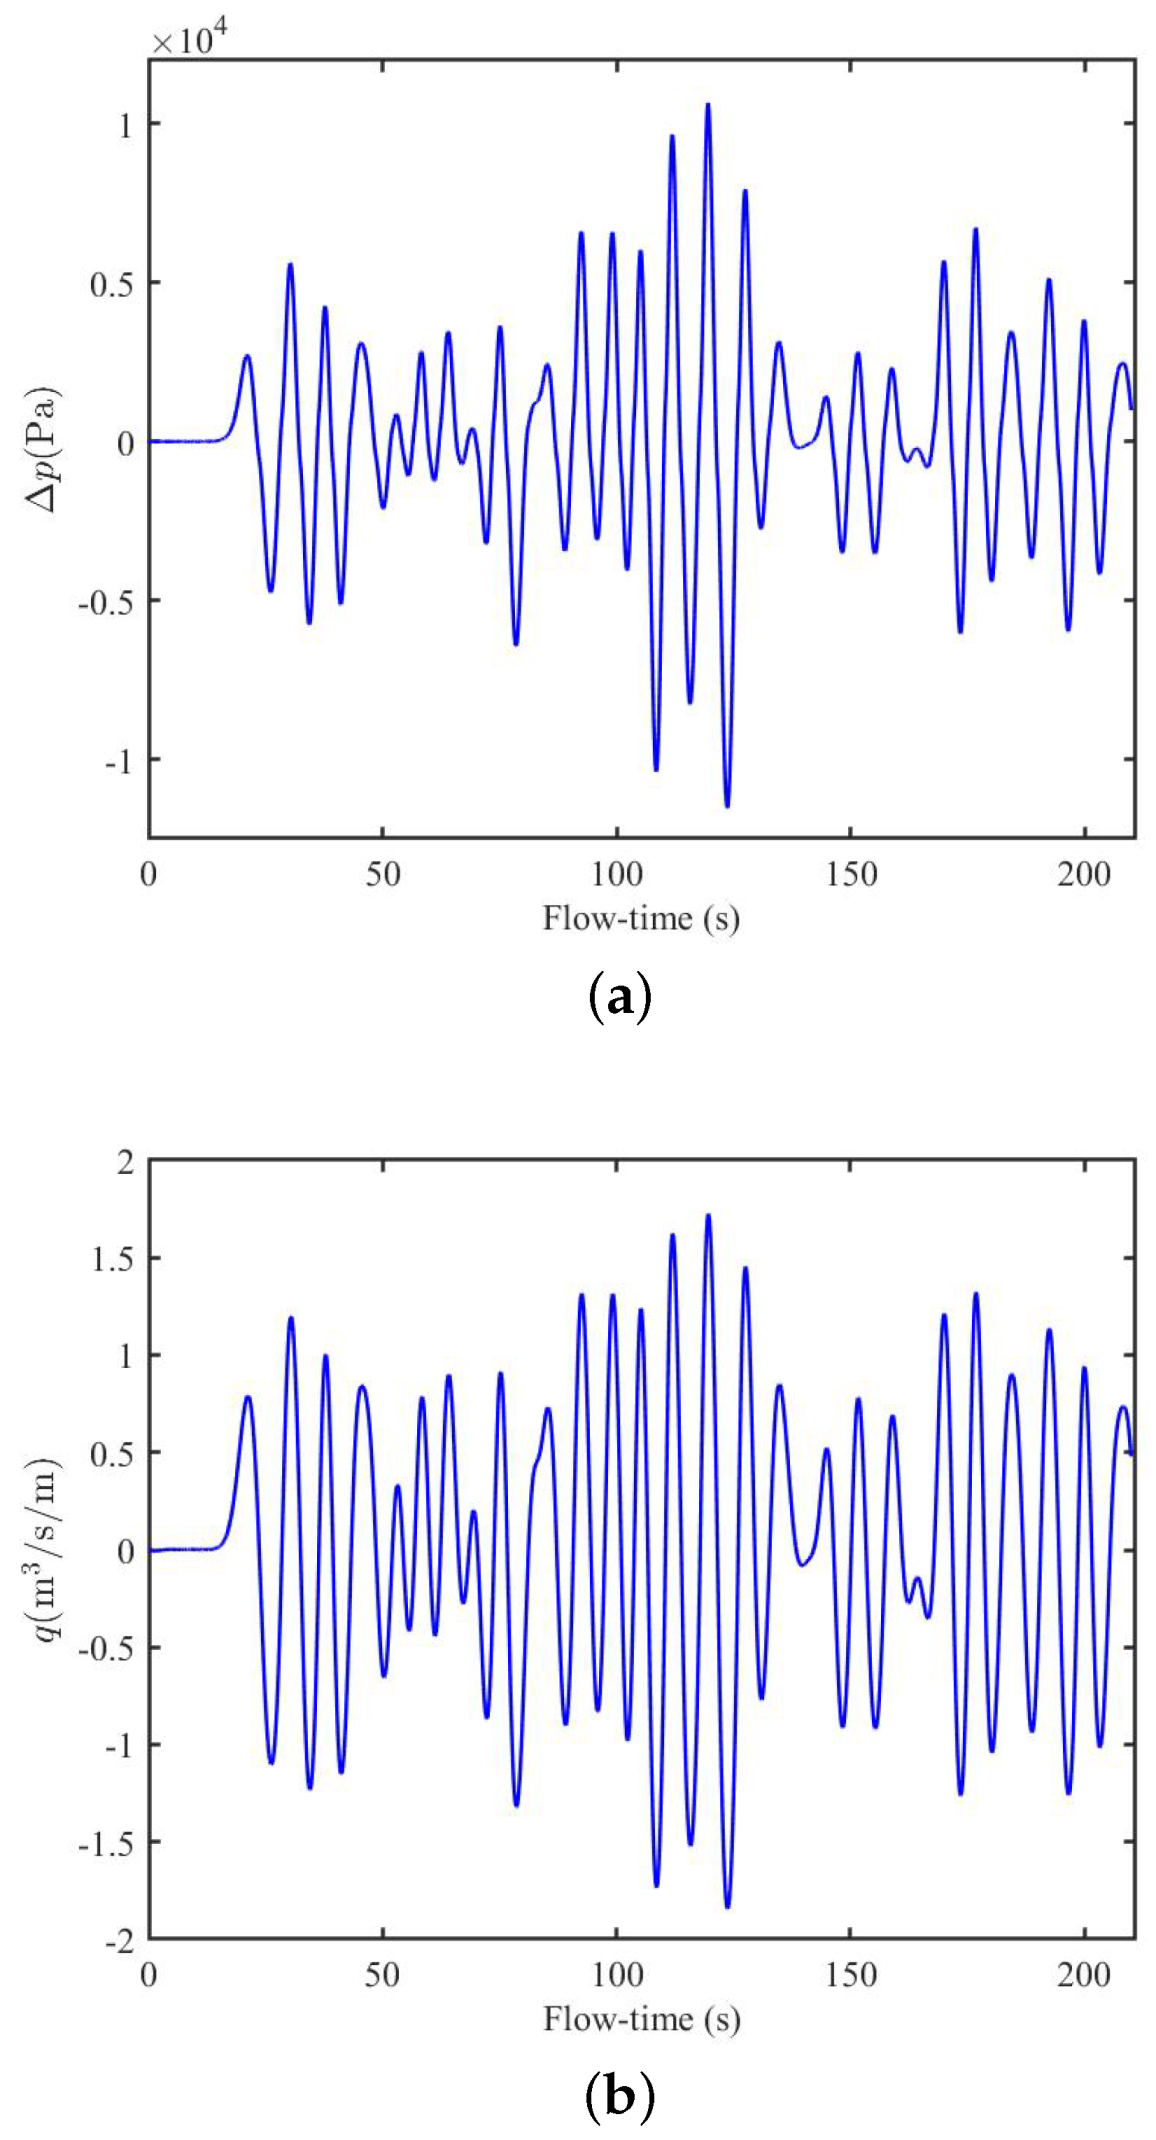
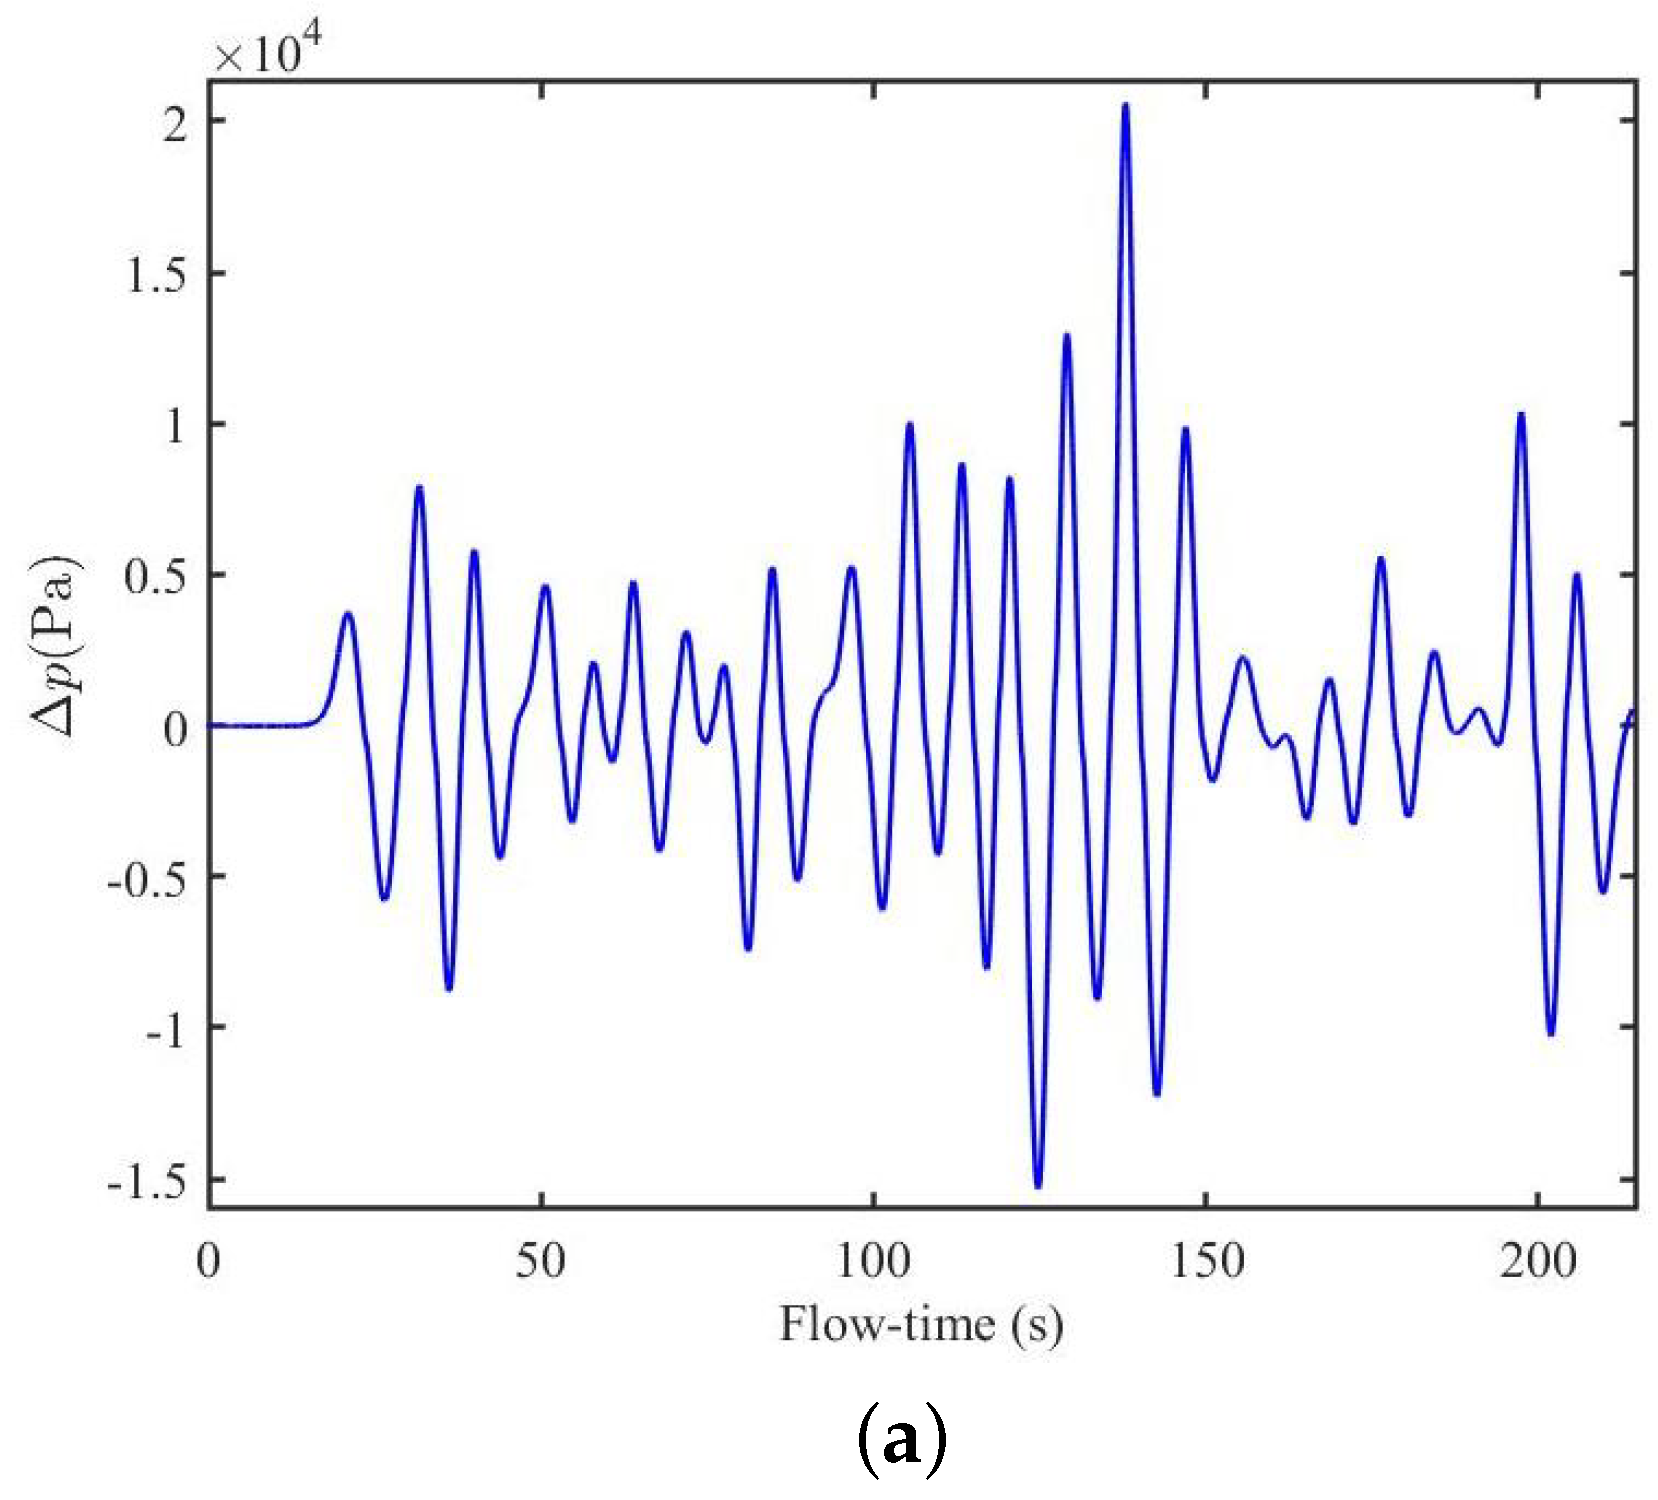
In Figure 16, Figure 17, Figure 18 and Figure 19, the variations in the pressure drop and flow rate is plotted as functions of flow time. The air–water friction with the OWC device walls and the orifice cross-section mainly influence the pressure difference between the chamber and the outside of the chamber. In Figure 16, Figure 17, Figure 18 and Figure 19, it is observed that the variation in the pressure drop and flow rate follow an oscillatory pattern. This pressure drop occurs due to the movement of the water column inside the OWC chamber of the NWT. Further, the amplitude of the pressure drop near is higher in the intermediate regime of the flow time. This happens due to the fact that after some flow time, the oscillation of the water column becomes higher, which diminishes to some extent due to the presence of waves being reflected by the OWC walls. This reflected wave inside the chamber prevents incident waves from entering the chamber. This observation is reported in Figure 12, Figure 13, Figure 14 and Figure 15. A comparison among Figure 16, Figure 17, Figure 18 and Figure 19 demonstrated that the amplitudes of the pressure drop and flow rate are higher in Figure 19 than in Figure 16, Figure 17 and Figure 18. This happens as the significant wave height H s is higher in Figure 19. Figure 12, Figure 13, Figure 14 and Figure 15 demonstrate the variation in free-surface elevation at different locations: (a) x = 0.5 m, (b) x = 72.025 m, (c) x = 143.5 m, and (d) x = 146.4 m, as a function of flow time. Figure 12, Figure 13, Figure 14 and Figure 15 depict that the variations in the free-surface elevations follow a highly oscillatory pattern. Further, it is noticed that the amplitude of the free-surface elevation is higher near the wave-generation zone, i.e., at x = 0.5 m. However, the amplitude and the oscillatory pattern of the free-surface elevation decreases inside the OWC device’s chamber. A similar observation was found in [31,40]. This is due to the fact that wave energy dissipates while propagating in the presence of turbulence damping. Further, careful observation revealed that inside the OWC device’s chamber, the free-surface elevation is shifted towards a higher level. This happens due to the to-and-fro reflection of the waves by the OWC front and rear walls. Moreover, it is also seen that the amplitude of the free-surface elevation in Figure 15 is higher than in Figure 12, Figure 13, Figure 14 and Figure 15. This phenomenon occurs due to the higher significant wave height H s .
Table 2 demonstrates the power generated by the OWC device P o u t and the efficiency η of the OWC device in the presence of irregular incident waves. In Table 2, it is seen that the power generated by the OWC device is higher for H s = 1.88 m compared to other significant wave heights H s . This particular phenomenon happens due to the higher value of significant wave height H s . Further, the effect of the sloping seabed on the power generated P o u t by the OWC device is provided in Table 2. It is demonstrated in Table 2 that the power generation, and the efficiency of the OWC device, are higher for the uniform seabed and the seabed having a moderate sloping angle. The reason for that is the following: (i) the stiff slopes create an obstruction for the incoming waves entering into the OWC device’s chamber, and (ii) in the presence of a higher sloping angle seabed, a large number of the incoming waves are reflected back.

5. Conclusions

In the present study, the hydrodynamic performance of the oscillating water column (OWC) device placed on a sloping seabed was studied under the influence of irregular incident waves, in which the Pierson–Moskowitz (P-M) spectrum was used as the incident wave spectrum. The numerical computations were performed based on the Reynolds-averaged Navier–Stokes equations (RANS) with a modified k ω turbulence model, and a volume of fluid (VOF) method was used to track the air–water interface. The research demonstrates that the creation of vortices due to the swirling motion in the fluid flow at the tip of the front wall, inside the chamber, and near the front wall surface, is the main cause of the wave energy dissipation. The fluid particles with substantially smaller velocity magnitudes are scattered in several directions. In contrast, particles with greater velocity magnitudes are aligned in a single direction near the orifice of the OWC chamber. This particular phenomenon significantly enhances the efficiency of the OWC device during the energy extraction process. The streamline profiles show that the vortices are formed in almost every time instant in the air phase, whereas vortices near the front wall are formed in only a few cases. The oscillation of the water column becomes higher at the intermediate flow time, which diminishes due to the presence of waves reflected by the OWC walls. The outcomes of this study reveal that the amplitudes of the inward and outward velocities via the orifice, free-surface elevations, and flow characteristics are greater for a higher significant wave height. The present study concludes that the power generation and the capture efficiency of the OWC device are higher for a seabed with a moderate slope.

Author Contributions

Conceptualization, S.K. and K.T.; methodology, S.K.; software, A.R.R.; validation, A.R.R., K.T. and S.K.; formal analysis, K.T. and S.K.; investigation, A.R.R.; resources, S.K.; data curation, A.R.R.; writing—original draft preparation, P.A.K., K.T. and S.K.; writing—review and editing, P.A.K., K.T., S.K. and T.S.; visualization, A.R.R.; supervision, T.S. and S.K.; project administration, S.K. and T.S.; funding acquisition, S.K. All authors have read and agreed to the published version of the manuscript.

Funding

K.T. and S.K. acknowledge the financial support received through the DST Project: DST/INSPIRE/04/2017/002460 to pursue this research work. Further, supports were received through the SERB CRG project: CRG/2021/001550.

Acknowledgments

Authors are grateful to the reviewers for their relevant suggestions on the manuscript to modify the same in its present form.

Conflicts of Interest

The authors declare no conflict of interest.

References

  1. Norouzi, N.; Fani, M. Black gold falls, black plague arise-An Opec crude oil price forecast using a gray prediction model. Upstream Oil Gas Technol. 2020, 5, 100015. [Google Scholar] [CrossRef]
  2. Altunkaynak, A.; Çelik, A. A novel Geno-fuzzy based model for hydrodynamic efficiency prediction of a land-fixed oscillating water column for various front wall openings, power take-off dampings and incident wave steepnesses. Renew. Energy 2022, 196, 99–110. [Google Scholar] [CrossRef]
  3. Shahzad, U. The need for renewable energy sources. Energy 2012, 2, 16–18. [Google Scholar]
  4. Kharati-Koopaee, M.; Fathi-Kelestani, A. Assessment of oscillating water column performance: Influence of wave steepness at various chamber lengths and bottom slopes. Renew. Energy 2020, 147, 1595–1608. [Google Scholar] [CrossRef]
  5. Heath, T.V. A review of oscillating water columns. Philos. Trans. R. Soc. A Math. Phys. Eng. Sci. 2012, 370, 235–245. [Google Scholar] [CrossRef] [Green Version]
  6. Koley, S.; Trivedi, K. Mathematical modeling of oscillating water column wave energy converter devices over the undulated sea bed. Eng. Anal. Bound. Elem. 2020, 117, 26–40. [Google Scholar] [CrossRef]
  7. Evans, D.V. The oscillating water column wave-energy device. IMA J. Appl. Math. 1978, 22, 423–433. [Google Scholar] [CrossRef]
  8. Evans, D.V. Wave-power absorption by systems of oscillating surface pressure distributions. IMA J. Fluid Mech. 1982, 114, 481–499. [Google Scholar] [CrossRef]
  9. Sarmento, A.J.; Falcão, A.D.O. Wave generation by an oscillating surface-pressure and its application in wave-energy extraction. J. Fluid Mech. 1985, 150, 467–485. [Google Scholar] [CrossRef]
  10. Evans, D.V.; Porter, R. Hydrodynamic characteristics of an oscillating water column device. Appl. Ocean. Res. 1995, 17, 155–164. [Google Scholar] [CrossRef]
  11. De O Falcão, A.F.; Rodrigues, R.J.A. Stochastic modelling of OWC wave power plant performance. Appl. Ocean. Res. 2002, 24, 59–71. [Google Scholar] [CrossRef]
  12. Falcão, A.F.; Henriques, J.C.; Gato, L.M.; Gomes, R.P. Air turbine choice and optimization for floating oscillating-water-column wave energy converter. Ocean. Eng. 2014, 75, 148–156. [Google Scholar] [CrossRef]
  13. Rezanejad, K.; Soares, C.G.; López, I.; Carballo, R. Experimental and numerical investigation of the hydrodynamic performance of an oscillating water column wave energy converter. Renew. Energy 2017, 106, 1–16. [Google Scholar] [CrossRef]
  14. Iturrioz, A.; Guanche, R.; Armesto, J.A.; Alves, M.A.; Vidal, C.; Losada, I.J. Time-domain modeling of a fixed detached oscillating water column towards a floating multi-chamber device. Ocean. Eng. 2014, 76, 65–74. [Google Scholar] [CrossRef]
  15. Zheng, S.; Zhang, Y.; Iglesias, G. Coast/breakwater-integrated OWC: A theoretical model. Mar. Struct. 2019, 66, 121–135. [Google Scholar] [CrossRef]
  16. Ning, D.Z.; Guo, B.M.; Wang, R.Q.; Vyzikas, T.; Greaves, D. Geometrical investigation of a U-shaped oscillating water column wave energy device. Appl. Ocean. Res. 2020, 97, 102105. [Google Scholar] [CrossRef]
  17. Trivedi, K.; Koley, S. Mathematical modeling of breakwater-integrated oscillating water column wave energy converter devices under irregular incident waves. Renew. Energy 2021, 178, 403–419. [Google Scholar] [CrossRef]
  18. Ning, D.Z.; Shi, J.; Zou, Q.P.; Teng, B. Investigation of hydrodynamic performance of an OWC (oscillating water column) wave energy device using a fully nonlinear HOBEM (higher-order boundary element method). Energy 2015, 83, 177–188. [Google Scholar] [CrossRef]
  19. Rodríguez, A.A.M.; Casarín, R.S.; Ilzarbe, J.M.B. A 3D boundary element method for analysing the hydrodynamic performance of a land-fixed oscillating water column device. Eng. Anal. Bound. Elem. 2022, 138, 407–422. [Google Scholar] [CrossRef]
  20. Falnes, J. Ocean Waves and Oscillating Systems: Linear Interactions Including Wave-Energy Extraction; Cambridge University Press: Cambridge, MA, USA, 2002. [Google Scholar]
  21. Hirt, C.W.; Nichols, B.D. Volume of fluid (VOF) method for the dynamics of free boundaries. Comput. Phys. 1981, 39, 201–225. [Google Scholar] [CrossRef]
  22. López, I.; Pereiras, B.; Castro, F.; Iglesias, G. Optimisation of turbine-induced damping for an OWC wave energy converter using a RANS–VOF numerical model. Appl. Energy 2014, 127, 105–114. [Google Scholar] [CrossRef]
  23. Luo, Y.; Nader, J.R.; Cooper, P.; Zhu, S.P. Nonlinear 2D analysis of the efficiency of fixed oscillating water column wave energy converters. Renew. Energy 2014, 64, 255–265. [Google Scholar] [CrossRef]
  24. Simonetti, I.; Cappietti, L.; Elsafti, H.; Oumeraci, H. Evaluation of air compressibility effects on the performance of fixed OWC wave energy converters using CFD modelling. Renew. Energy 2018, 119, 741–753. [Google Scholar] [CrossRef]
  25. Wang, R.Q.; Ning, D.Z.; Zhang, C.W.; Zou, Q.P.; Liu, Z. Nonlinear and viscous effects on the hydrodynamic performance of a fixed OWC wave energy converter. Coast. Eng. 2018, 139, 42–50. [Google Scholar] [CrossRef]
  26. Dai, S.; Day, S.; Yuan, Z.; Wang, H. Investigation on the hydrodynamic scaling effect of an OWC type wave energy device using experiment and CFD simulation. Renew. Energy 2019, 142, 184–194. [Google Scholar] [CrossRef]
  27. Gurnari, L.; Filianoti, P.G.; Torresi, M.; Camporeale, S.M. The wave-to-wire energy conversion process for a fixed U-OWC Device. Energies 2020, 13, 283. [Google Scholar] [CrossRef] [Green Version]
  28. Vyzikas, T.; Deshoulières, S.; Giroux, O.; Barton, M.; Greaves, D. Numerical study of fixed Oscillating Water Column with RANS-type two-phase CFD model. Renew. Energy 2017, 102, 294–305. [Google Scholar] [CrossRef] [Green Version]
  29. Da Silva Koch, A.H.; Da Silveira Paiva, M.; Monteiro, C.B.; Oleinik, P.H.; Isoldi, L.A.; Machado, B.N. Numerical Evaluation of the Hydropneumatic Power of the Oscillating Water Column Wave Energy Converter Submitted to Regular and Irregular Waves. Eng. Sci. Technol. 2022, 3, 32–43. [Google Scholar] [CrossRef]
  30. Zhou, Z.; Ke, S.; Wang, R.; Mayon, R.; Ning, D. Hydrodynamic Investigation on a Land-Fixed OWC Wave Energy Device under Irregular Waves. Appl. Sci. 2022, 12, 2855. [Google Scholar] [CrossRef]
  31. Mohapatra, P.; Bhattacharyya, A.; Sahoo, T. Performance of a floating oscillating water column wave energy converter over a sloping bed. Ships Offshore Struct. 2021, 16, 659–669. [Google Scholar] [CrossRef]
  32. Mohapatra, P.; Vijay, K.G.; Bhattacharyya, A.; Sahoo, T. Performance of a shore fixed oscillating water column device for different bottom slopes and front wall drafts: A study based on computational fluid dynamics and biem. J. Offshore Mech. Arct. Eng. 2021, 143, 032002. [Google Scholar] [CrossRef]
  33. Liu, S.; Ong, M.C.; Obhrai, C.; Gatin, I.; Vukčević, V. Influences of free surface jump conditions and different k-ω SST turbulence models on breaking wave modelling. Ocean. Eng. 2020, 217, 107746. [Google Scholar] [CrossRef]
  34. Menter, F.R. Improved Two-Equation k-ω Turbulence Models for Aerodynamic Flows; No. A-92183; NASA Ames Research Center: Moffett Field, CA, USA, 1992. [Google Scholar]
  35. Wilcox, D.C. Formulation of the kw turbulence model revisited. AIAA J. 2008, 46, 2823–2838. [Google Scholar] [CrossRef] [Green Version]
  36. Xu, C.; Huang, Z. Three-dimensional CFD simulation of a circular OWC with a nonlinear power-takeoff: Model validation and a discussion on resonant sloshing inside the pneumatic chamber. Ocean. Eng. 2019, 176, 184–198. [Google Scholar] [CrossRef]
  37. Gomes, M.D.N.; Olinto, C.R.; Isoldi, L.A.; Souza, J.A.; Rocha, L.A.D.O. Computational Modeling of the Air-Flow in an Oscillating Water Column System. 2009. Available online: http://repositorio.furg.br/handle/1/4999 (accessed on 24 October 2022).
  38. Gomes, R.P.F.; Henriques, J.C.C.; Gato, L.M.C.; Falcão, A.D.O. Hydrodynamic optimization of an axisymmetric floating oscillating water column for wave energy conversion. Renew. Energy 2012, 44, 328–339. [Google Scholar] [CrossRef]
  39. Rezanejad, K.; Gadelho, J.F.M.; Guedes Soares, C. Hydrodynamic analysis of an oscillating water column wave energy converter in the stepped bottom condition using CFD. Renew. Energy 2019, 135, 1241–1259. [Google Scholar] [CrossRef]
  40. Ning, D.Z.; Wang, R.Q.; Gou, Y.; Zhao, M.; Teng, B. Numerical and experimental investigation of wave dynamics on a land-fixed OWC device. Energy 2016, 115, 326–337. [Google Scholar] [CrossRef]
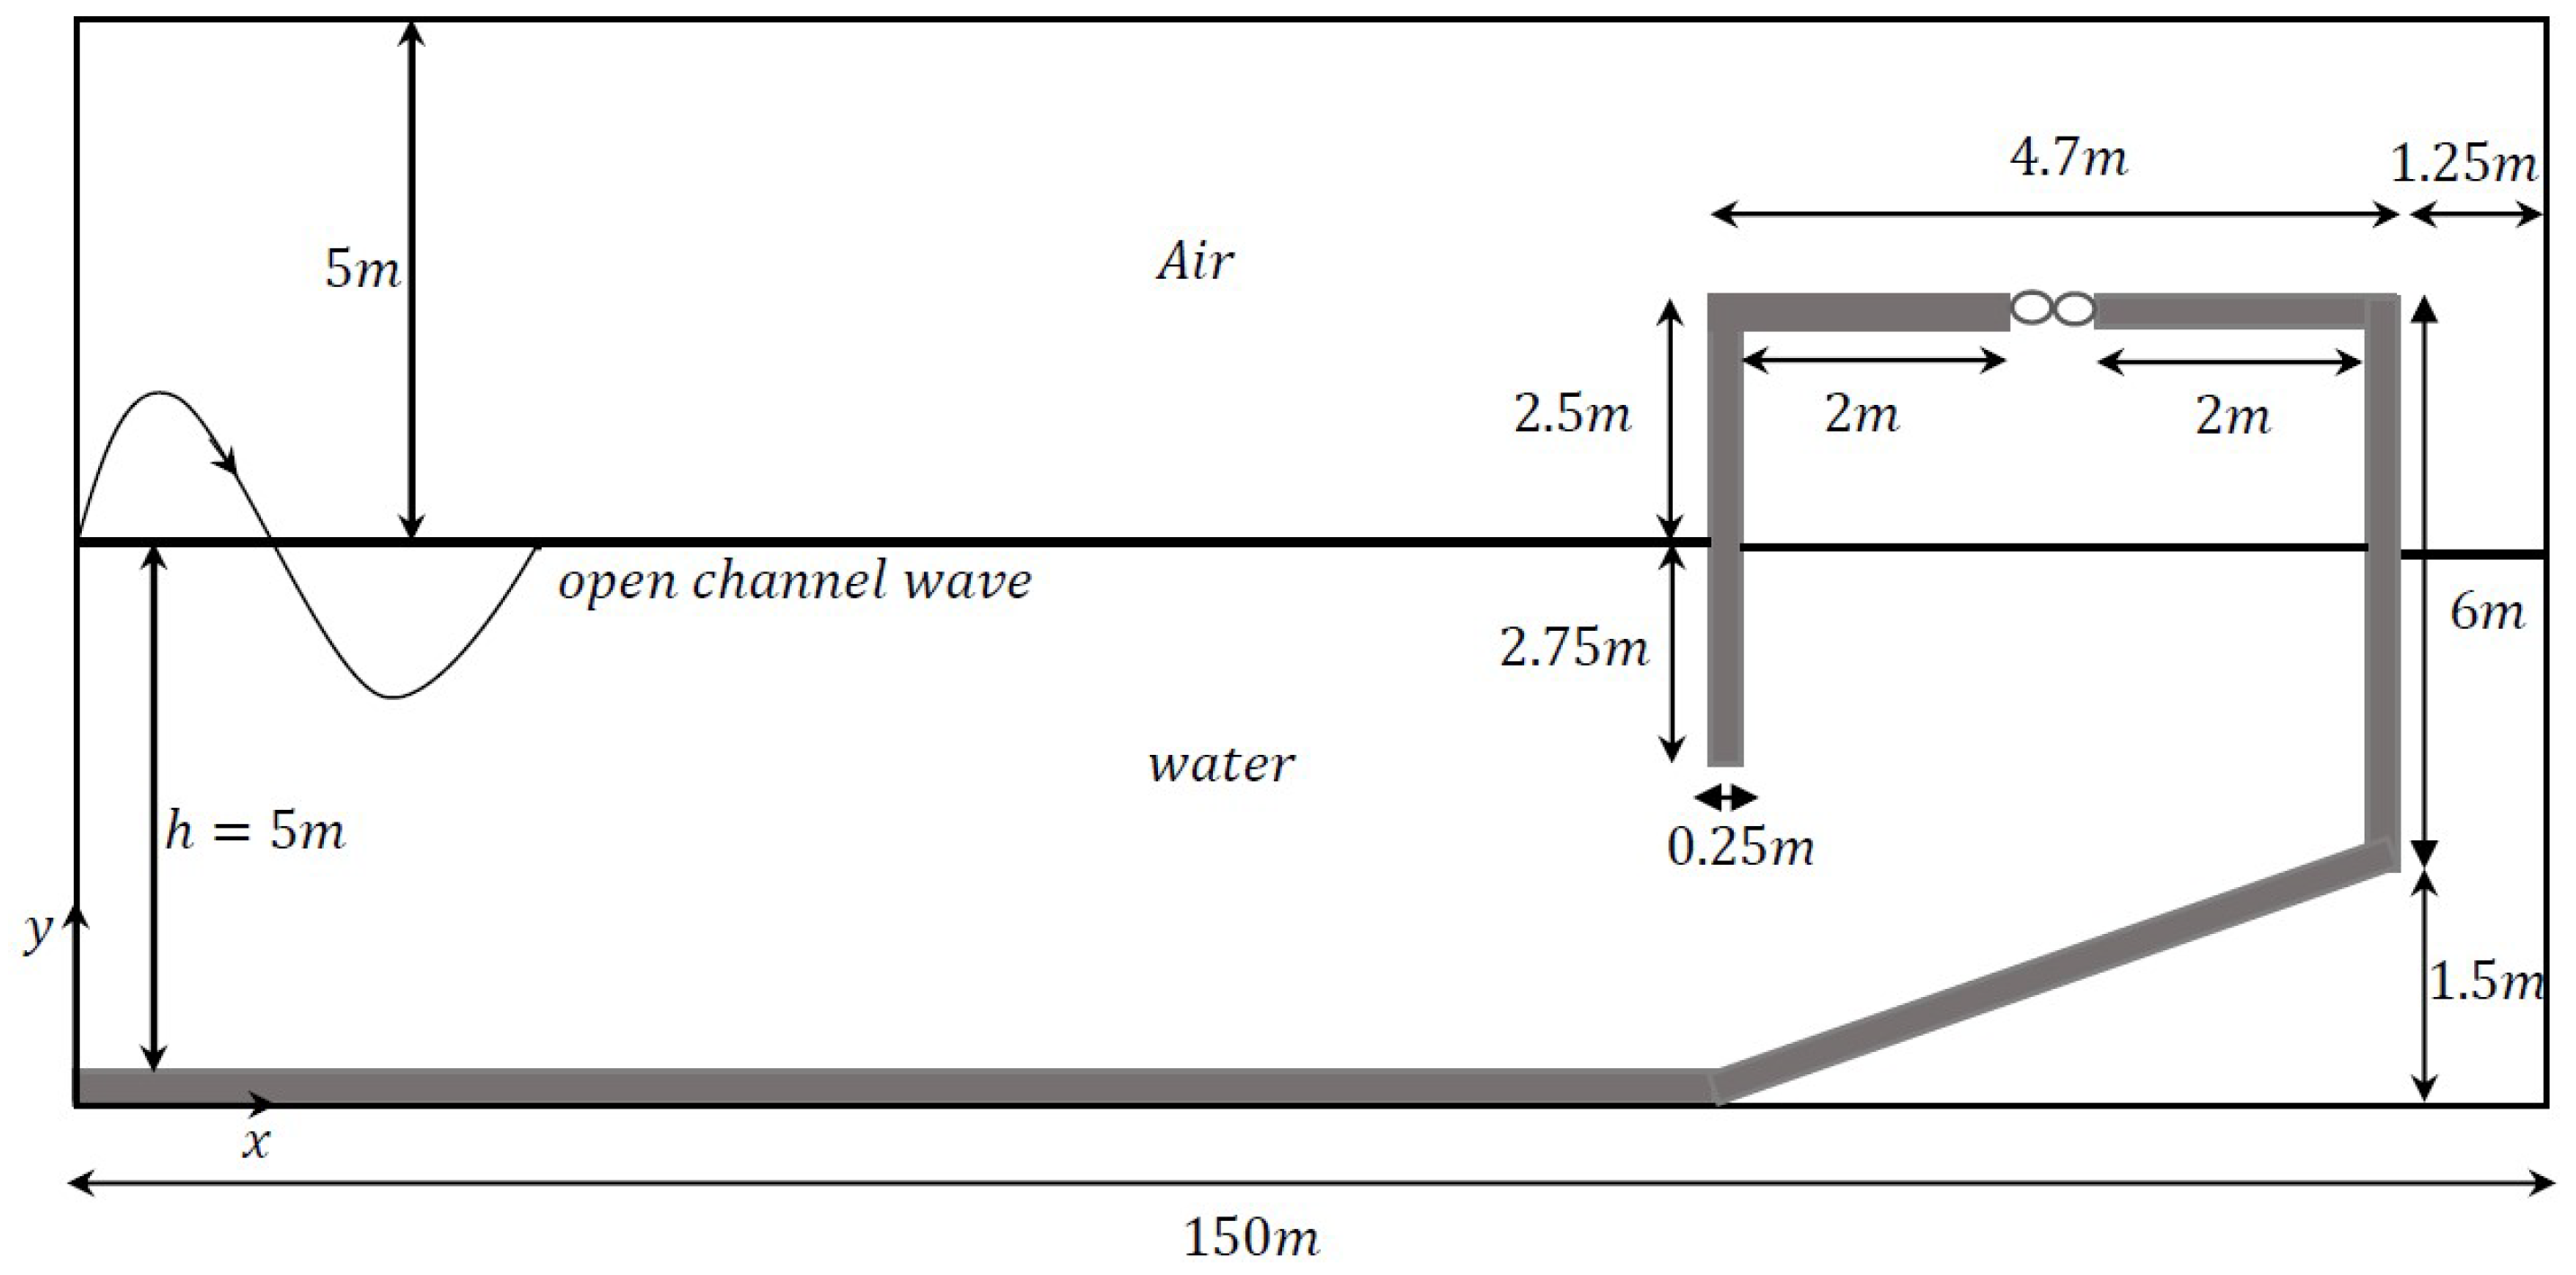
Figure 1. Vertical cross-section of the OWC device placed over the sloping seabed.
Fluids 08 00027 g001
Figure 2. Mesh generation of the OWC device.
Fluids 08 00027 g002
Figure 3. Comparison of present numerical results (a) pressure drop, and (b) flow rate vs. the flow-time, with the results of [22] in the case of regular waves.
Fluids 08 00027 g003
Figure 4. Velocity-vector profile at various time instants: (a) t = 110 s, (b) t = 170 s, (c) t = 180 s, and (d) t = 199 s, with H s = 0.9 m and ω p = 1.257 Hz.
Fluids 08 00027 g004aFluids 08 00027 g004b
Figure 5. Velocity vector profile at various time instants: (a) t = 120 s, (b) t = 140 s, (c) t = 170 s, and (d) t = 175 s, with H s = 1.18 m and ω p = 0.967 Hz.
Fluids 08 00027 g005aFluids 08 00027 g005b
Figure 6. Velocity-vector profile at various time instants: (a) t = 110 s, (b) t = 130 s, (c) t = 190 s, and (d) t = 210 s, with H s = 1.23 m and ω p = 0.811 Hz.
Fluids 08 00027 g006aFluids 08 00027 g006b
Figure 7. Velocity-vector profile at various time instants: (a) t = 103 s, (b) t = 119 s, (c) t = 134 s, and (d) t = 144 s, with H s = 1.88 m and ω p = 0.993 Hz.
Fluids 08 00027 g007aFluids 08 00027 g007b
Figure 8. Streamline profile at various time instants: (a) t = 120 s, (b) t = 170 s, (c) t = 190 s, and (d) t = 210 s, with H s = 0.9 m and ω p = 1.257 Hz.
Fluids 08 00027 g008aFluids 08 00027 g008b
Figure 9. Streamline profile at various time instants: (a) t = 120 s, (b) t = 150 s, (c) t = 170 s, and (d) t = 200 s, with H s = 1.18 m and ω p = 0.967 Hz.
Fluids 08 00027 g009aFluids 08 00027 g009b
Figure 10. Streamline profile at various time instants: (a) t = 130 s, (b) t = 150 s, (c) t = 190 s, and (d) t = 210 s, with H s = 1.23 m and ω p = 0.811 Hz.
Fluids 08 00027 g010aFluids 08 00027 g010b
Figure 11. Streamline profile at various time instants: (a) t = 110 s, (b) t = 134 s, (c) t = 165 s, and (d) t = 180 s, with H s = 1.88 m and ω p = 0.993 Hz.
Fluids 08 00027 g011aFluids 08 00027 g011b
Figure 12. Variation in the free surface at different locations: (a) x = 0.5 m, (b) x = 72.025 s, (c) x = 143.5 m and (d) x = 146.4 m, with H s = 0.9 m and ω p = 1.25 Hz.
Fluids 08 00027 g012aFluids 08 00027 g012b
Figure 13. Variation in the free surface at different locations: (a) x = 0.5 m, (b) x = 72.025 m, (c) x = 143.5 m and (d) x = 146.4 m, with H s = 1.18 m and ω p = 0.967 Hz.
Fluids 08 00027 g013aFluids 08 00027 g013b
Figure 14. Variation in the free surface at different locations: (a) x = 0.5 m, (b) x = 72.025 m, (c) x = 143.5 m and (d) x = 146.4 m, with H s = 1.23 m and ω p = 0.811 Hz.
Fluids 08 00027 g014aFluids 08 00027 g014b
Figure 15. Variation of the free surface at different locations: (a) x = 0.5 m, (b) x = 72.025 m, (c) x = 143.5 m and (d) x = 146.4 m, with H s = 1.88 m and ω p = 0.993 Hz.
Fluids 08 00027 g015aFluids 08 00027 g015b
Figure 16. Variation in the (a) pressure drop, and (b) flow rate vs. the flow-time, with H s = 0.9 m and ω p = 1.25 Hz.
Fluids 08 00027 g016
Figure 17. Variation in the (a) pressure drop, and (b) flow rate vs. the flow-time, with H s = 1.18 m and ω p = 0.967 Hz.
Fluids 08 00027 g017
Figure 18. Variation in the (a) pressure drop, and (b) flow rate vs. the flow-time, with H s = 1.23 m and ω p = 0.811 Hz.
Fluids 08 00027 g018aFluids 08 00027 g018b
Figure 19. Variation in the (a) pressure drop, and (b) flow rate vs. the flow-time, with H s = 1.88 m and ω p = 0.993 Hz.
Fluids 08 00027 g019
Table 1. Discretization errors of numerical solutions. These data were collected at the mid-point of the orifice for t = 45 s. Here, H s = 1.18 and ω p = 0.967 .
Pressure Drop Δ p Flow Rate qFree Surface Elevation y
ϕ 1 3886.113977 0.806048 4.984980
ϕ 2 3830.789328 0.789875 4.979356
ϕ 3 3698.194237 0.748617 4.956397
ϵ 21 55.324649 0.016172 0.005624
ϵ 32 132.595090 0.041258 0.022959
r 21 1.7 1.7 1.7
r 32 1.7 1.7 1.7
p 1.647257 1.764910 2.650948
e 21 a 0.014236 0.020064 0.001128
e 32 a 0.034612 0.052233 0.004610
G C I C o a r s e 21 0.030537 0.041250 0.001867
G C I F i n e 21 0.012741 0.016169 0.000457
G C I C o a r s e 32 0.074244 0.107387 0.007633
G C I F i n e 32 0.030978 0.042095 0.001869
Table 2. Average power output and efficiency for the most common sea states represent the local wave climate at the western coast of Portugal.
θ H s (m) ω p (Hz) P out (kW/m) P inc (kW/m) η
18 . 6 0.9 1.257 0.442 1.957 0.225
1.18 0.967 2.167 4.156 0.521
1.23 0.811 3.632 5.0075 0.725
1.88 0.993 5.326 10.362 0.513
0 1.18 0.967 2.139 4.156 0.515
5 1.18 0.967 2.182 4.156 0.525
10 1.18 0.967 2.143 4.156 0.516
26 . 8 1.18 0.967 2.047 4.156 0.492
Disclaimer/Publisher’s Note: The statements, opinions and data contained in all publications are solely those of the individual author(s) and contributor(s) and not of MDPI and/or the editor(s). MDPI and/or the editor(s) disclaim responsibility for any injury to people or property resulting from any ideas, methods, instructions or products referred to in the content.