Article

Research on Location Selection of Personnel Door and Anemometer Based on FLUENT

1
Key Laboratory of Mining Engineering of Heilongjiang Province College, Heilongjiang University of Science and Technology, Harbin 150022, China
2
School of Mining Engineering, Heilongjiang University of Science and Technology, Harbin 150022, China
3
School of Safety Engineering, Heilongjiang University of Science and Technology, Harbin 150022, China
*
Author to whom correspondence should be addressed.
Fluids 2023, 8(1), 26; https://doi.org/10.3390/fluids8010026
Submission received: 10 November 2022 / Revised: 30 December 2022 / Accepted: 6 January 2023 / Published: 10 January 2023
(This article belongs to the Special Issue Fluid Flows in Geotechnical Engineering)

Abstract

:
The structural design of ventilation structures and the arrangement of anemometers in the main ventilation roadway of an underground mine play an important role in the accurate measurement of air speed. It is one of the important tasks of mine ventilation management and intelligent-ventilation-system construction to determine the position of anemometers. In this paper, the CFD numerical simulation method is used to determine the position of the personnel door in the automatic air door by FLUENT software simulating and analyzing the air-speed cloud diagram and air-pressure cloud diagram in the two-dimensional roadway model. Under the same air speed, comparing the air-speed distribution of different cross-sections in the three-dimensional roadway model when the wide door and the personnel door are opened, the anemometer is set at the 25 m cross-section behind the air door, and the air-speed distribution of the cross-section at different air speeds is simulated. The average air-speed line and the specific installation position of the anemometer on the line are obtained by Origin software. The result shows that the position of the personnel door is 400 mm from the middle line of the roadway, and the measurement error of the anemometer is small on the left side of the roadway (0.41, 2.45) and the right side of the roadway (4.59, 2.43) at 25 m behind the air door, which provides a theoretical basis for the measurement of air speed in a coal mine ventilation roadway.

1. Introduction

Intelligent mining is the further development of coal mines’ basic full manpower, mechanization, and automation. The deep integration of big data, cloud computing, artificial intelligence, advanced technology, and coal mine intelligent mining technology is the only way for the coal mine industry to achieve high-quality development [1]. Mine intelligent ventilation works through intelligent perception, ventilation structures, ventilation powers, ventilation network, and intelligent linkage control of underground air to achieve on-demand regulation. Its function is to continuously input fresh air flow into the underground mine, eliminate dirty air and turbid air, reduce the occurrence of mine disasters, provide a safe working environment, and ensure the safety and normal operation of workers [2,3].
Underground structures are important devices for isolating and regulating airflow. Appropriate installation location and automation are one of the important tasks for mine ventilation management [4,5]. Zhang et al. [6] proposed a side-scroll air door. FLUENT was used to simulate the air-speed and air-pressure cloud diagrams in the roadway when the air door was opened at different degrees and different inlet air speeds. It was concluded that when the air door was opened at 3.12 m, the larger the air speed, the larger the eddy current area behind the air door, which provided a theoretical basis for the improved design and installation position of the side-scroll air door. Through FLUENT simulation, Sheng [7] established the ventilation of the roadway when the air of the two-dimensional roadway was at different opening degrees and air speeds. It was concluded that the full-section air door can achieve the effective regulation and control of roadway ventilation. Deng et al. [8] used the numerical simulation method to explore the influence of the opening and closing process of the air door on the airflow of the roadway and further verified the simulation results through similar experiments: the fluctuation time and the maximum fluctuation amplitude monitored by the anemometer on the windward side of the air door, the ventilation side, the parallel roadway, and the series roadway are related to the inlet air speed, the opening and closing angle, the opening and closing speed, and the duration of the opening fixed angle before the air door is opened, which provides guidance for the sensor arrangement. Hu et al. [9] used the CFD simulation method to study the influence of the opening degree of the air door, the inlet air speed, and the wall roughness on the air-speed distribution of the roadway. The smaller the opening degree of the air door, the larger the air-speed range in the cavity area behind the door. It is concluded that the anemometer can avoid the cavity area when it is arranged more than nine times the height of the obstacle. To study the influence of the different opening degrees of air doors on the flow of underground fire smoke, Lu et al. [10] simulated the influence of different inlet air speeds and different opening degrees on the visibility and temperature of roadways through numerical simulation software and obtained the most suitable conditions for personnel escape. Guang et al. [11] verified the tracer-gas experiment by the CFD simulation method and obtained the influence of the opening and closing state of the air door on the flow-field distribution of the underground ventilation system.
The accurate acquisition of air speed is one of the key technologies of mine intelligent ventilation. In this technology, the installation position of the anemometer is one of the key problems to be solved urgently [12]. To solve this problem, most domestic scholars have conducted in-depth research. Based on the decision tree algorithm, Huang [13] studied the priority of installing anemometers under different conditions (air disturbance, roadway support, distance from the inlet and outlet of the reuse air outlet, and roadway type). The numerical simulation method was used to obtain the average air-speed equivalent point on the longitudinal axis of the roadway at 34.92 cm from the roof. In order to verify the fixed-point air-speed measurement method, Lu et al. [14] used CFD to simulate the air speed of rectangular, trapezoidal, and arched roadways. By comparing the average air speed calculated from the simulated air speed at a point on the centerline of the turbulent zone of the roadway with the actual analysis, it was concluded that the error was the smallest when the anemometer was arranged at a radius of 1/4 of the top of the roadway. Sun et al. [15] simulated a rectangular roadway and a semicircular arch roadway under different air -speed conditions, obtained the average air-speed distribution area of the roadway, and determined the location of the average air-speed acquisition point. Luo [16] through the numerical simulation of a rectangular, semi-circular arch roadway with different cross-sections of different inlet air-speeds distribution; using Origin software to draw the curve of the air speed on the central axis of the roadway and the distance from the roof of the roadway, the distance between the average air speed line and the roof is obtained and compared with the theoretical model, and the error does not exceed 4%. Sun et al. [17] used FLUENT software to simulate the air-speed distribution law of different large cross-section roadways, which proved the rationality of the multi-point-grid test method. Taking 175 m-level air station of the Baiping coal mine as an engineering background, Zhang [18], through the CFD simulated the air-speed distribution when the person was in different positions and at different angles of the roadway, concluded that the error was the smallest when the anemometer was installed 3.63~3.64 m to the floor.
Based on the above analysis, most researchers have made great achievements in the design of the air door and the optimization of the position of the anemometer, but they have not combined the two for analysis. Therefore, this paper uses FLUENT numerical simulation to study the influence of the position of the personnel door in the automatic air door on the air field and air pressure of the roadway and the position selection of the precision anemometer on the leeward side of the air door in the roadway, which provides a theoretical basis for the design of the air door and the accurate measurement of the anemometer.

2. Underground Air-Door Problems and Automatic Air Door

The adjustment of most air doors underground relies on manual operation, which is time-consuming and laborious and has low efficiency. Only a small number of air doors are automatic-control air doors but usually only have two control states of switching and cannot quantitatively control and adjust the air volume. Based on this problem, an automatic air door with a personnel door is designed, and a 4.2 m × 3 m air door is taken as an example for research, as shown in Figure 1. The air door consists of a wide door and a personnel door, and transparent explosion-proof glass is installed on the personnel door. The door can adapt to the roadway with 0~200 mm deformation capacity, with a high-strength lightweight door and an XYZ three-direction adjustable hinge, which can facilitate the rapid installation of underground time-saving; the opening and closing of the air door can be selected in the form of pneumatic/hydraulic power, and it has a variety of opening modes of photosensitive/shooting/image recognition. When the person and the car pass through, the air door can be automatically closed [19].

3. Theoretical Analysis of Fluid Dynamics

3.1. Governing Equation

The fluid follows the law of conservation of mass, the law of conservation of energy, and the law of conservation of momentum in the process of moving. These three laws belong to the basic law of conservation and constitute the basic equation of fluid dynamics. The nature of the equation plays an important role in describing the phenomenon of fluid motion [20,21]. Since the standard k-ε turbulence model is used in this study, in addition to following the three laws, the control equation of the standard k-ε model is also followed.
(1)
The mass conservation equation
The law of conservation of mass means that the increased rate of mass in the fluid micro-element is equal to the net mass flowing into the micro-element at the same time, which can be characterized by the continuity equation. It can be used for both the compressible fluid and incompressible fluid, The mass conservation equation is expressed as follows [22].
ρ t + ( ρ u i ) x i = 0 ,
For steady incompressible fluid flows, Equation (1) can be expressed as follows.
u x + v y + w z = 0 ,
The meaning of the parameters is shown in Table 1.
(2)
The energy conservation equation
The energy conservation equation is an equation that must be followed when the solid domain and the fluid domain undergo heat exchange in the system. This equation reflects the variation law of pressure energy, kinetic energy, and potential energy in the process of fluid flow [23]. The energy conservation equation is expressed as follows [24]. The heat exchange in this study is very small and negligible, so the equation is not used.
( ρ E ) t + x i ( u i ( ρ E + p ) ) = x i ( k e f f T x i ) j h j J j + u j ( τ i j ) e f f + S h ,
E = h p ρ + u i 2 2
The meaning of the parameters is shown in Table 2.
(3)
The momentum conservation equation
The law of conservation of momentum means that the change rate of the momentum of the fluid in the micro-element relative to time is equal to the sum of various forces acting on the micro-element. The momentum conservation equation [22,25] is:
( ρ u i ) t + ( ρ u i u j ) x j = p x i + τ i j x j + ρ g i + F i ,
τ ij = [ μ ( u i x j + u j x i ) ] 2 3 μ u l x l δ i j
The meaning of the parameters is shown in Table 3.
(4)
The control equation of the standard k-ε model
The standard k-ε model is one of the most widely used turbulence models in the industry. It is a turbulence calculation model suitable for high-Reynolds-number conditions. Through the calculation of the non-circular pipe Reynolds number formula, the simulation in this paper belongs to high-Reynolds-number conditions. The Reynolds number formula and the governing equations of turbulent kinetic energy k and dissipation rate ε (incompressible fluid) are expressed as follows [26,27].
Re = 4 v s g u ,
( ρ k ) t + ( ρ k u i ) x i = x j [ ( μ + μ t σ k ) k x j ] + G k ρ ε ,
( ρ ε ) t + ( ρ ε u i ) x i = x j [ ( μ + μ t σ ε ) ε x j ] + C 1 ε ε k G k C 2 ε ρ ε 2 k ,
The meaning of the parameters is shown in Table 4.

3.2. Grid Sensitivity

In the CFD numerical simulation method, the quality of the grid is the direct factor affecting the accuracy and efficiency of the final results. When the grid size is large, the calculation results will not reach the expected convergence accuracy, or the simulation results may not show the required important data and change characteristics. When the grid size is small, the calculation results require the higher performance of the computer, and the simulation process takes a long time. Therefore, dividing into suitable grids is an extremely important step in the simulation process. After trying and analyzing, the two-dimensional model and the three-dimensional model in this paper use 0.1 m grid cell size to meet the requirements of model calculation accuracy. Among them, the three-dimensional model grid size of 0.1 m is a characteristic cell size in the central part of the region, which is the average grid size.
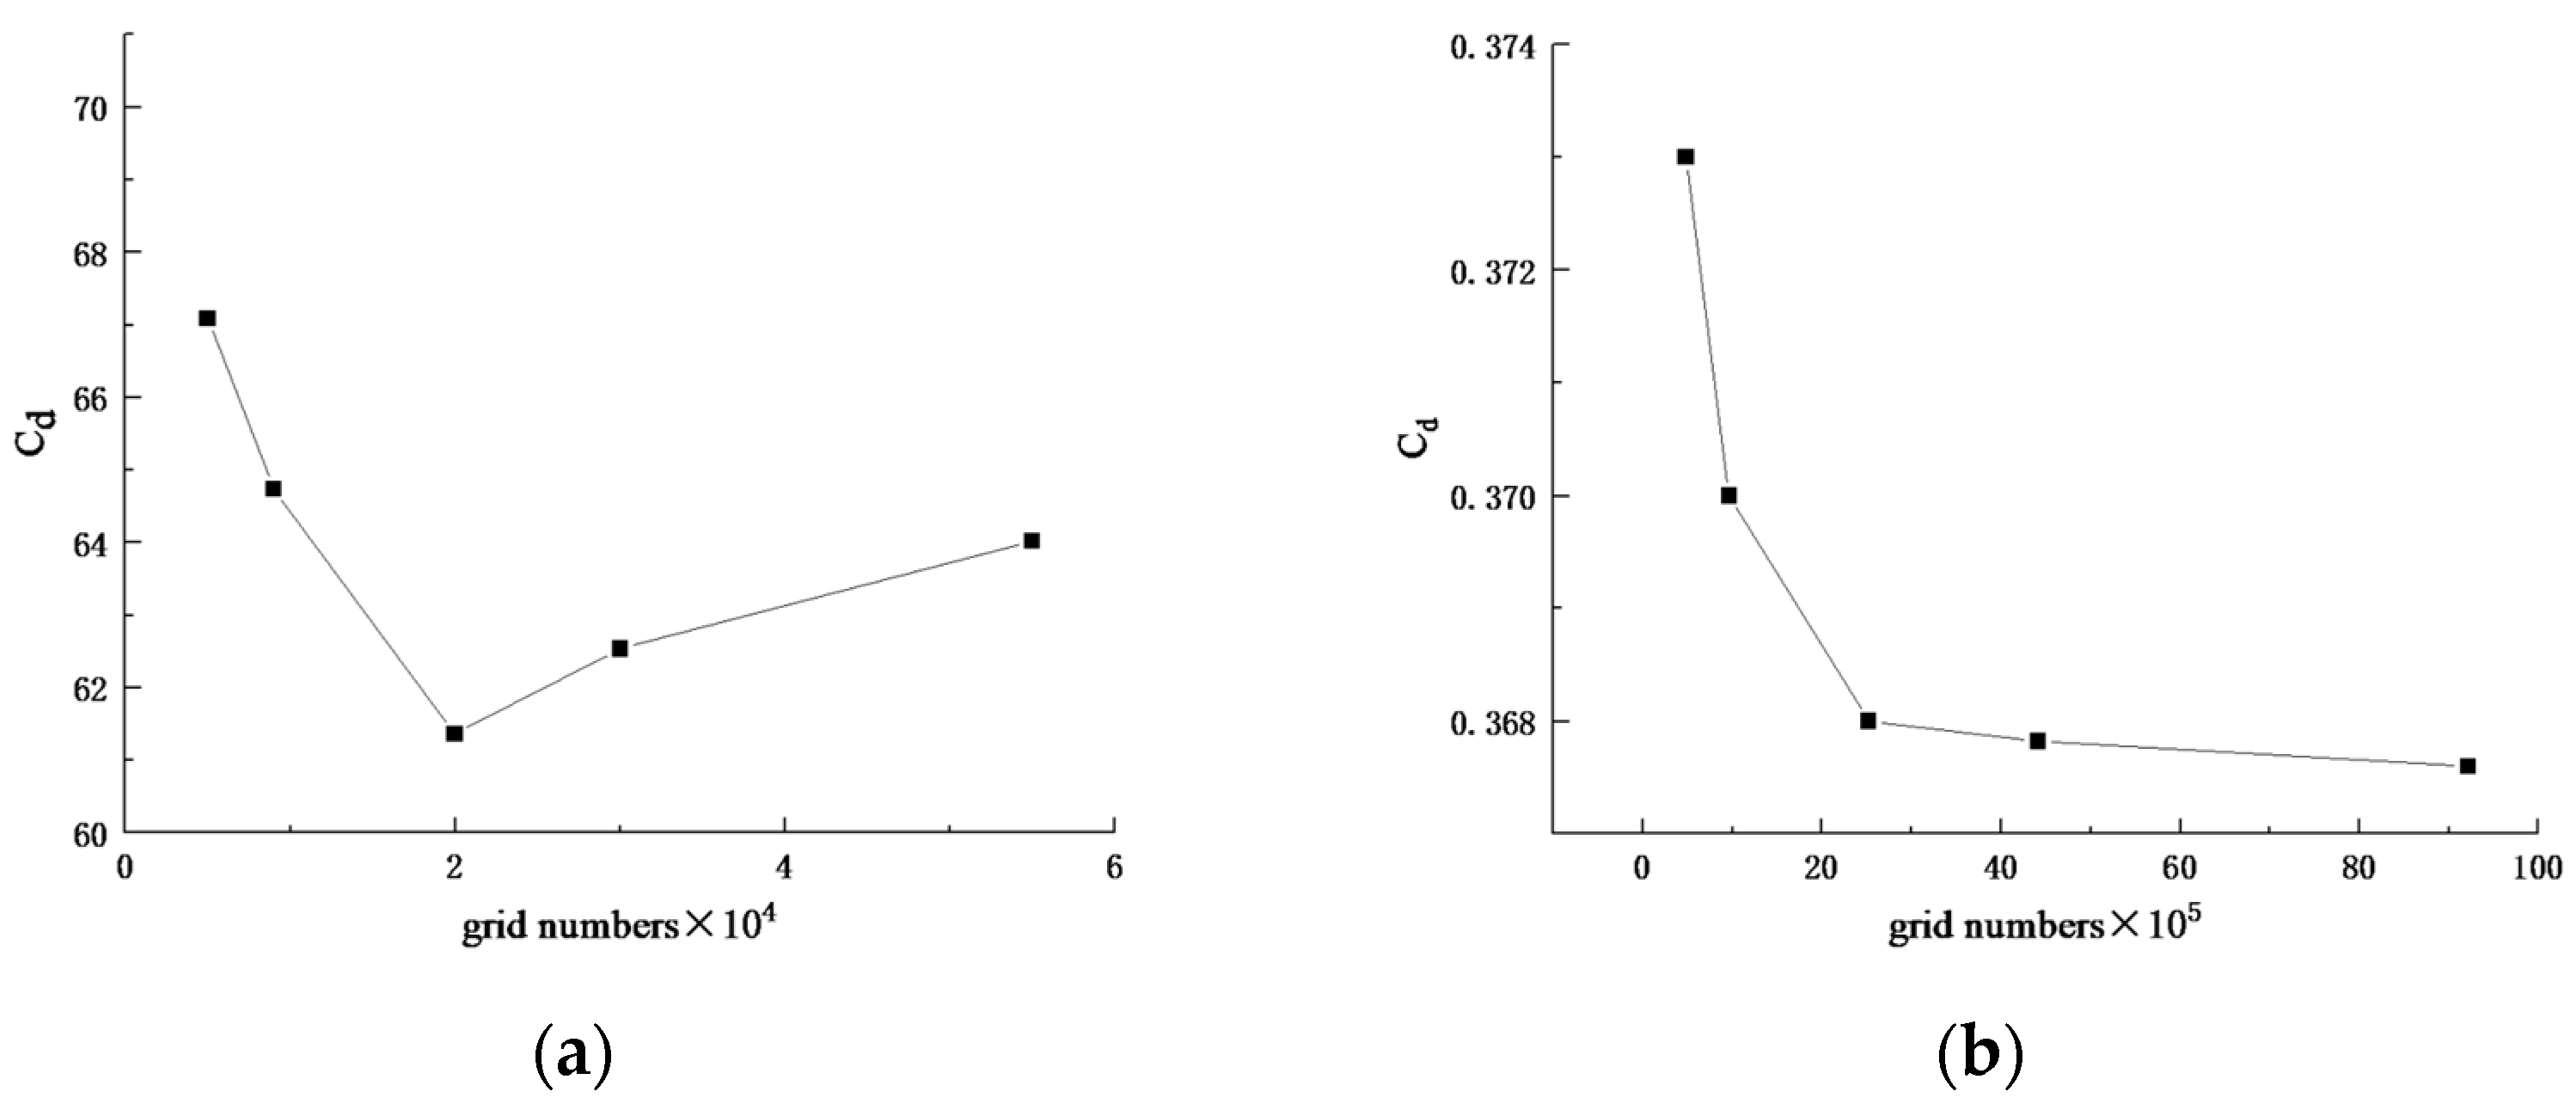
Since the number of grids directly affects the accuracy of calculation results, it is necessary to test the grid independence. The two-dimensional model and the three-dimensional model are divided into different numbers of grids, and the resistance coefficient cd value is used as the evaluation index to check the grid independence. The grid independence test results are shown in Figure 2. In the two-dimensional model, as the number of grids increases, the cd value decreases first and then increases. When the number of grids is 19,916, the cd value is the smallest and the orthogonal quality of the grid is the best. In the three-dimensional model, when the number of grids increases from 476,026 to 2,521,485, the change of the cd value is large, and when the number of grids increases from 2,521,485 to 9,221,527, the change of the cd value is small. Therefore, to reduce the consumption of computer resources and time, the number of grids selected for the two-dimensional model is 19,916, the number of grids selected for the three-dimensional model is 2,521,485, and the grid size is 0.1 m.

3.3. Boundary Condition

The inlet boundary condition is the amount of flow at the entrance of the model. In this study, it is set as the velocity inlet boundary condition and is suitable for an incompressible fluid. When the model has only one inlet and one outlet, the most robust settings are the velocity inlet and the pressure outlet. In this study, the gauge pressure in the pressure boundary condition is zero. The wall boundary condition adopts the default static non-slip wall for viscous flow calculation.

3.4. Initial Condition

Before the iterative calculation, it is necessary to set the initial conditions. If the initial condition setting value is close to the convergence value, the calculation speed is fast. On the contrary, the calculation speed is very slow or even does not converge. There are global initialization and local initialization in FLUENT. In this study, hybrid initialization in global initialization is used, so that a high-order algorithm can be selected for calculation.

4. Selection of Personnel Door Position

In order to reduce the influence of the personnel door on the air speed and air pressure of the roadway, different positions of the personnel door at a door are made a numerical simulation to optimize the position of the personnel door.

4.1. Numerical Model Establishment

Without considering the relationship between the personnel door’s position and the roadway’s space and height, the simplified two-dimensional roadway model is used to improve the calculation accuracy of the model. Referring to the size of the main ventilation roadway in the coal mine, a two-dimensional roadway model with a length of 40 m and width of 5 m is established, as shown in Figure 3. Set the distance from the personnel door from the center of the roadway at 200 mm, 400 mm, 600 mm, 800 mm, and 1000 mm; the model size scheme is shown in Table 5.

4.2. Grid Partition and Parameter Selection

(1)
Grid partition
For the two-dimensional roadway model, a tetrahedral grid is used. The unit size of the grid is 0.1 m; the number of elements of the grid is 19,916, and the average orthogonal quality of the grid is 1. The overall quality is good, as shown in Figure 4.
(2)
Parameter setting
After the grid quality check, set the parameters. Because only the influence of fluid motion on the air speed and air pressure of the roadway is studied, the heat exchange between the wall and the airflow is not considered, and the energy equation is not opened. The standard k-ε turbulence model is selected, and the coupled algorithm is used to solve the pressure velocity coupling. Assuming that there is no mass source input in the roadway, the fluid in the mine roadway is regarded as a viscous incompressible fluid, and the air density is 1.2 kg/m3. The boundary conditions of the two-dimensional roadway model are shown in Table 6, and the initial conditions are shown in Table 7.

4.3. Analysis of Simulation Results

From the pressure cloud diagram of different personnel door positions at the same air speed in Figure 5, it can be seen that, as the distance between the personnel door and the middle line of the roadway decreases, the air pressure of the roadway on the windward side of the personnel door is relatively stable, and the air pressure value is about 2.6 × 10³ Pa. At 29 m of the roadway, comparing the distance between the personnel door and the middle line of the roadway ≤400 mm with >400 mm, the air-pressure value is reduced by one level, and the overall trend of the air pressure of the roadway gradually decreases to both sides. Thus, it is better when the distance between the personnel door and the middle line of the roadway is ≤400 mm.
There are two air-pressure areas, approximately ‘oval’ and ‘semi-circular arch’ at the leeward of the air door with the personnel door. To intuitively see the trend of change, a straight line is selected at the near wall of the roadway. As shown in Figure 6, the overall trend of the air-pressure change curve in the length direction of the roadway at the leeward of the personnel door is roughly the same. When the personnel door is ≥800 mm from the center of the roadway, the ab section of the curve is steep, indicating that the air pressure changes greatly. The ac section of each curve is an ‘oval’ air pressure area, and the closer the personnel door is to the middle line of the roadway, the larger the area is; the ce section is a ‘semi-circular arch’ air pressure area, and the closer the personnel door is to the middle line of the roadway, the larger the area is; in short, it can also be seen from the ae section of each curve that the closer the personnel door is to the middle line of the roadway, the larger the two air-pressure areas at the leeward side of the personnel door. From the air-pressure contour line at the personnel door in Figure 7, it can be seen that, when the distance between the personnel door and the middle line of the roadway changes from 200 mm to 1000 mm, the maximum air-pressure value gradually increases, and the variable range of air pressure near the windward side of the personnel door decreases from 13.65~13.02 m, and the change range of 200~400 mm is only 0.06 m; the variable range of air pressure near the leeward side decreases from 15.86 m to 15.57 m, and the difference between the range of 400 mm and 200 m from the personnel door to the middle line of the roadway is twice that of 400 mm and 1000 mm.
From the velocity cloud diagram of the same air speed and different personnel-door positions in Figure 8, it can be seen that the overall air-speed change trend of the roadway is roughly the same. The smaller the distance between the personnel door and the middle line of the roadway, the smaller the change degree of the air-speed area on the windward side and the smaller the airflow concentration near the leeward side personnel door, and the air speed value gradually decreases. Due to the blocking of the air-door wall and the influence of the width of the personnel door, the air speed increases sharply after the airflow passes through the personnel door, and a large eddy-current area appears on the leeward side near the wall side, so the airflow must overcome greater air resistance there. When the distance is 200~1000 mm, the red part behind the personnel door in the length direction of the roadway, that is, the highest air-speed area decreases from 4.18 m to 3.37 m, and the slope with the length of the roadway decreases from −15.11° to −10.2°, indicating that the maximum air-speed area has a large influence range in the length direction of the roadway when the distance is small, but the influence range in the width direction of the roadway is narrow.
To sum up, due to the blocking of the personnel door, the change of air speed and air pressure on the windward side of the personnel door is small, and the change on the leeward side is more obvious. In the vicinity of the air door and the leeward side near the wall side is the air-speed reverse, resulting in eddy current areas, indicating that the airflow needs to overcome the stronger air resistance. Under the action of roadway friction resistance, with a farther distance from the air door, the roadway airflow redistribution gradually stabilized. By analyzing the air-pressure cloud diagram and the air-speed cloud diagram of the roadway at different positions of the personnel door, it is concluded that the distance of 400 mm from the middle line of the roadway has little influence on the air speed and air pressure of the roadway.

5. Selection of Anemometer Position

5.1. Model Establishment

According to the actual size of the main underground ventilation roadway, a three-dimensional semi-circular arch roadway model with a length of 50 m, a width of 5 m, and a height of 4.5 m is established in Solidworks according to a certain proportion. In the case of not affecting personnel and opening to traffic and removing the door frame, the wide door is designed to be 3 m high and 4.2 m wide; the personnel door is 1.6 m high and 0.8 m wide, and 0.3 m from the bottom. The thickness is set to 0.2 m by using the resection-stretch and tab-stretch functions. The model after the wide door is opened is shown in Figure 9a. The model after the personnel door is opened is shown in Figure 9b. The model size scheme is shown in Table 8.

5.2. Grid Partition and Parameter Selection

(1)
Grid partition
After the model is established, Mech is used for meshing. The roadway is mainly composed of tetrahedral mixed grid units, and the door wall is made of hexahedral grid units. The three-dimensional roadway grid is divided in Figure 10. Five boundary layers are set on the impermeable walls. The number of grid units divided is, for the wide door roadway model, 2,521,485, and for the personnel door roadway model, 2,619,591; the grid quality is good.
(2)
Parameter setting
Set the left side of the roadway to be inlet, the right side to be outlet, the door wall to be wall-men, and the rest of the wall to be wall-hang. The roadway inlet is set as the speed inlet; the roadway outlet is set as the pressure outlet, and the gauge pressure is 0. The standard k-ε turbulence model widely used in mine ventilation is adopted. Select based on pressure and velocity coupling solver. It is assumed that the wall is stationary, with no slip and no energy exchange process. Assuming that the fluid in the roadway is incompressible turbulence, the air density is set as a constant. The boundary conditions of the three-dimensional roadway model are shown in Table 9, and the initial conditions are shown in Table 10.

5.3. Simulation Results

According to the ‘Coal Mine Safety Regulations’ (2022 Edition), the maximum allowable air speed of the main underground intake and return airways is 8 m/s. Therefore, this paper simulates the roadway air-speed distribution under different air speeds of 2 m/s, 4 m/s, 6 m/s, and 8 m/s. Select the air door behind the 5 m, 10 m, 15 m, 20 m, 25 m, and 30 m roadway cross-section, and observe the change law of air speeds, as shown in Figure 11, and the air-speed distribution of the roadway cross-section. Figure 11a–d shows that the velocity profile at 25 m outside the door does not change with the inlet conditions. The air-speed profile in the middle of the roadway is similar to the shape of the wide door. Due to the blocking of the wide door, a ‘zero circle’ area appears at the top of the roadway. The farther away from the wide door, the area gradually shrinks to disappear. Figure 11 shows that the air-speed changes greatly within 25 m after the air door; the changing trend of air speed in the roadway outside 25 m is gradually stable, and the air-speed contour lines tend to be consistent. From the velocity cloud diagram at different positions of the personnel door in Figure 8, it can be seen intuitively that the 25 m behind the personnel door has avoided the air-speed concentration area. Therefore, the influence of different air speeds on the position of the anemometer is analyzed at the 25 m cross-section.
The cross-section air-speed distribution cloud diagram data at 25 m behind the wide door is imported into Origin for post-processing. As shown in Figure 12, the line marked with dots in the diagram is the average air-speed line, and the influence of air speed on the shape of the average air-speed line is neglected. The precision anemometer installed on the two sides of the roadway is used to change the limitation of the traditional ‘point instead of surface’. By comparing the X-axis and Y-axis data of the average air-speed contour line of the roadway cross-section at different air speeds, the installation point of the anemometer can be set on the left side of the roadway (0.41, 2.45) and the right side of the roadway (4.59, 2.43) without hindering the traffic and pipeline installation.

5.4. Theoretical Calculation

It is assumed that the air parameters in the roadway are constant and that there are no items that block the airflow movement. To obtain the analytical solution of the mathematical model, the effect of roadway corners is ignored, and it is ensured that the air-speed contour is parallel to the shape of the roadway cross-section. According to the Bousinesk theory and Prandtl turbulence theory [16], the expression of air speed at any point of the roadway cross-section is obtained, and the calculation formula of the air volume of the roadway cross-section is obtained by integral. According to the relationship between air volume and roadway cross-section area, the average air-speed value of the cross-section is obtained, and then the distance formula of the average air-speed line from the roof and floor and left and right sides are obtained. After research, the position of the average air-speed line is only related to roadway size; the error between the theoretical calculation result and the simulation result is kept within 4%, which shows that it has certain reliability.
For the semi-circular arch roadway, the formula of the average air-speed line from the roof and from the left and right sides is:
y 1 = e ln a 1.5 ,
x = e ln a 1.5 ,
The formula for the average air-speed line from the floor is:
y 2 = e ln b 1.5 ,
In the formula, y 1 is the distance between the average air-speed line and the roof, y 2 is the distance between the average air-speed line and the floor, and x is the distance between the average air-speed line and the roadway sides. a is half of the roadway width, and b is half the height of the straight wall of the roadway.
Bring the value into them when there are no sundries in the roadway. The distance between the average air-speed line and the roof and the left and right sides is 0.5578, and the distance from the floor is 0.2231. In this paper, the roadway airflow is blocked by the air door, and the airflow distribution is stable 25 m behind the door. The simulation results show that the average air-speed line is approximately equal to 0.20 m from the floor when there is no debris in the roadway. The anemometer is installed at 0.41 m away from the left and right sides to approach the distance between the average air-speed line and the left and right sides when there is no influence of sundries. The simulation results have certain theoretical guidance.

6. Discussion

At present, the underground air door is mainly used to cut off the airflow, close the fire zone, and, through the door opening and closing, for the underground roadway to replace fresh air and adjust the air volume. In this paper, the influence of the opening of the air door in a short time on the flow field of the roadway is used to simulate the air-speed distribution. The position of the personnel door and the anemometer are determined theoretically and simulated, but the influence of the change in the cross-section size of the roadway on the position of the anemometer is not considered. Therefore, in future research, the deformation of the roadway needs to be considered, and the accuracy of the simulation research needs to be verified by experiments or actual working conditions. Furthermore, for the automatic air door with a personnel door in the coal mine, it is necessary to use the three-dimensional model to further study the influence of personnel-door position on the mine ventilation system. It is more scientific and reasonable to provide an effective reference for the accurate measurement of underground air speed and the design of ventilation structures.

7. Conclusions

(1)
Through the introduction of an automatic air door with a personnel door, a two-dimensional roadway model is established. The personnel door is set to be 200 mm, 400 mm, 600 mm, 800 mm, and 1000 mm from the middle line of the roadway. FLUENT is used to simulate and compare the change in air speed and air pressure in the roadway under the same air speed at different positions of the personnel door, and it is intuitively seen that the personnel door has less influence on the roadway air pressure and air speed when it is installed 400 mm from the middle line of the roadway. This shows that the air door has an important regulating effect on mine ventilation. There is an eddy area near the air door and near the wall side, where the airflow should overcome greater resistance, provide a reference for the rational arrangement of ventilation structures and ventilation power in the underground, and provide guidance for the design of the air-door structure.
(2)
FLUENT is used to simulate the different air speeds of 2 m/s, 4 m/s, 6 m/s, and 8 m/s. Cross-sections of 5 m, 10 m, 15 m, 20 m, 25 m, and 30 m behind the wide door and personnel door are observed. It can be seen that the air speed changes greatly within 25 m. Therefore, 25 m is selected for simulation analysis. The average air-speed line of the roadway cross-section and the installation position of the precision anemometer are determined by Origin software post-processing as the left side (0.41, 2.45) and the right side (4.59, 2.43) at 25 m of the roadway. Based on the stable distribution of airflow at 25 m, the position of the anemometer in the simulation results is close to the theoretical calculation results when there is no obstruction in the roadway, which shows that the simulation results have certain reliability and theoretical guidance for the installation of the anemometer.

Author Contributions

Conceptualization, T.Q. and Y.L.; validation, T.Z.; formal analysis and investigation, Y.D.; data curation, T.Q., T.Z., Y.D. and Y.L.; writing—original draft preparation, T.Z.; writing—review and editing, T.Q., Y.D. and Y.L.; supervision, T.Q. and Y.L. All authors have read and agreed to the published version of the manuscript.

Funding

This work was supported by the Outstanding Young Talents Project supported by the Central Government for The Reform and Development of Local Universities (2020YQ13) and the Scientific and Technological Key Project of “Revealing the List and Taking Command” in Heilongjiang Province: Study on geological model and ventilation model of intelligent mining in extremely thin coal seam (2021ZXJ02A03).

Data Availability Statement

Not applicable.

Conflicts of Interest

The authors declare no conflict of interest.

References

  1. Wang, G.F. Discussion on the latest technological progress and problems of the intelligent coal mine. J. Coal Sci. Technol. 2022, 50, 1–27. [Google Scholar]
  2. Zhou, F.B.; Wei, L.J.; Xia, T.Q.; Wang, K.; Wu, X.Z.; Wang, Y.M. Principle, key technology and preliminary realization of mine intelligent ventilation. J. Coal J. 2020, 45, 2225–2235. [Google Scholar]
  3. Yang, B.; Yao, H.C.; Wang, F. A Review of Ventilation and Environmental Control of Underground Spaces. Energies 2022, 15, 409. [Google Scholar] [CrossRef]
  4. Wu, D.F. Design and application of mine main fan non-stop reversing system. J. Mech. Manag. Dev. 2018, 33, 204–205+271. [Google Scholar]
  5. Yang, Y.B.; Xu, S. Research and application of modern large-scale mine pneumatic air door. J. Coal Mine Saf. 2018, 49, 49–52. [Google Scholar]
  6. Zhang, Y.J.; Du, D.J.; Xu, P.; Wang, C.Y. Numerical simulation of side-scroll air door based on FLUENT. J. Coal Mine Mach. 2020, 41, 31–33. [Google Scholar]
  7. Sheng, D. Research on ventilation system of underground air door in coal mine based on FLUENT. J. Coal Technol. 2022, 41, 149–151. [Google Scholar]
  8. Deng, L.J.; Shang, W.T.; Liu, J.; Wang, D.; Song, Y. Experimental study on the influence of air door opening and closing on mine airflow. J/OL. J. Saf. Environ. 2022, 1–12. Available online: https://kns.cnki.net/kcms/detail/detail.aspx?FileName=AQHJ20220507000&DbName=DKFX2022 (accessed on 9 November 2022).
  9. Hu, J.H.; Zhao, Y.; Zhou, T.; Xiao, H.X.; Zhao, L. Study on distribution characteristics of air velocity behind air door in mine ventilation roadway. J. Min. Metall. Eng. 2021, 41, 1–5+10. [Google Scholar]
  10. Lu, G.L.; Tian, M.Y.; Zhou, H. Numerical simulation of the influence of air door on the flow characteristics of mine fire smoke. J. China Saf. Prod. Sci. Technol. 2021, 17, 53–58. [Google Scholar]
  11. Xu, G.; Jong, E.C.; Luxbacher, K.D.; Ragab, S.A.; Karmis, M.E. Remote characterization of ventilation systems using tracer gas and CFD in an underground mine. Saf. Sci. 2015, 74, 140–149. [Google Scholar] [CrossRef]
  12. Zhang, Q.H.; Yao, Y.H.; Zhao, J.Y. Present situation and intelligent development prospect of mine ventilation technology in China. J. Coal Sci. Technol. 2020, 48, 97–103. [Google Scholar]
  13. Huang, X. Research on mine intelligent ventilation system architecture and real-time network solution. D. Liaoning Univ. Eng. Technol. 2021. [Google Scholar] [CrossRef]
  14. Lu, G.L.; Zhang, M.H.; Fan, C.Q. Analysis of fixed-point air speed measurement based on CFD. J. Coal Technol. 2015, 34, 156–157. [Google Scholar]
  15. Sun, Y.X.; Zhang, L.; Yang, X.; Liu, Y.Q.; Ma, Q.; Li, W.; Zhang, H.J.; Zhao, K.; Duan, S.G. Development and application of au-tomatic on-line test device for air volume in the roadway. J. Coal Mine Saf. 2022, 53, 251–256. [Google Scholar]
  16. Luo, G. Study on air speed distribution law and accurate monitoring of air volume in typical roadway cross-section. D. Gen. Inst. Coal Sci. Res. 2020. [Google Scholar] [CrossRef]
  17. Sun, L.; Sun, Z.P. Study on air velocity distribution law and air volume monitoring in large cross-section roadway of mine. J. Coal Technol. 2022, 41, 97–100. [Google Scholar]
  18. Zhang, L. Research on optimization of average air speed measurement position of anemometer in roadway air station. Coal Sci. Technol. 2018, 46, 96–102. [Google Scholar] [CrossRef]
  19. Zhang, L.; Yao, H.F.; Li, W.; Yang, Y.; Sun, X.G.; Liu, Y.Q.; Zheng, Y. Research and application of mine intelligent ventilation equipment. J. Intell. Mine 2022, 3, 71–79. [Google Scholar]
  20. Wang, J. The influence of air window on air volume regulation in coal mine roadway. Chin. High-Tech Enterp. 2012, 123–126. Available online: https://kns.cnki.net/kcms/detail/detail.aspx?FileName=ZGGX201216049&DbName=CJFQ2012 (accessed on 9 November 2022).
  21. Yu, J. Study on air volume automatic adjustment control device of underground air window D. Taiyuan Univ. Technol. 2014. Available online: https://kns.cnki.net/kcms/detail/detail.aspx?FileName=1014418163.nh&DbName=CMFD2015 (accessed on 9 November 2022).
  22. Fang, B. Analysis of measured data of anemometer. D Liaoning Tech. Univ. 2016. Available online: https://kns.cnki.net/kcms/detail/detail.aspx?FileName=1018261541.nh&DbName=CMFD2019 (accessed on 9 November 2022).
  23. Zhang, G.S.; Tan, Y.Z. Ventilation Safety, 2nd ed.; University of Mining and Technology Press: Xuzhou, China, 2011; p. 24. [Google Scholar]
  24. Yi, H.; Kim, M.; Lee, D.; Park, J. Applications of Computational Fluid Dynamics for Mine Ventilation in Mineral Development. Energies 2022, 15, 8405. [Google Scholar] [CrossRef]
  25. Liu, H.; Mao, S.J.; Li, M. A Case Study of an Optimized Intermittent Ventilation Strategy Based on CFD Modeling and the Concept of FCT. Energies 2019, 12, 721. [Google Scholar] [CrossRef] [Green Version]
  26. Zhang, Q.; Zhou, G.; Qian, X.M.; Yuan, M.Q.; Sun, Y.L.; Wang, D. Diffuse pollution characteristics of respirable dust in fully-mechanized mining face under various velocities based on CFD investigation. J. Clean. Prod. 2018, 184, 239–250. [Google Scholar] [CrossRef]
  27. Wang, H.; Qiu, L.M.; He, X.Q.; S, D.Z.; Zhao, Y.J. Study on the distribution law of air speed in coal mine roadway cross-section under different factors. J. Min. Res. Dev. 2022, 42, 125–132. [Google Scholar]
Figure 1. Automatic air door with personnel door.
Fluids 08 00026 g001
Figure 2. Grid independence test results. (a) Two-dimensional model grid independence test results; (b) three-dimensional model grid independence test results.
Fluids 08 00026 g002
Figure 3. Two-dimensional roadway model.
Fluids 08 00026 g003
Figure 4. Two-dimensional roadway grid partition.
Fluids 08 00026 g004
Figure 5. Pressure cloud diagram of different personnel door positions at the same air speed. (a) 200 mm; (b) 400 mm; (c) 600 mm; (d) 800 mm; (e) 1000 mm.
Fluids 08 00026 g005aFluids 08 00026 g005b
Figure 6. Air-pressure variation curve of roadway-length direction at the leeward side of personnel door.
Fluids 08 00026 g006
Figure 7. Contour lines of air pressure at personnel door. (a) 200 mm; (b) 400 mm; (c) 600 mm; (d) 800 mm; (e) 1000 mm.
Fluids 08 00026 g007
Figure 8. Velocity cloud diagrams of the same air-speed and different personnel-door positions. (a) 200 mm; (b) 400 mm; (c) 600 mm; (d) 800 mm; (e) 1000 mm.
Fluids 08 00026 g008
Figure 9. Three-dimensional roadway model of wide door and personnel door. (a) Wide door opening; (b) personnel door opening.
Fluids 08 00026 g009
Figure 10. Grid division of three-dimensional roadway. (a) Personnel-door roadway; (b) Wide-door roadway.
Fluids 08 00026 g010
Figure 11. Air speed distribution of the roadway cross-section. (a) Air-speed distribution of the roadway cross-section behind the wide door at 2 m/s; (b) Air-speed distribution of the roadway cross-section behind the wide door at 4 m/s; (c) Air-speed distribution of the roadway cross-section behind the wide door at 6 m/s; (d) Air-speed distribution of the roadway cross-section behind the wide door at 8 m/s; (e) Air-speed distribution of the roadway cross-section behind the personnel door at 8 m/s.
Fluids 08 00026 g011aFluids 08 00026 g011b
Figure 12. Contour lines of air speed 25 m behind the wide door. (a) 2 m/s; (b) 4 m/s; (c) 6 m/s; (d) 8 m/s.
Fluids 08 00026 g012
Table 1. Parameter meaning of mass conservation equation.
ParameterMeaning
x i coordinate tensor
ρ t rate of density
( ρ u i ) x i divergence of mass flow density
Table 2. Parameter meaning of energy conservation equation.
ParameterMeaning
k e f f = k t + k effective heat transfer coefficient of fluid
J j diffusion flux of j
ideal gas h = j m j h j , h j = T r e f T c p , j d T , T ref = 298.15 K
incompressible gas h = j m j h j + p ρ
Table 3. Parameter meaning of momentum conservation equation.
ParameterMeaning
Pstatic pressure
ρ g i gravity volume force
F i external volume force
Table 4. Parameter meaning of control equation of standard k-ε model.
ParameterMeaning
scross-section area of roadway
uroadway cross-section perimeter
gviscosity coefficient of fluid motion
σ k empirical constant, take 1.0
C 1 ε empirical constant, take 1.44
C 2 ε empirical constant, take 1.92
σ ε empirical constant, take 1.3
Table 5. Model size scheme.
NumberingRoadwayPersonnel Door Distance to Roadway Center/mm
Length/mWidth/m
1405200
2400
3600
4800
51000
Table 6. Model boundary conditions.
Boundary ConditionBoundary Naming
roadway inletinlet
roadway outletoutlet
roadway and personnel door wallwall
Table 7. Model initial conditions.
Initial ConditionParameter Setting
turbulence modelstandard k-ε model
air density1.2 kg/m3
wallstatic and no slip
inlet condition8 m/s
outlet conditiongauge pressure is 0
pressure velocity coupling solvercoupled
initializationhybrid initialization
convergence criteria0.001
Table 8. Three-dimensional roadway model size scheme.
NumberingRoadwayWide DoorPersonnel DoorAir Speed
m/s
Length/mHeight/mWidth/mHeight/mWidth/mThickness/mHeight/mWidth/mDistance Bottom/mThickness/m
1504.5534.20.21.60.80.30.22 m/s
24 m/s
36 m/s
48 m/s
Table 9. Boundary conditions of three-dimensional roadway model.
Boundary ConditionBoundary Naming
roadway inletinlet
roadway outletoutlet
(personnel door/wide door) door wallwall-men
rest of the wallwall-hang
Table 10. Initial conditions of three-dimensional roadway model.
Initial ConditionParameter Setting
turbulent flow modelstandard k-ε model
air density1.2 kg/m3
wall roughness constant0.5
wall roughness height0.029
outlet gauge pressure0
velocity-inlet2 m/s, 4 m/s, 6 m/s, 8 m/s
pressure velocity coupling solvercoupled
convergence criteria0.001
Disclaimer/Publisher’s Note: The statements, opinions and data contained in all publications are solely those of the individual author(s) and contributor(s) and not of MDPI and/or the editor(s). MDPI and/or the editor(s) disclaim responsibility for any injury to people or property resulting from any ideas, methods, instructions or products referred to in the content.

