Abstract
A simplified model based on the Modified Mild-Slope Equation with inclusions is developed for modelling the scattering of waves from multiple heaving point absorbers arranged in an array in general bottom topography. The model is used, in conjunction with a 3D BEM, in order to estimate the parameters modelling the energy extraction of the devices using data obtained from the hydrodynamic responses and performance of the single floating WEC. Subsequently, the present model is used for specific examples to calculate the wave field and the hydrodynamic performance of arrays of heaving WECs in constant depth and variable bathymetry regions and illustrate the effect of bottom slope and variation on the calculated wave field in the domain and in the vicinity of the devices. The present simplified model provides a low-cost first estimation of the wave conditions in the domain, which could be exploited as a supporting tool for best arrangement and park design purposes.
1. Introduction
The performance of Wave Energy Converters (WECs) operating in nearshore and coastal areas, characterized by variable bottom topography, is important for the estimation of the wave power absorption and determination of the operational characteristics of the system and could significantly contribute to the efficient design and layout of WEC farms. In this case, wave-seabed interactions may have a significant effect [1,2,3,4]. The operational behavior of a single device may have a positive or negative effect on the power absorption of the neighboring WECs in the farm (so-called near-field effects). As a result of the interaction between the WECs within a farm, the overall power absorption is affected. Finally, the wave height behind a large farm of WECs is reduced, and this change may influence coastal dynamics, neighbor installations, other users in the sea or even the coastline (so-called far-field effects).
In ref. [5], a 3D methodology is presented to treat the propagation–diffraction–radiation problem locally around each WEC, supporting the calculation of the interaction effects of the floating units with variable bottom topography at a local scale. The method is based on the coupled-mode model developed by Athanassoulis and Belibassakis [6] and extended to 3D by Belibassakis [7] for water wave propagation over general bottom topography, in conjunction with the Boundary Element Method (BEM) for the hydrodynamic analysis of floating bodies over general bottom topography, developed by Belibassakis [8] and extended for WEC array in general nearshore topography in Belibassakis [9]. An important feature of the above method is that it is free of mild-slope assumptions and restrictions and it is able to resolve the 3D wave field all over the water column in variable bathymetry regions, including the interactions of floating bodies of general shape. Numerical results are presented and discussed concerning simple bodies (heaving vertical cylinders), illustrating the applicability of the present method. The computational cost for the application of the above methods is quite increased due to mesh refinement requirements, especially in cases involving multichromatic and multidirectional incident waves in variable bathymetry and in the case of systematic applications required for park optimization. For this purpose, methods based on simplified models have been developed, e.g., the ones based on versions of the mild-slope equation with extra coefficients modelling the power absorption by the devices [1,10].
In parallel to the development of 3D models for the hydrodynamic analysis and optimization of WEC arrays and the large body of research concerning individual or pairs of WECs, a limited number of experimental studies of WEC arrays have been published. In the last period, several experimental works providing measured data for the response at the scale of an array have been presented by various authors [3,4]. In the latter works, wave basin experimental results are reported using models of large WEC arrays in a tank to study interactions between the converters and effects on the sea and the coastal area.
In this work, a simplified model based on the Modified Mild-Slope Equation (MMSE, see, e.g., [11,12,13]) with inclusions is developed for modelling the scattering of waves from multiple heaving point absorbers arranged in an array in general bottom topography. Restricting ourselves to the case of simple heaving point absorbers, the novelty of the present method concerns the development of an analytical solution for the wave scattering/dissipation problems by circular inclusions on the horizontal plane obtained by the Helmholtz equation to which the MMSE is transformed. The latter solution is subsequently used to tune the absorbing coefficient of the MMSE in the vicinity of the WECs on the horizontal domain using 3D BEM data in order to be used in the sequel for approximating multiple scattering effects by the WEC array. The calibration is performed by correlating the above loss of energy due to artificial absorption with the power output of floating heaving bodies of general shape in constant depth, calculated by 3D BEM, taking into account the WEC Power Take Off effect by using an additional damping coefficient in the system dynamics. Based on the above, the present model is then used to calculate the wave field in the presence of an array of heaving WECs in specific cases, both in constant depth and in variable bathymetry regions, and illustrate the effect of bottom slope and curvature on the flow details and structure in the domain and in the vicinity of the devices, which is useful for calculating the hydrodynamic performance of the array and could be exploited as a supporting tool for best arrangement and park design purposes.
2. Formulation
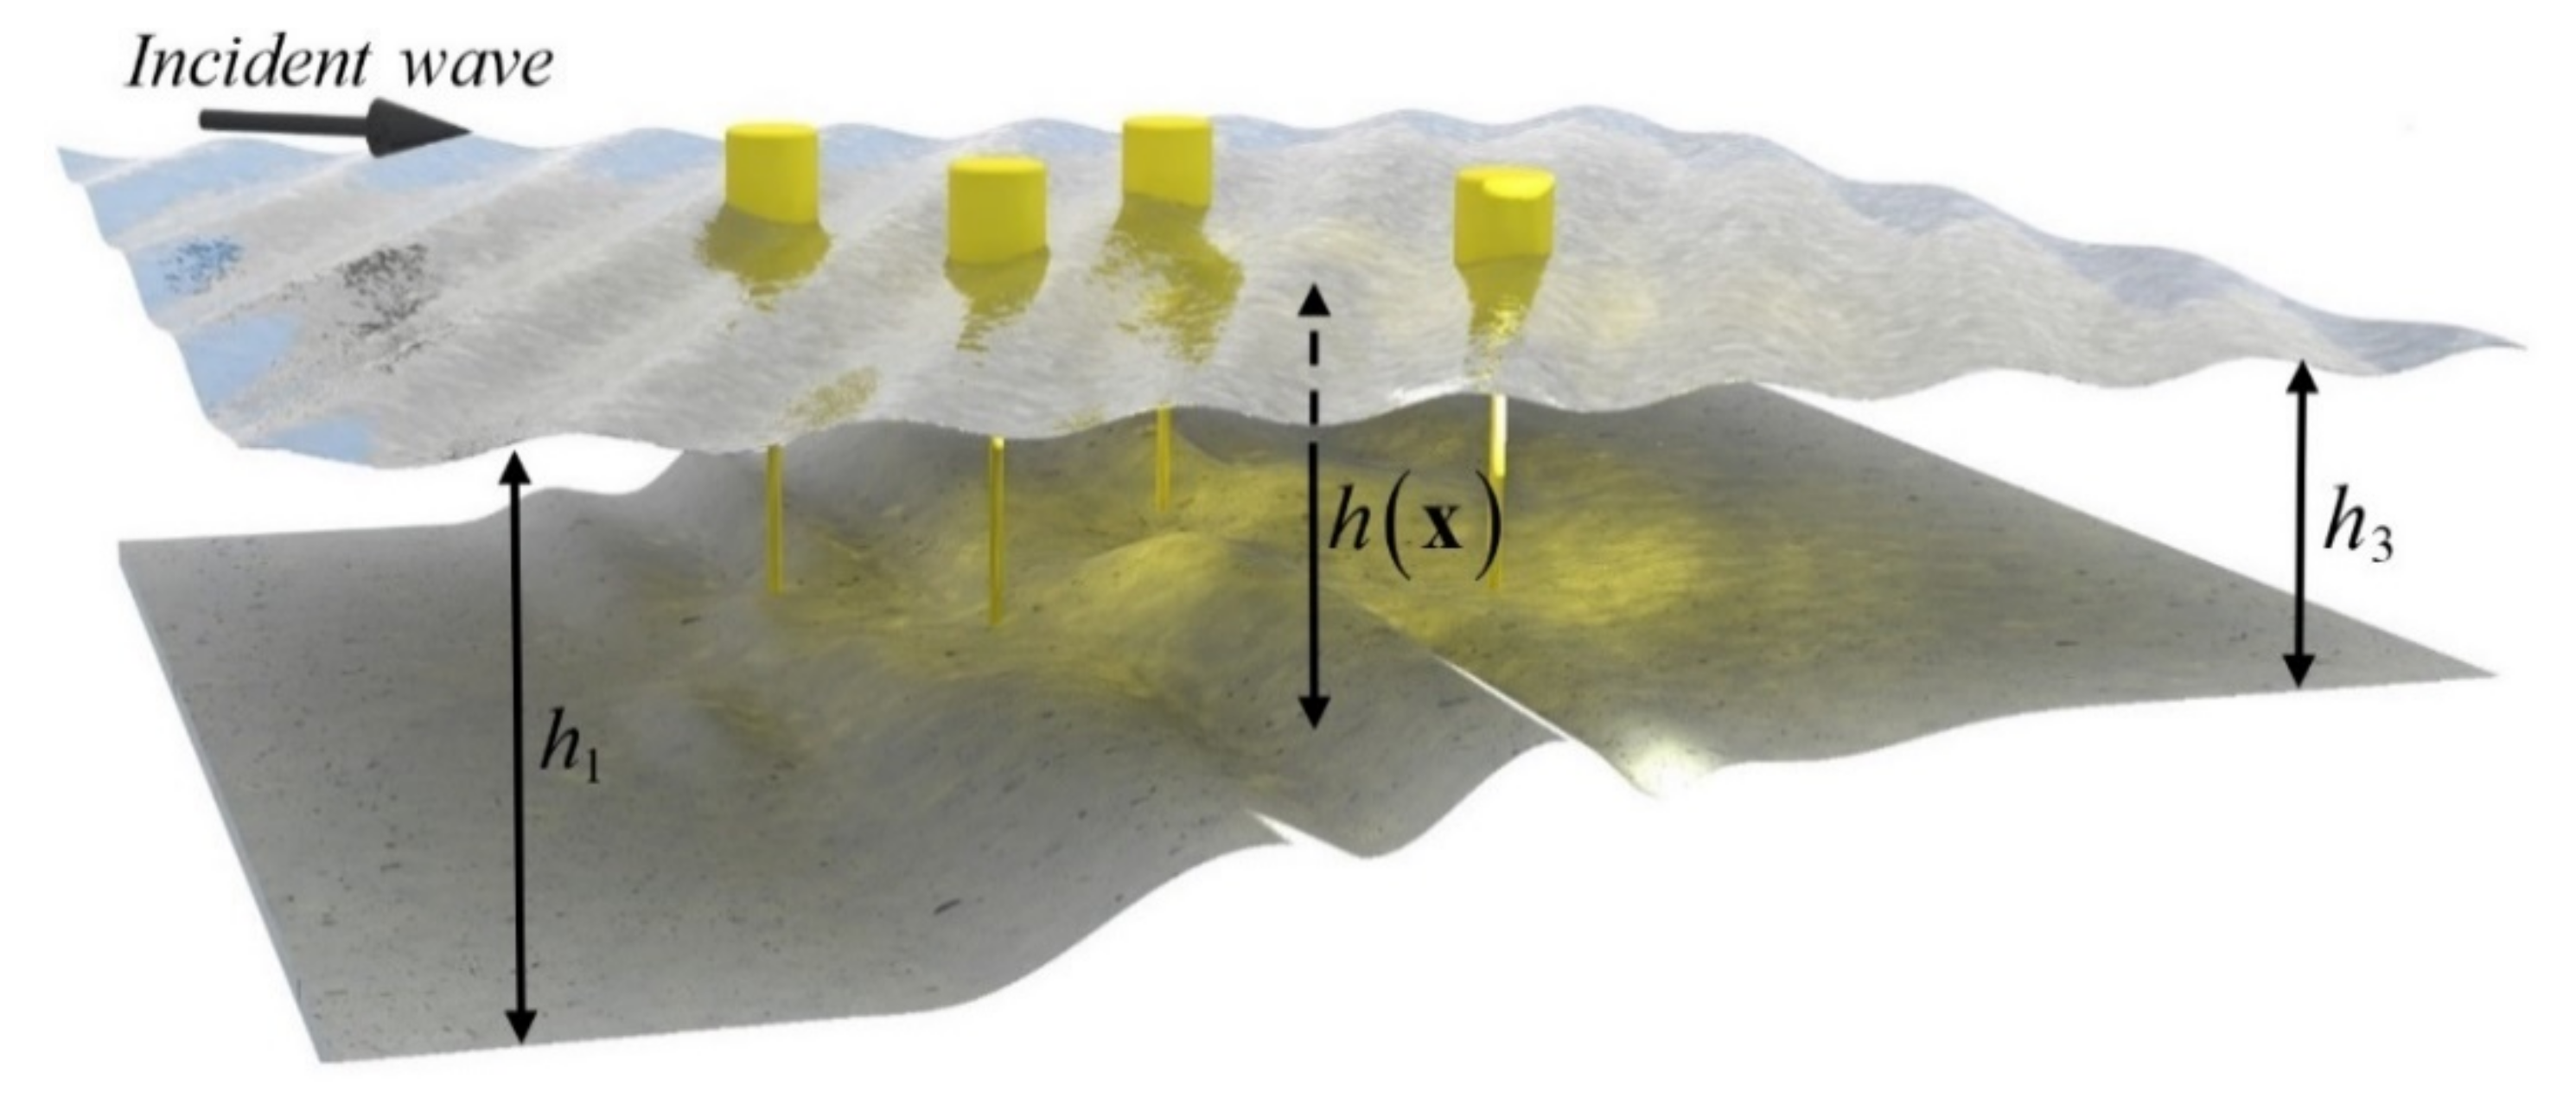
We consider here the hydrodynamic problem concerning the behavior of a number N of identical WECs of characteristic radius Rw and draft d, operating in the nearshore environment characterized by the depth function h, as shown in Figure 1.
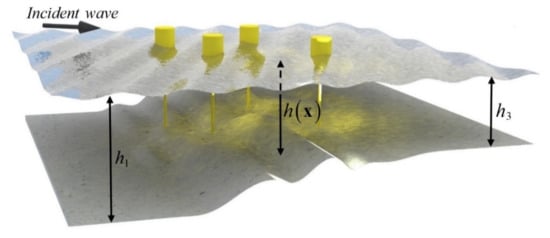
Figure 1.
Array of WECs in variable bathymetry region.
The variable bathymetry region is considered between two infinite sub-regions of constant but possibly different depths (region of incidence) and (region of transmission). In the middle sub-region, it is assumed that the depth exhibits an arbitrary variation. Remaining in the framework of linear wave theory, we consider that the wave field is excited by a harmonic incident wave of angular frequency ω, propagating with direction θ; see Figure 1. Under the assumption that the free-surface elevation and the wave velocities are small, the wave potential is expressed as
where and satisfies the linearized water wave equations; see Massel [11]. In the above equation, is the incident wave height, g is the acceleration due to gravity, is the frequency parameter, and . The free surface elevation is then obtained in terms of the wave potential as follows
The function is the normalized potential in the frequency domain, usually written as . In the fully 3D method by Belibassakis [9], the problem is treated in two parts: first, the propagation/refraction/diffraction of waves due to depth inhomogeneity in the variable bathymetry in the absence of floating bodies is solved, and subsequently, a 3D scattering problem is formulated and solved for the incorporation of the additional multiple scattering effects due to the presence of the WECs over the general seabed topography. For the first problem, the coupled-mode model, presented by Belibassakis [7], is used to treat the effects of the local 3D seabed variations on wave propagation. For the additional effects of WEC floaters oscillating in various degrees of freedom, a 3D BEM is presented by Belibassakis [9] and Bonovas [5], where applications illustrating the effect of an axisymmetric body with a general profile on the power output and the performance of the array can be found.
The computational cost of the above method is quite high, especially concerning systematic applications required for the preliminary design of the WEC array and the decision-making, concerning several important parameters affecting the performance and power production of the park, such as the arrangement of buoys and the Power-Take-Off (PTO) system design. This is true considering, apart from the 3D local features of the wave-flow problems involving the complexity of the nearshore environment and the body geometry of the floaters, also the requirement of multi-dof responses and performance estimation of the absorbers for a range of frequencies and directions, in applications associated with irregular incident waves, characterized by frequency or directional spectra. For this purpose, in the case of simple heaving cylindrical floaters, versions of the mild-slope equation (MSE) are approximately used by various authors formulated either in the time-domain [3,10] or the frequency domain [1]. Since the MSE is based on a particular wave structure in the vertical direction (depth-integrated model), a possible treatment is using a suitable absorbing function on the horizontal plane with tuned coefficients in order to better resemble the dissipation features of wave propagation over the floaters, due to the power extraction by the operation of WECs.
The present work is based on the above concept utilizing the modified mild-slope equation (MMSE) in the frequency domain, which includes higher-order bottom slope and curvature effects, as presented by Massel [12] and Chamberlain and Porter [13]. Restricting ourselves to the case of heaving point absorbers, usually modelled as cylindrical floating bodies with circular waterlines, an analytical solution is developed for treating the wave scattering/dissipation problems by circular inclusions on the horizontal plane. The latter solution is subsequently used to tune the absorbing coefficient of the MMSE in the vicinity of the WECs on the horizontal domain. The calibration is performed by correlating the result with the response characteristics of 3D floating heaving cylinders in constant depth, taking into account the PTO effect modelled by an absorbing coefficient. The latter is obtained by exploiting the analytical solution derived by Yeung [14] and Sabuncu and Calissal [15]. Then, the calibrated data for the absorbing functions are used as parameters in the MMSE model to treat global interaction effects between the components array, treated as a multiple scattering/absorbing wave problem in a medium with a variable index of refraction, modelling the refraction/diffraction effects of variable seabed topography.
3. The MMSE for Wave Scattering by WEC Array in Variable Bathymetry
As a standard model for treating wave propagation, including refraction and diffraction effects, in coastal regions, characterized by variable bathymetry and in the presence of structures, a generalized version of the Modified Mild-Slope equation (MMSE) presented by Massel [12] and Chamberlain and Porter [13] is considered, defined as follows
In the above equation, the parameters and are the local phase and group velocities of harmonic waves, defined at the given frequency and the local depth, respectively. Considering first the case of waves propagating over variable bathymetry without the point absorbers, the homogeneous version of the above model is considered , and the coefficient in Equation (3) is the local wavenumber associated with the propagating mode. The latter is obtained as the root of the linear dispersion relation of water waves, formulated at the local depth
The solution of the above equation provides the spatially varying complex wave amplitude and the 3D wave field is obtained as follows
Finally, the function in Equation (3) is dependent on the gradient and the curvature of the depth function, and the detailed expression can be found in refs. [11,12]. Validation of the MMSE by comparison to other models and test data has been presented in many works [16,17]. The modified mild-slope equation (MMSE) is applied in conjunction with the Perfectly Matched Layer (PML), described by Berenger [18] and Turkel and Yefet [19], enabling efficient numerical absorption of the waves reaching the boundaries of the truncated horizontal domain, with minimum reflection. In the present work, optimized PML coefficients are used, as described by Collino and Monk [20], applied by Belibassakis [7] to water wave problems in variable bathymetry, and extended in other works to include effects by coastal structures [21] and wave-current interaction in variable bathymetry [22].
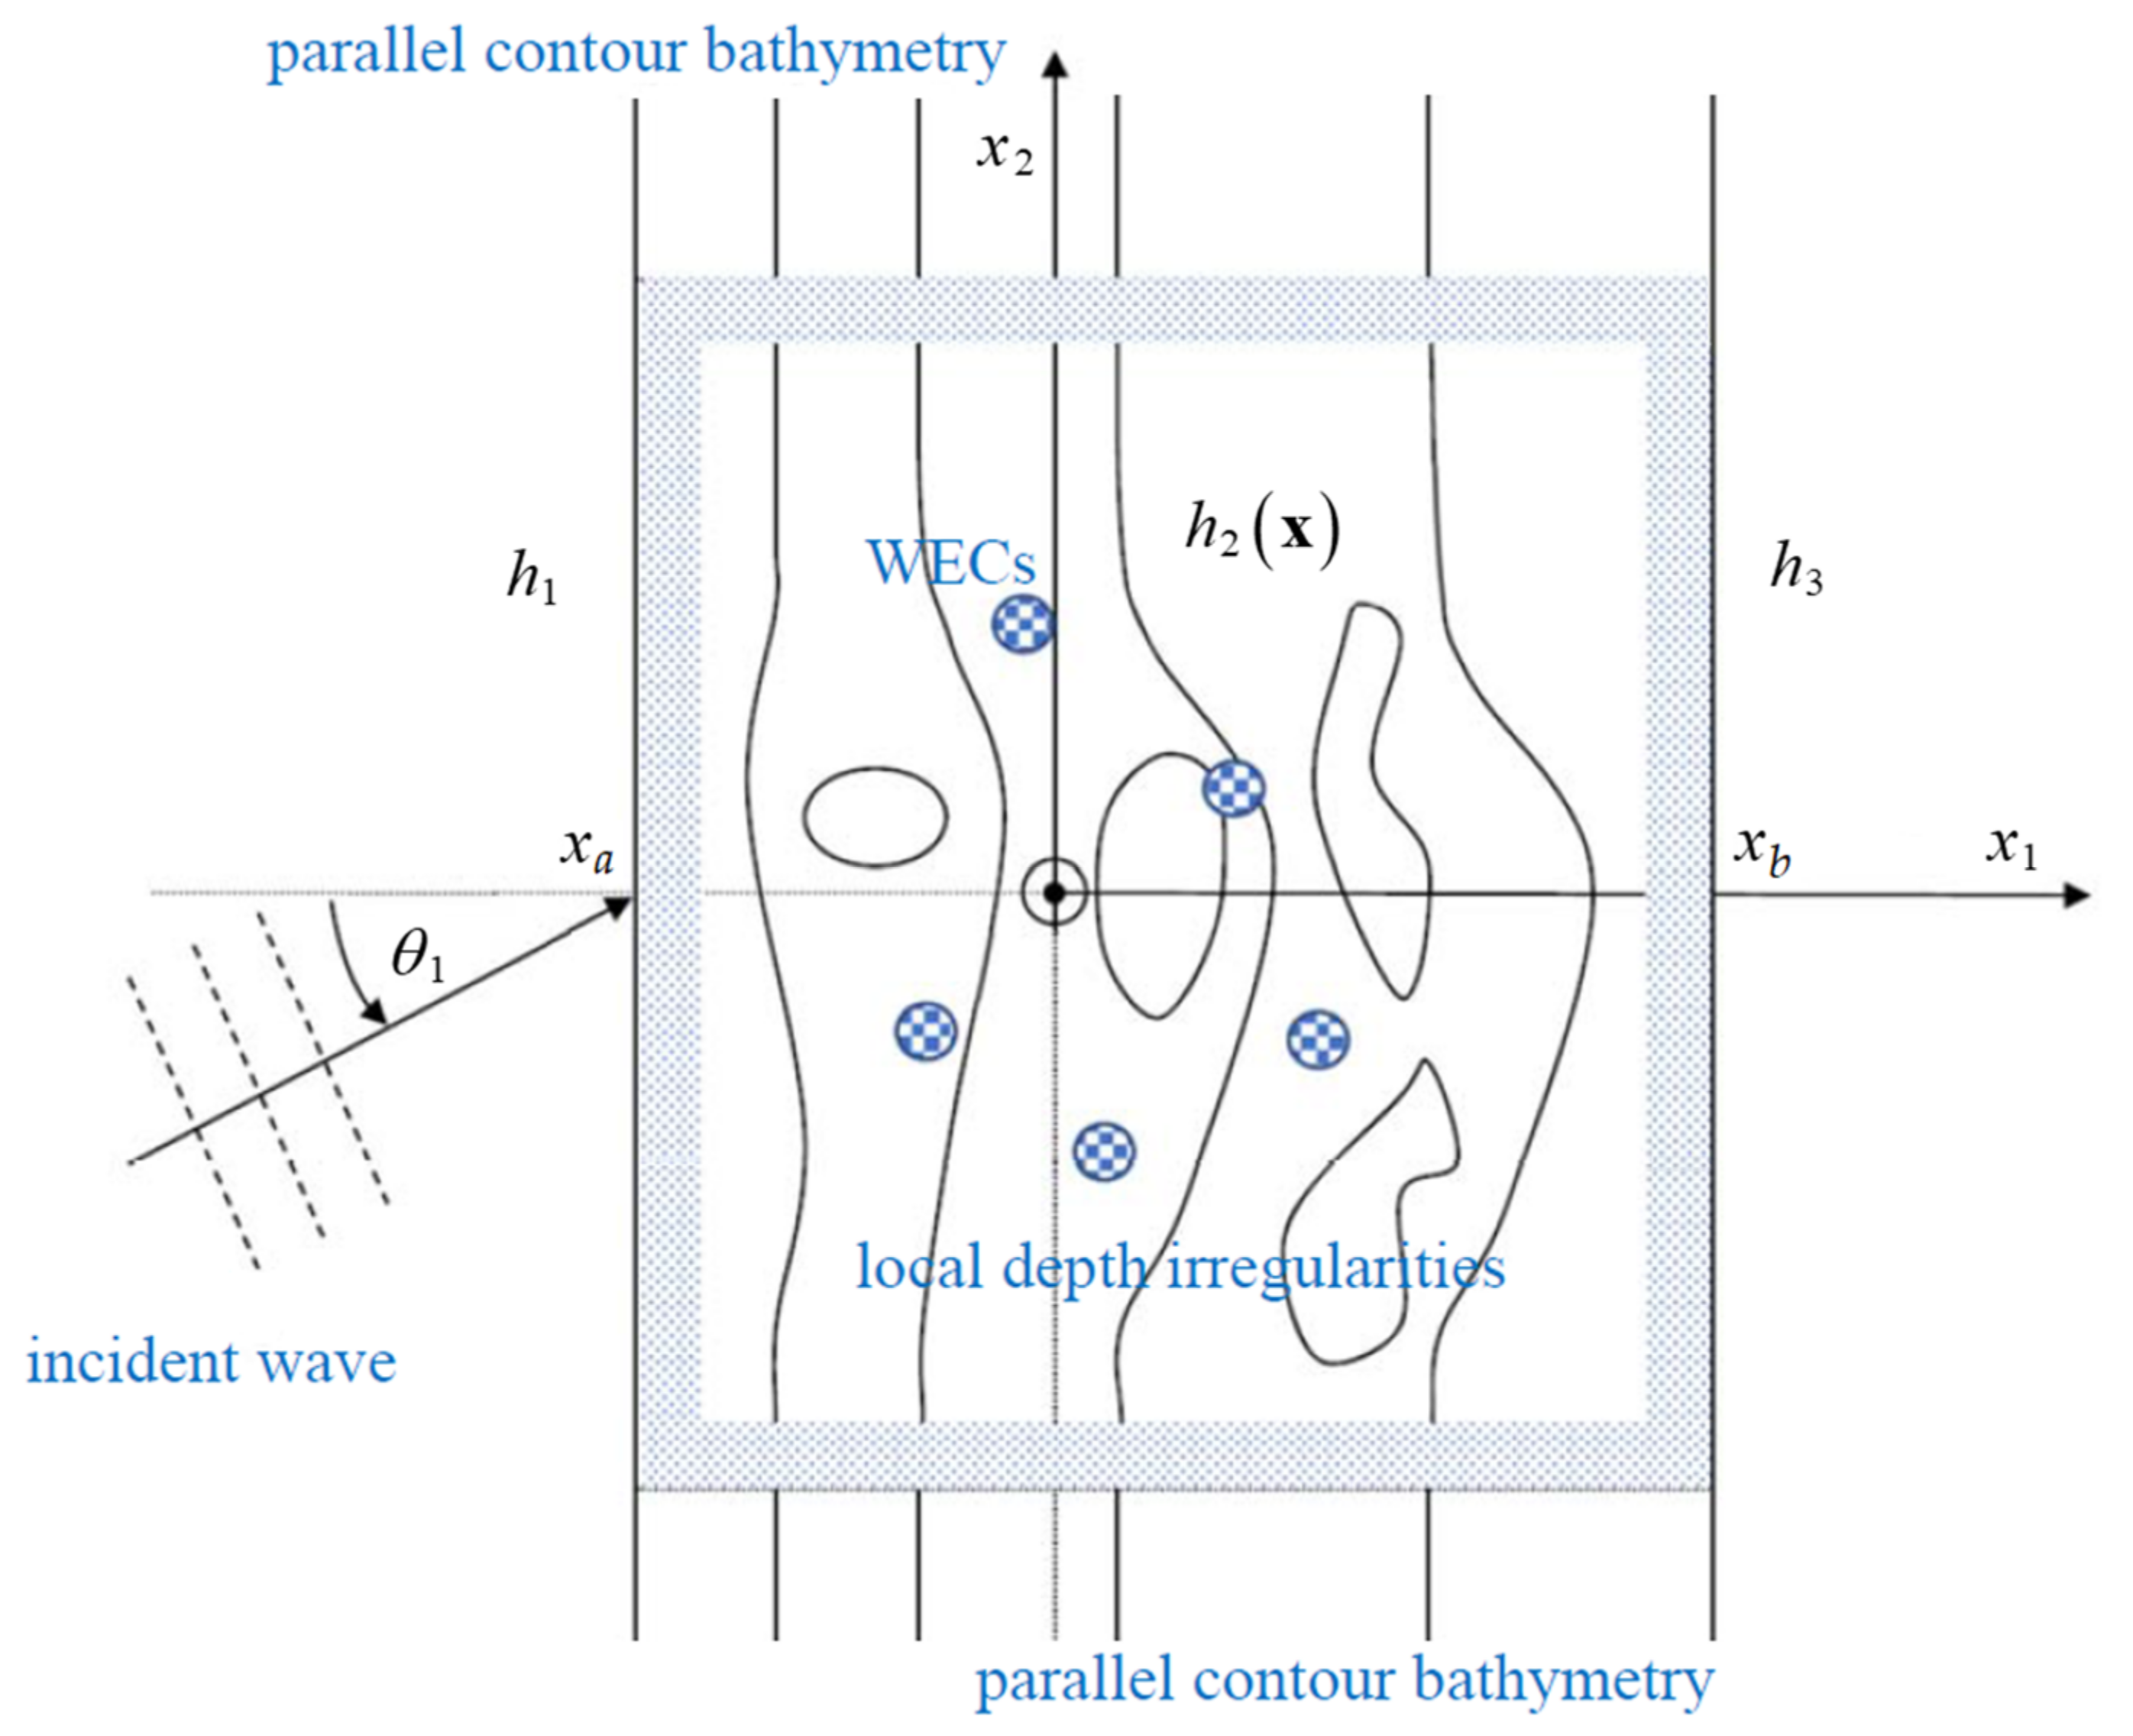
Following the above approach, the coefficients of the horizontal Laplacian operator in the MMSE (first term on the left-hand side of Equation (3)) are modified within an absorbing layer of thickness of the order of the characteristic wavelength surrounding the variable bathymetry domain, as indicated by the shaded zone in Figure 2. On the other hand, at the left-hand and right-hand sides of the computational domain, where the depth is assumed to be constant end equal to and , respectively, specific boundary conditions are used to define the incident and reflected wave, as described below.
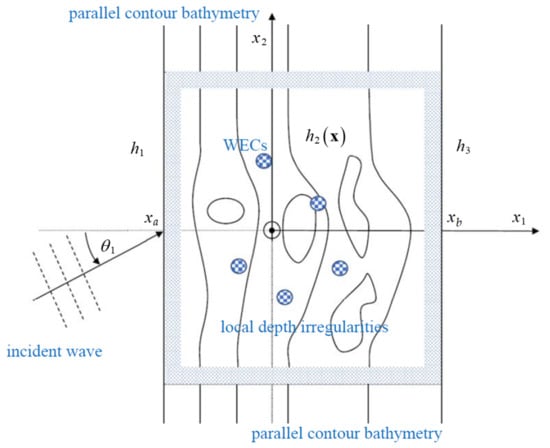
Figure 2.
Implementation of the MMSE solution with PML absorbing scheme (shaded zone) surrounding the computational domain.
The solution strategy of the problem, including the effects of the point absorbers, is based on decomposing the wave field into two parts: (i) the potential describing refraction/diffraction of waves over the seabed topography without the presence of WECs, and (ii) the additional disturbance field describing multiple scattering effects due to the heaving floaters
and will be described in more detail in the following sections.
3.1. Waves over Variable Bathymetry without the Effects WECs
The potential describing refraction/diffraction of waves over irregular seabed topography, without the effects of the WECs, is based on the solution of the homogeneous version of Equation (3), with right-hand side , using , and is obtained by further splitting the variable bathymetry into two parts:
where is a parallel-contour bathymetry and denotes additional depth irregularities, as shown in Figure 2. The solution for is accordingly split into two parts:
where is obtained by a one-dimensional version of the MMSE (Equation (3)) for waves over the parallel-contour bathymetry , is treated as a scattering problem associated with the depth localized features and the generated outward radiated waves are treated by the PML; for more details, see ref. [7].
As concerns , the boundary conditions specifying the incident and reflected waves are based on the following expressions of the wave field:
- (i)
- left-hand side :where , denote the incident wavenumber and direction in the region of incidence , where the depth is constant and equal to and R is the reflection coefficient. Similarly, in the region of transmission
- (ii)
- right-hand side :and where , denote the incident wavenumber and direction in the region , where the depth is constant and equal to and is the transmission coefficient. In particular, the direction of waves in the transmission region is obtained by
Obviously, in the case of a flat seabed =const. the obliquely incident wave field propagating in direction is given by .
3.2. Multiple Scattering Effects Due to WECs
The potential , describing the multiple scattering effects due to WECs in the variable bathymetry region, is based on the solution of the inhomogeneous version of Equation (3),
using
The right-hand side forcing is given in terms of the wave field , without the effects of the floating heavers (calculated as described before) as follows:
In the above equations, is the characteristic function associated with the support of the WECs, i.e., for and elsewhere. The coefficient is an absorbing coefficient modelling the scattering effect due to the power-extraction of each WEC, which is determined in terms of wave frequency and the depth at the local position of the k-WEC, k = 1, 2, … N, with circular waterline of radius , as discussed below. Obviously, the support of the forcing of the MMSE Equation (12) is characterized by the same function . Results illustrating the applicability of the present method described will be shown and discussed in Section 5.
4. A Simplified Model for the Power-Extraction and Scattering Effect of the WEC
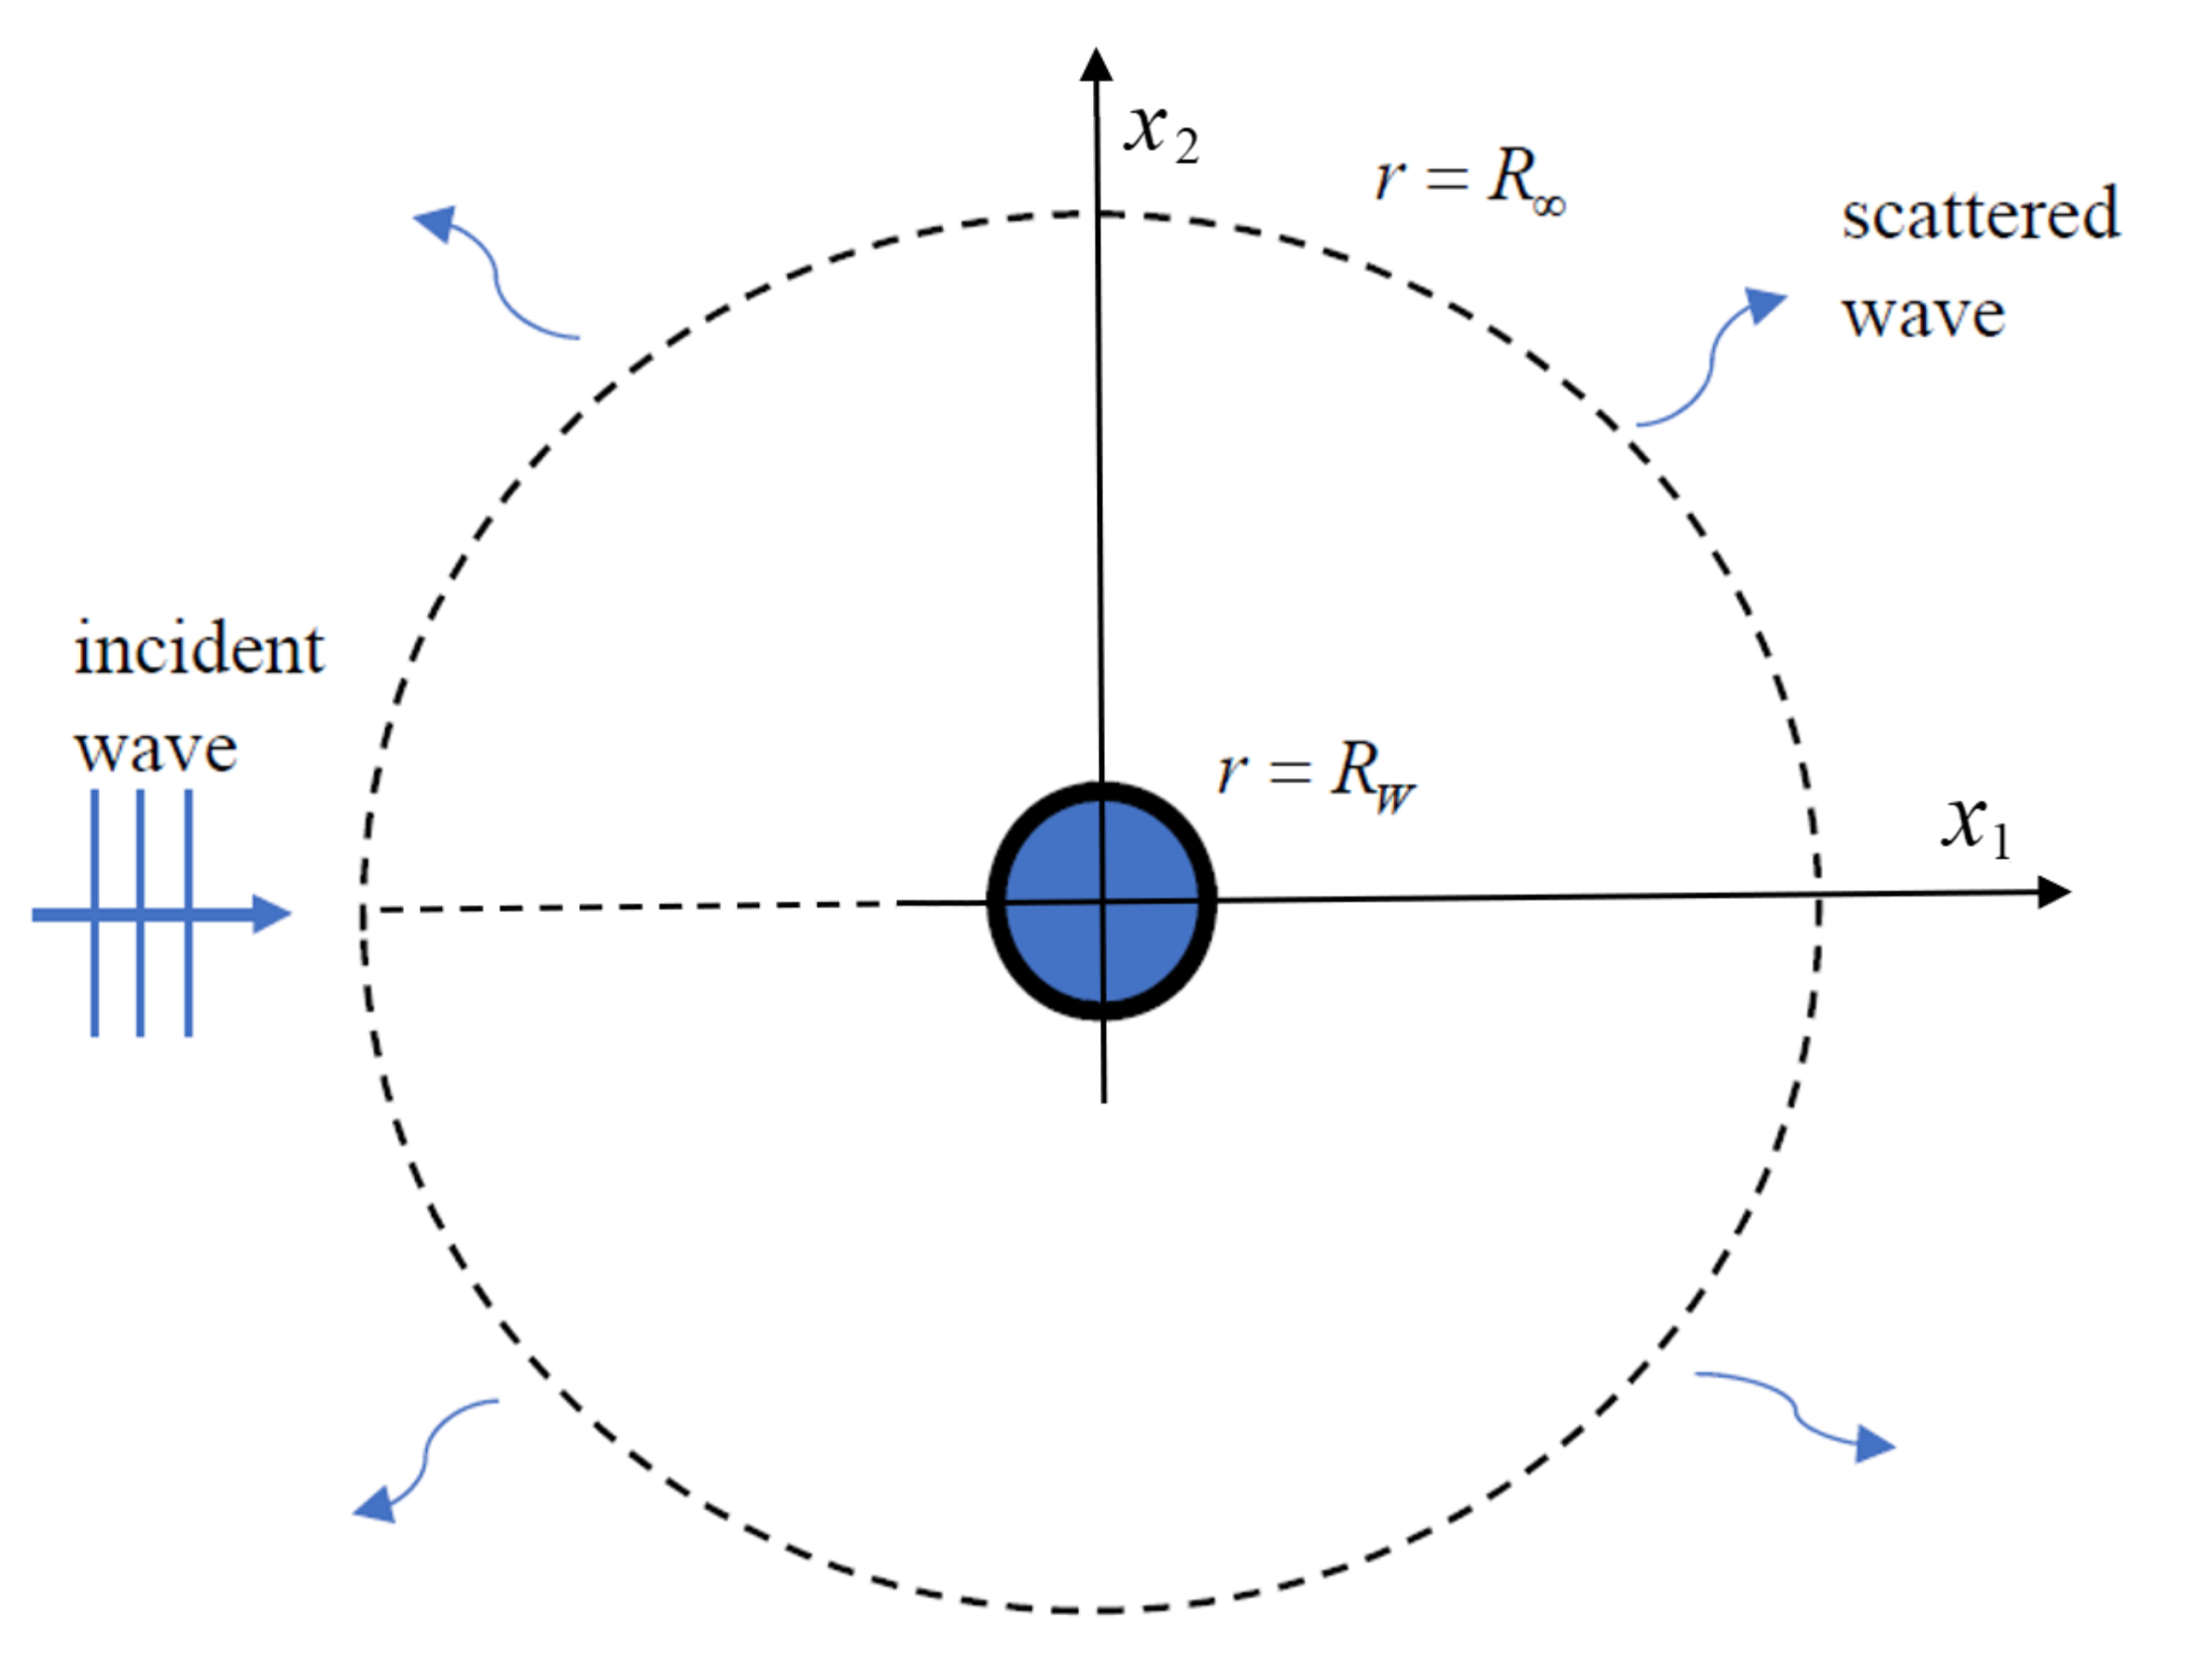
It is well known that the homogeneous MMSE, (Equation (3)) with , is equivalent to the Helmholtz equation on the plane. This is easily verified by setting in Equation (3) and re-defining the Helmholtz parameter as ; see [23,24]. Considering that the wave field in the vicinity of each k-WEC, with index k = 1, … N, behaves like a superposition of plane waves carrying out both the diffraction effects by the rest of the heaving floaters, with the local characteristics concerning amplitude and direction, and the self-scattering effect, we consider a circular inclusion of radius in the horizontal domain of constant depth, as shown in Figure 3. Without loss of generality, in Figure 3 we consider the incident wave on the WEC with local wavenumber k (as defined by the wave dispersion relation at the local depth) to be directed along the x1-axis and the body, which is modelled as an inclusion. The model is based on solutions of the Helmholtz equation, with parameters characterized by the wavenumber k in the exterior of the circular inclusion, and in the inclusion, respectively, where α and β are parameters modelling the absorbing and scattering behavior of the k-WEC.
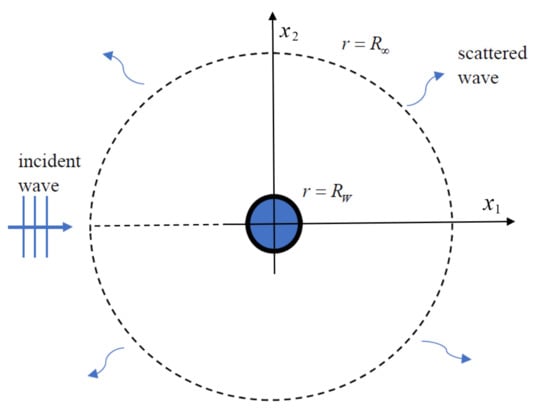
Figure 3.
A circular inclusion modelling the absorbing-scattering effect locally of the k-WEC.
In the unbounded subdomain outside the inclusion (), the wave field, expressed in polar coordinates, is represented as the incident wave potential and the scattering field, and is given by
In the bounded subdomain (inside the WEC waterline ), the wave potential is represented as
where are the cylindrical coordinates, is the Neumann symbol ( and ), and are the Bessel-J function and Hankel function of the first kind, respectively. The solution concerning the coefficients of the Fourier–Bessel series expansion in the unbounded and bounded subdomains, respectively, is obtained by requiring the matching of the above representations on (continuity of wave field and velocity) which leads to the following results:
where
and
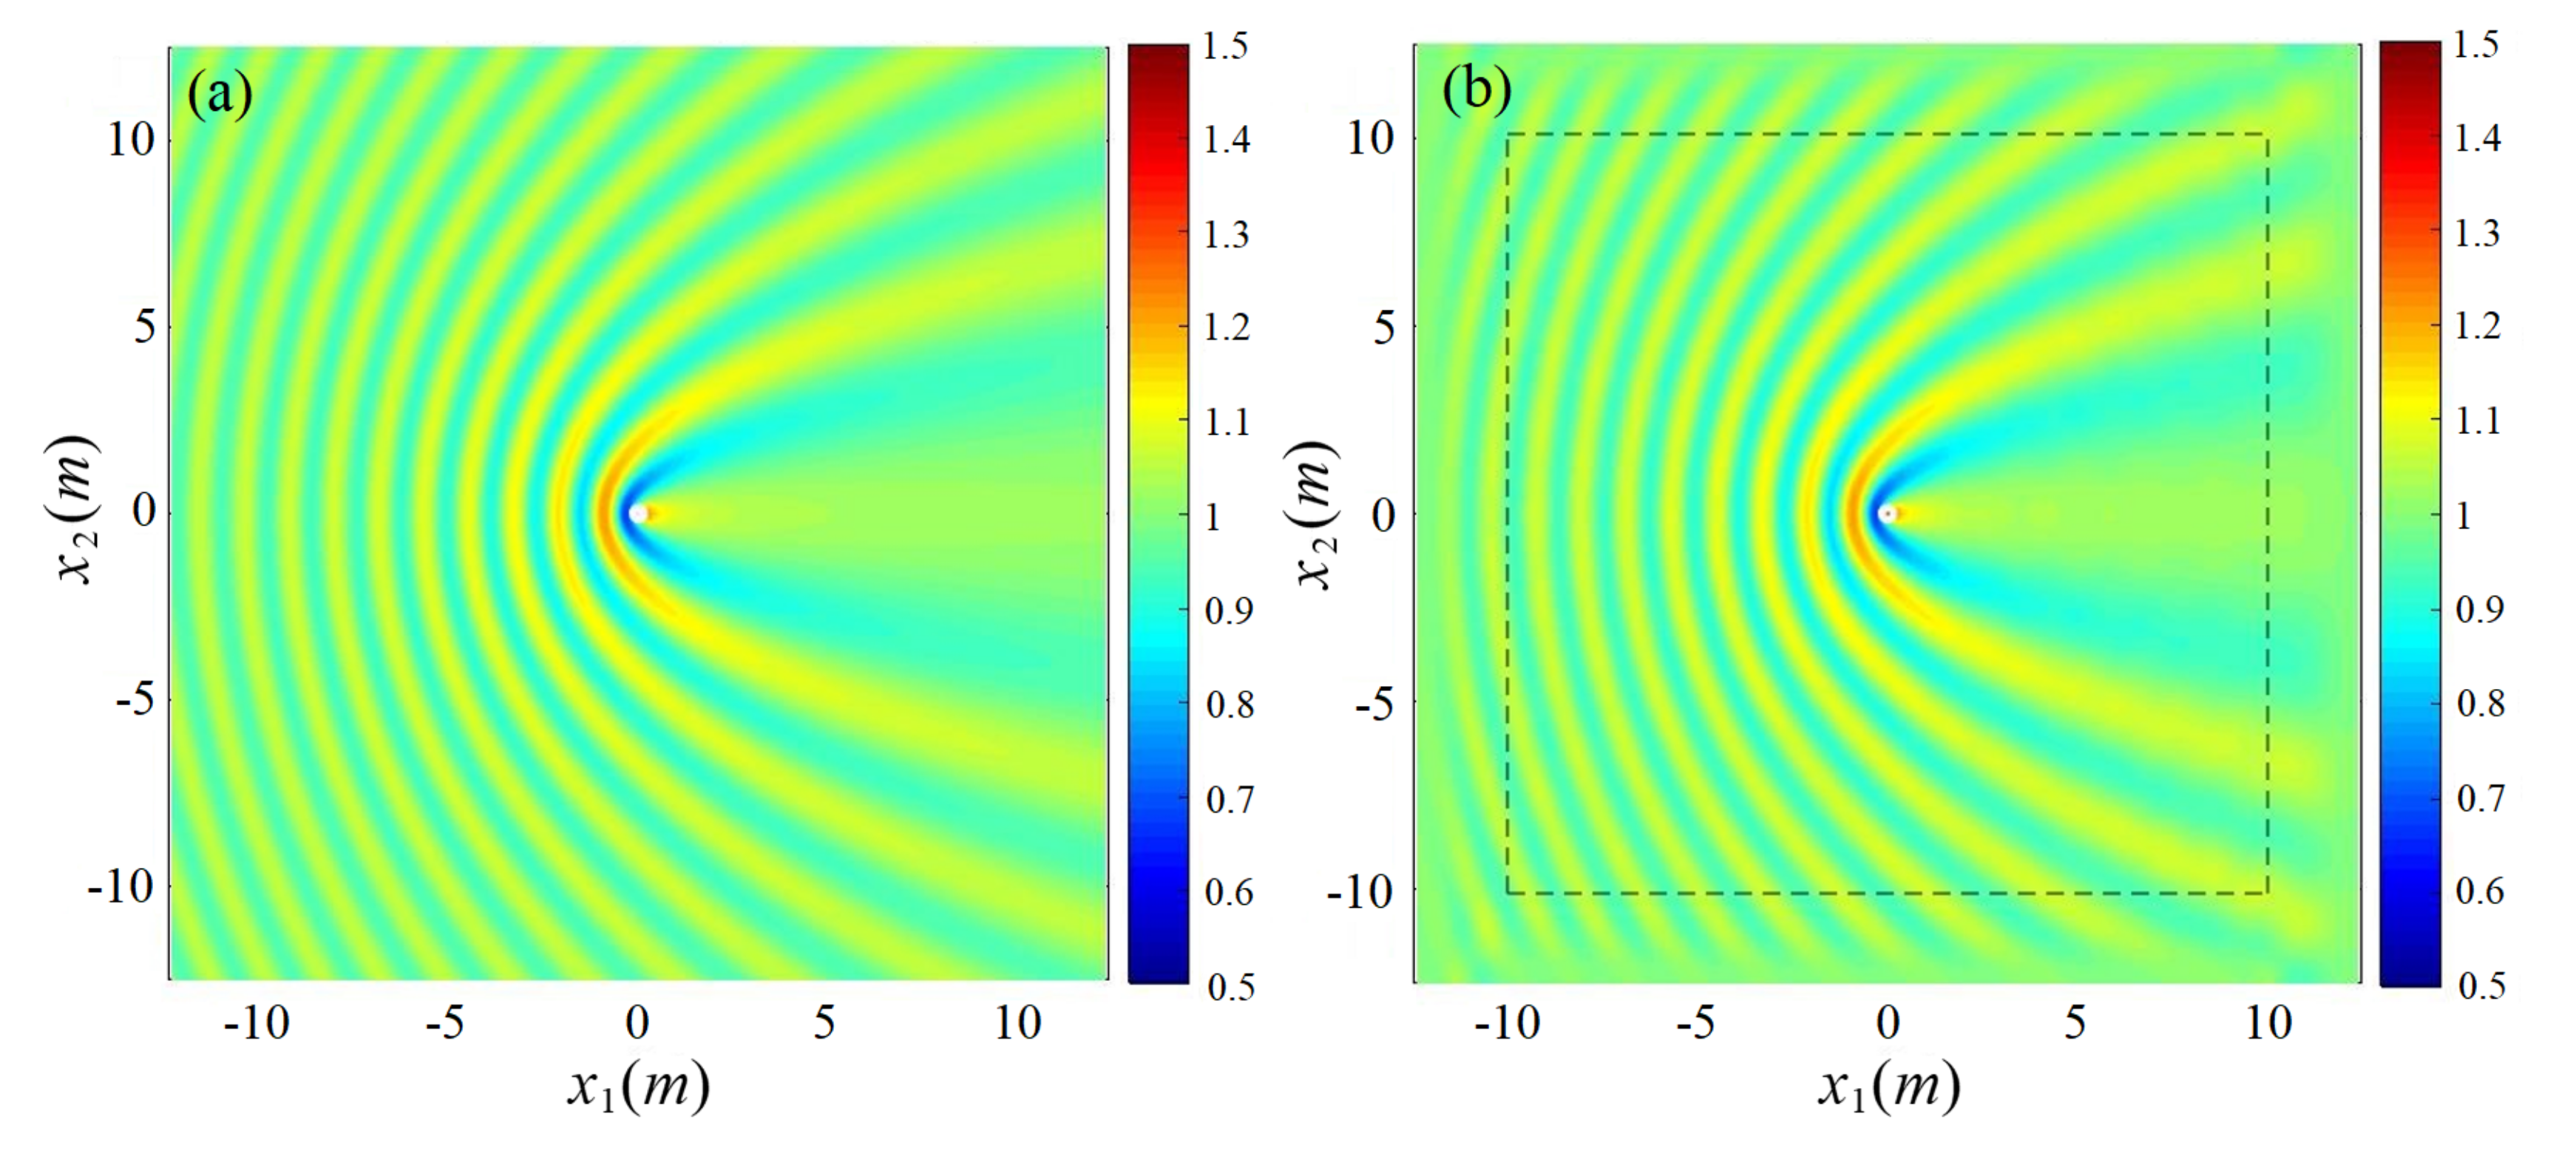
In the above relations, and denote the derivatives of Bessel and Hankel functions with respect to their argument. Indicative results concerning the analytical solution for the wave height distribution on the plane around a circular inclusion of = 0.1575 m, for incident waves of period T = 1.26 s, in water depth h = 0.8 m are presented in Figure 4a. The results are obtained by truncating the Fourier–Bessel series (15), keeping the first M = 15 terms that are enough for convergence in the examined case. Comparison is presented with the numerical solution of the MMSE, Equation (12), plotted in Figure 4b, which is obtained by a numerical scheme using second-order finite differences to discretize the governing equation and a grid of 501 × 501 points, which is found to be sufficient for numerical convergence. The PML zone has a width equal to one wavelength, which is λ = 2.4 m in the examined case and is shown around the border of the computational domain using a dashed line. We observe that the numerical results represent the analytical solution very well, with very small differences observed in the vicinity of the circular inclusion that are diminished as the grid density increases.
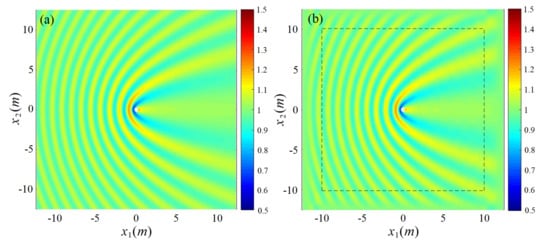
Figure 4.
Wave height distribution on the plane around a circular inclusion of = 0.1575 m for incident waves of unit height and period T = 1.26 s, in water depth h = 0.8 m, for (a) Analytical solution. (b) Results for the same case as obtained by the present FDM numerical solution using N = 501 × 501 mesh and the PML region indicated by using a dashed line.
In order to provide a second verification of the present model, the case of an array of hard circular inclusions is considered. It is easily observed from the above analytical solution, Equations (15) and (17), that for , the solution in the exterior domain becomes the one corresponding to the scattering field of plane waves by a hard circular body characterized by a homogeneous Neumann boundary condition [25]. In such a case, an alternative representation is possible by means of the BEM method using Green’s function of the Helmholtz equation [26]. The above result is approximately valid also for a configuration consisting of many circular scatterers and will be used as a verification of the present simplified model, as will be discussed below.
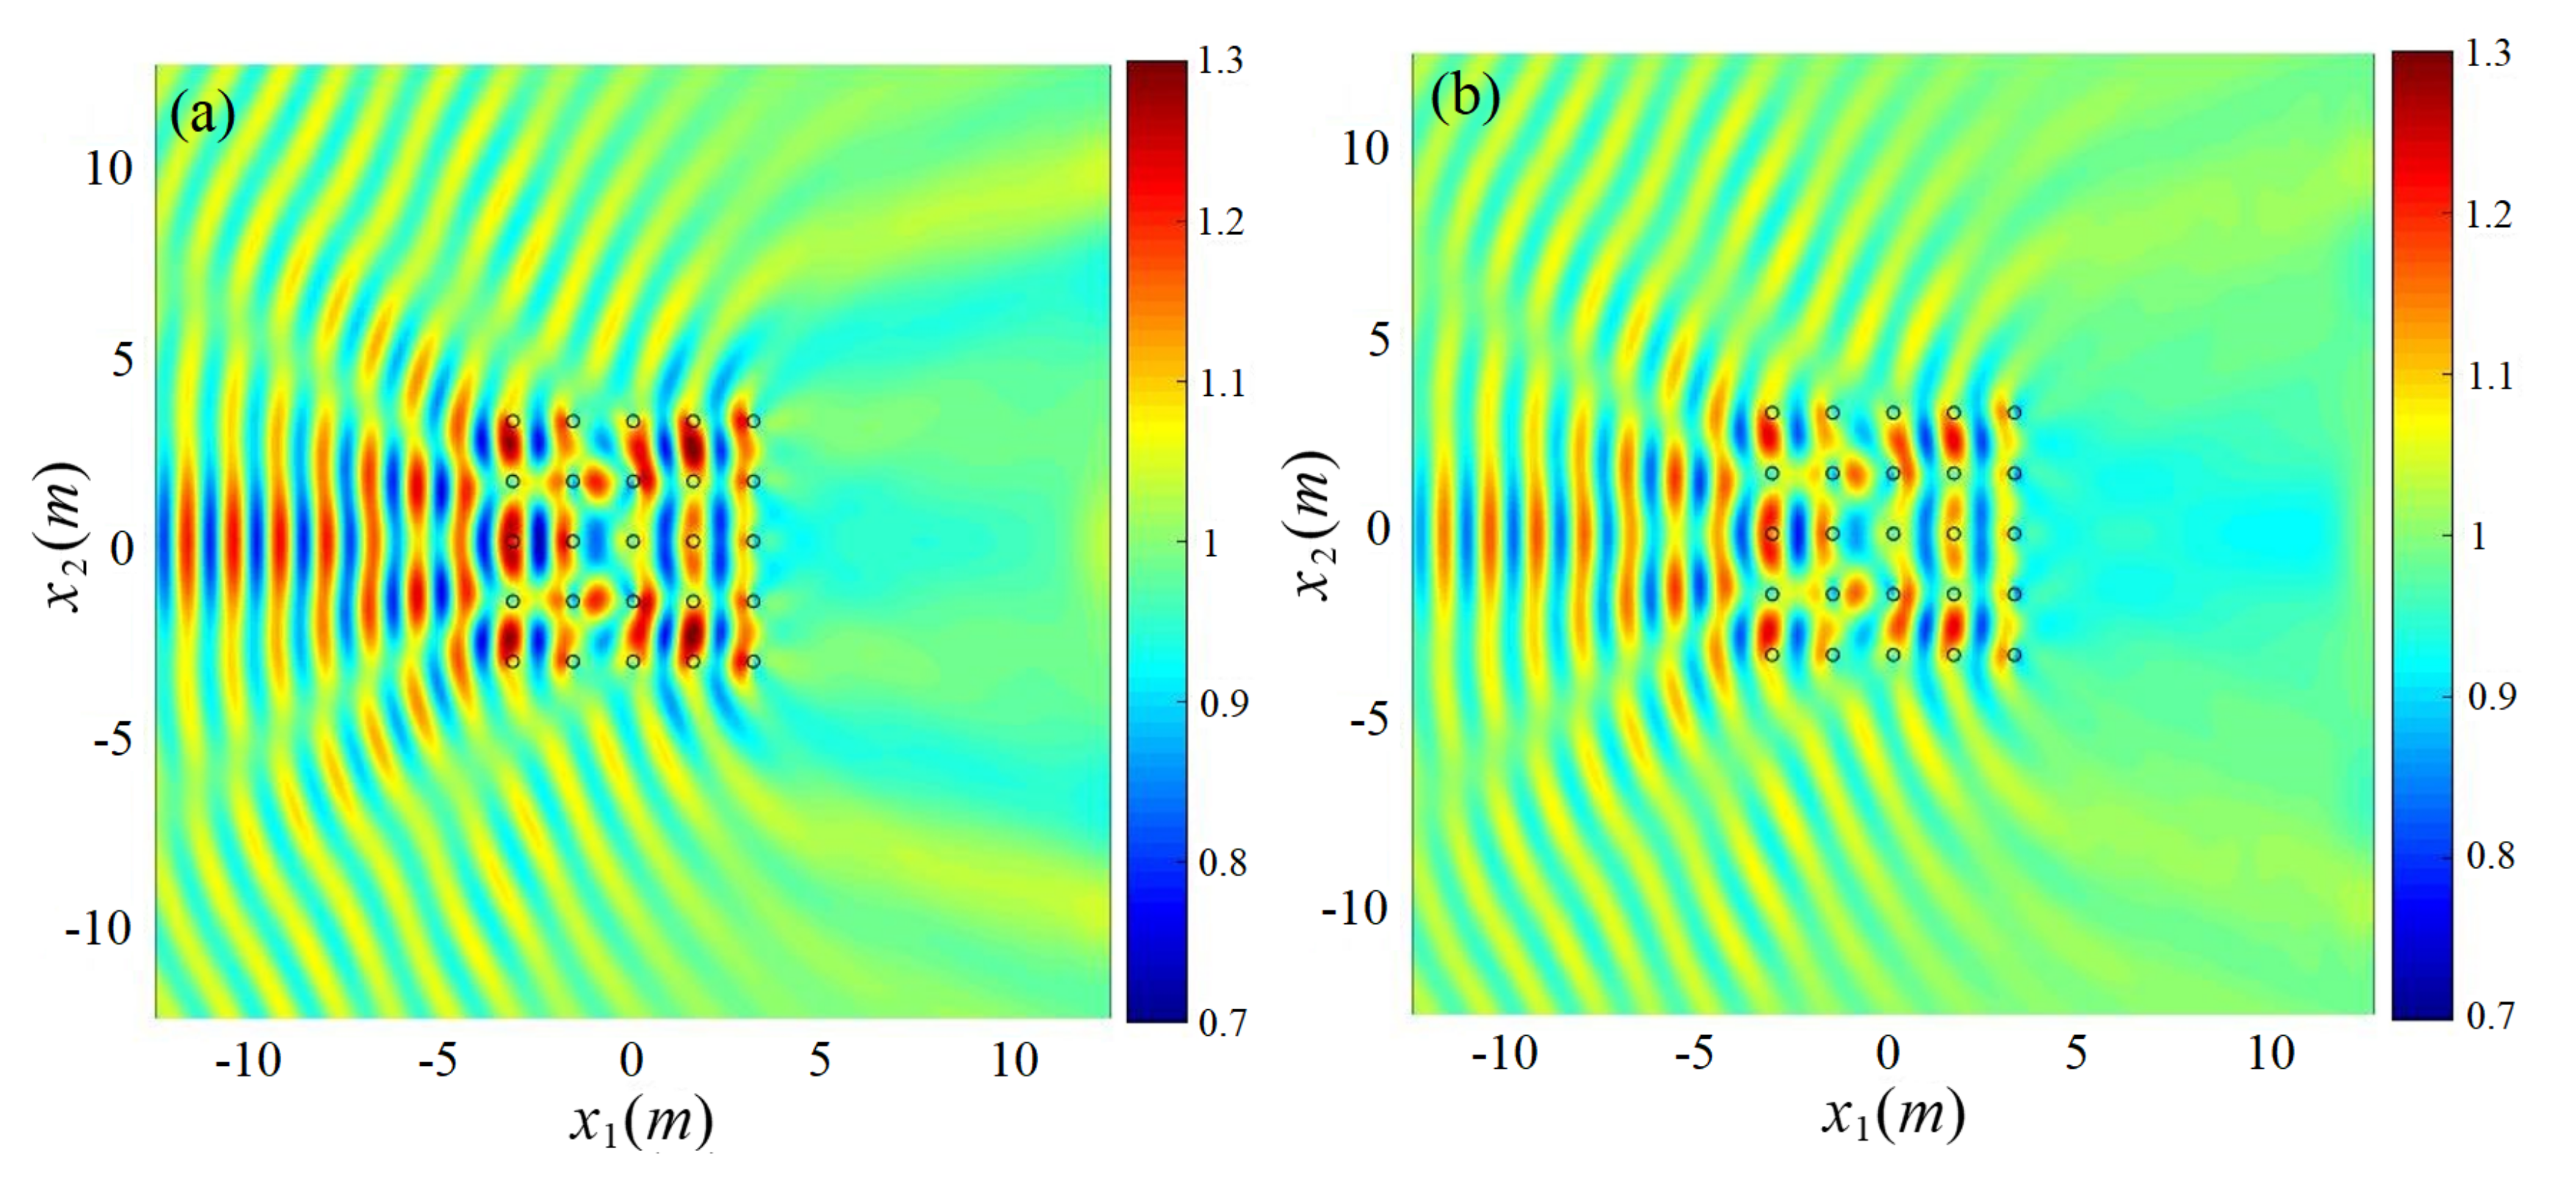
An example of multiple scattering is presented in Figure 5, where the wave height distribution is presented on the plane around a 5 × 5 array of hard circular bodies arranged at equal distances, for incident harmonic plane waves propagating along the x1-axis in constant depth, as obtained by the present simplified MMSE with hard circular inclusions (κ = 0) and the BEM using Green’s function of the Helmholtz equation. Small differences are observed in the upwave and down region, where the simplified MMSE model provides a smaller reflection and diffraction, respectively, and the comparison is improved by increasing the grid resolution.
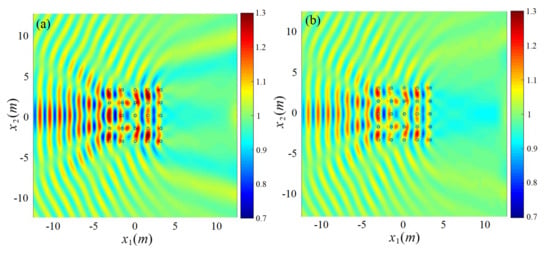
Figure 5.
Wave height distribution on the plane around a 5 × 5 array of hard circular bodies of = 0.1575 m arranged in equal distances w = 1.575 m, for incident waves of unit height and period T = 1.26 s in water depth h = 0.8 m. (a) Results obtained by the BEM [26]. (b) Results for the same case as obtained by the present MMSE model by FDM numerical solution using N = 1501 × 1501 mesh, and the circular inclusions modelled by using κ = α = b = 0.
The analytical model facilitates the calculation of the absorption of wave energy as a result of the effect of parameters making complex the wavenumber parameter inside the inclusion. For this purpose, the representation given by Equation (15), for general incidence angle θ in the exterior region, is put in the following equivalent form [27,28]:
Noting the extent of the above infinite series from to , the first sum on the right-hand side, along with the first term in the second sum, are equivalent to the parallel incident wave, while the second series involving the coefficients is the scattering field. The above representation is appropriate for the calculation of wave power loss in the inclusion modelling the PTO of the WEC in the present approach. Taking the asymptotic forms of the Hankel functions for a large argument, it is possible to calculate the power exchange, which is defined by the difference between the incoming power flux and the outgoing power flux radiating out of the domain at infinity (indicated by using a dashed circle of large radius in Figure 3) as follows
where is the imaginary part of the expression and an asterisk denotes the complex conjugate. Using the asymptotic form of expression (14) for in Equation (21), we finally obtain, in the case of the plane incident waves, propagating along the x1-axis, (i.e., θ = 0 as shown in Figure 3 and Figure 4),
The above result is normalized by considering the wave power flux associated with the parallel incident wave passing through the circular WEC of diameter which is given by and thus, we obtain a PTO performance index of the circular inclusion modelling the single WEC which is given by
The net power extraction is obtained by multiplying the above performance index with the wave power flux per unit width of incident wave front: and the diameter of the WEC and is equal to , where ρ is the water density, g is the acceleration of gravity, H is the incident wave height, and is the group velocity at the given wave frequency.
As an example, we consider the case of circular inclusion of radius = 0.1575 m for incident waves of unit height and period T = 1.26 s, in water depth h = 0.7 m. In this case, the results concerning the calculated performance index by the inclusion model described in this section are listed in Table 1. We observe from the data listed in Table 1 that the WEC performance simulated by the circular inclusion on the plane can provide from very small to quite large values covering the whole interval of interest associated with the performance of the examined systems. For the selection of the coefficients α,β of the above simplified model based on MMSE, we consider the performance of an isolated floating WEC in constant depth analyzed using the 3D BEM developed by Belibassakis [9] and extended by Bonovas [5] to study multi-dof WECS of general shape, which is briefly presented in the next section.

Table 1.
Calculated performance index (%) of the inclusion = 0.1575 m. for waves of period T = 1.26 s, in water depth h = 0.7 m.
5. A 3D-BEM for the Local Analysis concerning Interaction Waves and Floating Bodies
We consider a floating body in depth h that is locally considered constant. The diffraction and radiation potentials associated with the operation of simple heaving WECs, are treated in this work by means of low-order panel method, based on simple singularity distributions and 4-node quadrilateral boundary elements [29], ensuring continuity of the geometry of the various parts of the boundary. The above potentials and corresponding velocity fields are approximated by,
where the summation ranges over all panels indexed by p, and and denote induced potential and velocity from the p-th element with unit singularity distribution to the field point r [30]. Using constant normal dipole distributions on each quadrilateral panel, the induced matrices are analytically calculated concerning the induced potential via the solid angle [31]. Moreover, using the equivalence of a constant dipole element with a vortex ring element, the calculation of induced velocity is obtained by the repetitive use of the Biot–Savart law [30]. As concerns discretization, a minimum number of 15–20 elements per wavelength is required in discretizing the free surface in order to eliminate numerical errors due to damping and dispersion associated with the above numerical scheme. In order to eliminate the infinite extent of the domain and treat the radiating behavior of the diffraction and radiation fields at far distances from the bodies, an absorbing layer technique is used, based on a matched layer all around the fore and side borders of the computational domain on the free surface [32]. The thickness of the absorbing layer is of the order of 1–2 characteristic wavelengths, and its coefficient is taken, increasing within the layer. The efficiency of this technique to damp the outgoing waves with minimal reflection is dependent on the thickness of the layer.
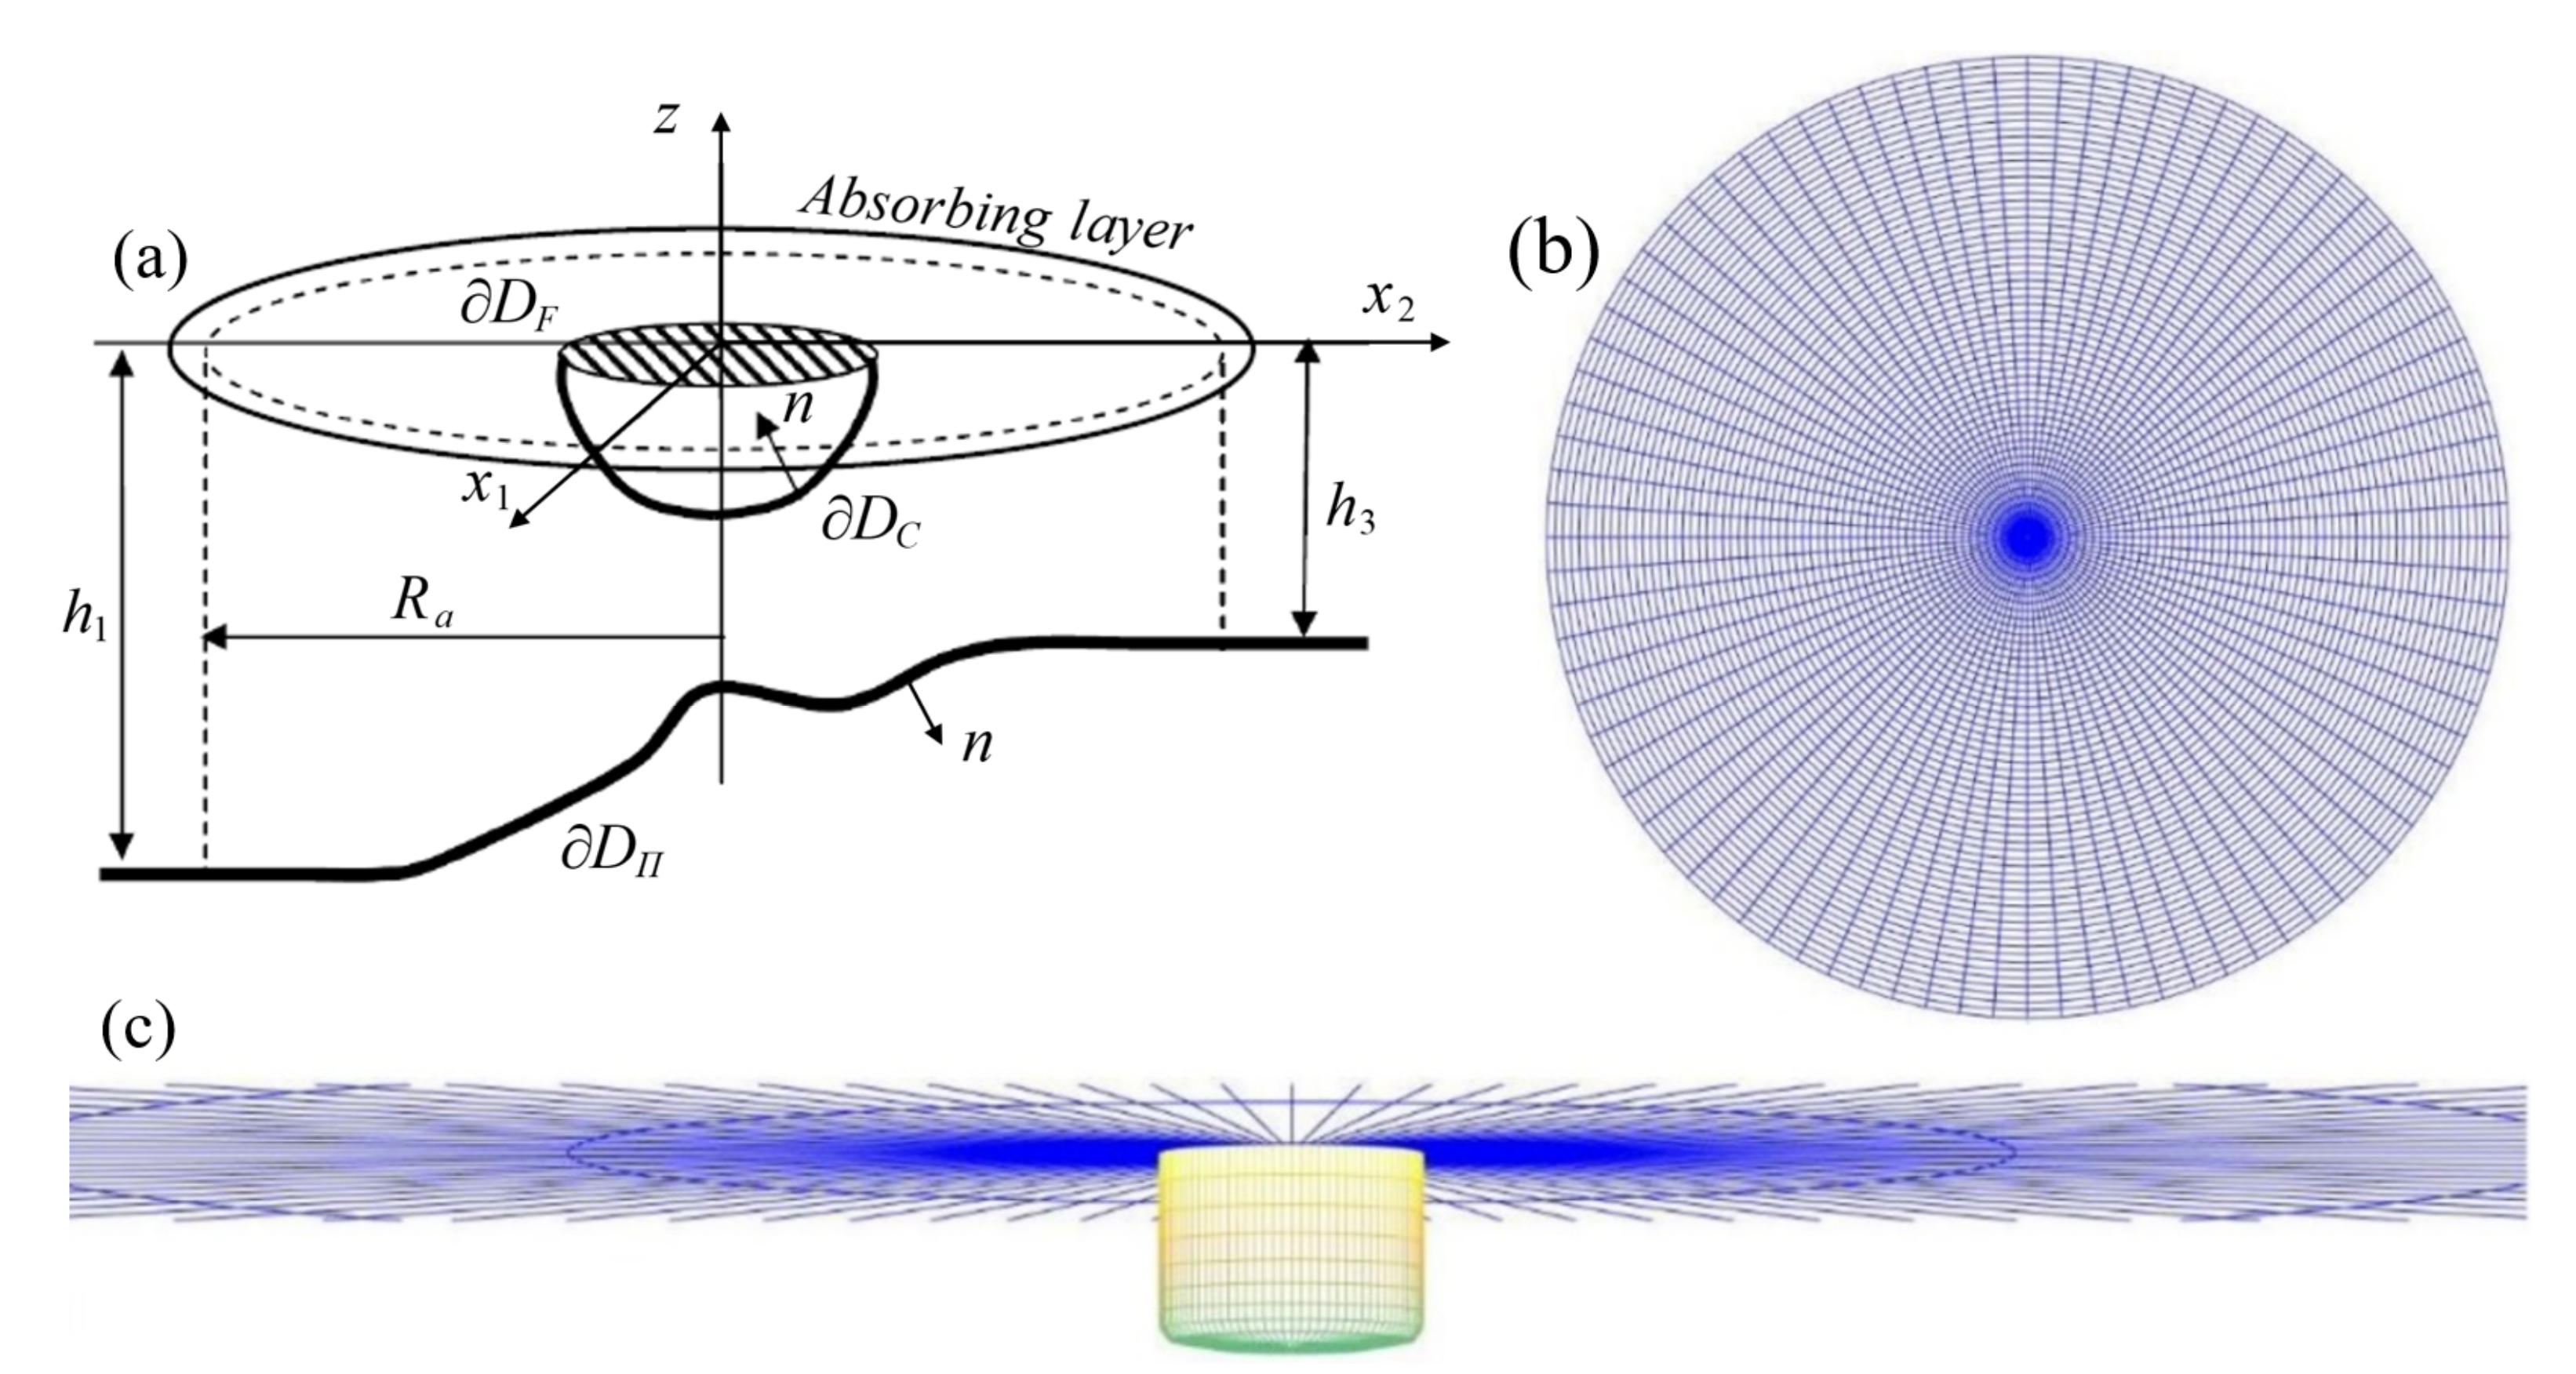
Based on the above, the diffraction and radiation potentials are represented by integral formulations with support on the wetted surface of the floating body/ies , the bottom surface and the free surface ; see Figure 6a. Details concerning the 3D BEM and its application to floating WECs over general bathymetry can be found in ref. [9]. In accordance with the present absorbing layer model, the free surface boundary condition is modified as follows,
where n is the normal vector directed towards the exterior of the domain, and the coefficient everywhere on , except in the absorbing layer where it is given by,
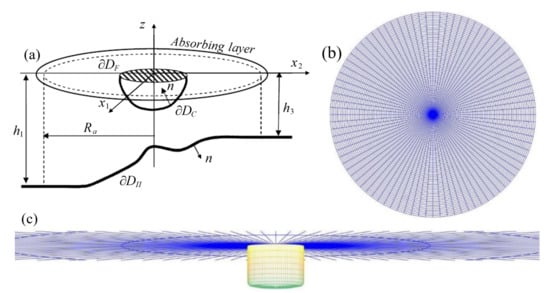
Figure 6.
(a) Formulation of diffraction and radiation problems in variable bathymetry regions, and computational meshes: (b) Free Surface mesh, (c) 3D side view of the mesh near the floating body.
In the above equation, λ is the local wavelength and optimum values for and . Moreover, the starting radius of the absorbing layer is , where is the characteristic radius of the body. The discrete solution is then obtained using the collocation method by satisfying the boundary conditions at the centroid of each panel on the various parts of the boundaries. The efficiency of the present absorbing layer technique to damp the outgoing waves with minimal reflection is dependent on several crucial features of PML, and its optimization is discussed below.
An important part of the present BEM implementation deals with the construction of the mesh on the various parts of the boundary. In the present problem, every boundary is discretized with a cylindrical-type distribution of panels, which is ideal for the numerical representation of the radiating behavior of the solution in diffraction and multi scattering problems [9].
The details of the mesh generator are shown in Figure 6b,c. More specifically, in Figure 6b, the mesh on the free surface around the WEC is plotted. The latter consists of one part close to the waterline of the floating unit and the far (outer) part. The near mesh is based on the cylindrical distribution of panels around the waterline of the WEC that gradually expands to the outer boundary truncating the horizontal domain.
The discretization is accomplished by incorporating corresponding meshes on the floating body, and an important feature is the continuous junction of the various parts of the mesh, which, in conjunction with the quadrilateral elements, ensures global continuity of the boundary. Since the present analysis refers to floating bodies in local constant depth, the discretization of the bottom surface can be eliminated by using mirror elements with respect to the flat horizontal seabed and the numerical mesh is restricted only to the free surface and the body boundaries.
The numerical solution is finally obtained using a collocation method, with the satisfaction of the boundary conditions at the centroid of each panel on the various parts of the boundary (body surface, free surface, seabed). Induced potentials and velocities from each panel to any collocation point are evaluated analytically, leading to a very fast and efficient calculation.
5.1. PML Optimization
In the case of cylindrical bodies in constant depth, an analytical solution has been developed by Yeung [14] and Sabuncu and Calisal [15], which is used to evaluate and optimize the coefficients of the present absorbing layer technique. The optimization of the PML is a multi-parametric problem based mainly on five important parameters. The main objective function of the PML’s optimization procedure is the minimization of any influence of the PML in the region before its support due to numerical reflections. Its effectiveness is tested by comparing the numerical and the analytical solution of the heaving potential on the free surface in the case of a cylindrical body over a constant depth seabed. The requirement for PML efficiency is quantified with the usage of the relative error based on the L2-norm for the FS-potential. The main PML parameters are:
- -
- Dimensionless frequency .
- -
- Coefficient
- -
- The activation length R/λ
- -
- The exponent n
- -
- The number of panels per wave length (N/λ)
For the numerical evaluation, a reference cylinder with dimensions Rw/h = 1/3.5, d/Rw = 3/2 and c/h = 4/7 is considered, where a is the radius, h is the depth, d is the draft, and c = h−d is the bottom clearance. The mesh, with the first number corresponding to the spatial and the second number corresponding to azimuthal discretization, is 10 × 88 on the floating cylinder, (4N/λ) × 88 on the free-surface for 4-wavelengths spatial extent, and 26 × 88 on the body surface. The results concerning the optimum PML parameters are listed in Table 2, where the frequency takes values corresponding to all depth conditions, from deep to shallow ones.

Table 2.
Optimum PML parameters for .
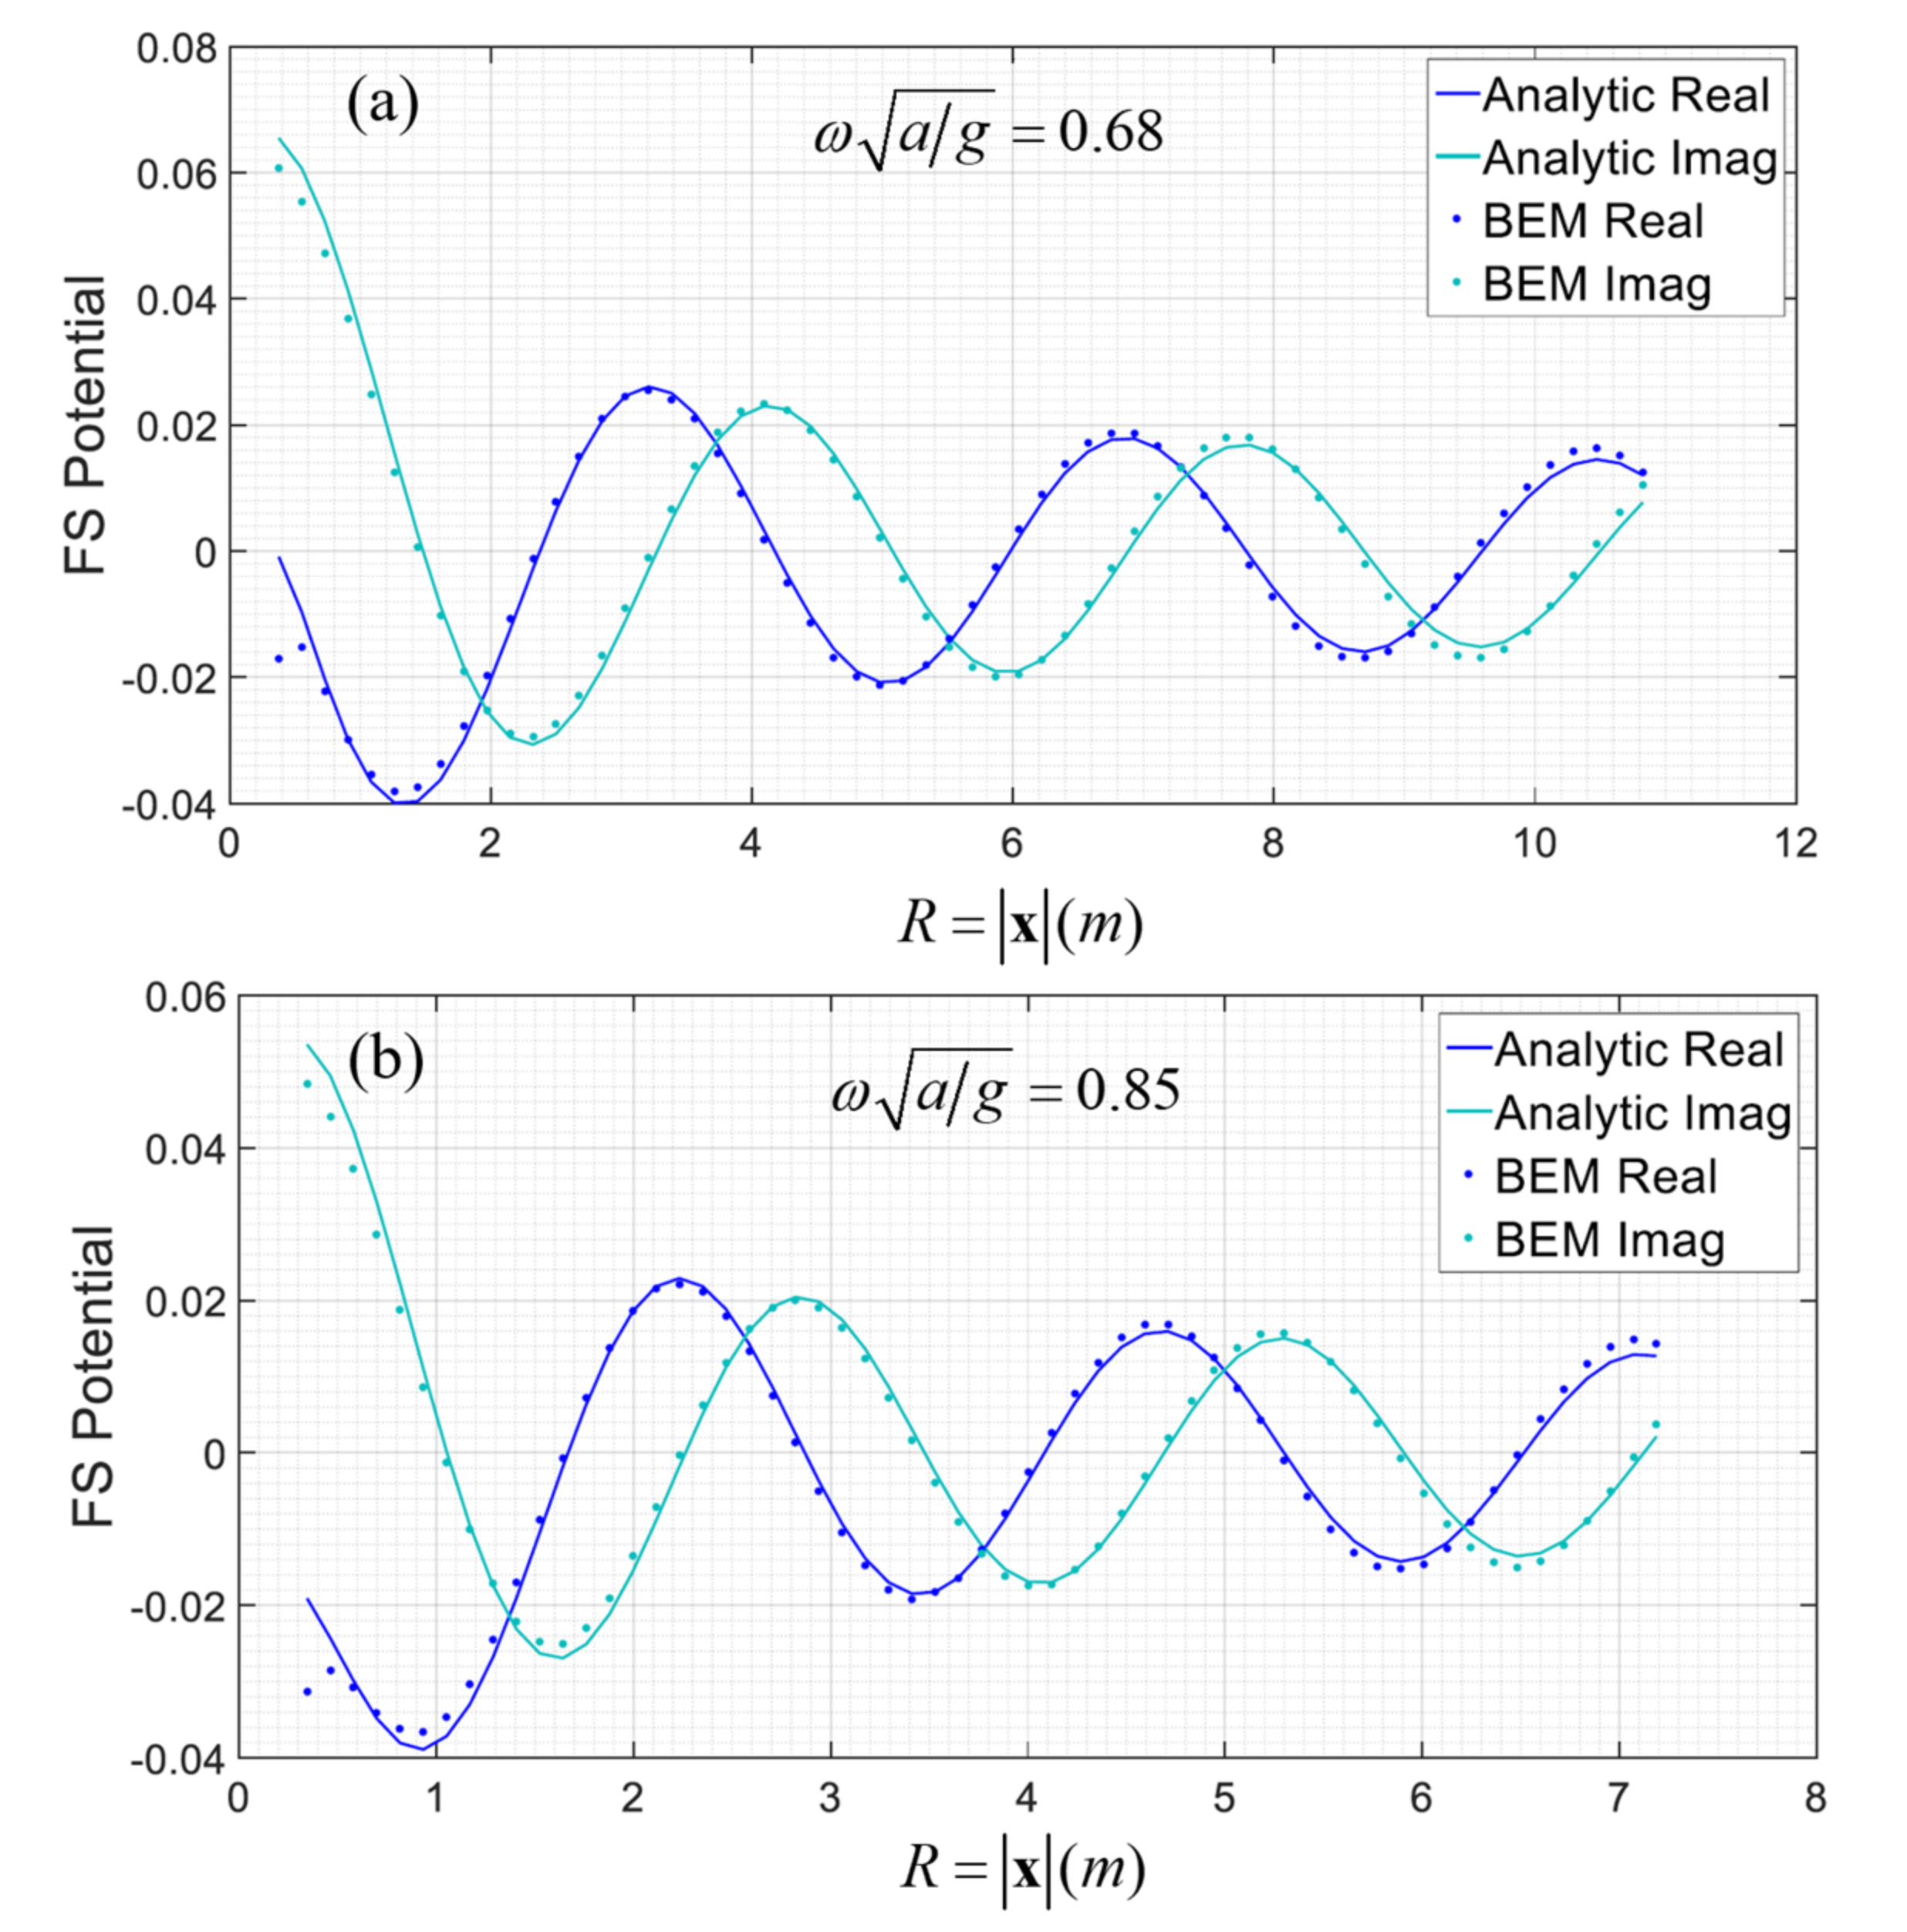
In order to evaluate the efficiency of the developed absorbing layer model for the 3D BEM, the numerical solution of the hydrodynamic problem in the case of the vertical heaving cylinder over the flat bottom is compared against the analytical solution; see, e.g., Yeung [14]. Indicative results are presented in Figure 7 concerning the free-surface elevation, and in Figure 8a concerning the calculation of the hydrodynamic coefficients (with indicating the vertical component of the normal vector on the surface of the body), normalized using the mass of the body over frequency. Furthermore, in Figure 8b a similar comparison is presented, concerning the calculation of the Froude–Krylov and total exciting vertical forces (normalized using ) by means of the present BEM model. The results are presented vs. the non-dimensional wavenumber .
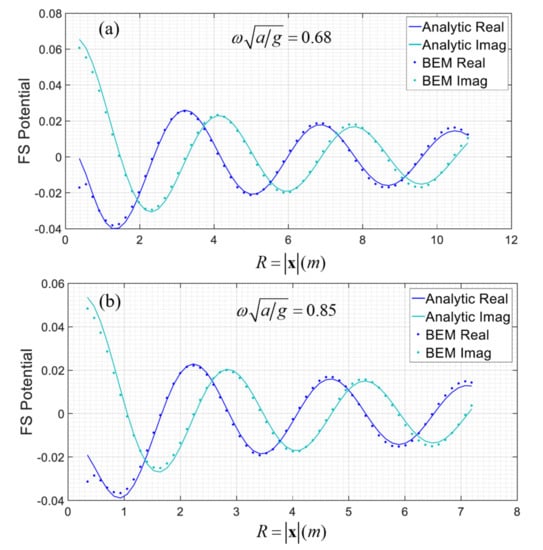
Figure 7.
Comparison of BEM results (shown by using dots) with the analytical solution (solid lines) concerning the free surface potential of heaving cylinder for (a) and (b), , in case of the cylindrical floating body with parameters Rw/h = 1/3.5, d/Rw = 3/2, c/h = 4/7.

Figure 8.
Comparison of BEM results (shown by using dots) with the analytical solution (solid lines) for heaving cylindrical floating body with parameters α/h = 1/3.5, d/α = 3/2, c/h = 4/7, concerning (a) the normalized hydrodynamic coefficients (added mass and damping) vs. non-dimensional frequency , and (b) normalized Froude–Krylov and total excitation forces vs non-dimensional wave number ( ).
In general, a very good approximation of the various quantities is observed between the present BEM and the analytical solution. Small discrepancies observed in the added mass in the low-frequency region are due to a mismatch between the size of the panels on the body and the free surface and are eliminated by increasing the number of panels per wavelength in order to ensure a more uniform mesh size in the vicinity of the junction. Further verification of the present BEM model by comparison of floating body hydrodynamics with analytical solutions is presented in refs. [8,9].
5.2. Power Output of a Single WEC Simulated by the Present 3D BEM
Using the present BEM, we examine in the sequel the hydrodynamic analysis of a cylindrical-shaped WEC consisting of a vertical cylinder with a lower semispherical cap at its bottom, considered in the experimental studies by Stratigaki [3,4]. In the latter works, wave basin experimental results are reported using models of large WEC arrays in a tank to study interactions between the converters and effects on the sea and the coastal area. The water depth in the tank is h =0.7 m and the main dimension ratios are: Rw/h = 0.225, d/h = 0.45. Moreover, the dry WEC mass is M = 20.5 kg, and the heave hydrostatic coefficient is C33 = 764.5 N/m. In the experiment, an array consisting of 25 WECs, arranged at equal distances of 1.575 m near the center of the tank, is examined, as shown in ref. [4] and Figure 5 under regular, polychromatic, long-crested irregular and short-crested irregular incident waves. The characteristic value of the incident wave height is of the order H = 0.1 m, and the characteristic periods T = 1.18 s (corresponding to the natural period of the WEC) and T = 1.26 s are considered. For modelling the PTO effect, friction brakes based on polytetrafluoroethylene material (PTFE―Teflon‖) blocks and four linear springs are used. A potentiometer is attached to each WEC unit for measuring the time series of the heave displacement.
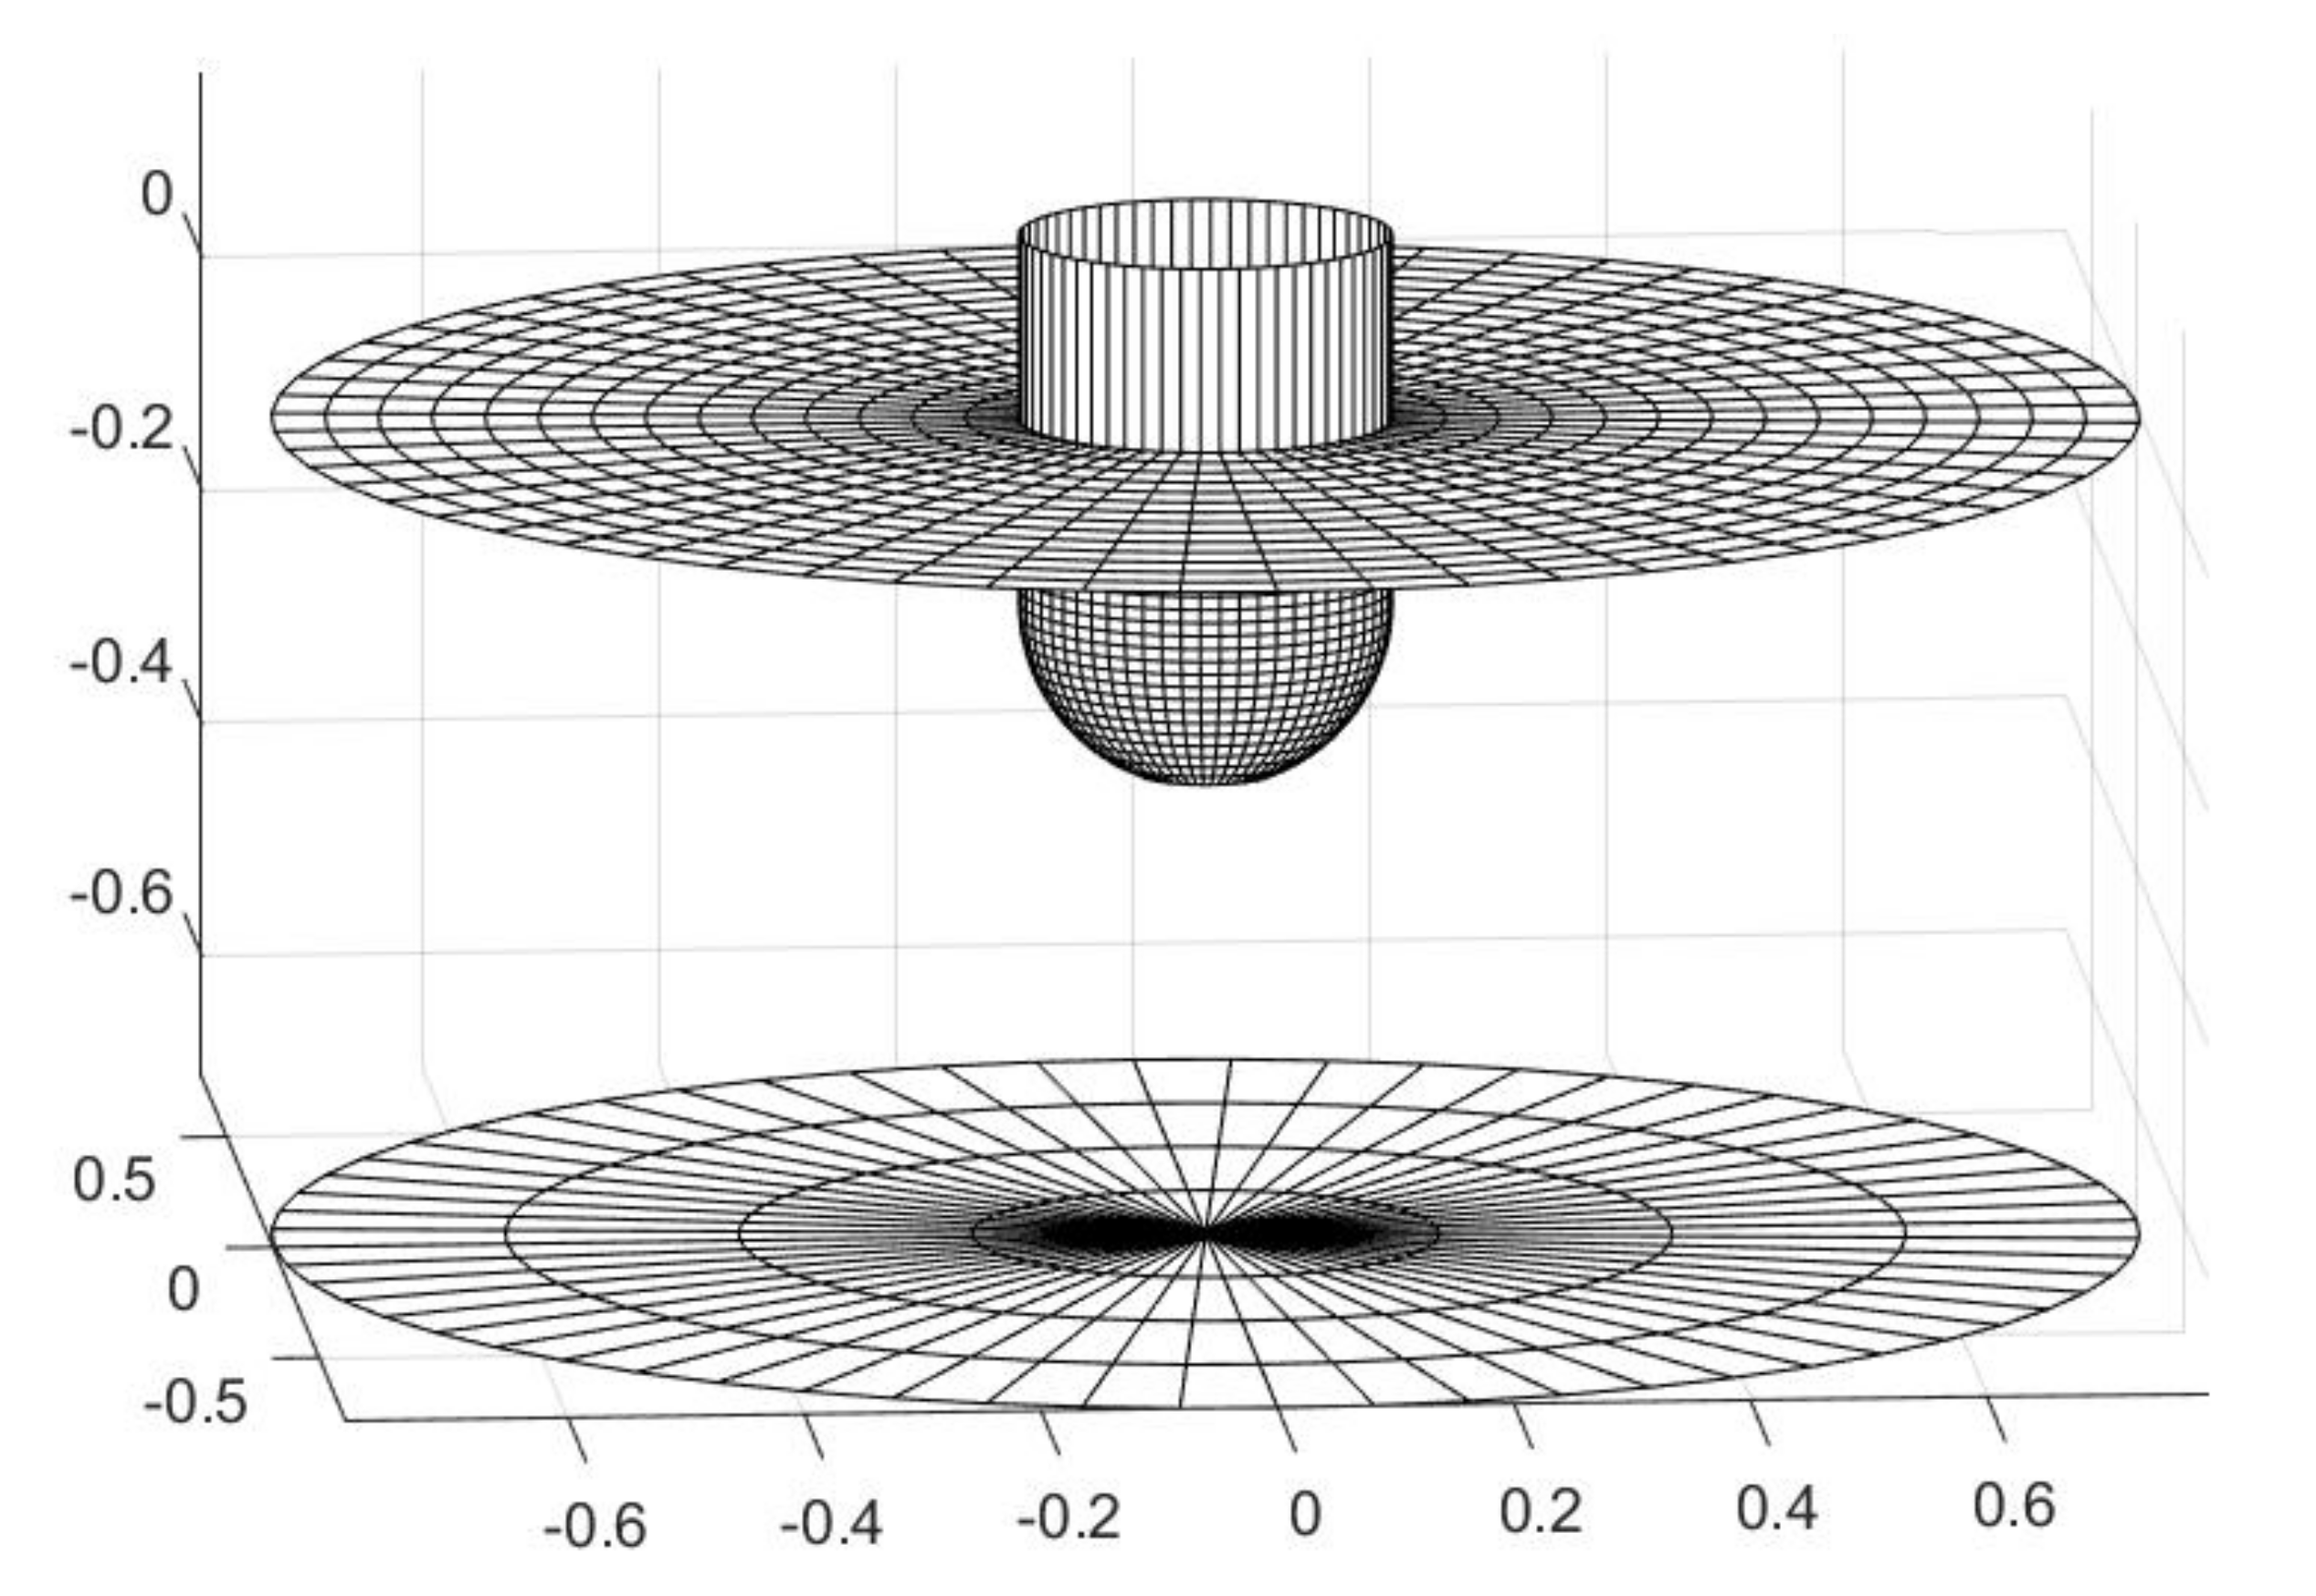
The hydrodynamic behavior of a single WECs of the above type is modelled by the present 3D BEM in constant depth, and a plot of the mesh concerning the floating body is shown in Figure 9, including the distribution of panels on the wetted surface and the free surface. Furthermore, in the same figure, the bottom surface is indicatively included to illustrate the water depth.
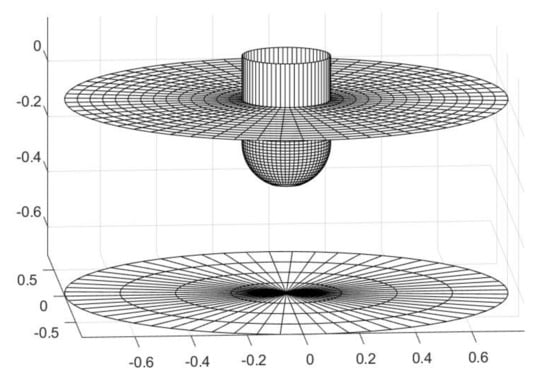
Figure 9.
Mesh of the present 3D BEM of a floating WEC with main dimension ratios: Rw/h = 0.225, d/h = 0.45, indicatively including the bottom surface at depth h = 0.7 m below the calm water level.
Using standard linear theory, we obtain the corresponding heave response of the above WEC as follows:
where is the heave complex amplitude and the corresponding excitation force in the vertical direction. Moreover, = 764.5 N/m is the heave hydrostatic coefficient and denote the extraction of energy from the power take-off device, modelled as an additional damping coefficient and its characteristic elastic constant, respectively. From the above equation, the mean output power of the WEC device is calculated as
where stands for the efficiency of the mechanical-electric PTO system, and thus, the performance index is defined by normalizing the above result with the incident wave power flux over the device of the cross-section given by the WEC waterline diameter, as follows
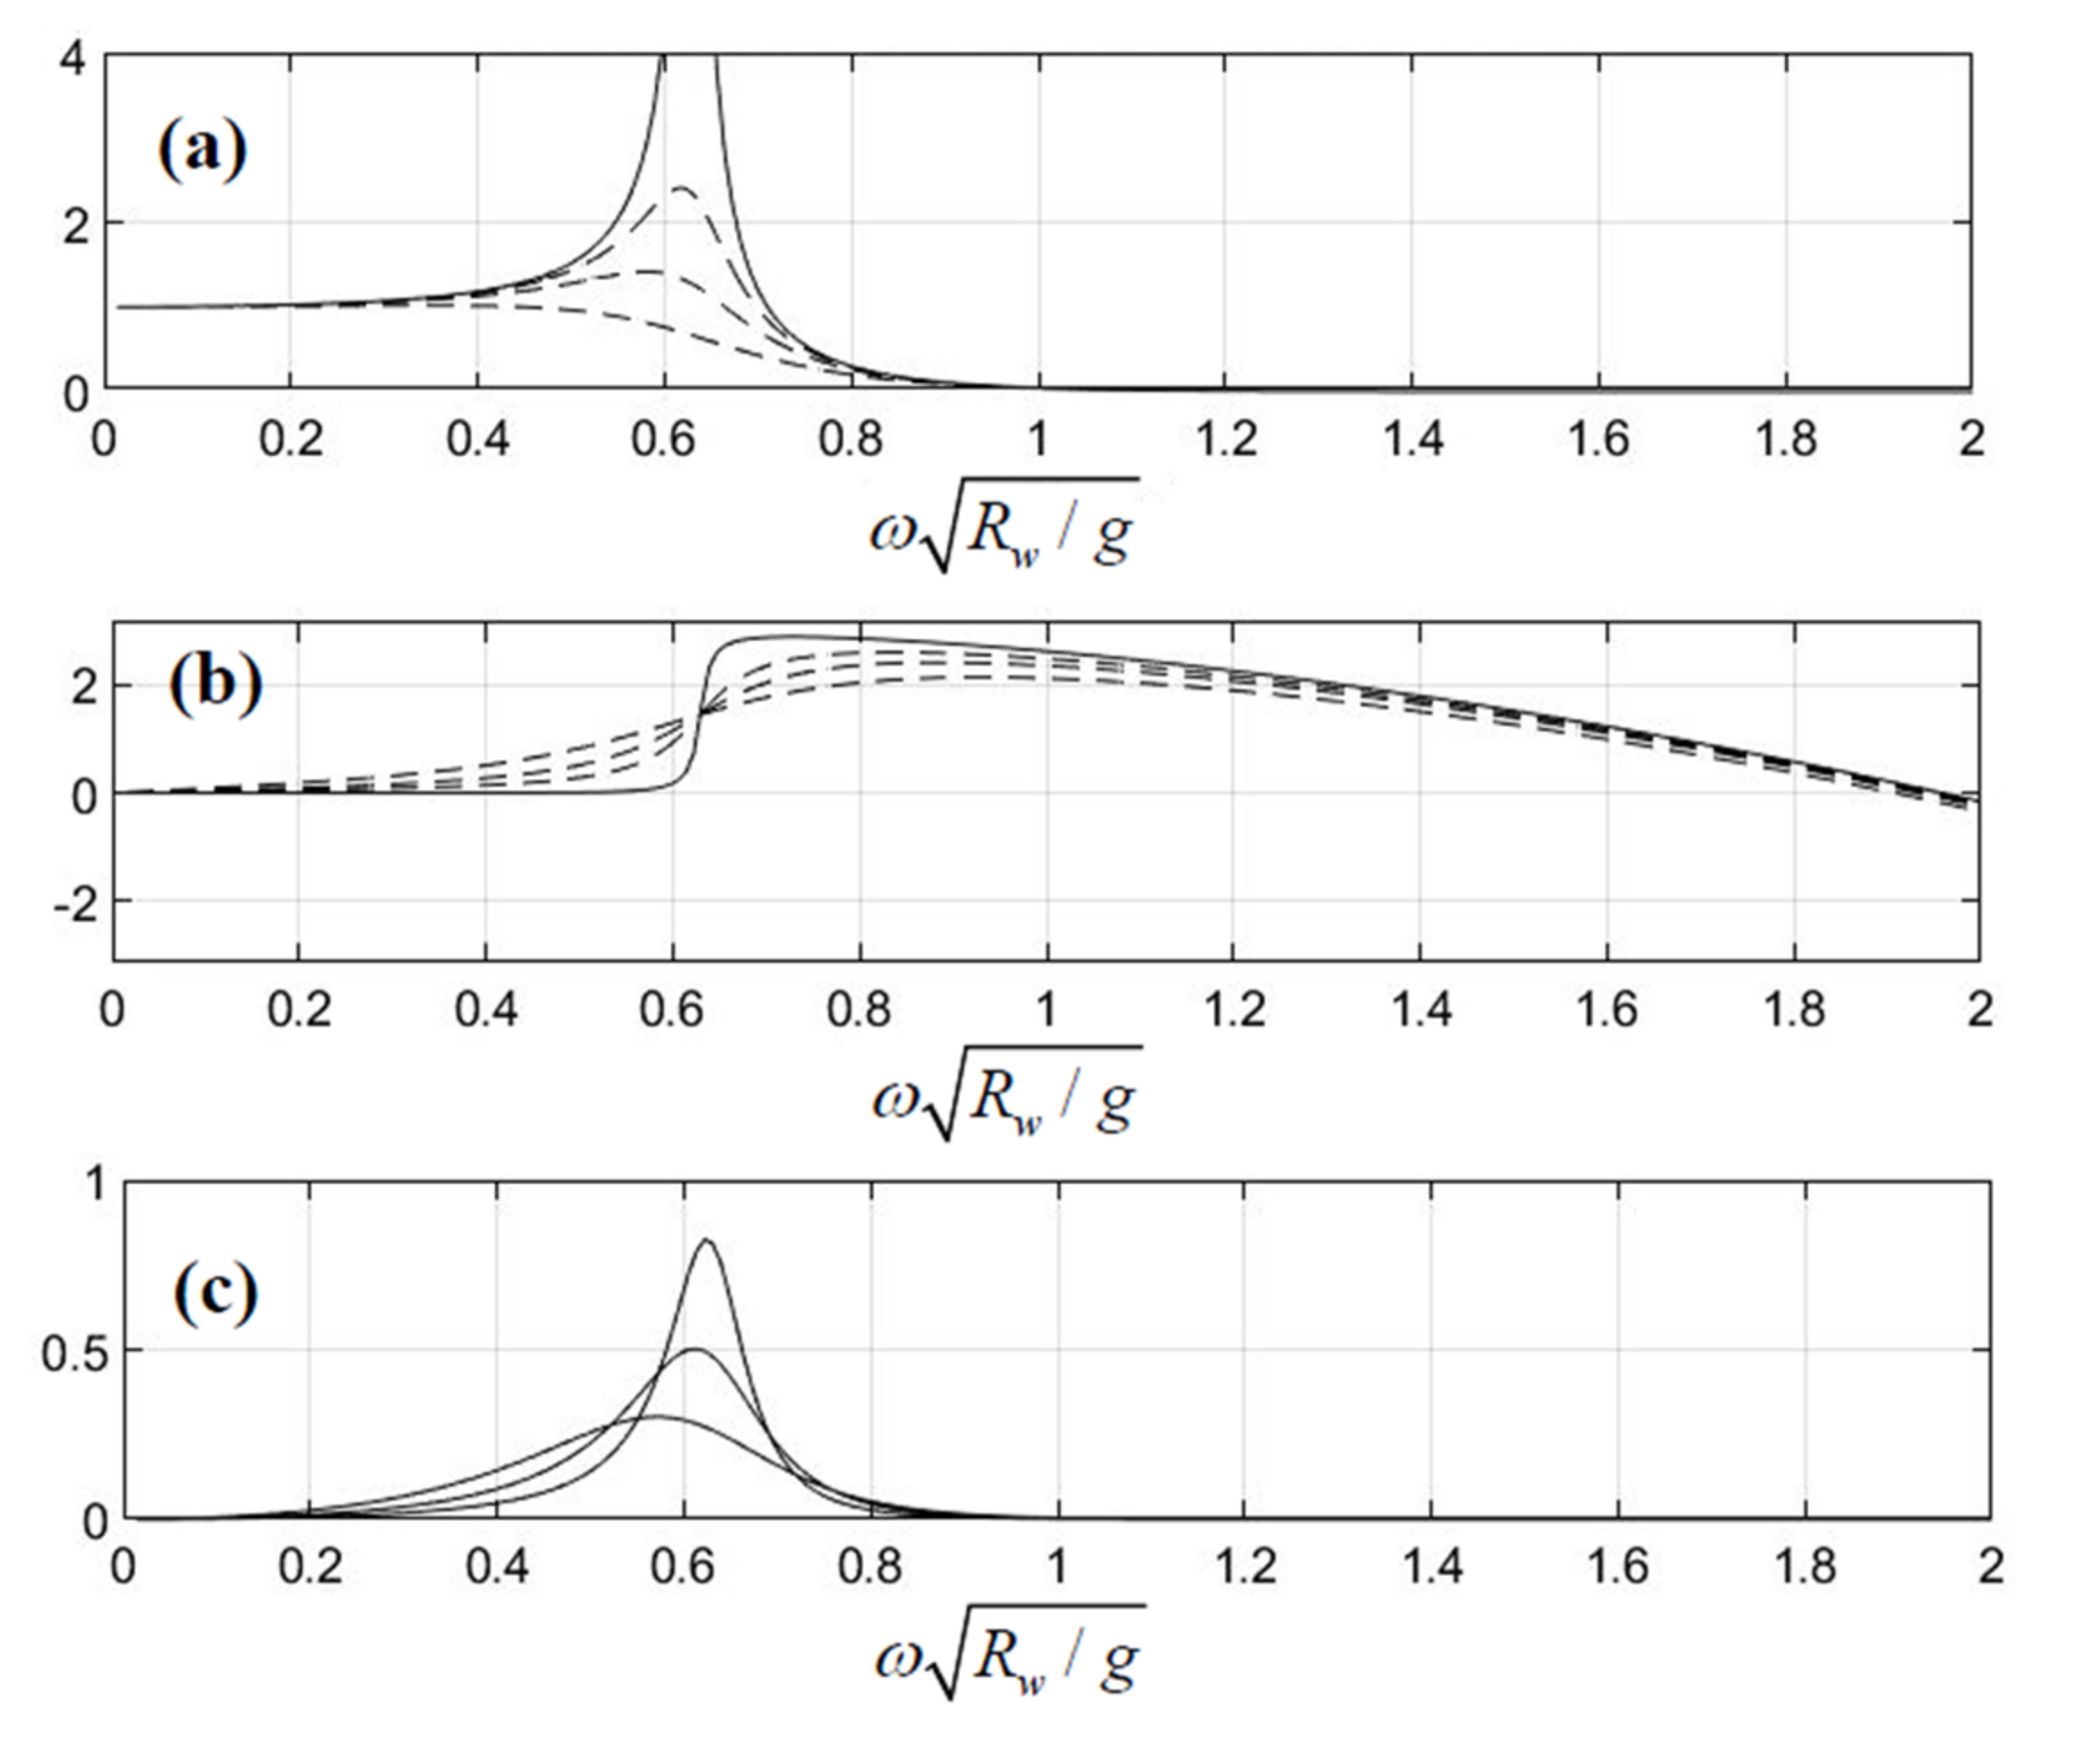
where is the wave group velocity at the given frequency. In the absence of data concerning values of , numerical results for the WEC of Figure 9 using the present BEM are obtained and are presented in Figure 10 for . Moreover, since no data concerning the specific value from the experiment are available, representative values are used in the form: = [20 10 5] B33,av, where B33,av denotes a characteristic value obtained as the frequency average of the calculated hydrodynamic damping coefficient B33. In addition, the case = 0 is considered to correspond to the freely floating body. Numerical results obtained by the present method are shown in Figure 10. Due to the increase in damping effects, larger values of lead to a flattening of the power output curve, while smaller values provide more peaked distribution. As an example, we observe in this figure that in the case of waves of period T = 1.26 s and non-dimensional frequency , the power performance calculated for the above indicative values of = [20 10 5] B33,av is 81%, 42%, and 26.4%, respectively. Comparing these values with the results obtained by the present simplified model for power-extraction and scattering effect by heaving cylindrical WEC presented in Section 4, the case corresponding to the value = 10B33,av is represented by selecting the following values for the simplified model parameters: β = 0.1, α = 2. The latter values will be used in the sequel, in conjunction with the present MMSE model, presented in Section 3 by Equation (12), to illustrate multiple scattering effects in the case of an array of 25 WECs in the form of Figure 8, as in the arrangement of the experimental study by Stratigaki [3].
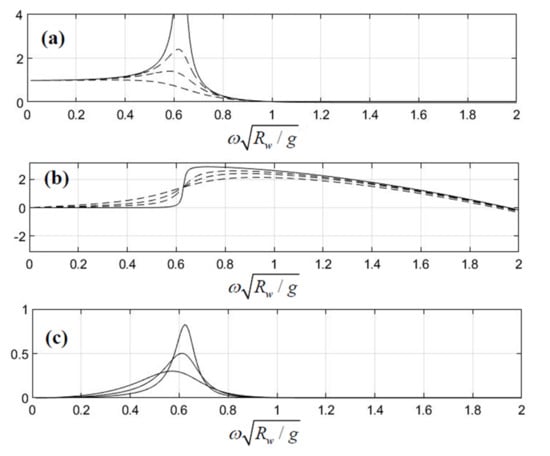
Figure 10.
Calculated results by the present method concerning the responses of single heaving WEC of Figure 8 for various values of the = [20 10 5] B33,av, and = 0. (a) Modulus and (b) phase of heave response (RAO), where the case of freely floating body is indicated by using solid lines. (c) Calculated performance index P.
6. Wave Field around a WEC Array Calculated by the Present MMSE with Inclusions
In order to provide an illustration of the applicability and results obtained by the present model, the case of the WEC array consisting of 25 heaving floaters in constant depth h = 0.7 m is considered. As before, the body’s main dimension ratios are: Rw/h = 0.225, d/h = 0.45, and the rest parameters are as described in the previous Section 5.2 and shown in Figure 10. The WECs are arranged in a 5 × 5 array at equal distances w = 1.575 m.
In all cases, the present MMSE model with the inclusions and parameters β = 0.1 and α = 2 is used to simulate the wave field under monochromatic incident wave conditions. The domain, including the PML region, has been discretized by using second-order central finite differences to approximate derivatives based on a spatially uniform grid. In the results presented below, incident waves of period T = 1.26 s are considered, propagating along the x-axis, and a grid of 501 × 501 points is used, covering the computational domain corresponding to 40–50 points per wavelength found to be sufficient for numerical convergence. It is worth noticing that a simple simulation takes computational time in the order of 1 s in an i7-processor at 2.5 GHz using Matlab®.
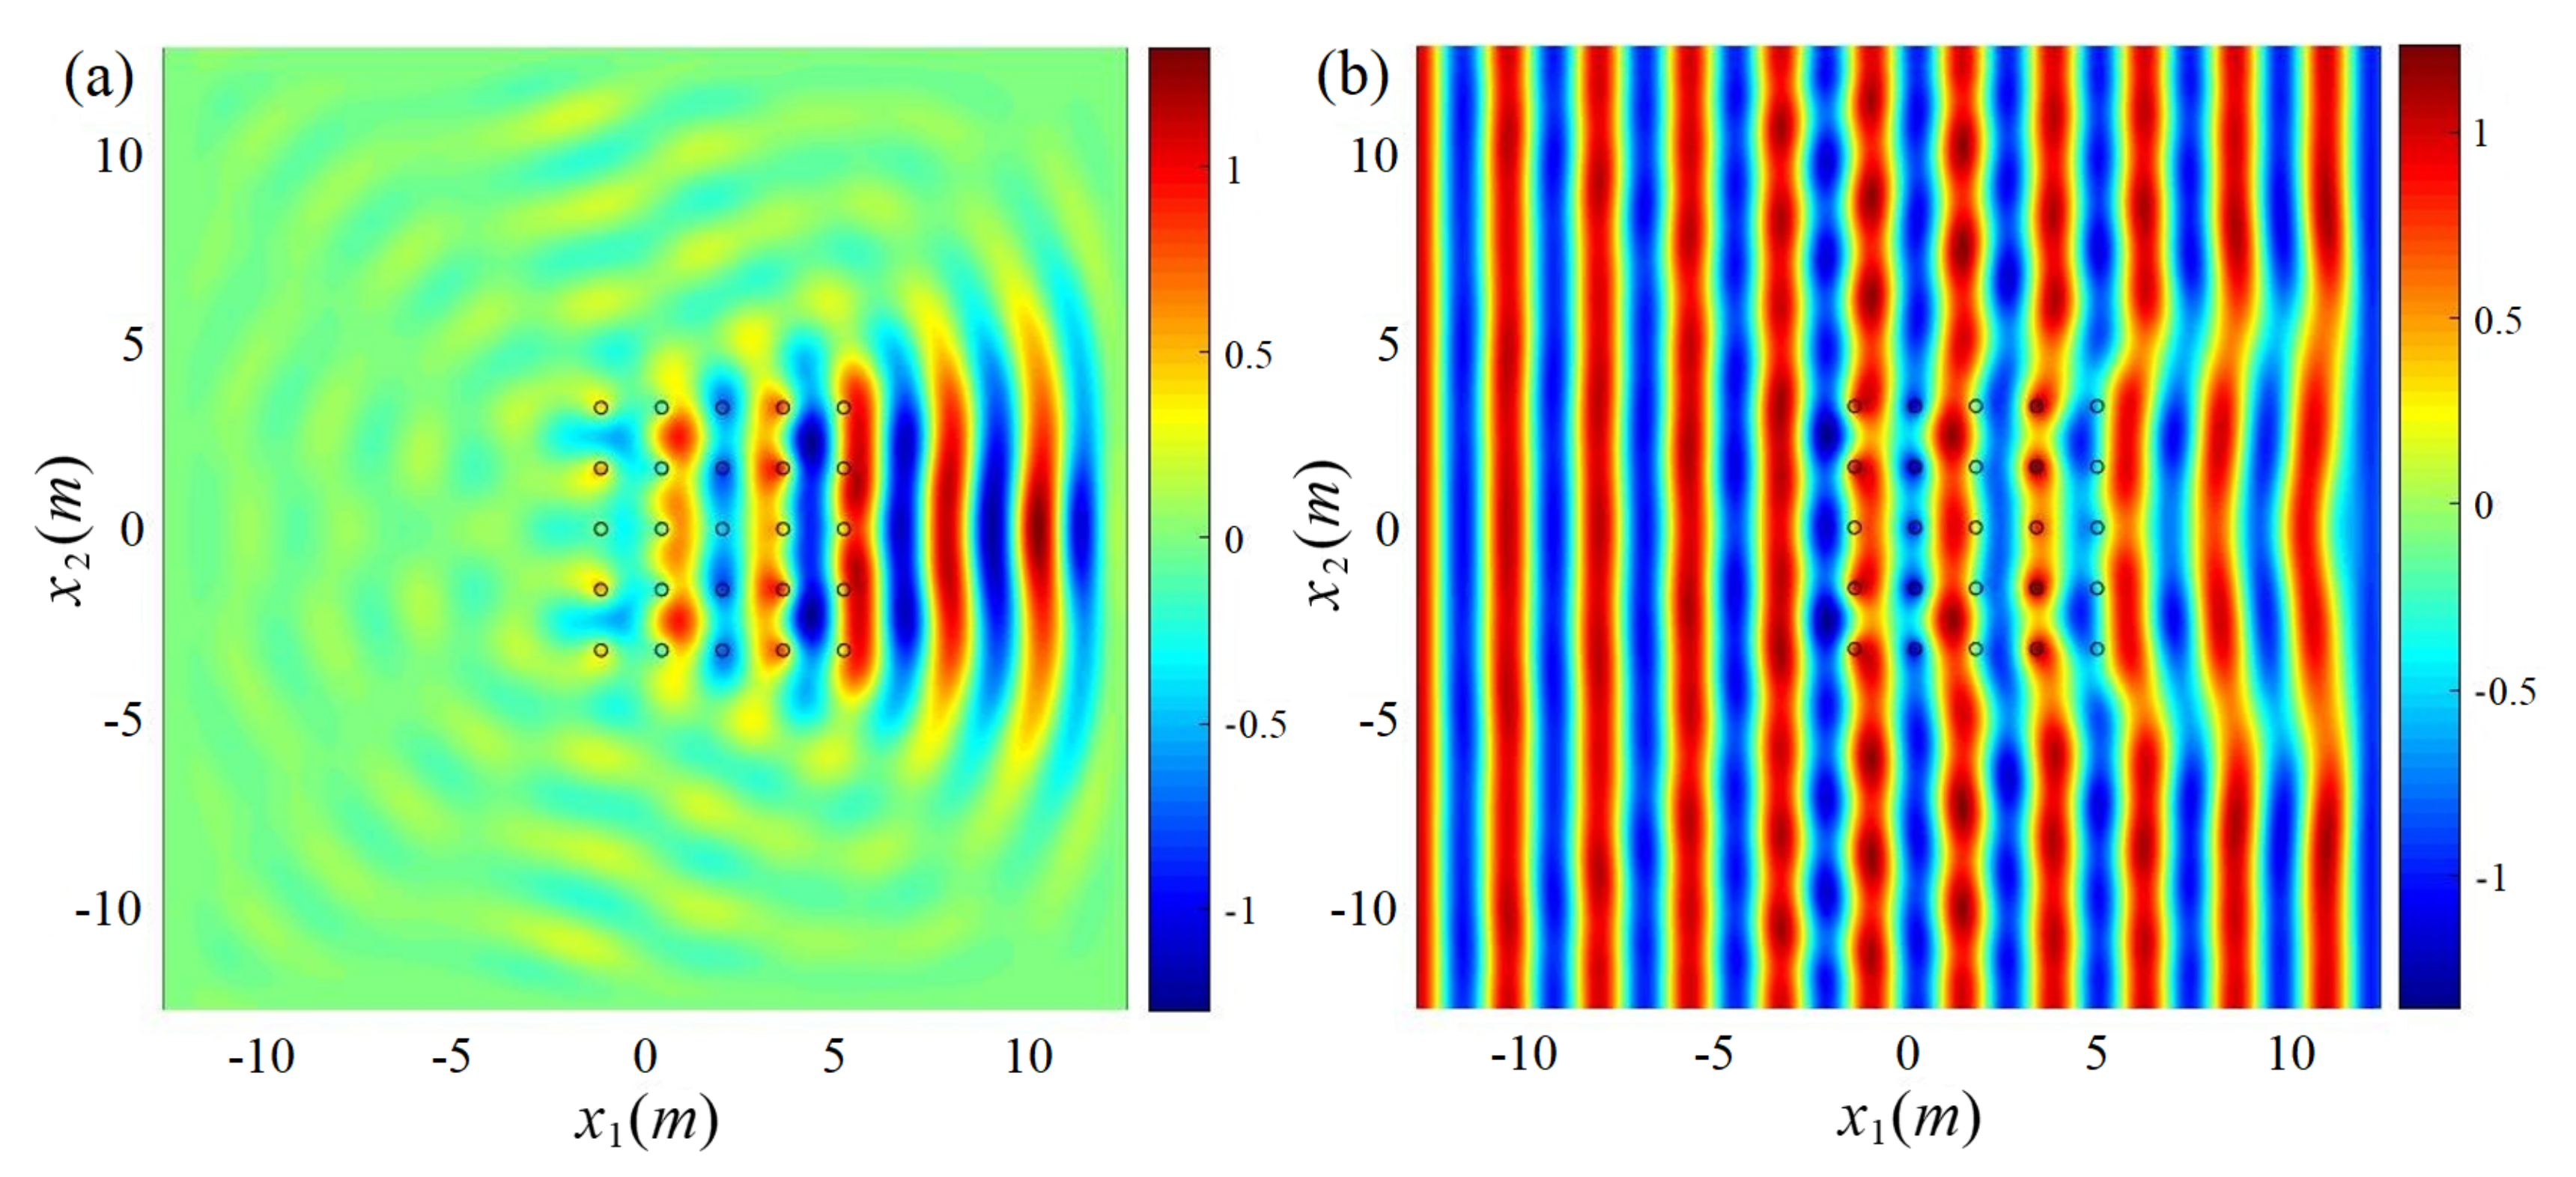
Numerical results concerning the calculated wave field for T = 1.26 s around the WEC array, in constant depth h = 0.7 m, are presented in Figure 11. In this case, the propagating field is expressed analytically, and the MMSE applies to the solution of the scattering field, the calculated real part of which is plotted in Figure 11a. The PML region around the border of the computational domain is included in the plot in order to illustrate the very good performance of the absorbing layer. Correspondingly, the real part of the total field obtained by the superposition of the incident and the scattered field is shown in Figure 11b. It is worth mentioning that the grid density used, corresponding to 6–7 gridpoints across each inclusion and of the order of 50 gridpoints between the absorbers, is required in order for the present model to perform well, both as concerns the modelling of power extraction through artificial damping and the macroscopical scattering effects of the array, including the interactions between the bodies.
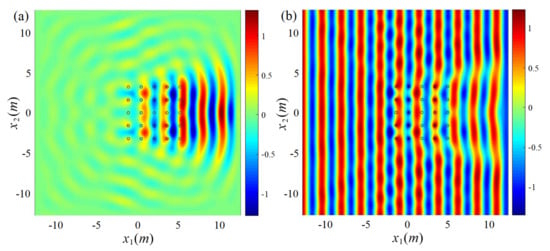
Figure 11.
Calculated wave field for a WEC array in constant depth h = 0.7 m, modelled by 25 inclusions in a 5 × 5 arrangement obtained by the present MMSE (with β = 0.1, α = 2), for harmonic incident waves of period T = 1.26 s. (a) Real part of the scattering field. (b) Real part of the total field.
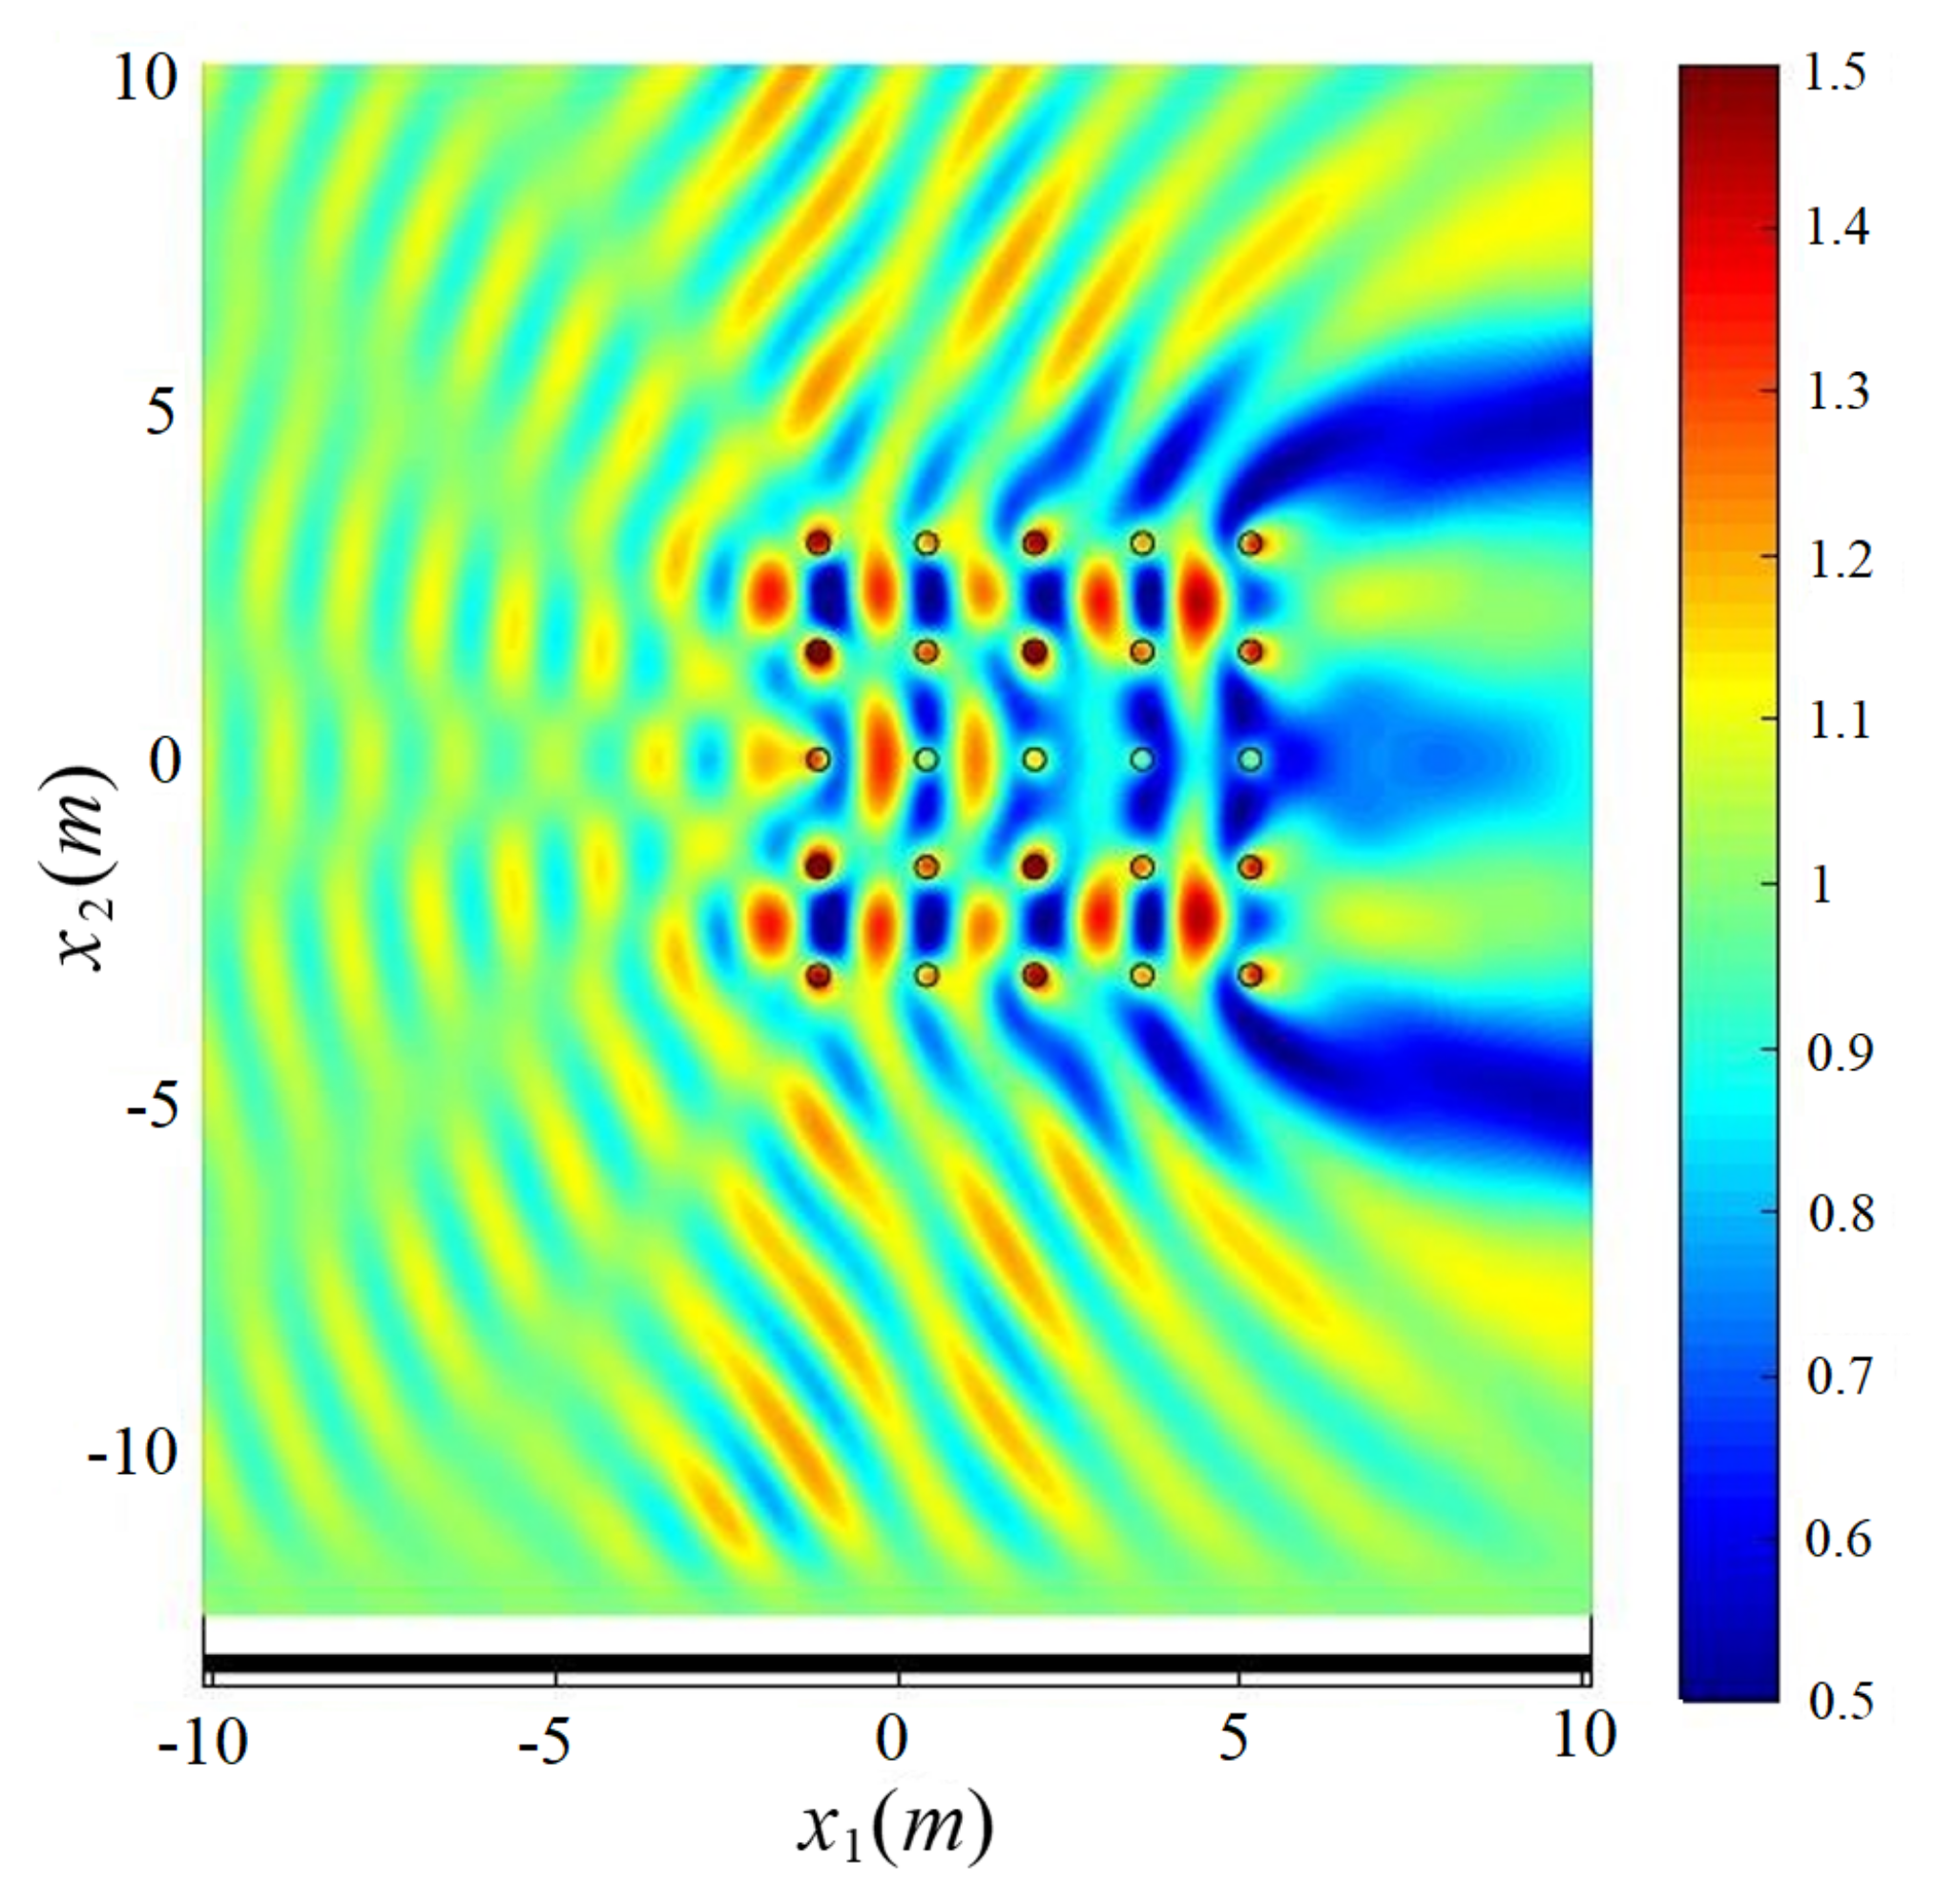
The calculated wave height distribution , normalized with respect to the incident wave height, which is characteristic of the energy distribution in the region is then shown in Figure 12. For the above WEC array in constant depth h = 0.7 m, modelled by 25 inclusions in a 5 × 5 arrangement, obtained by the present MMSE (with β = 0.1, α = 2) and the same harmonic incident waves of period T = 1.26 s. The shadowing effect in the downwave region due to the energy extraction modelled through dissipation is clearly represented, as well as the increase in energy in front of the array in the upwave direction due to reflection effects. Furthermore, specific scattering patterns in subregions between the WECs are observed that are expected to become smoother in the case of multichromatic/multidirectional waves.
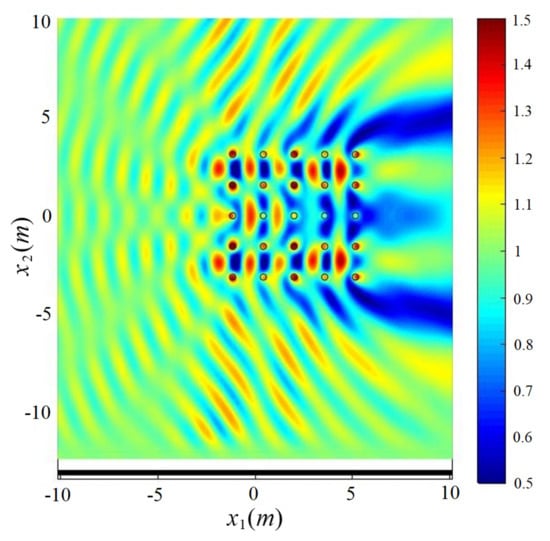
Figure 12.
Calculated wave height distribution, normalized with respect to the incident wave height, for a WEC array in constant depth h = 0.7 m modelled by 25 inclusions in a 5 × 5 arrangement obtained by the present MMSE (with β = 0.1, α = 2), for harmonic incident waves of period T = 1.26 s.
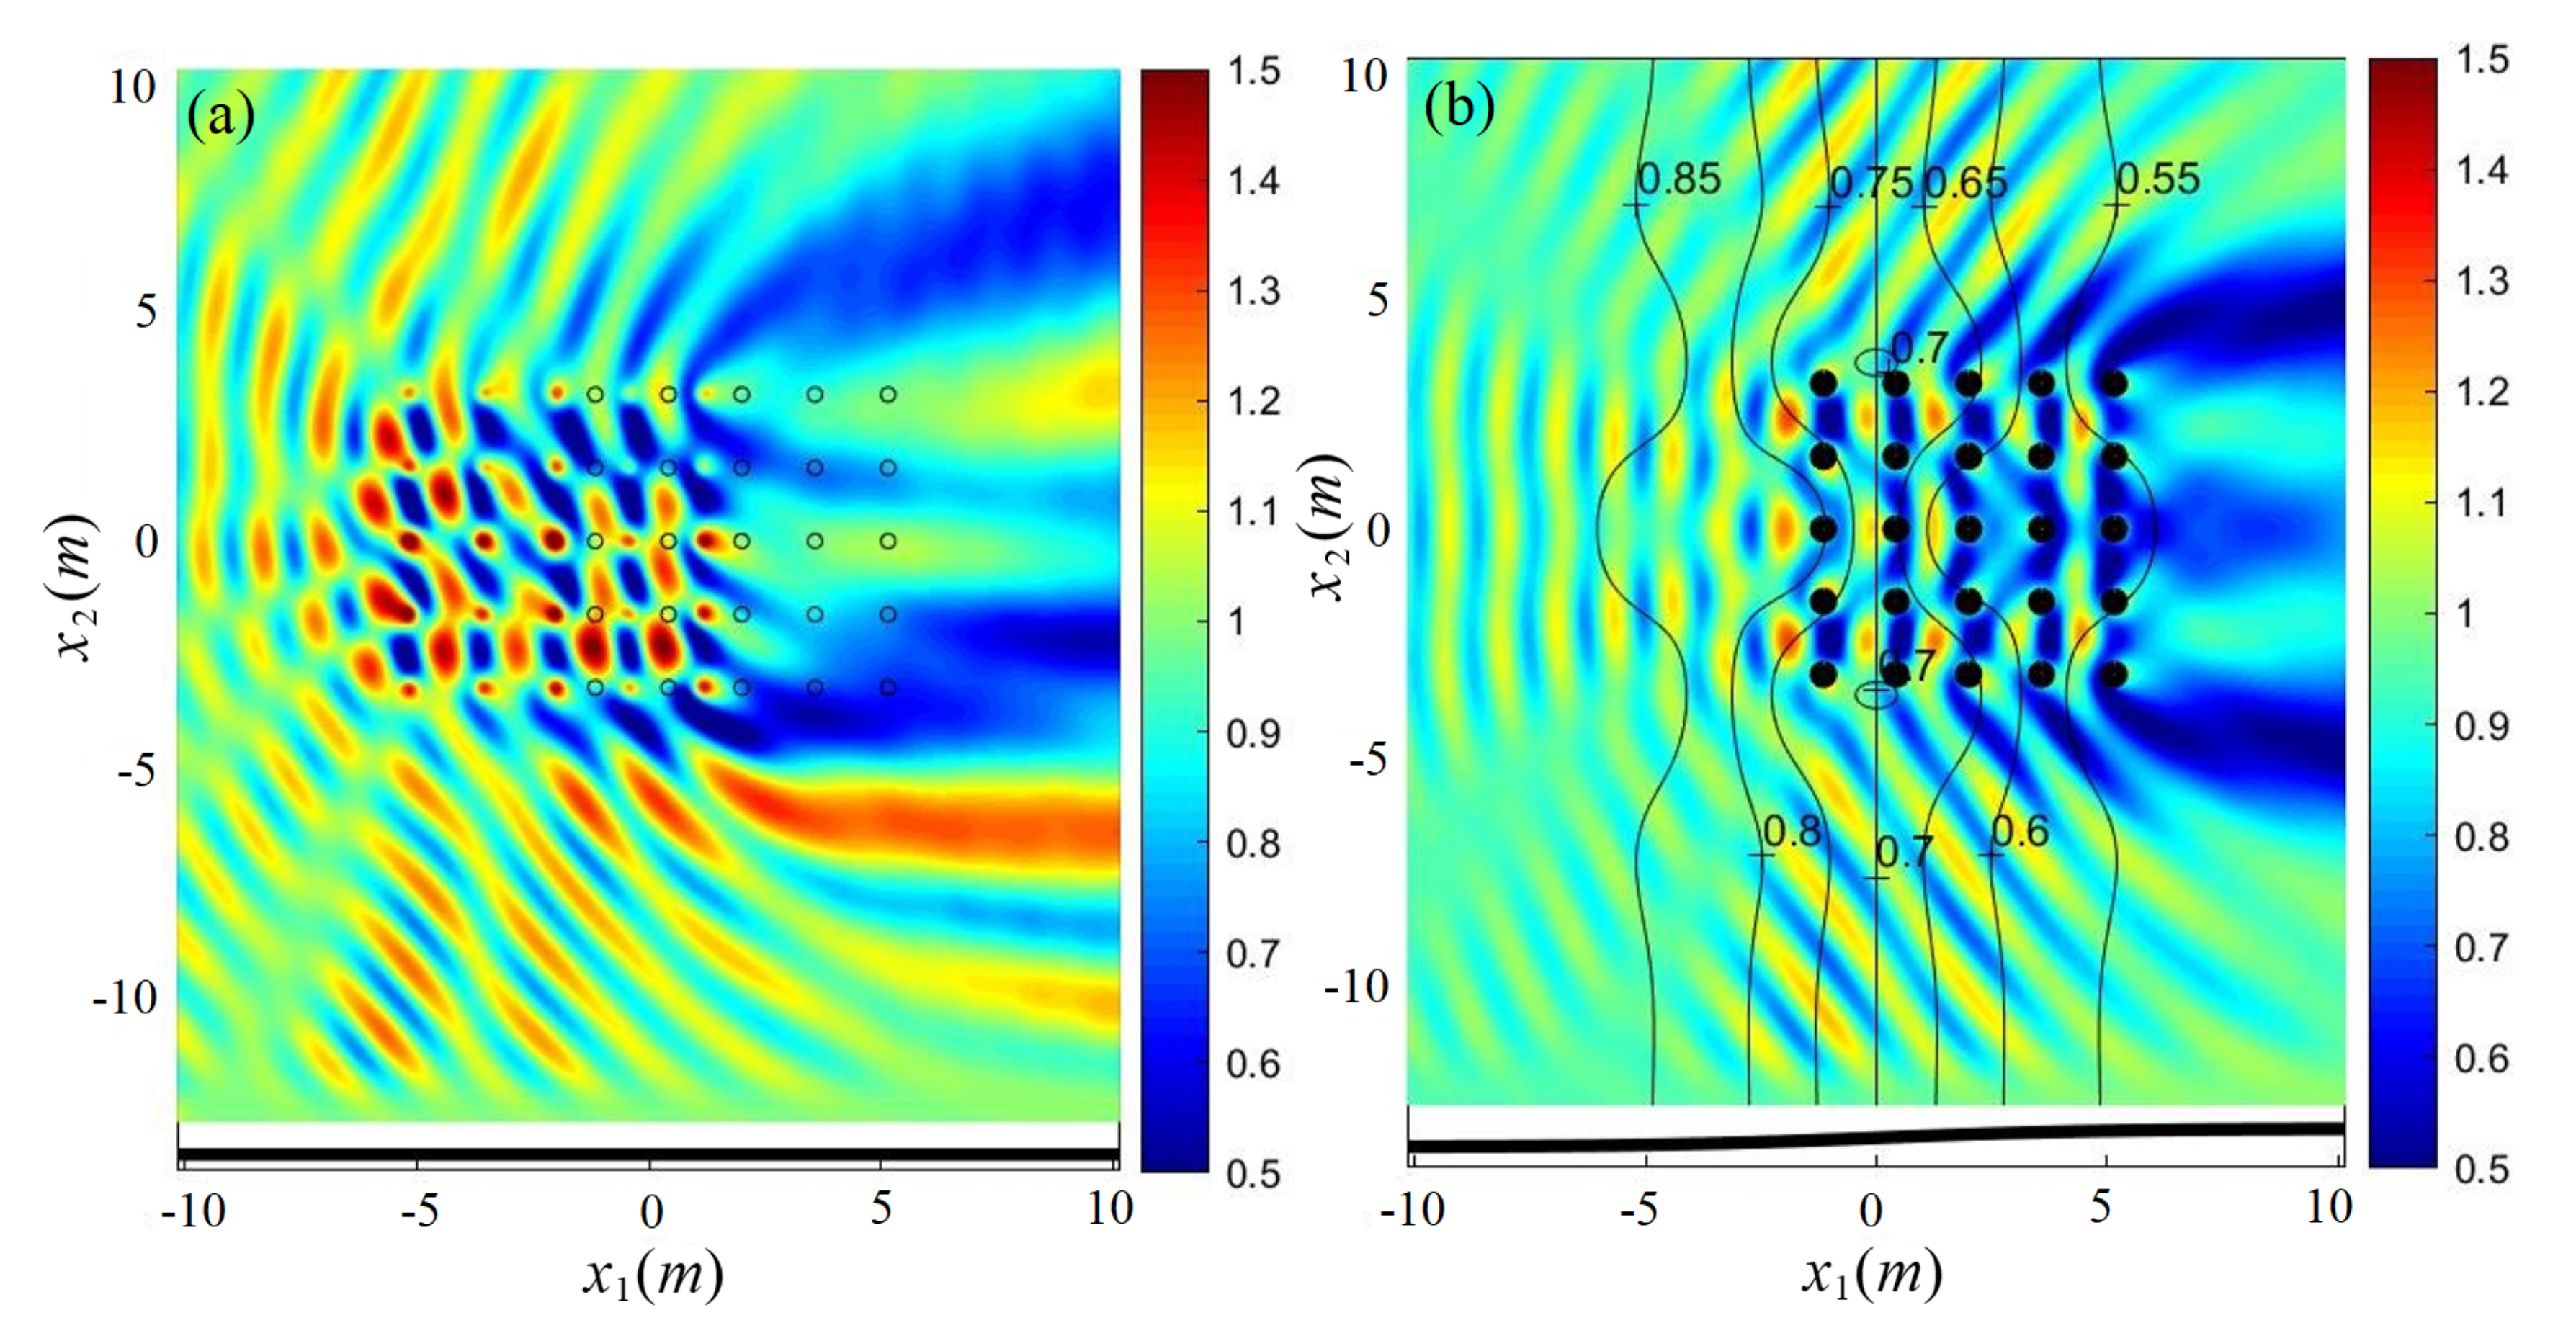
The present model can be easily applied to illustrate the combined effect of refraction and diffraction in variable bathymetry. Such an example is presented in Figure 13 for the same as before array over a sloping seabed defined by the depth function
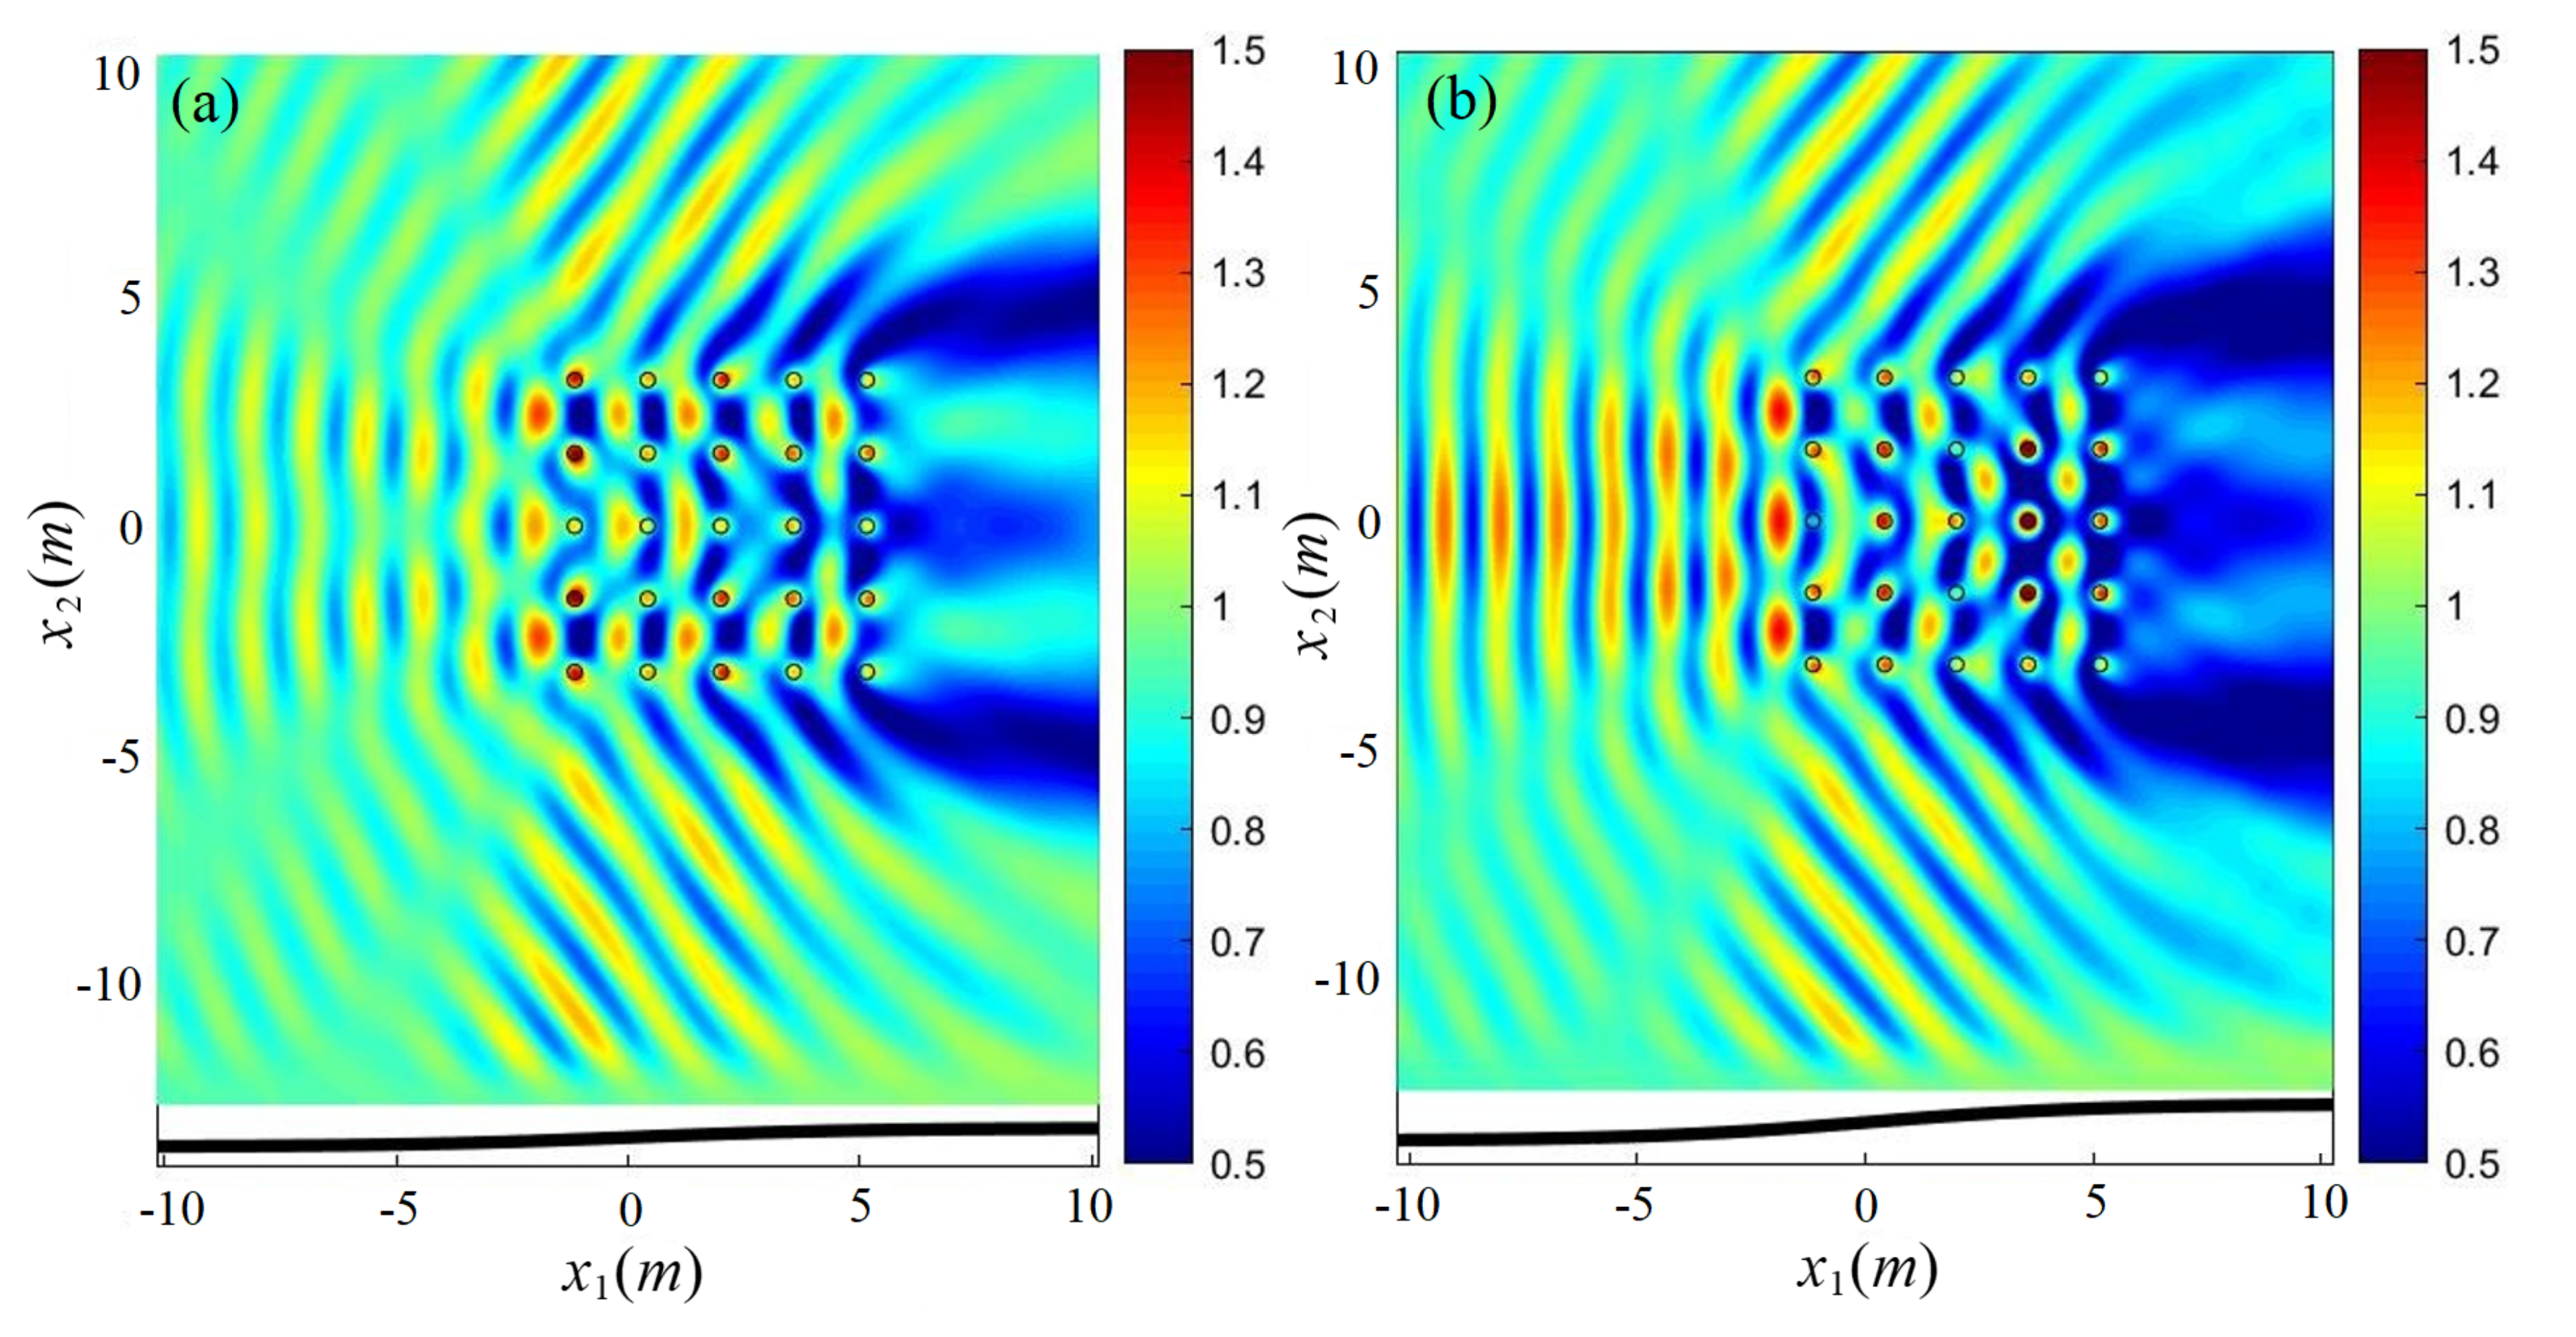
modelling a smooth but steep slope. The coefficient controls the bottom slope and steepness and denotes the middle position of the domain. For the examples presented in Figure 13, two cases of bottom upslopes are considered with mean depth hm = 0.7 m: (a) a moderate one with a depth ranging from 0.9 m to 0.5 m characterized by a mean bottom slope of 4%, and (b) a more steep one with a depth ranging from 1.1 to 0.3 m characterized by a mean bottom slope of 8%. The calculated wave height distribution normalized with respect to the incident wave height is shown in the corresponding subplots of Figure 13. Moreover, in these figures, the seabed profile is shown as a lower subplot.
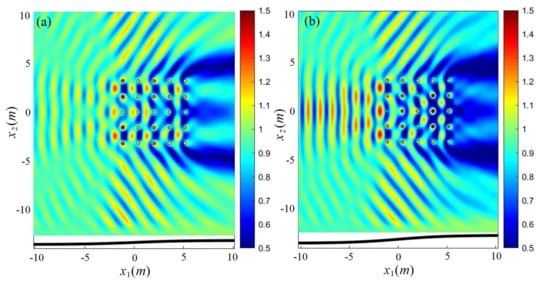
Figure 13.
Same as in Figure 12 for the 5 × 5 WEC arrangement modelled by inclusions, but in sloping seabeds of a mean characteristic slope of (a) 4% and (b) 8%, shown in the lower plots.
A smaller wave height at the downwave side of the domain is observed in the case of the array over the steeper slope (8%) in Figure 13b, as compared to the same case over a milder slope (4%) presented in Figure 13a. This could be due to the increased interaction of waves with the inclusions modelling the WECs over the steeper sloping seabed resulting in reduced energy in the downwave region.
In the case of variable seabed topography, the propagating field without the presence of the WECs is obtained by the coupled-mode model developed by Belibassakis [7], which is very conveniently applied not only to simple upslope environments, such as the ones described by Equation (30), but also to more complicated seabed geometry, modelling realistic topographies in the nearshore and coastal region. The results presented in Figure 13, concerning the energy distribution over and around the domain, illustrate that the additional shoaling and refraction effects produce modifications in the results and could be taken into account concerning both the performance of the WECs and the array and the estimations of impact and possible adverse effects on the nearshore and coastal environment. Furthermore, the propagation of waves incident from various directions propagating over general sloping seabed bathymetry with irregularities is possible by following the approach presented in ref. [7] and applied in various cases [21,22]. As an example, the case of obliquely incident waves in constant depth, propagating at an angle of 15 deg with respect to the x1-axis, and interacting with the 5 × 5 arrays is presented in Figure 14a, as simulated by the present model. A final example is presented in Figure 14 b for waves propagating along the x1-axis over a general bottom topography, described by the sloping seabed profile Equation (30) perturbed by with coefficients suitably chosen in order to generate depth irregularities in the domain, as shown in Figure 14b by using depth contours.
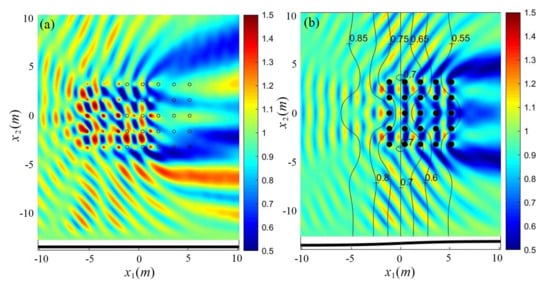
Figure 14.
Same as in Figure 13 for the 5 × 5 WEC arrangement modelled by inclusions in the case of (a) obliquely incident waves at an angle of 15 deg in constant depth, and (b) waves over the sloping seabed bathymetry of 4% with additional irregularities (shown by the depth contours).
We conclude from the above examples that the present simplified model provides a low-cost first estimation of the wave conditions in the domain, which could be exploited as a supporting tool for best arrangement and park design purposes. The power output of the array and the q-factor can be estimated by comparing the energy distribution in the whole region with and without the consideration of the devices. Moreover, the present model could provide more detailed information and data in the vicinity of each WEC in the configuration that could be exploited in local 3D analysis, e.g., by the present 3D BEM model, to enhance the estimation of the performance of the device and the hydrodynamic quantities in the domain.
Finally, it is worth noticing the direct applicability of the present model to treat the transformation of incident frequency and directional spectra over the whole region without and with the presence of the WEC array, and results and comparison with experimental measurements and field data will be subject of future work.
7. Conclusions
A simplified model based on the Modified Mild-Slope Equation with inclusions is developed for modelling the scattering of waves from multiple simple heaving point absorbers arranged in an array in general bottom topography. The model is used, in conjunction with a 3D BEM, in order to estimate the parameters modelling the energy extraction of the devices, using data obtained from the hydrodynamic responses and performance of the single floating WEC. Subsequently, the present model is used for specific examples to calculate the wave field and the hydrodynamic performance of arrays of heaving WECs in constant depth and variable bathymetry regions and illustrate the effect of bottom slope and variation on the calculated wave field in the domain and in the vicinity of the devices. The present simplified model provides a low-cost first estimation of the wave conditions in the domain, which could be exploited as a supporting tool for best arrangement and park design purposes. Moreover, the present model could provide more detailed information and data in the vicinity of each WEC in the configuration that could be exploited in local 3D analysis, e.g., by the present 3D BEM model, to enhance the estimation of the performance of the device and the hydrodynamic quantities in the domain. An extension of the present model to include effects of weak wave nonlinearity and dissipation due to friction and wave breaking is also possible, and future work will be planned in this direction.
Author Contributions
This work was supervised by K.B. The numerical scheme was developed by K.B. and M.B. The draft of the text was prepared by all authors and the numerical simulations were handled by M.B. and A.M. All authors have read and agreed to the published version of the manuscript.
Funding
The present work has been supported by the DREAM project. The paper fees have been offered by Fluids.
Institutional Review Board Statement
Not applicable.
Informed Consent Statement
Not applicable.
Data Availability Statement
Not applicable.
Acknowledgments
This work has been supported by the research project DREAM (Dynamics of the Resources and technological Advance in harvesting Marine renewable energy), funded by the Romanian Executive Agency for Higher Education, Research, Development, and Innovation Funding–UEFISCDI, grant number PNIII-P4-ID-PCE-2020-0008. A. Magkouris has been supported for his doctoral studies by the Special Account for Research Funding (E.L.K.E.) of the National Technical University of Athens (NTUA).
Conflicts of Interest
The authors declare no conflict of interest.
References
- Charrayre, F.; Peyrard, C.; Benoit, M.; Babarit, A. A coupled methodology for wave body interactions at the scale of a farm of wave energy converters including irregular bathymetry. In Proceedings of the 33th International Conference on Offshore Mechanics and Arctic Engineering (OMAE2014), San Francisco, CA, USA, 8–13 June 2014. [Google Scholar]
- McCallum, P.; Venugopal, V.; Forehand, D.; Sykes, R. On the performance of an array of floating energy converters for different water depths. In Proceedings of the 33th International Conference Offsh Mechanics & Arctic Engin (OMAE2014), San Francisco, CA, USA, 8–13 June 2014. [Google Scholar]
- Stratigaki, V.; Troch, P.; Stallard, T.; Forehand, D.; Kofoed, J.P.; Folley, M.; Benoit, M.; Babarit, A.; Kirkegaard, J. Wave Basin Experiments with Large Wave Energy Converter Arrays to Study Interactions between the Converters and Effects on Other Users in the Sea and the Coastal Area. Energies 2014, 7, 701–734. [Google Scholar] [CrossRef]
- Stratigaki, V.; Troch, P.; Stallard, T.; Forehand, D.; Folley, M.; Kofoed, J.P.; Benoit, M.; Babarit, A.; Vantorre, M.; Kirkegaard, J. Sea-state modification and heaving float interaction factors from physical modelling of arrays of wave energy converters. J. Renew. Sustain. Energy 2015, 7, 061705. [Google Scholar] [CrossRef]
- Bonovas, M.; Belibassakis, K.; Rusu, E. Multi-DOF WEC Performance in Variable Bathymetry Regions Using a Hybrid 3D BEM and Optimization. Energies 2019, 12, 2108. [Google Scholar] [CrossRef]
- Athanassoulis, G.A.; Belibassakis, K.A. A consistent coupled-mode theory for the propagation of small-amplitude water waves over variable bathymetry regions. J. Fluid Mech. 1999, 389, 275–301. [Google Scholar] [CrossRef]
- Belibassakis, K.A.; Athanassoulis, G.A.; Gerostathis, T. A coupled mode system for the refraction-diffraction of linear waves over steep three dimensional topography. Appl. Ocean Res. 2001, 23, 319–336. [Google Scholar] [CrossRef]
- Belibassakis, K.A. A Boundary Element Method for the hydrodynamic analysis of floating bodies in general bathymetry regions. Eng. Anal. Bound. Elem. 2008, 32, 796–810. [Google Scholar] [CrossRef]
- Belibassakis, K.; Bonovas, M.; Rusu, E. A Novel Method for Estimating Wave Energy Converter Performance in Variable Bathymetry Regions and Applications. Energies 2018, 11, 2092. [Google Scholar] [CrossRef]
- Beels, C.; Troch, P.; De Backer, G.; Marc Vantorre, M.; De Rouck, J. Numerical implementation and sensitivity analysis of a wave energy converter in a time-dependent mild-slope equation model. Coast. Eng. 2010, 57, 471–492. [Google Scholar] [CrossRef]
- Massel, S. Ocean Surface Waves: Their Physics and Prediction; World Scientific Publishing Co. Pte Ltd.: Singapore, 2013. [Google Scholar]
- Massel, S. Extended refraction-diffraction equation for surface waves. Coast. Eng. 1993, 19, 97–126. [Google Scholar] [CrossRef]
- Chamberlain, P.G.; Porter, D. The modified mild-slope equation. J. Fluid Mech. 1995, 291, 393–407. [Google Scholar] [CrossRef]
- Yeung, R.W. Added mass and damping of a vertical cylinder in finite-depth waters. Appl. Ocean Res. 1981, 3, 119–133. [Google Scholar] [CrossRef]
- Sabuncu, T.; Calisal, S. Hydrodynamic coefficients for vertical circular cylinders at finite depth. Ocean Eng. 1981, 8, 25–63. [Google Scholar] [CrossRef]
- Suh, K.D.; Lee, C.; Park, Y.-H.; Lee, T.H. Experimental verification of horizontal two-dimensional modified mild-slope equation model. Coast. Eng. 2001, 44, 1–12. [Google Scholar] [CrossRef][Green Version]
- Karperaki, A.; Papathanasiou, T.K.; Belibassakis, K.A. An optimized, parameter-free PML-FEM for wave scattering problems in the ocean and coastal environment. Ocean Eng. 2019, 179, 307–324. [Google Scholar] [CrossRef]
- Berenger, J.P. A perfectly matched layer for the absorption of electromagnetic waves. J. Comput. Phys. 1994, 114, 185–200. [Google Scholar] [CrossRef]
- Turkel, E.; Yefet, A. Absorbing PML boundary layers for wave-like equations. Appl. Numer. Math. 1998, 27, 533–557. [Google Scholar] [CrossRef]
- Collino, F.; Monk, P.B. Optimizing the perfectly matched layer. Comput. Meth. Appl Mech. Eng. 1998, 164, 157–171. [Google Scholar] [CrossRef]
- Belibassakis, K.A.; Tsoukala, V.K.; Katsardi, V. Three dimensional wave diffraction in the vicinity of openings in coastal structures. Appl. Ocean Res. 2014, 45, 40–54. [Google Scholar] [CrossRef]
- Belibassakis, K.A.; Gerostathis, T.; Athanassoulis, G.A. A coupled mode model for water wave scattering by horizontal, non-homogeneous current in general bottom topography. Appl. Ocean Res. 2011, 33, 384–397. [Google Scholar] [CrossRef]
- Radder, A.C. On the parabolic equation method for water wave propagation. J. Fluid Mech. 1979, 95, 159–176. [Google Scholar] [CrossRef]
- Mei, C.C. The Applied Dynamics of Ocean Surface Waves; World Scientific: Singapore, 1994. [Google Scholar]
- Martin, P.A. Multiple Scattering: Interaction of Time-Harmonic Waves with N Obstacles; Cambridge University Press: Cambridge, UK, 2005. [Google Scholar]
- Belibassakis, K.; Arnaud, G.; Rey, V.; Touboul, J. Propagation and scattering of waves by dense arrays of impenetrable cylinders in a waveguide. Wave Motion 2018, 80, 1–19. [Google Scholar] [CrossRef]
- Porter, R.; Zheng, S.; Greaves, D. Extending limits for wave power absorption by axisymmetric devices. J. Fluid Mech. 2021, 924, A39. [Google Scholar] [CrossRef]
- Michele, S.; Zheng, S.; Greaves, D. Wave energy extraction from a floating flexible circular plate. Ocean Eng. 2022, 20, 113–126. [Google Scholar] [CrossRef]
- Beer, G.; Smith, I.; Duenster, C.H. The Boundary Element Method with Programming; Springer: Wien, Austria, 2008. [Google Scholar]
- Katz, J.; Plotkin, A. Low Speed Aerodynamics; Cambridge University Press: Cambridge, UK, 2001. [Google Scholar]
- Newman, J. Distributions of sources and normal dipoles over a quadrilateral panel. J. Eng. Math. 1986, 20, 113–126. [Google Scholar] [CrossRef]
- Sclavounos, P.D.; Borgen, H. Seakeeping Analysis of a High-Speed Monohull with a Motion-Control Bow Hydrofoil. J. Ship Res. 2004, 48, 77–117. [Google Scholar] [CrossRef]
Publisher’s Note: MDPI stays neutral with regard to jurisdictional claims in published maps and institutional affiliations. |
© 2022 by the authors. Licensee MDPI, Basel, Switzerland. This article is an open access article distributed under the terms and conditions of the Creative Commons Attribution (CC BY) license (https://creativecommons.org/licenses/by/4.0/).

