1. Introduction
As the first Coal Fired Steam Power Plant present in Aceh Province, the existence of this power plant operation is very important for the local community as it supports the electricity demand in the south-west coast of Aceh Province. However, since the completion of the port construction process with the breakwater in 2013, there was a sedimentation process inside the port and the mouth of channel [
1]. The breakwater structure was extended and some groins were also constructed [
2,
3] to minimize the problem, but these solutions have not been maximally effective in protecting the port basin from sedimentation. Sedimentation threatened the operation of the Nagan Raya port and steam power plant. A suitable port-basin depth for the anchoring of coal supply vessels is no longer achieved. In addition, the inlet channel for the water supply for the cooling of the power plant engine placed in the harbor basin is experiencing siltation. This siltation led to a reduction and decrease in the quality of the condenser coolant water supply, thus disrupting the productivity and service of the power plant for the people of Aceh Darussalam.
To overcome these problems, dredging activity was carried out to maintain the navigation channel depth and the port basin. However, the dredging solution is temporary and a more permanent solution is required to solve the sedimentation problem at the port. Because routine dredging activity has significantly increased costs and can lead to port downtimes, dredging optimization is strongly encouraged. On the other hand, the volume of sediment will continue to increase if the main problems of the sedimentation process are not addressed.
In short, over the years, new technologies have been developed as alternative methods for dredging. The first alternative was the use of fixed coastal structures such as groins [
4,
5], sand traps [
6,
7] and current deflection walls [
8,
9] to remove or reduce the amount of sediment from the port entrance. Recently, C. Juez et al. (2018) analyzed the effect of bank macro-roughness on sediment transportation [
10]. Their laboratory study showed a clear function of the macro-roughness elements in terms of the trapping of fine sediments in the channel.
The second alternative to be developed was the use of water injections to lift and separate the grains of sediment from the seabed. The first design of a method for this system was proposed by Weisman et al. (1996) [
11]. Water is pumped into a perforated buried pipeline below the seafloor for seabed maintenance. The third technological approach to be introduced is known as the sand bypassing system. Since the early 1930s, the sand bypassing system has been used in the United States [
12]. Sand bypassing has a small environmental impact, but has high installation costs with uncertain operational costs [
13]. Furthermore, the sand bypassing system usually works on a continuous basis and the system is able to ensure the prevention of sedimentation over time for the maintenance of the seabed.
The purpose of this study was to mitigate the sedimentation problem in Nagan Raya port by evaluating the effect of dredging maintenance activities. This study was mainly achieved in two parts. First, field measurements were conducted to identify the environmental characteristics of the study area, such as the wave climate, sediment properties, tide, current speed, wind climate, sediment transport volume and bathymetry. Secondly, numerical models (ShorelineS and Delft3D) were applied to provide an overview of the hydrodynamic features occurring within ports that directly or indirectly lead to sedimentation. The process-based Delft3D model was used to determine the sediment sources and sink that corresponded to areas where the sediment was disposed or distributed within the field of study. This Delft3D model has been implemented and applied in various coastal areas around the world to explore the impact of dredging material on sedimentation, e.g., in [
14,
15,
16,
17].
2. Study Area
The Nagan Raya Coal Fired Steam Power Plant (known as PLTU Nagan Raya) is a power plant that uses coal as its fuel and can supply electricity at a capacity of 2 × 110 MW. This Steam Power Plant is located in Gempong Sauk Puntong Village, District of Nagan Raya, Nanggroe Aceh Darussalam Province, Indonesia. The port is one of the facilities that supports the main operation of the coal-fired power plant in supplying coal as the main fuel for engines used in driving. The port is geographically located at coordinates 04°06.116′ North latitude and 96°11.6′ East longitude as shown in
Figure 1.
In the north part, there is the Krueng Meureubo river, which is located about 6 km from the location of Nagan Raya port. Meanwhile, 7 km south from Nagan Raya port, there is the Krueng Nagan river. Both rivers have a large watershed and carry significant sediment to the river mouth. Because of the long distance and the influence of longshore currents that cuts the movement of sediment, the sediment contribution originating from the river is considered non-existent. In this study, only sediments from around the coastal area of Nagan Raya power plant were considered in the numerical simulation.
3. Materials and Methods
3.1. Field Data
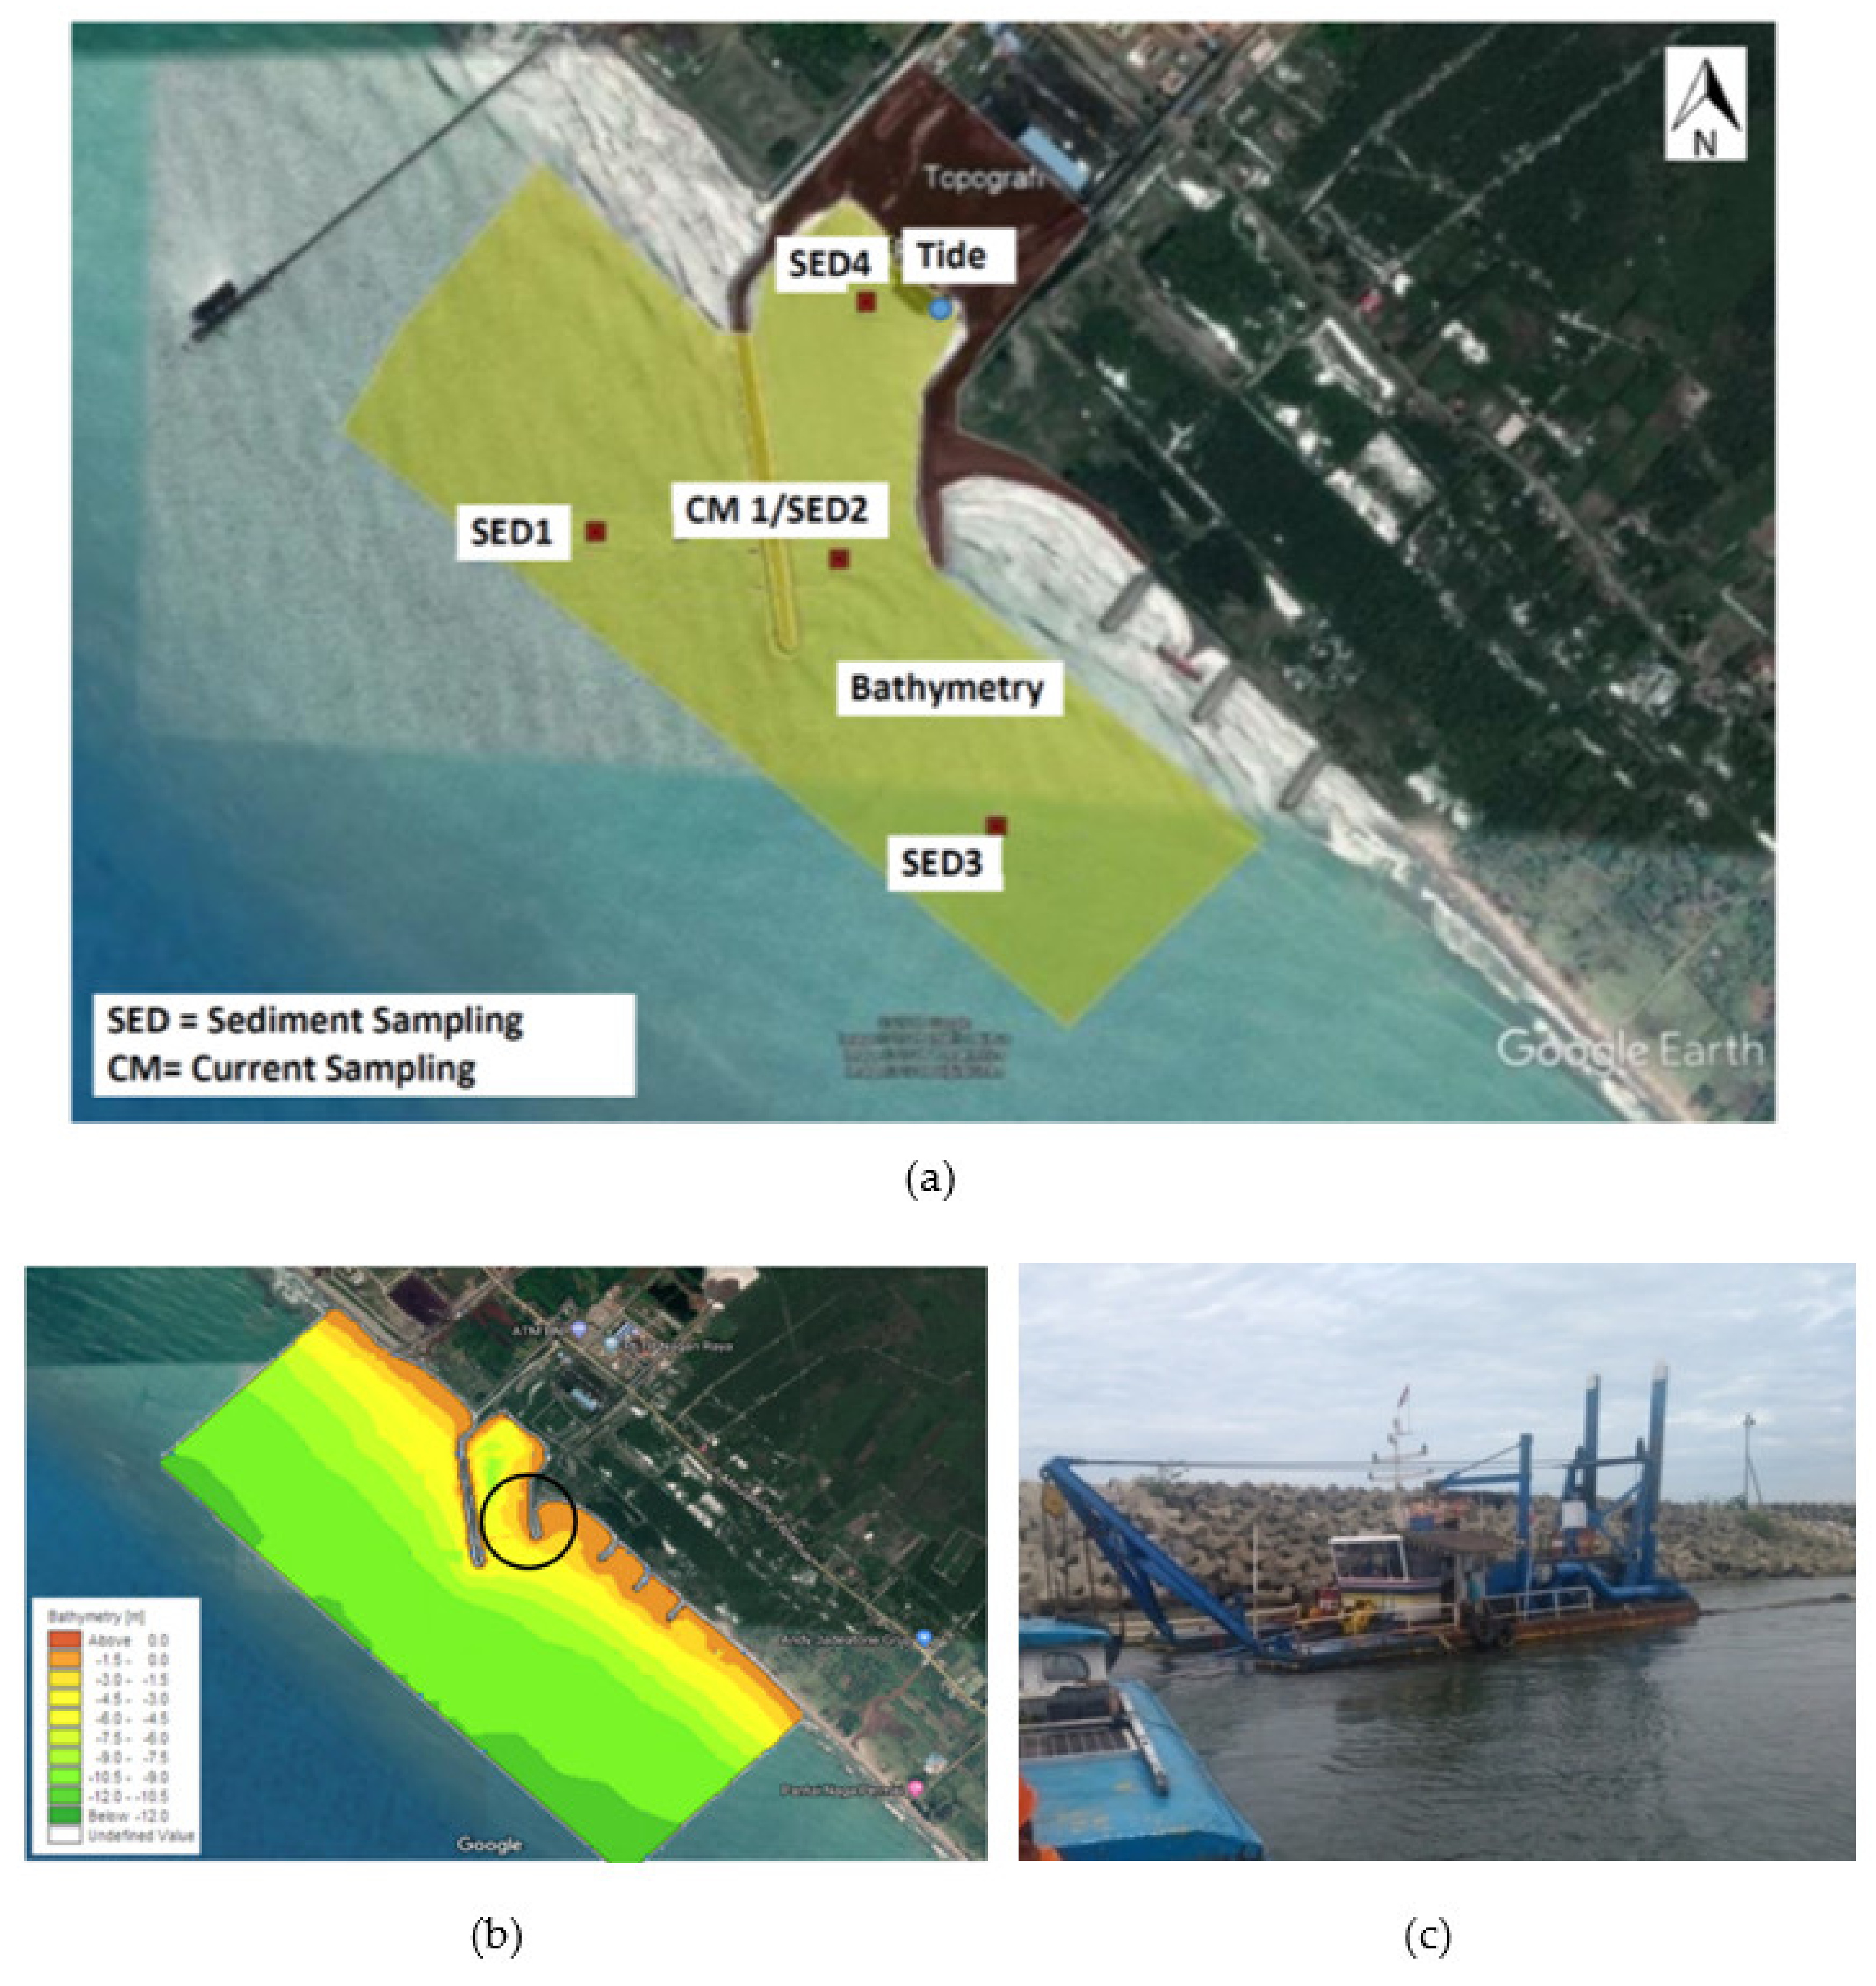
Field measurements of various parameters such as bathymetry, wave height, current speed, water level variation and sedimentation were executed in the area around Nagan Raya port. This field data was used in this study in order to achieve better knowledge of sedimentation patterns and to investigate the effects of these parameters on sediment supply in the area of interest. Previous sediment survey data were studied together with hydro-oceanographic data to develop a practical investigative plan for new sampling inside and outside of the port area. In this study, field measurements were taken in October 2018. The area of the hydrographic survey is shown in
Figure 2a.
The bathymetric map, as shown in
Figure 2b, was measured on 24–25 October 2018, with the width of the area outside of the basin under measurement being approximately 1700 m. The depth displayed on the bathymetric map below refers to the Lower Water Spring (LWS). The area with the highest sedimentation is shown by the circle in
Figure 2b.
In order to maintain the functioning of the port, routine dredging operations were performed at the port entrance on a daily basis, as seen in
Figure 2c. During daily dredging operations, more than 50,000 m
3/month of sediments were removed from the navigation channel. The port entrance was dredged to a depth of 6 m. However, this dredging operation depended on the climate conditions of the waves. This was the case because of the location of Nagan Raya port, which is located directly facing the Indian Ocean with strong winds and high wave conditions. When the wave conditions are extreme, dredging activities at the port inevitably stop until environmental conditions return to normal. However, the sedimentation process continually appears in the port. This makes dredging maintenance inefficient and expensive.
Wind data for the years 2004–2018 were obtained from wind measurement stations of the Meteorology, Climatology and Geophysics Department [
19] in 2004–2018. The wind speed and direction over Nagan Raya coast are shown in
Figure 3b below. The average wind speed was 4.28 (m/s). The winds most frequently came from the south (15.6%), south-west (27.7%) and west (18.8%).
The wave data for the area around the Nagan Raya port were analyzed from wind climate data representing 10 year periods from 2004 to 2018. The dominant direction of the incoming wave was from the southwest. The significant wave height, denoted as
Hs, was 2 m, and the typical wave period, represented by
T, was 6.3 s. The probability distribution of the wave data is shown in
Figure 3c.
In this study, current data were used for the calibration and validation of the numerical model. The current data used in this study were obtained at a depth point of 6–7 m, and represented an area located near the inlet of the port, as shown in
Figure 2a. The current measurement was surveyed at 1-h intervals using the Valeport 106 current meter. The maximum observed current speed in this station was around 0.20 m/s and occurred at a depth of 0.2D or 3.5 m below the water surface. The maximum current speed was found for the current flowing from the southwest and the south, as shown in
Figure 4.
Tidal measurement was conducted during the bathymetric measurement process as a means of correcting the sounding readings. From the tidal measurements, the typical tidal range in this area was found to be about 0.7 m. The tidal type of the Nagan Raya port area was mixed tide, with a prevailing semidiurnal pattern, and had a Formzahl value of
F = 1.05.
Table 1 provides a list of the tidal constituents calculated around the port of Nagan Raya.
Figure 2a shows the location in which bed sediment samples were taken around port basin. The results of the sediment laboratory test are shown in
Table 2 below.
Table 2 indicates that the fine sedimentary material was typically made up of sand. The data for the suspended sediment that were retrieved during the investigation conducted around port area shows typical ranges from about 40 to 150 mg/L.
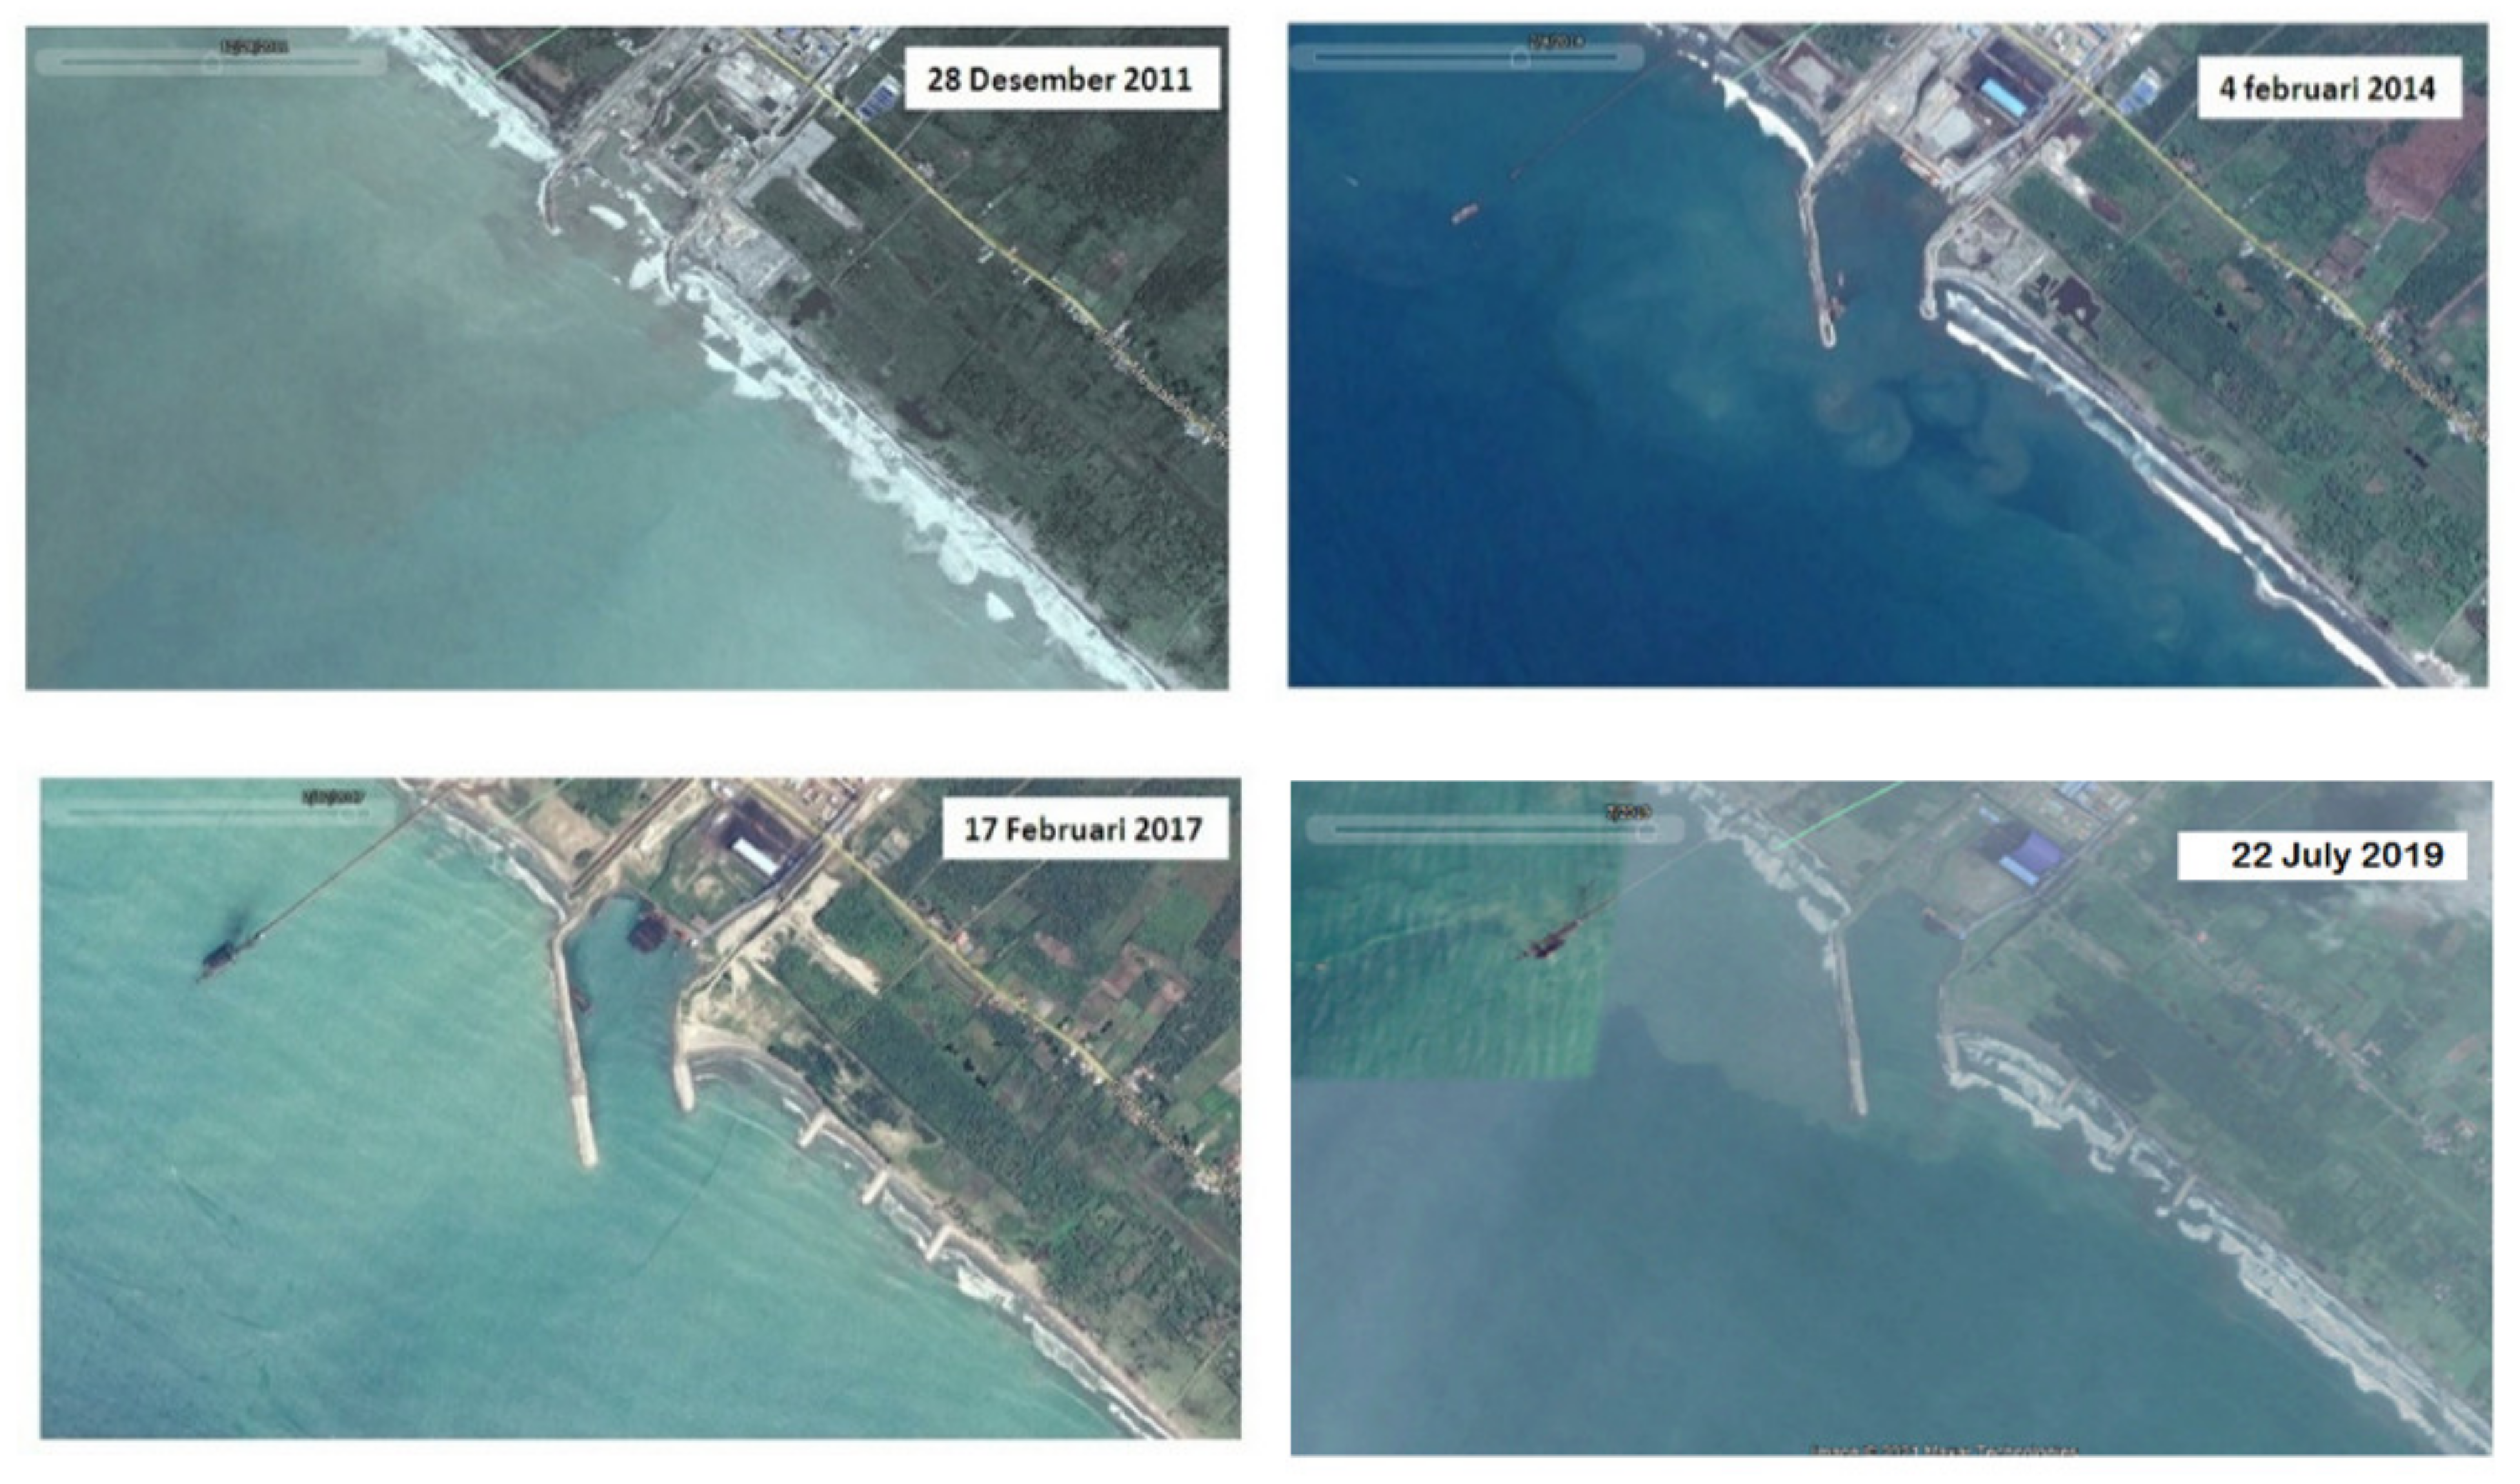
3.2. Shoreline Changes
Several steps were taken in finding a constructive sedimentation solution for Nagan Raya Port. These included an investigation of historical sedimentation data, which can provide a good conception of the coastal processes that occur and how they affect the study area and the locations that surround it. Historical satellite images were used to manually extract the shoreline locations from 2011 to 2017 using Google Earth, as shown in
Figure 5 below. The aim of this historical study was to evaluate and simulate the effect of the breakwater structure in terms of coastline changes.
In this study, a new shoreline simulation model (ShorelineS), proposed by Roelvink et al. (2018, 2020) [
20,
21], was used for predicting the evolution of the coastline over 7 year periods. The basic equation for this ShorelineS model is based on sediment conservation, details about which are provided in Roelvink et al. (2020) [
21].
For the setup of the ShorelineS model, the initial shoreline in 2011 and the structure of the breakwater were applied as land boundaries. The total length of the coastline was 9.25 km. An initial grid size of 5 m and the CERC1 formula derived from USACE (1984) [
22] were applied with a closure depth of 10 m. The total simulation time was 10 years. A mean wave direction of southwest, with +/− 15 degrees of variation, was applied, with an average wave height of 1.7 m and a peak wave period of 6.3 s. The results of the coastline change simulation are shown in
Figure 6.
To obtain an idea of the effects of sediment transport on the shoreline due to waves, it was necessary to analyze the rate of sediment transport. The flow rate of sedimentation along a coast depends on the angle of incidence of the waves, as well as the duration and energy of the waves. Thus, large waves will carry more material per unit of time when driven by small waves. Sediment transport analysis was carried out to determine the flow rate of sedimentation along the coast using the CERC method. The formula of the CERC method [
22] can be expressed as follows:
where
Qs is sediment transport along the coast (m
3/day).
P1 is a component of the wave energy flux at break (Nm/s/m).
ρ is a sea water mass of 1025 kg/m
3.
Hb is height of the breaking wave (m).
Cb is the broken wave propagation (m/s).
ab represents the angles of the breaking waves.
n is a constant of 1.29.
g is a gravity acceleration of 9.81 m/s
2. The results indicate that the rate of longshore sediment transport was 58,576 m
3/month.
Calculation of the sedimentation flow rate was also carried out using sounding bathymetric data by overlaying bathymetric data at different times. This analysis used bathymetric measurement data collected in July 2018 (
Figure 7a) and August 2018 (
Figure 7b). Through the calculation of the overlay volume, it was found that the total net volume was 40,194 m3 (
Figure 7c). Thus, it can be seen that the sediment transport rate in July 2018–August 2014 was 40,194 m
3/month, as shown in
Figure 7c. The calculation result obtained using the CERC formula was greater than the overlaid bathymetry result, which was the case because the incoming wave used in the analysis was that of only one direction, namely from the southwest direction.
4. Delft 3D Model
In this study, the Delft3D process-based modeling system was used to simulate the sedimentation pattern around the Nagan Raya port area. The Delft3D model is a useful tool in the development of effective sedimentation solutions. In addition, the Delft3D software package has several different modules. This model capable of simulating aspects of waves, currents, sediment transport, morphological developments and water quality in coastal and ocean areas [
23]. The Delft3D-Flow model [
24,
25,
26], through the use of the third-generation Simulating Waves Nearshore Model (SWAN) [
27,
28,
29,
30], and the Delft3D-Wave module are both used to simulate the transformation of short waves. Details regarding the equations used in, and the practical use of, the Delft3D modeling system can be found in the DELFT3D user manuals [
24,
27]. The Delft3D model, and the Delft3D-Flow [
24,
25] and Delft3D-Wave modules [
27,
28], were applied in this study.
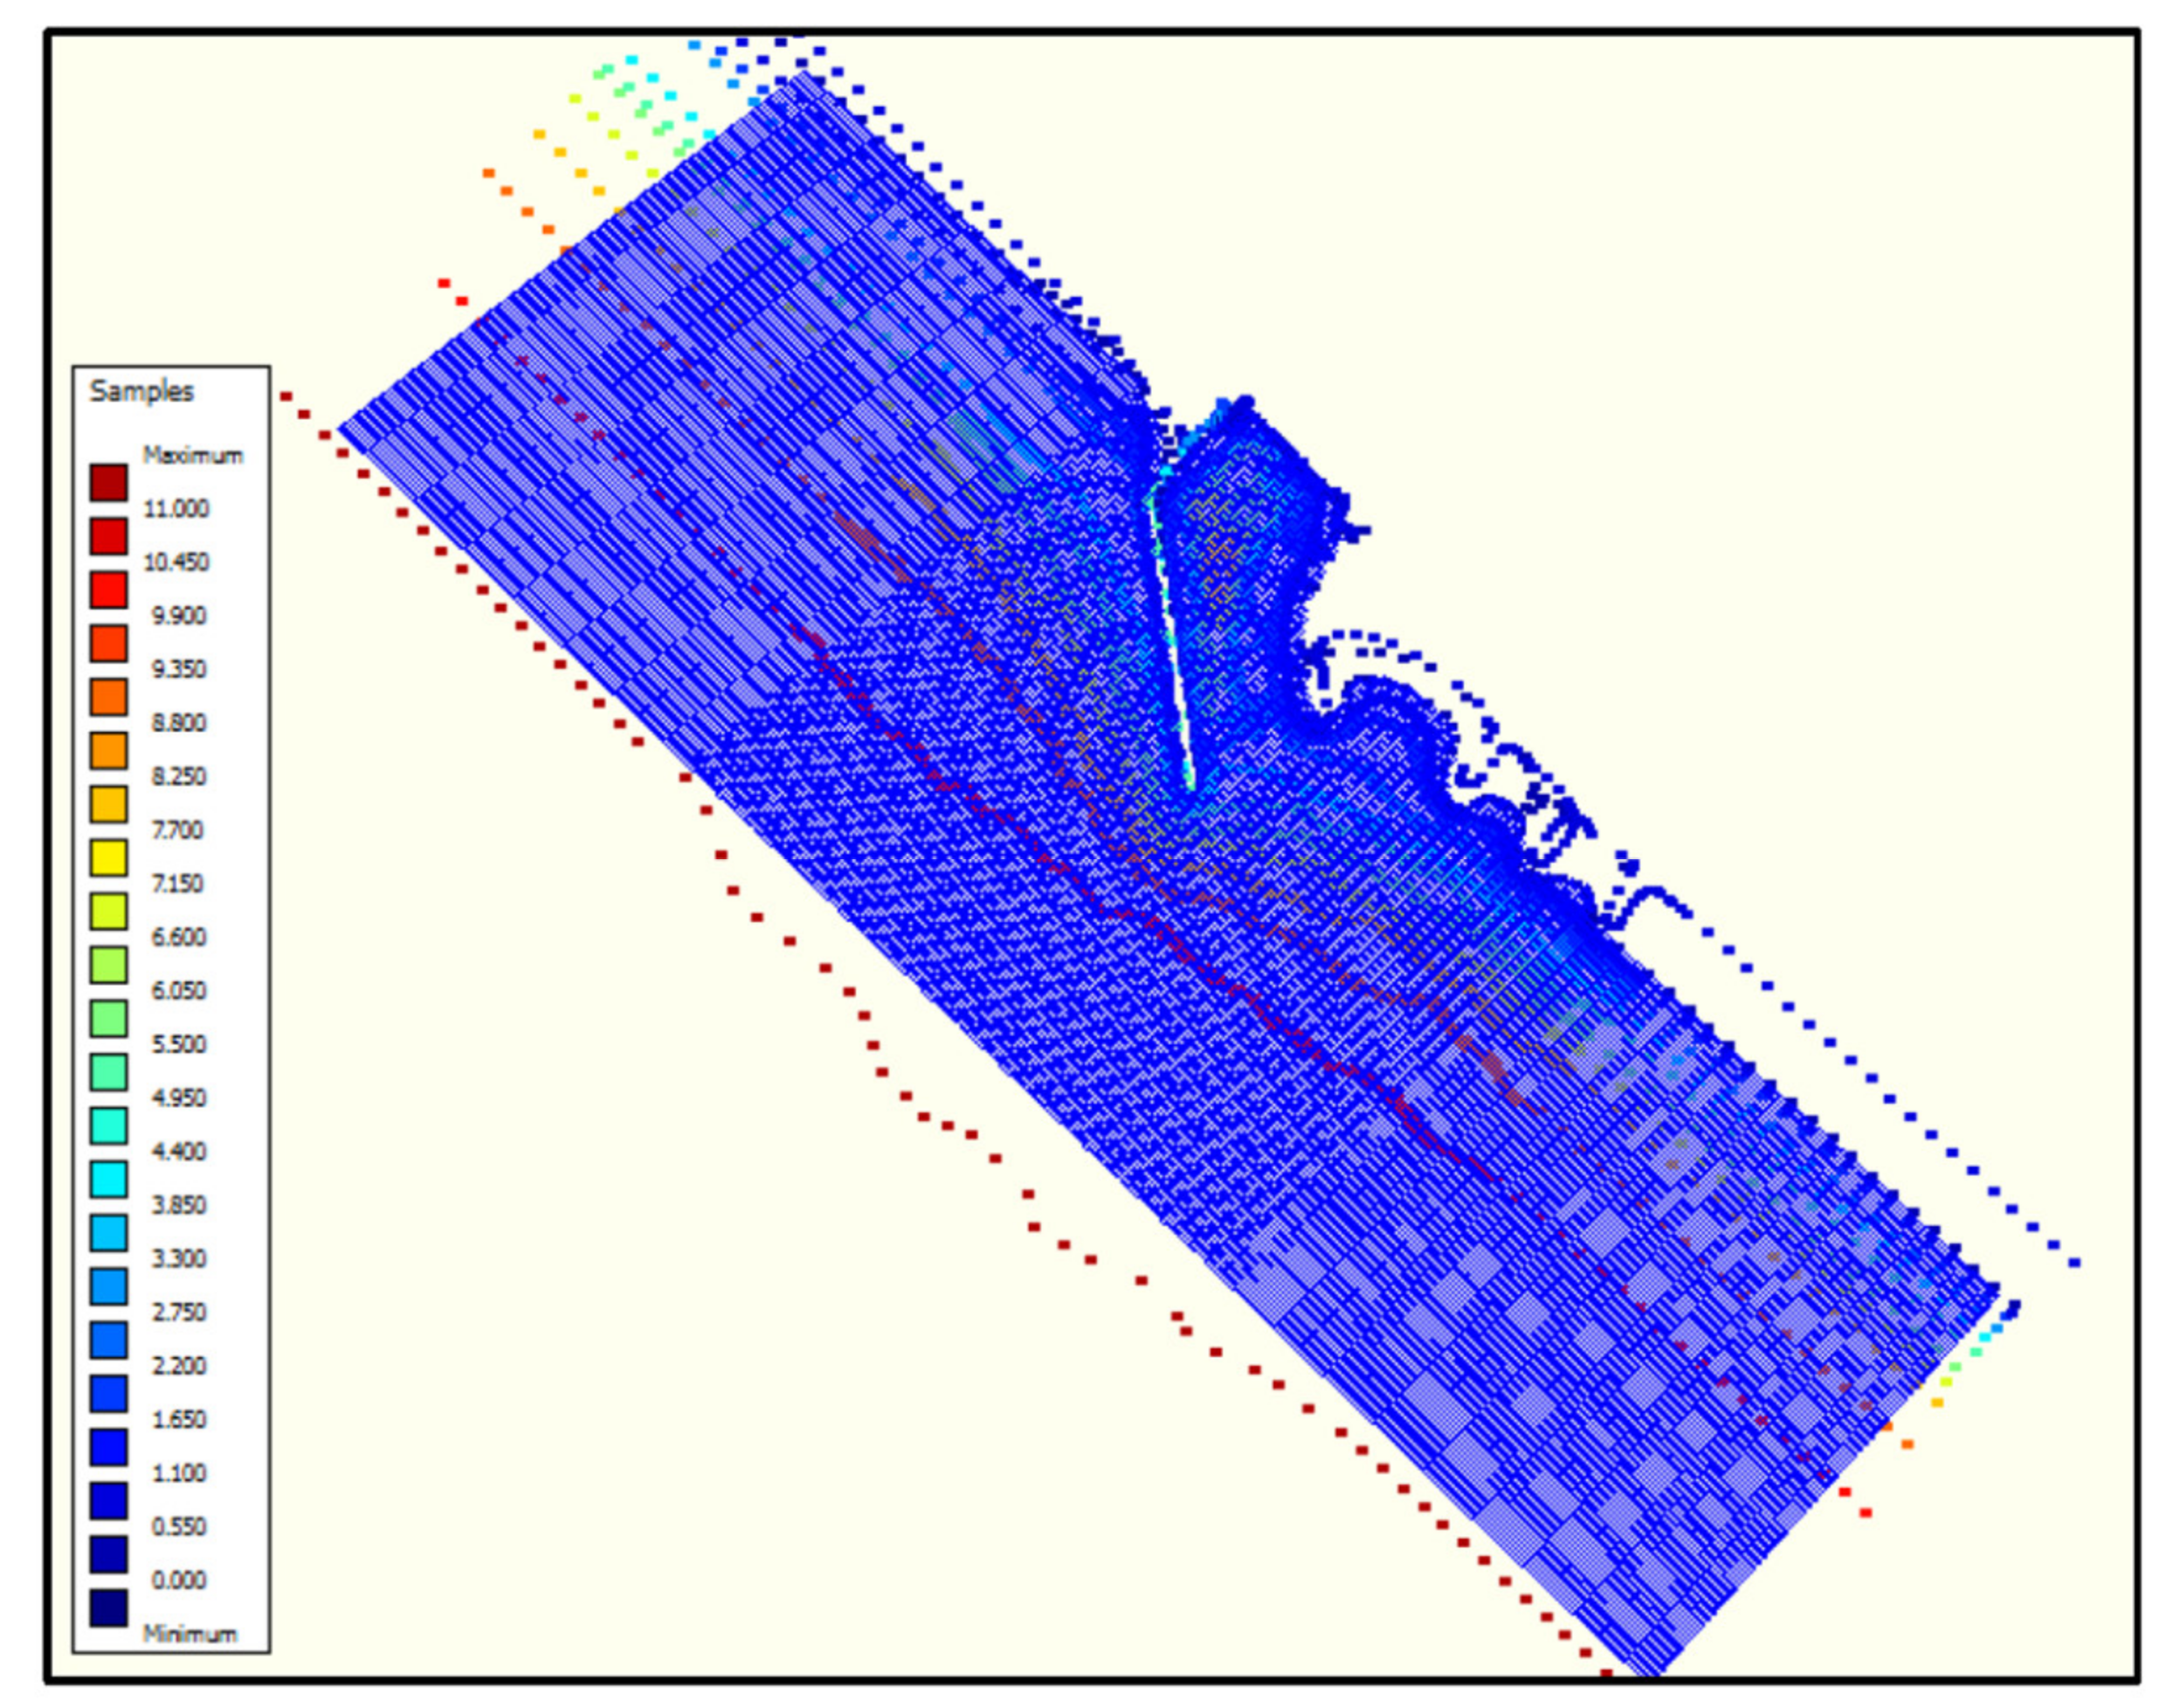
The grid system for domain computation in the Delft3D system is shown in
Figure 8. The application of the bathymetry model and the measurement of land boundaries were mainly based on field measurement data obtained during the study. In this study, curvilinear grids were used in the computational domain with different resolutions. The grid sizes resolution varied from 10 to 500 m, with the coarser grid at the offshore boundary (100–500 m) and a finer resolution inside the port (10–50 m). In total, three open boundaries were used in the domain: the water level in the southern area and the Neumann boundary in the eastern and western areas, as shown in
Figure 9.
After the initial setup of the model, the next step was to calibrate and validate the results of model with observed data. This stage was useful for evaluating the performance of the model by adjusting the model-free parameters, and thus, establishing whether the existing modeling data were accurate enough to be used at a later stage. In the flow model, model parameters such as the bed roughness coefficient and the eddy viscosity should be optimally adjusted to produce model results that are as similar as possible to the actual measured values. In addition, improvements in the size of the computational grid can also affect the accuracy of the results of the model [
31,
32,
33]
In this study, water level gauge measurement was used for calibration of the model, as presented in
Figure 10. The calibrated water level data showed a close relation and a good agreement between the observed and simulated water level, as presented in
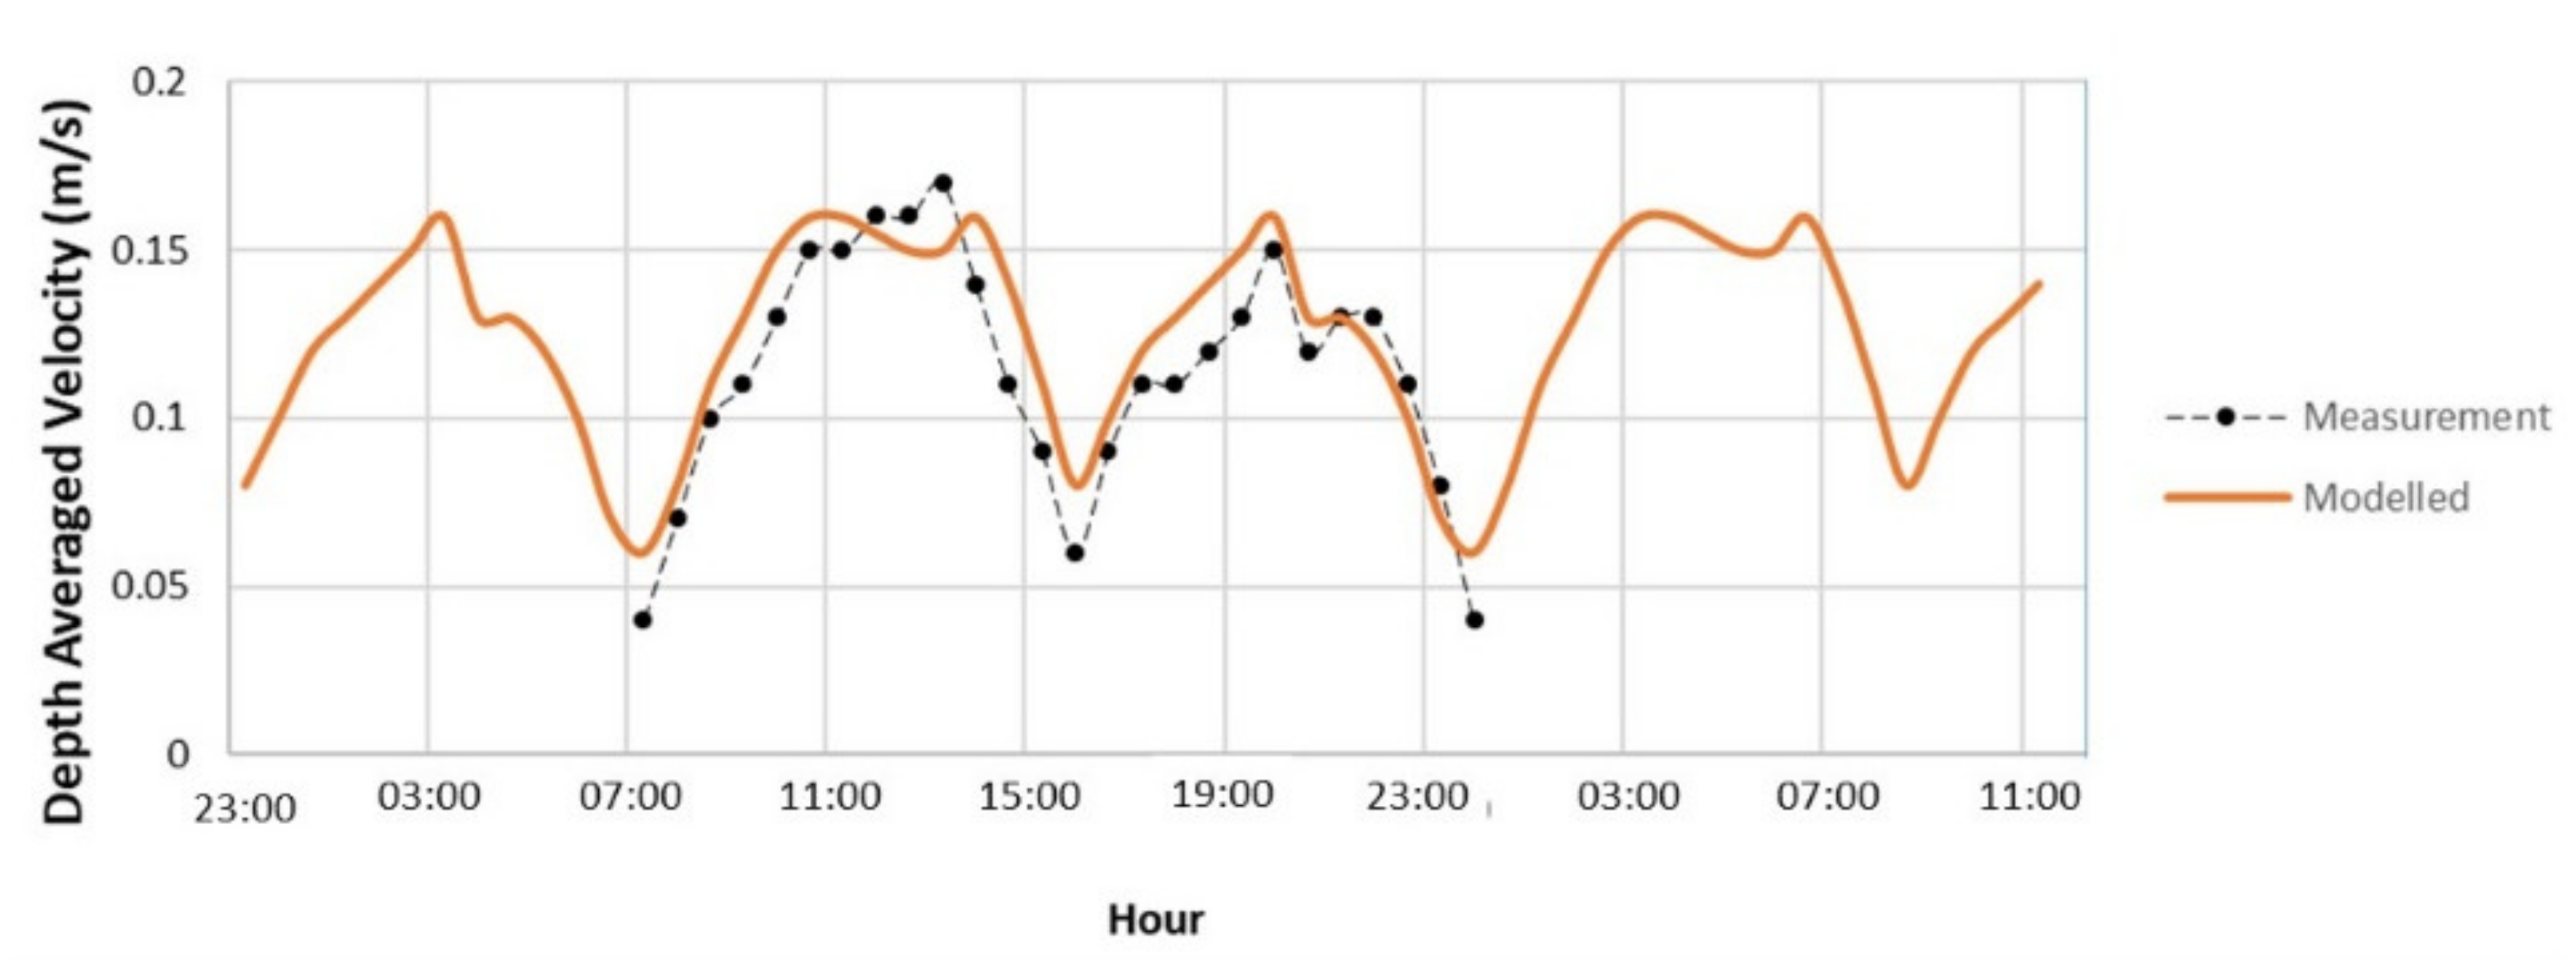
Figure 10. After calibration, the model was validated by the comparing simulated and observed current velocity data, as shown in
Figure 11. The simulation results for the current velocity generally had the same pattern and were quite close to the values obtained via measurement. The RMSE (root mean square error) statistical parameter between the simulated and observed current velocity was 0.0003. Thus, the model performance was considered to be good enough and it was determined that the model could be used for the purposes of this study.
The final input parameters used for the Delft3D model simulation are shown in
Table 3 and
Table 4 below. In this model, modeling was conducted for a 1-month simulation period.
5. Results and Discussion
The results obtained using the sediment transport model are shown in
Figure 12. Based on the sedimentation modelling results for the port basin, as shown in
Figure 12, it was found that around the mouth of the basin area, the sedimentation occurred at levels as high as 0.8–1 m. This is supported by the bathymetric measurement data in this area; around the coastline at the near side of the breakwater, there was sedimentation as high as 1.4–1.6 m. In addition, it was found that the sedimentation rate at the harbor basin was around 38,346 m
3/month. This value was found to be slightly underestimated based on the averaged dredged volumes that were obtained via bathymetric measurement. The choice of different parameters used in the sediment transport model might have been the cause of this result. Furthermore, it is possible that errors occurred during the bathymetric measurement process.
In addition to the above modeling results, the dredging and dumping activities could be simulated in Delft3D software package. To evaluate the impacts of sedimentation on the adjacent port area, 1-month morphology change simulations were conducted for the dredging scenario of the navigation channel using the dredging and dumping utility in Delft3D [
24]. During simulation, the characteristics of the dredging and dumping activities that occurred were saved in a dredge and dump file. A detailed description of the dredging and dumping features in this model can be found in the Delft3D-Flow user manual [
24].
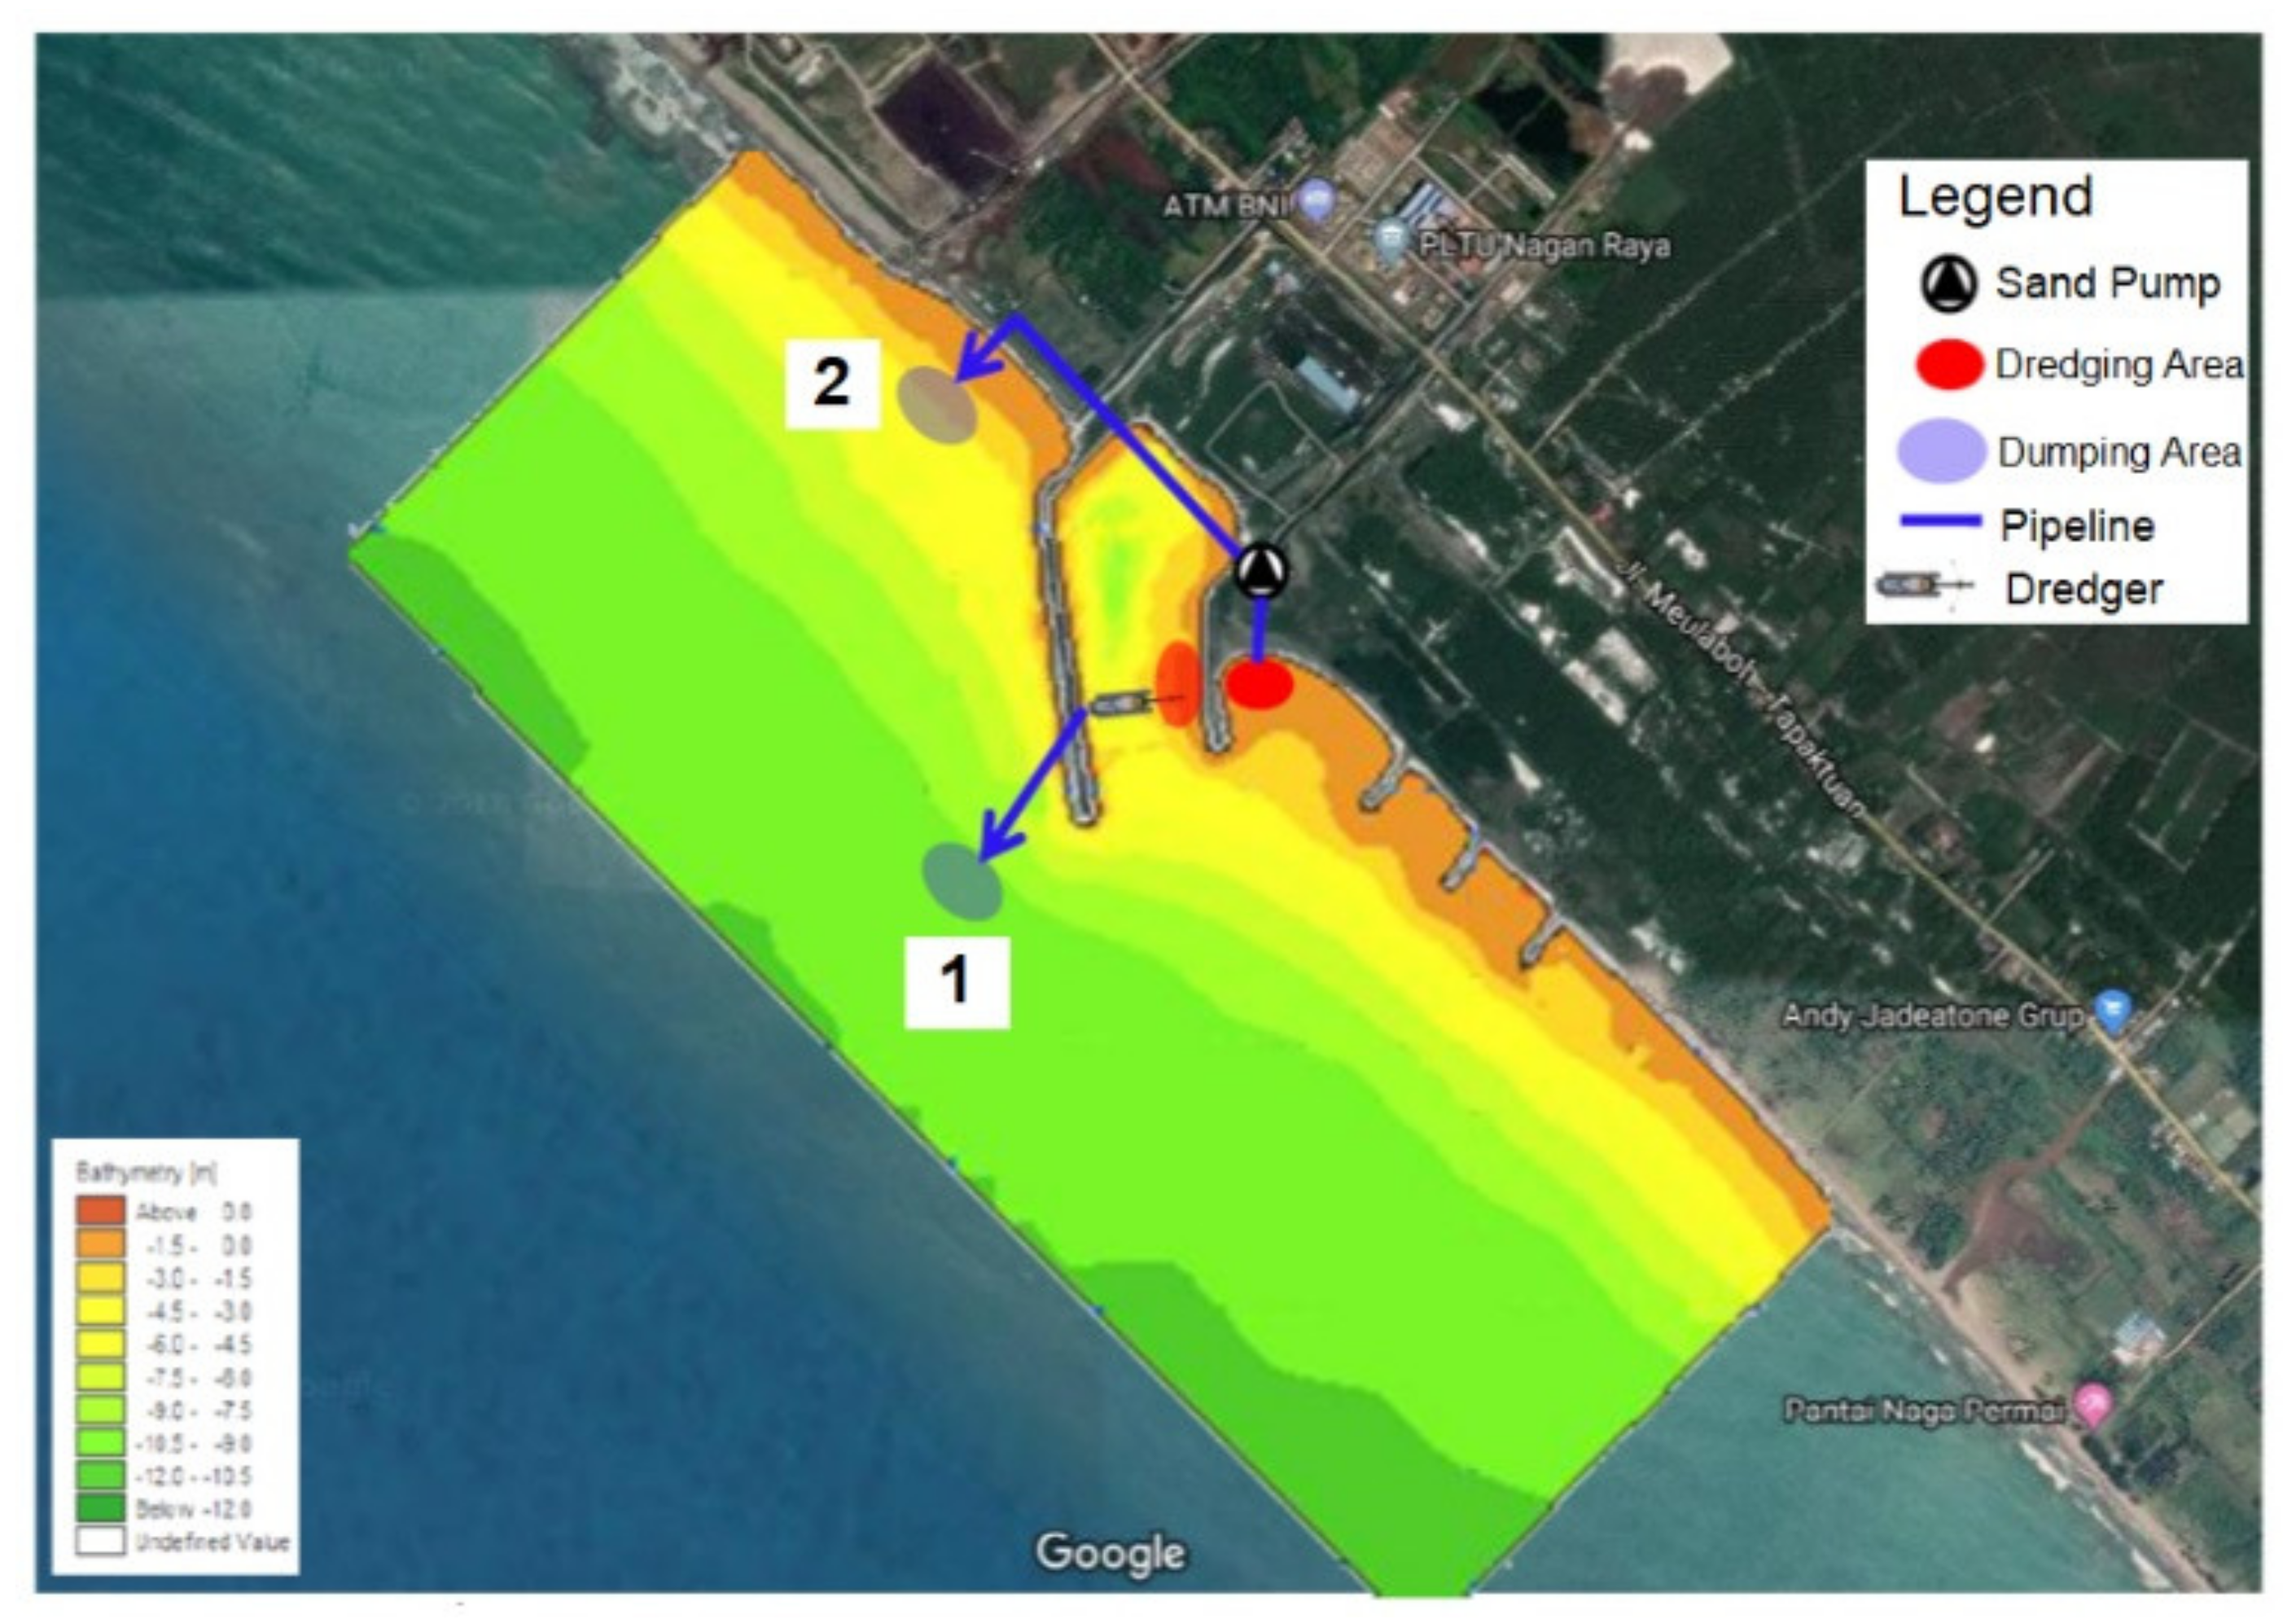
In this study, two dredging activity scenarios were applied using the Dredge and Dump feature of Delft3D. The volume of sediment was automatically removed from one area in the bathymetry model and dumped into the dump area. For the first scenario, the dredged material was dumped in Location 1 in the offshore area. For the second scenario, the dredged sediment was dumped in Location 2 in the near side of the breakwater, as shown in
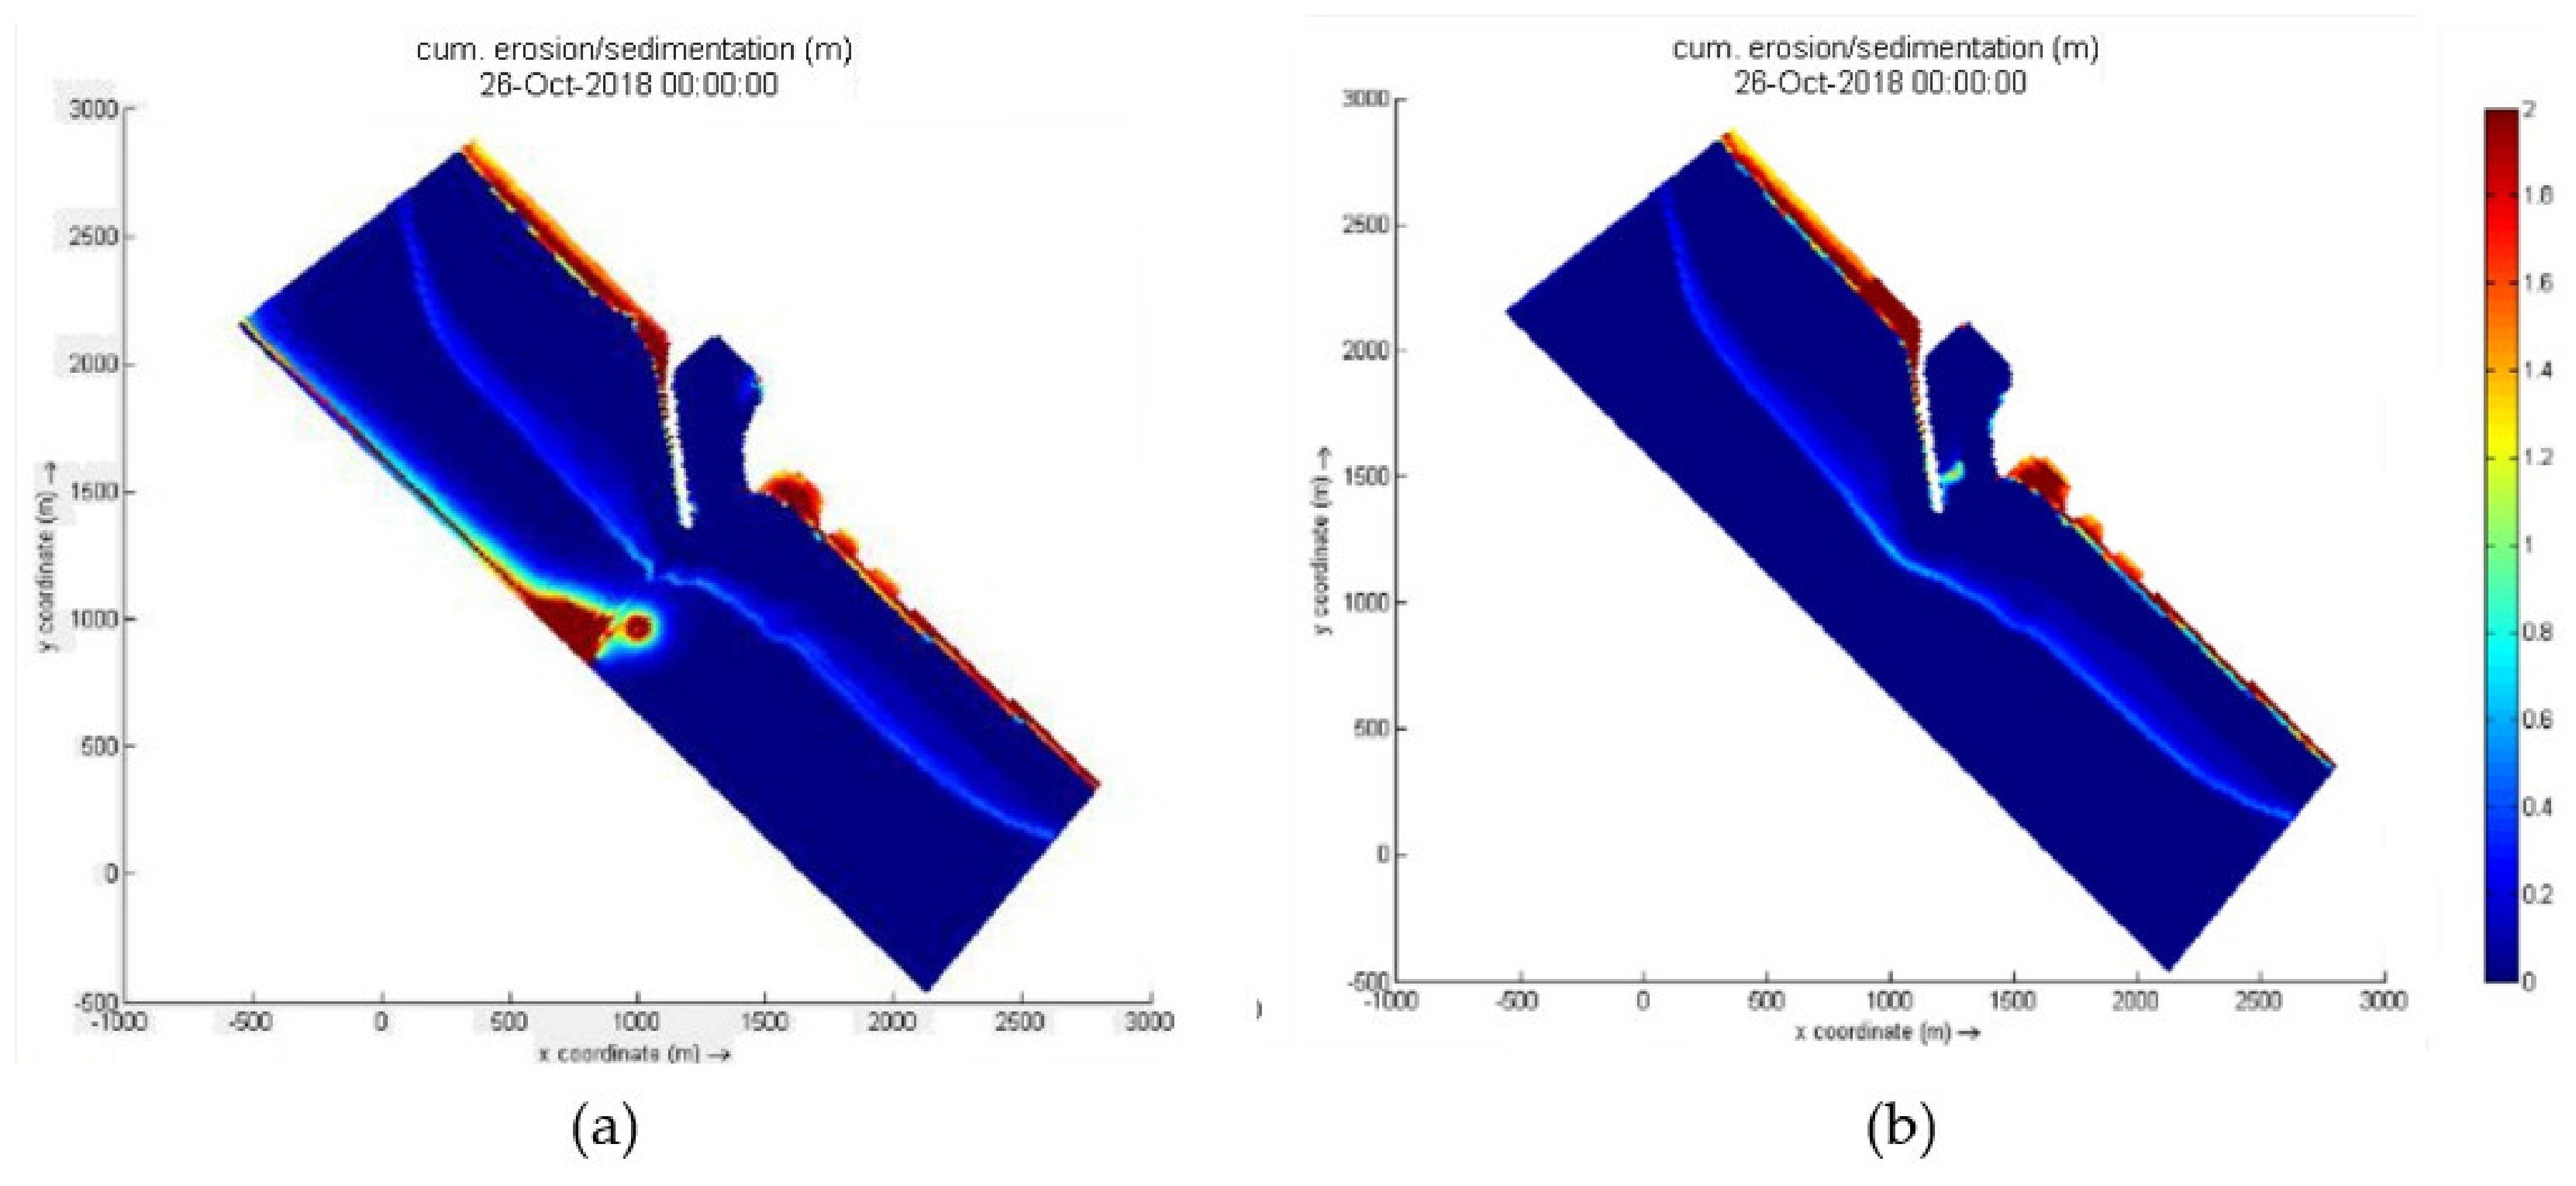
Figure 13. In this modeling system, it was assumed that the sedimentation was dredged and maintained at a 6 m depth as a threshold water depth. This approach was adapted for coal barges that often pass through the basin area of the Nagan Raya port. The results of the dredging and dumping modeling process are presented in
Figure 14 below:
For scenario 1 (first), the dumping point was located at a depth of 11 m and the distance from the coastline was about 1.5 km. The dredged material was sucked up by the dredger and channeled through the pipe to the shelter barge. The fully loaded barge was pulled by a tugboat, at a speed of 3 knots, to the dredge disposal area (scenario 1), as shown in
Figure 14a. Based on the modeling results for scenario 1, the dredged material that had been disposed of in the dumping area did not return to the mouth of the basin area.
In contrast, for scenario 2, after the removal of the dredge material to Location 2 in the north part of the breakwater side, there was still sedimentation in the mouth area of the basin, as shown in
Figure 14b.
Figure 14b shows the potential locations of the dredged material that was dumped back into the mouth of the basin area. Based on the above results, Area 1, located in the offshore area, was proposed as the best dumping area location. In addition to complying with government regulations, the proposed disposal area must also reach a further 20 miles seaward from the shoreline, or a minimum depth of 20 m.
6. Conclusions
The port of 2 × 110 MW Nagan Raya Coal Fired Steam Power Plant is a facility in Aceh Province, Indonesia, which was constructed by the State Electricity Company. During its operation, which began in 2013, the port has dealt with large amounts of sedimentation within the port and ship entrances. The existing breakwater construction has not been maximally effective in protecting the port basin from sedimentation. In addition, the breakwater structure and some groins have also been extended to minimize this problem. However, an enormous amount of material sediment is still dredged from the mouth of navigation channels in order to maintain port operations.
Evaluation of the wind data showed that the dominant wind direction was from south to west. Based on the analysis of the wave data, it is known that the dominant wave direction was from the south to the west. Therefore, wave-induced currents in the surf zone were from south to north. Based on the analysis of longshore sediment transport, the supply of sediment to Nagan Raya port was estimated to be around 40,000–60,000 m3 per year. The large estimated amount of sediment transport along the coast of the port was based on wave direction from the south to the west.
Results obtained from the sediment model showed that sedimentation of up to 1 m was captured in areas of the ship entrance of Nagan Raya port. The sand bypassing system is one of the sedimentation management solutions that was proposed in this study. The dredged sediment material located around the ship entrance was dumped in a dumping area, located in the middle of the sea, at a depth of 11 m, with a distance of 1.5 km from the shoreline. To obtain a greater maximum result, the material disposal distance should be further away, at a depth of at least 20 m or a distance of 20 miles from the coastline. The proposed solution could reduce operating costs since the dredging operations will be localized to one specific area.
Author Contributions
Conceptualization, M.Z.; methodology, M.Z. and K.S.; validation, S.S.; writing—original draft preparation, M.Z. and S.S.; writing—review and editing, M.Z.; visualization, M.Z. and K.S. All authors have read and agreed to the published version of the manuscript.
Funding
The authors gratefully acknowledge the financial support received from the Institut Teknologi Sepuluh Nopember for this work, under project scheme of the Publication Writing and IPR Incentive Program (PPHKI).
Conflicts of Interest
The authors declare no conflict of interest and the funders had no role in the design of the study; in the collection, analyses, or interpretation of data; in the writing of the manuscript, or in the decision to publish the results.
References
- PT. Horas Bangun Persada. Kajian Laju Sedimentasi Pada Kolam Pelabuhan PLTU 2 × 110 MW Nagan Raya; PT PLN (Persero): Jakarta, Indonesia, 2013. [Google Scholar]
- Zhong-hua, T.; Hai-cheng, L.; Feng, G. Experimental Research on Reduction Measures of Sediment Deposition of the Power Plant Port under the Long Period Wave. Procedia Eng. 2015, 116, 229–236. [Google Scholar] [CrossRef]
- Tianjin Research Institute. Nagan Raya 2 × 110 MW Coal-Fired Power Plant, Indonesia; Wave-Sediment Physical Model Test Report; Water Transport Engineering of Transport Ministry: Tianjin, China, 2015. [Google Scholar]
- Parchure, T.M.; Teeter, A.M. Potential Methods of Reducing Shoaling in Harbors and Navigation Channels; HETN-XIV-6; Engineer Research and Development Center: Vicksburg, MS, USA, 2002. [Google Scholar]
- Salman, A.; Lombardo, S.; Doody, P. Living with Coastal Erosion in Europe: Sediment and Space for Sustainability. 2004. Report Commissioned by the European Commission. Available online: http://www.eurosion.org/reports-online/part4.pdf (accessed on 13 July 2021).
- Gardner, W.D. Sediment trap dynamics and calibration: A laboratory evaluation. J. Mar. Res. 1980, 38, 17–39. [Google Scholar]
- Botwe, B.O.; Abril, J.M.; Schirone, A.; Barsanti, M.; Delbono, I.; Delfanti, R.; Nyarko, E.; Lens, P.N.L. Settling fluxes and sediment accumulation rates by the combined use of sediment traps and sediment cores in Tema Harbour (Ghana). Sci. Total Environ. 2017, 609, 1114–1125. [Google Scholar] [CrossRef] [PubMed]
- Hofland, B.; Christiansen, H.; Crowder, R.A.; Kirby, R.; van Leeuwen, C.W.; Winterwerp, J.C. The current deflecting wall in an estuarine harbor. In Proceedings of the XXIV IAHR Congress, Beijing, China, 16–21 September 2001. [Google Scholar]
- Van Kessel, T.; Cornelisse, J.M. Physical Scale Model Zeeschelde; Delft Hydraulics, Report Z2516; WL Delft Hydraulics: Delft, The Netherlands, 2003. [Google Scholar]
- Juez, C.; Bühlmann, I.; Maechler, G.; Schleiss, A.J.; Franca, M.J. Transport of suspended sediments under the influence of bank macro-roughness. Earth Surf. Process. Landf. 2018, 43, 271–284. [Google Scholar] [CrossRef]
- Weisman, R.N.; Lennon, G.P.; Clausner, J.E. A Guide to the Planning and Hydraulic Design of Fluidizer Systems for Sand Management in the Coastal Environment; Dredging Research Program; US Army Corps of Engineers: Washington, DC, USA, 1996; Technical Report No. DRP-96-3. [Google Scholar]
- Jones, C.P.; Mehta, A.J. Inlet sand bypassing systems in Florida. Shore Beach 1980, 36, 27–30. [Google Scholar]
- Ware, D. Tweed River Entrance Sand Bypass Project; Case Study for Coast Adapt; National Climate Change Adaptation Research Facility: Gold Coast, Australia, 2016. [Google Scholar]
- Mendes, D.S.; Fortunato, A.B.; Pires-Silva, A.A. Assessment of three dredging plans for a wave-dominated inlet. Proc. Inst. Civil Eng. Mar. Eng. 2016, 169, 64–75. [Google Scholar] [CrossRef][Green Version]
- Reyes-Merlo, M.A.; Ortega-Sánchez, M.; Díez-Minguito, M.; Losada, M.A. Efficient dredging strategy in a tidal inlet based on an energetic approach. Ocean Coast. Manag. 2017, 146, 157–169. [Google Scholar] [CrossRef]
- Shaeri, S.; Tomlinson, R.; Etemad-Shahidi, A.; Strauss, D. Numerical modelling to assess maintenance strategy management options for a small tidal inlet. Estuar. Coast. Shelf Sci. 2017, 187, 273–292. [Google Scholar] [CrossRef]
- Fernández-Fernández, S.; Ferreira, C.C.; Silva, P.A.; Baptista, P.; Romão, S.; Fontán-Bouzas, Á.; Abreu, T.; Bertin, X. Assessment of Dredging Scenarios for a Tidal Inlet in a High-Energy Coast. J. Mar. Sci. Eng. 2019, 7, 395. [Google Scholar] [CrossRef]
- Google Earth. Map Showing Location of Nagan Raya Power Plant. Available online: https://earth.google.com (accessed on 6 August 2021).
- BMKG. Climatology Data on Nagan Raya. Available online: https://dataonline.bmkg.go.id (accessed on 15 December 2019).
- Roelvink, D.; Huisman, B.; Elghandour, A. Efficient modelling of complex coastal evolution at monthly to century time scales. In Proceedings of the Sixth International Conference on Estuaries and Coasts (ICEC-2018), Caen, France, 20–23 August 2018. [Google Scholar]
- Roelvink, D.; Huisman, B.; Elghandour, A.; Ghonim, M.; Reyns, J. Efficient Modeling of Complex Sandy Coastal Evolution at Monthly to Century Time Scales. Front. Mar. Sci. 2020, 7, 535. [Google Scholar] [CrossRef]
- USACE. Shore Protection Manual; US Army Coastal Engineering Research Center: Washington, DC, USA, 1984; Volume 1. [Google Scholar]
- Roelvink, J.A.; Van Banning, G.K.F.M. Design and development of Delft3D and application to coastal morphodynamics. In Proceedings of the Hydroinformatics ’94 Conference, Delft, The Netherlands, 19–23 September 1994. [Google Scholar]
- Deltares. Delft3D-Flow User Manual; Version 3.14, Revision 12556; Deltares: Delft, The Netherlands, 2010. [Google Scholar]
- Lesser, G.R.; Roelvink, J.A.; van Kester, J.A.T.M.; Stelling, G.S. Development and validation of a three-dimensional morphological model. Coast. Eng. 2014, 51, 883–915. [Google Scholar] [CrossRef]
- Lesser, G.R. An Approach to Medium-Term Coastal Morphological DeltaresModeling. Ph.D. Thesis, UNESCO-IHE & Delft University of Technology, Delft, The Netherlands, 2009. [Google Scholar]
- Deltares. Delft3D-Wave User Manual; Version 3.04, Revision 11114; Deltares: Delft, The Netherlands, 2010. [Google Scholar]
- Booij, N.; Ris, R.C.; Holthuijsen, L.H. A third-generation wave model for coastal regions. Part 1: Model description and validation. J. Geophys. Res. 1999, 104, 7649–7666. [Google Scholar] [CrossRef]
- Holthuisjen, L.H. Waves in Oceanic and Coastal Waters; Cambridge University Pres: Cambridge, UK, 2007. [Google Scholar]
- Van der Westhuysen, A.J. Modelling nearshore wave processes. In Proceedings of the ECMWF Workshop on Ocean Waves, Reading, UK, 25–27 June 2012. [Google Scholar]
- Pu, J.H. Conceptual Hydrodynamic-Thermal Mapping Modelling for Coral Reefs at South Singapore Sea. Appl. Ocean. Res. 2016, 55, 59–65. [Google Scholar] [CrossRef]
- Jahid Hasan, G.M.; van Maren, D.S.; Cheong, H.F. Improving hydrodynamic modeling of an estuary in a mixed tidal regime by grid refining and aligning. Ocean. Dyn. 2012, 62, 395–409. [Google Scholar] [CrossRef]
- Pu, J.; Huang, Y.; Shao, S.; Hussain, K. Three-Gorges Dam Fine Sediment Pollutant Transport: Turbulence SPH Model Simulation of Multi-Fluid Flows. J. Appl. Fluid Mech 2016, 9, 1–10. [Google Scholar] [CrossRef]
| Publisher’s Note: MDPI stays neutral with regard to jurisdictional claims in published maps and institutional affiliations. |
© 2021 by the authors. Licensee MDPI, Basel, Switzerland. This article is an open access article distributed under the terms and conditions of the Creative Commons Attribution (CC BY) license (https://creativecommons.org/licenses/by/4.0/).


