Abstract
Recent advances in experimental techniques for visualizing cloud behavior, pit formation, and erosion in cavitating jets have been reviewed. To characterize the erosion behavior of cavitating jets and clarify their erosion mechanisms, various experimental techniques—such as high-speed imaging, frame difference method, proper orthogonal decomposition (POD) analysis, pit sensors, polyvinylidene fluoride (PVDF) sensors, laser schlieren imaging, and cross schlieren imaging—have been developed. Experimental results demonstrated that the erosion mechanism of cavitating jets is highly correlated with periodic cloud behaviors, including the growth, shrinkage, and collapse, which generate impulsive pressure on the wall material. This pressure initiates random pits on the wall surface and is associated with the generation of microjets caused by the reentrant-jet mechanism during cloud collapse near the wall. Several shockwaves were generated at peak impulsive pressures when the cavitation cloud collapsed, and a microjet was formed. Some of these experimental findings were successfully reproduced in recent numerical studies; however, further numerical modeling of erosion behavior in cavitating jets is still needed. Furthermore, the behavior of cavitating jets on rough walls requires future study, as the erosion rate is significantly higher than that on smooth walls.
1. Introduction
When the local pressure of a liquid decreases below the saturated vapor pressure, a cavitation bubble is generated in the liquid, which grows into a large bubble with a diameter of a few millimeters. Subsequently, the bubble size starts decreasing owing to the influence of the increased local pressure in the liquid, resulting in bubble collapse and the generation of high impulsive pressure that damages the wall material. During bubble collapse near a wall, high impulsive pressure is generated by the reentrant-jet motion caused by bubble deformation, which produces a high-speed microjet directed toward the wall. The impact velocity of the microjet on the wall is sufficiently high generating shockwaves, which forms the primary erosion mechanism of cavitation, resulting in pit formation and erosion of the wall material [1,2,3,4,5,6].
This cavitation phenomenon occurs in low-pressure regions on operating propellers of hydraulic machinery, such as pumps, hydraulic turbines, and Venturi geometries, when the local pressure falls below the vapor pressure of the liquid. Therefore, cavitation is often considered an unfavorable phenomenon in the operation of fluid machinery due to erosion effects; however, it has several favorable applications in engineering, such as the peening, cutting, and surface cleaning of metals. Furthermore, this phenomenon is leveraged in several medical and environmental applications, such as ultrasound scalpels, surgical instruments, breakdown of pollutants in water purification systems, emulsification of tissue in cataract surgery, and removal of kidney stones.
The occurrence of cavitation is typically defined by the cavitation number, which is given by the following equation:
where Pa is the ambient pressure, Pv is the saturated vapor pressure, V is the flow velocity, and ρ is the fluid density.
When the cavitation number σ is large (large ambient pressure or small flow velocity), there will be no cavitation produced. By increasing flow velocity and decreasing ambient pressure, the cavitation number is reduced, and when it drops down to a critical value, cavitation bubbles will appear in the liquid flow. Further reduction in the cavitation number will affect the intensity of cavitation, and cavitation erosion will be intensified.
When the cavitation occurs in the liquid near the wall, the bubble collapse and pit formation are produced on metal materials [1,2,3,4,5,6]. Impulsive pressure can be generated on the wall when a bubble collapses near it. Thus, the relationship between cavitation bubble behavior and impulsive pressure has been an important research topic and has been studied theoretically and numerically to evaluate cavitation damage of materials, as summarized by Sreedhar et al. [6].
Theoretical analysis of cavitation bubbles was initiated by Rayleigh [7] and subsequently improved by Plesset [8], who considered the symmetrical collapse of a spherical cavitation bubble in an incompressible liquid. Later, the influence of the compressibility of the liquid was considered to formulate impulsive pressure because it is influential in the final stage of cavitation bubble collapse [9]. Subsequently, more detailed numerical studies on cavitation bubble collapse and impulsive pressure were conducted and compared with experimental results [6,10]. It should be mentioned that these theoretical analyses derived the famous Rayleigh–Plesset equation, which included the effects of the internal pressure of gas within the bubble, as well as the effects of surface tension and liquid viscosity. The equation expressed the temporal variation in the radius of a collapsing single cavitation bubble, as summarized in a review paper [6].
The mechanism of cavitation damage on wall materials has been a topic of interest for many years. High-speed observations of cavitation bubble collapse near the wall have shown that a single bubble deforms due to the reentrant-jet mechanism and subsequently generates a high-speed microjet directed toward the wall, followed by the formation of a shockwave [11,12]. This process generates a high impulsive pressure that damages the wall. This mechanism has been a topic of interest for the past few decades, and the flow physics of the reentrant jet have been studied using high-speed imaging to observe the behavior of a single spherical bubble near the wall [13,14,15,16,17,18]. Subsequently, a numerical analysis of the nonspherical bubble collapse behavior was performed to demonstrate that the asymmetry of the bubble increased the impulsive pressure on the wall [19]. Further numerical analysis was performed using the cavitation erosion model based on microjets, and the results reproduced the experimental observations of the erosion area and maximum erosion depth [20].
A recent study on cavitation erosion revealed that the major impulsive pressure on the wall was generated by the pressure pulse resulting from bubble collapse [21]. However, the impulsive pressure was found to be significantly influenced by the reflectivity of the wall because of the increased laser illumination on the reflected walls [22]. Further experimental studies on the impulsive pressure of the microjet were performed on elastic material, revealing that microjet formation was the major influencing factor on the erosion of elastic materials, whereas the influence of the shockwave on the erosion was considered small [23].
A cavitating jet is a liquid jet with a cloud of vortex cavitation along the jet shear layer issued from a nozzle into the surrounding liquid. A submerged water jet in a water environment is a typical example of a cavitating jet in engineering and has been extensively studied because of its aggressive cloud behavior. The cavitation cloud consists of many bubbles, and its aggressive behavior is much stronger than that of a single spherical bubble collapsing when the cloud collapses synchronously. This cloud collapse results in significant damage to the wall materials owing to the collective effect of cavitation bubble collapse. According to the result of the asymptotic approach, the pressure peak of the 12-bubble collapse was almost 10,000 times larger than that of the two-bubble collapse, suggesting the importance of the collective effect of bubbles [24]. The synchronous cloud behavior of bubbles can be driven by the local pressure variation in the liquid and the influence of pressure pulses resulting from the collapse of cavitation bubbles.
In the past, the aggressive behavior of cavitating-jet clouds was visualized using direct imaging using a high-speed camera, which captured temporal variations in the cloud structure of the cavitating jets. Observations of the cloud structure in cavitating jets have been performed by many researchers [25,26,27,28,29,30,31,32,33,34,35,36,37,38,39,40,41,42,43,44,45]. They demonstrated the periodic oscillation of cloud shedding downstream of the nozzle [26,27,29,30,31,33,34,35,36,39,40,41,42,43,44,45], and the erosion behavior of wall materials caused by aggressive cloud collapse [25,28,32,37,38], which have been summarized in recent review papers [46,47]. The erosion behavior of a cavitating jet is highly dependent on standoff distance [26] and nozzle exit geometry [48,49,50,51,52,53]. Furthermore, the influence of standoff distance correlates well with the cavitation number [46].
Cavitation erosion is highly dependent on the surface roughness of the nozzle [49], angle of incidence [50], fluid temperature [32], and impact velocity of the target material [50]. Hassan et al. [47] demonstrated several industrial applications of cavitating jets, such as cleaning, well drilling, rock-cutting, bitumen separation, and oil–shale mining. The general behavior of a cavitating jet and its practical applications are well summarized in the review papers in the literature [46,47]. However, experimental methods for visualizing the cloud behavior and pit formation mechanism of cavitating jets leading to mass-loss erosion have been rarely studied in review papers. Furthermore, the erosion mechanisms of cavitating jets and numerical simulations have received little attention in the literature.
Numerical simulations of cavitating jets are important topics of interest. Although this is a new topic, several numerical studies have been conducted on cavitating jets [54,55,56,57,58]. Most of these studies have focused on the cloud behavior of cavitating jets [54,55,56,57], whereas few numerical studies have focused on the erosion behavior of cavitating jets [58]. This gap may be related to the difficulty in modeling the coupled phenomenon of the compressible two-phase flow and the solid mechanics of the wall material. More details on numerical simulations of cavitating jets are described in this review.
In this paper, the research topics on cavitating jets are reviewed, focusing on the experimental techniques in Section 2. The experimental results of cloud formation and collapse behavior, pit formation associated with the reentrant-jet mechanism, and shockwave formation are presented in Section 3. Furthermore, numerical simulations of cavitating-jet erosion are examined and compared with the experimental results in Section 4. Moreover, future research topics are briefly discussed in relation to the erosion behavior of a cavitating jet on a rough wall in Section 5.
2. Experimental Techniques of Cloud Behavior and Pit Formation
To understand the influence of cloud behavior on the erosion mechanism of a cavitating jet, flow visualization of clouds and pit formation is essential in cavitating-jet research. Although cloud behavior can be visualized by direct imaging of a cavitating jet using a high-speed camera, further image analyses are required to characterize quantitative information, such as the shedding frequency, cloud geometry, cloud collapse behavior, and pit distribution. To evaluate these characteristics quantitatively in a cavitating jet, experimental methods such as a pit sensor [59,60,61,62,63,64,65,66,67,68,69,70,71,72,73], a polyvinylidene fluoride film (PVDF) sensor [26,74,75,76,77,78,79,80,81,82], and image analyses [83,84,85,86,87,88,89] have been studied. Image analyses include frame difference analysis [73,83], shadowgraph imaging combined with proper orthogonal decomposition (POD) analysis [84,87], laser-schlieren imaging [86,89], and cross-schlieren imaging [88]. These experimental techniques and image analyses allow for a better understanding of the cavitating jet behavior and pit formation mechanism on the wall material, both of which are essential for studying the erosion behavior of cavitating jets.
2.1. Pit Sensor
When a bubble collapses near a wall, impulsive pressure is generated, resulting in the formation of cavitation pits on the wall. To characterize pit formation on the wall, a thin-film sensor was developed to evaluate the number of pits on the wall. Information on the number of pits is very important in cavitating-jet research because it is closely related to erosion initiation on the wall material. Mass loss was initiated at the end of the incubation. Several materials were used in the pit sensor to detect the pit distribution caused by cavitation. A typical example is the aluminum film [59,60,61,62,63,64,65,66,67,68,69,70,71,72], which has been used in cavitation research; however, copper [59,62] and gold [73] films are also used as materials for pit sensors. A typical film thickness of the pit sensor was approximately 10 μm.
The selection of the pit sensor material depends on the magnitude of the impulsive forces acting on the wall material. Although pit images can be obtained directly from a test model made of aluminum, the pit sensor can be repeatedly used without manufacturing the test model. Another advantage is the observation of the pit distribution from the rear side of the thin film, when the test material is made transparent (see Figure 1a). Figure 1b shows the cavitating-jet nozzle used in the experiment, which consists of a single orifice in the nozzle that promotes the periodic oscillation of the cloud downstream of the nozzle. This experimental arrangement allows the time-series observation of pits using a high-speed camera [73]. An example of experimental arrangements using the gold-film sensor is shown in Figure 1c, which was 0.2 μm thick and pasted on the glass wall. The film sensor was observed using a high-speed camera combined with optical fiber illumination. This configuration of the film sensor allows simultaneous visualization of the pits and cloud structure of the cavitating jet.
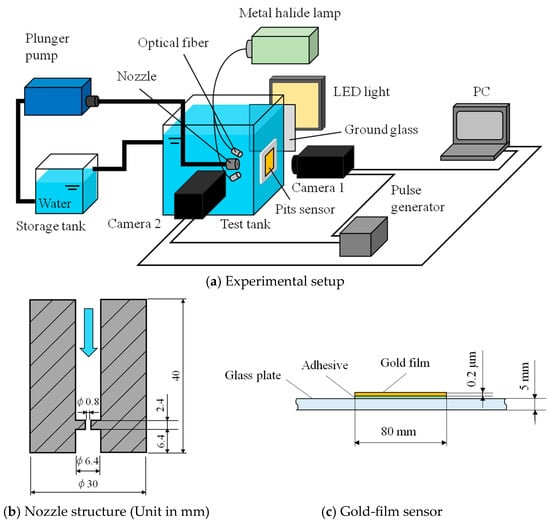
Figure 1.
Simultaneous observation of pit formation and cavitating-jet cloud. Reprinted from [73]. Copyright (2017), with permission from Elsevier.
2.2. PVDF Sensor
Impulsive pressure measurement caused by cavitation bubble collapse has been an important topic of interest for many years. To evaluate the impulsive pressure on the wall, a PVDF sensor was developed owing to its high-frequency response to the impulsive pressure in the cavitating jet [26,74,75,76,77,78,79,80,81,82]. To measure the impulsive pressure, the sensor output was calibrated against a known pressure by simultaneously measuring the impact force and local area of impact. Calibration of the PVDF sensor was performed with respect to the known impulsive force using a ball drop impact test, as reported in the literature [75,79].
To measure the impulsive pressure caused by cavitation bubble collapse, the impact pressure area was assumed to be the average area of the pits, and the pressure was uniformly distributed on the pit area. Furthermore, bubble collapse must occur in the sensitive area of the sensor with a frequency response of up to 1 MHz in the cavitation event. The PVDF sensor exhibited a flat frequency response up to 1 MHz, which is sufficiently high to resolve the impulsive pressure of the cavitation bubble collapse. However, it is difficult to accurately measure the impulsive pressure of a cavitation collapse because it is difficult to measure the impulsive force and pit diameter simultaneously. Therefore, the impulsive pressures of cavitation bubbles have rarely been measured. However, several measurements of the impulsive forces in cavitation research [26,74,75,76,77,78,79,80,81,82] are reported for evaluating the intensity of the cavitating jet.
The PVDF sensor (FV301926, Goodfellow Cambridge Ltd., Huntingdon, UK) was calibrated against the pressure measured by the shock-tube facility [75]. The typical impulsive pressures on the array sensor were evaluated using a one-dimensional analysis using the gas conservation equations. The output signals from the shock-tube facility indicate good uniformity in pressure of the sensor array with an average rise time of 31 ns in the pressure range from 20.7 kPa to more than 6.9 MPa. Therefore, it was very suitable for measuring impulsive pressure induced by the collapse of a cavitation bubble, which was generated by a capacitor across a pair of tungsten electrodes (1 mm in diameter). Furthermore, linear relationships between the pressure and output signals of the PVDF sensors were confirmed. Further details of the pressure calibration curve and the response of the sensor are given in Ref. [75].
Figure 2 shows a typical example of a PVDF sensor (DT1-028 K/L, Measurement Specialties, St. Marys, PA, USA) and the experimental setup for the cavitation test, in which a cavitation bubble was generated using an electrohydraulic bubble generator set over the PVDF sensors. The PVDF sensor was a film with a thickness of 28 μm and a sensitive area of 12 mm × 30 mm attached to a steel plate [76]. Note that the frequency response of the sensor depends on the film thickness. The PVDF sensor response to a step pressure loading generated by a gas dynamic shock tube (a) and the spectrum analysis (b) are shown in Figure 3. The measured pressure signals were almost independent of the sensors, indicating a uniform sensor output. The average response time of these signals was 56 ns, corresponding to a response frequency of 17.9 MHz, which was high enough to measure the impulsive pressures of cavitation.
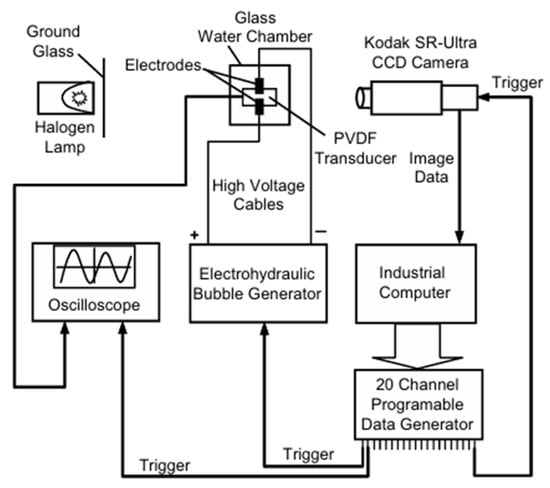
Figure 2.
Experimental setup of the PVDF array sensor and the electrohydraulic bubble generator [76]. Reprinted from [76]. Copyright (2007), with permission from Elsevier.
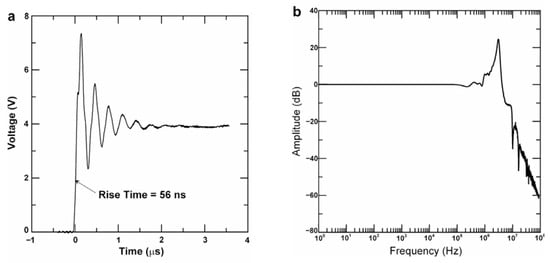
Figure 3.
Typical examples of PVDF sensor response to a step pressure loading generated by a gas dynamic shock tube (a) and the spectrum analysis (b). Reprinted from [76]. Copyright (2007), with permission from Elsevier.
2.3. High-Speed Imaging and Frame Difference Analysis
The periodic oscillation of the cavitating jet was measured using digital image analysis combined with high-speed observation of the cloud behavior, where an edge detection technique was introduced to evaluate the cloud boundaries [33]. Subsequently, shadowgraph imaging techniques and further image analyses have been introduced into high-speed imaging of cavitating jets using the frame difference method [73,83]. The experimental setup for shadowgraph imaging is illustrated in Figure 1a, which consists of an in-line illumination of light-emitting diode (LED) light and imaging using a high-speed camera operating at 100,000 Hz with a spatial resolution of 264 × 384 pixels. These images provide not only the periodic oscillation of the cloud but also the statistical quantities of the cloud behavior of a cavitating jet. Shadowgraph imaging captures the transmitted light through a cavitating jet, whereas direct imaging shows an image of the reflected light at the interface of the cloud boundaries. These differences may result in different behaviors of the cavitating jet.
Frame difference analysis allows the differentiation of time-series images captured by a high-speed camera by subtracting the neighboring images. The subtracted image shows the high-intensity variation in the image when the neighboring images deviate significantly from the image intensity. This results in the detection of quick changes in a cloud collapse event, where shockwave formation is observed in a cavitating jet. Therefore, the frame difference analysis can detect the shockwave boundaries that are closely related to the erosion mechanism of a cavitating jet.
2.4. POD Analysis
Shadowgraph imaging combined with POD analysis was introduced into the characterization of the cloud behavior of a cavitating jet because it provides the frequency spectrum and statistical information of the unsteady cloud behavior [84,87].
Snapshot POD is an image analysis technique that produces a set of orthogonal eigenfunctions that are optimal in energy and represent the temporal and spatial correlations of instantaneous target images [84]. This method was first applied to analyze the unsteady cloud behavior of a cavitating jet captured using a high-speed camera operating at 6000 frames/s [84]. In this study, a cavitating jet was generated from a nozzle operating at a pressure of 8 MPa, and 2000 snapshots of instantaneous shadowgraph images were analyzed. The image analysis showed the time average (0 mode) and fluctuating properties (1st mode, 2nd mode) of the cavitating jet; therefore, this analysis showed the statistical properties of the cavitating jet. Using POD analysis, the most energetic flow structure can be extracted from the images by decomposing the fluctuating properties of cloud behavior into a linear sum of orthogonal eigenfunctions of temporal and spatial correlations. Therefore, this analysis provides a powerful tool for capturing the periodic behavior of clouds in cavitating jets. Further details of POD analysis and its applications can be found in Refs. [90,91,92].
2.5. Laser-Schlieren Imaging of Shockwave Visualization
Shockwave formation in a cavitating jet is an important topic of interest because it is closely related to the impulsive pressure generated by the microjet arising from the cloud collapse behavior of the cavitating jet. Shockwaves can be visualized using a laser schlieren imaging system with the optical setup shown in Figure 4 [86]. The experimental setup consisted of a continuous-wave Nd:YAG laser of 5 W, a beam expander, and a concave mirror with a 1200mm focal length. Images were captured using a complementary metal-oxide semiconductor (CMOS) camera with a 200 mm focal length lens, through slit-type dark-field illumination with a 1.5 mm thick. The shutter speed of the camera was set to 250 ns, which is the shortest shutter interval of the high-speed camera. The spatial resolution of the image was 264 × 384 pixels with eight bits at 100,000 Hz.
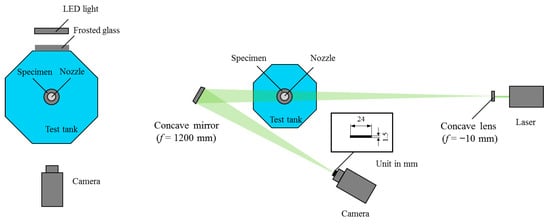
Figure 4.
Experimental setup for shadowgraph and schlieren imaging. Reprinted from [86]. Copyright (2018), with permission from Elsevier.
2.6. Cross-Schlieren Imaging of Cloud Collapse and Shockwaves
To evaluate the position of the cavitation cloud collapse in three-dimensional space, two sets of laser-schlieren imaging systems are required. Figure 5 illustrates the experimental setup of the cross-schlieren imaging system, which consists of a continuous-wave Nd:YAG laser (5 W) and a beam expander, half mirror, two concave mirrors, and two CMOS cameras with a 200 mm focal length lens [88]. The concave mirror is a 150 mm-diameter lens with a focal length of 1.2 m. Moreover, slit-type dark-field illumination was introduced as a knife-edge in front of each camera to increase the sensitivity of the laser-schlieren system. Shockwave formation was captured in two orthogonal directions using two high-speed cameras synchronously operated at 400,000 frames/s. The spatial resolutions of the two cameras were 264 × 384 and 160 × 264 pixels, respectively. The exposure time for each camera was set to 250 ns and was aligned with the laser, concave mirror, and slit-type dark-field illumination.
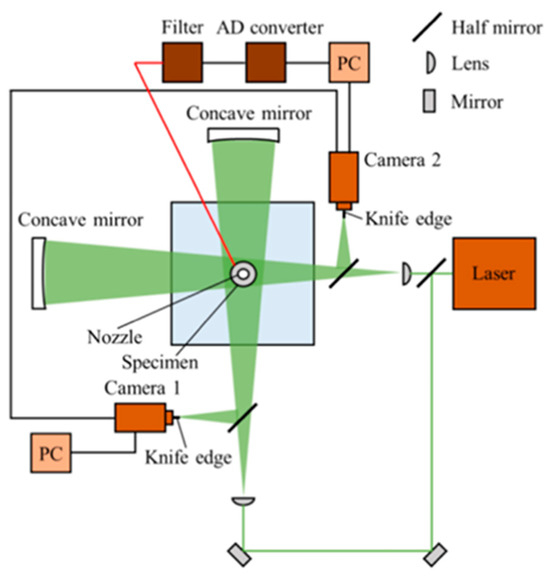
Figure 5.
Cross-schlieren imaging system for cavitating jet. Reprinted from [88]. Copyright (2019), with permission from Elsevier.
To evaluate the shockwave initiation from the two orthogonal schlieren images, the shockwave was assumed to propagate spherically from the origin near the wall. An example of shockwave images captured synchronously from orthogonal directions is shown in Figure 6. They show shockwaves initiated from a position near the wall. The initiation position of the shockwave is evaluated by fitting a circular trajectory to the shockwave front after thinning the shockwave image. The shockwave initiation coordinates (x, y) can be obtained from the circular curve fitting technique to a set of shockwave images captured by two high-speed cameras.
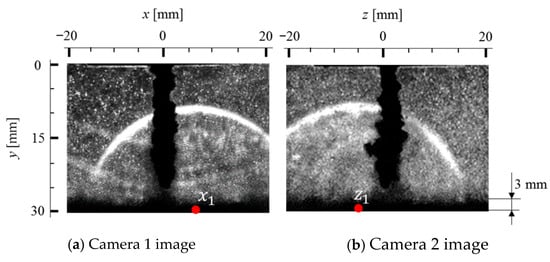
Figure 6.
Example of the shockwave images taken from the cross-schlieren imaging (P = 12 MPa, ys = 30 mm). Reprinted from [88]. Copyright (2019), with permission from Elsevier.
3. Experimental Results and Discussion
3.1. Observation of Pit Formation
To clarify the erosion mechanism of the cavitating jet, a pit sensor technique was applied to detect the local damaged area of the wall materials. There are many studies on pit sensors [59,60,61,62,63,64,65,66,67,68,69,70,71,72,73], but most of them are made of aluminum film [59,60,61,63,64,65,67,69,70,71,72], whereas there are fewer sensors made of copper film [59,62] and gold film [73]. These pit sensors have been applied in cavitation research [60,61,62,63,64,65,66,68] and cavitation tunnel studies with converging and diverging sections [59,61,62,69,71].
An example of a pit sensor applied to a cavitating jet is shown in Figure 7, demonstrating the observation of pit distribution using the gold film sensor after 5 s for jet operation on aluminum specimen A1070 at a distance of 30 mm from the nozzle [73]. This observation was compared to the erosion pattern after 40 min of jetting. Both results showed similar behaviors of the pitting and erosion areas, suggesting that the erosion pattern could be characterized by the number of pits on the wall material within a short exposure time. The number of pits N was evaluated by image analysis of captured images with the gold-film sensor in the initial stage of pitting using a high-speed camera. The experimental results are shown in Figure 8 for several standoff distances ys from the nozzle at 12 MPa pressure. The experimental results indicated that the number of pits increased almost linearly with increasing exposure time t, independent of the standoff distance ys, whereas the gradient of the increasing number of pits was influenced by the standoff distance. The highest gradient was observed at a standoff distance of ys = 30–40 mm, which was almost consistent with the position of the maximum erosion rate obtained from mass-loss measurements in the literature [73]. Thus, the pit sensor measurement was able to characterize the main features of the erosion pattern of the cavitating jet; however, it took a very short time compared to the mass-loss measurement. Therefore, pit sensor measurements provide a convenient tool for estimating the erosion behavior of a cavitating jet, while the application of the pit sensor is limited to the initial stage of erosion, where the pit patterns overlap less. On the other hand, an erosion image was obtained after 40 min. The shape of the cavitating jet was influenced by the roughness caused by erosion. Therefore, there should be a certain difference in the erosion contours at a large observation time, when the erosion was increased.
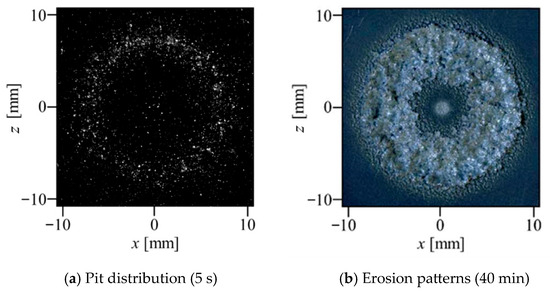
Figure 7.
Comparison of pits distribution and erosion pattern. Reprinted from [73]. Copyright (2017), with permission from Elsevier.
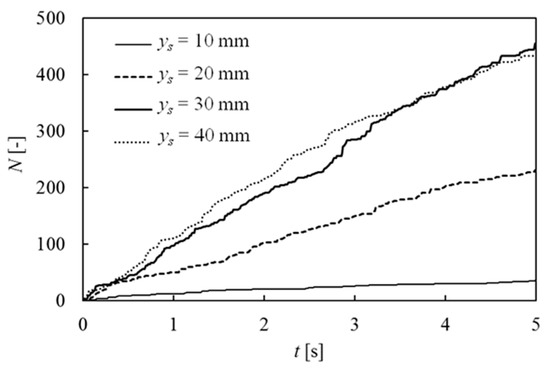
Figure 8.
Time variation in the number of pits N for several standoff distances ys. Reprinted from [73]. Copyright (2017), with permission from Elsevier.
3.2. Time Response of PVDF Sensor Applied to Cavitation Event
PVDF sensors are highly sensitive to impulsive forces. Therefore, they have been applied to measure unsteady phenomena such as acoustic and hydraulic cavitation events [73,81], cavitation bubble collapse [26,74], cavitating jets [75,76,78], and laser-induced cavitation [79].
An example of the time-response study of the PVDF sensor is shown in Figure 9a,b, illustrating the time variation in the sensor output during a cavitation phenomenon [76]. The non-dimensional bubble distance from the wall is set to γ (=s/d) = 3.0 (a) and 1.2 (b), where s is the distance of the bubble center from the wall and d is the bubble diameter. When the cavitation bubble is generated far from the sensor, γ = 3.0 (a), the sensor output shows a short-duration impulsive pulse. This is a typical feature of a sensor signal owing to the spherical collapse of a cavitation bubble.
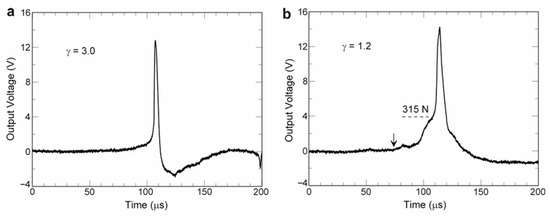
Figure 9.
Time response of the PVDF sensor in a cavitation bubble collapse for γ = 3.0 (a) and γ = 1.2 (b). Reprinted from [76]. Copyright (2007), with permission from Elsevier.
By decreasing the bubble center distance to the wall (γ = 1.2) (b), there is a slow increase in the output signal before a short-duration impulsive pulse. Then, the output signal increases sharply, and the signal peak increases more than in the case of γ = 3.0, which is followed by a gradual decrease in the output signal because of the weakening in the shockwave magnitude. The maximum hydrodynamic force due to the subsequent flow before the appearance of the shock loading is about 315 N in Figure 9b, which is a result of the integration of the pressure field on the transducer surface. This shock loading corresponds to the average pressure on the surface of about 2.2 MPa. It should be mentioned that the impulsive signal could be caused by a high-speed liquid jet penetrating through the bubble, impacting the wall, and resulting in damage to the wall material. Microjet impingement on the wall produces a much longer duration of bubble collapse, and a shockwave can be emitted at the impact of the microjet on the wall. The time variation in the sensor signal confirmed the bubble collapse behavior and the generation of impact pressure. It should be mentioned that the voltage-to-pressure conversion relationship was obtained from the ball impact calibration technique, as shown in Ref. [76]. Although the impulsive pressure rise in this experiment was caused by a single bubble collapse, a similar phenomenon can be expected in a cloud collapse in a cavitating jet, which is expected to be much larger than that of a single bubble collapse [24].
3.3. High-Speed Imaging and Frame Difference Analysis
High-speed imaging of cloud behavior is essential for studying the aggressive erosion behavior of cavitating jets. Although the periodic cloud behavior of a cavitating jet has been studied by many researchers using high-speed imaging [25,26,27,28,29,30,31,32,33,34,35,36,37,38,39,40,41,42,43,44,45,46], the introduction of frame differences and POD analyses is very helpful in quantifying the cloud behavior of a cavitating jet.
Figure 10 shows an example of the shadowgraph images of cavitating free jets issued into a still water environment captured by a high-speed camera operating at a frame rate of 100,000 Hz. The experiments were performed at 12 MPa nozzle pressure. The time-series shadowgraph images are shown for every 0.1 ms interval, indicating periodic cloud formation every 0.7 ms, which corresponds to the periodic frequency of 1.4 kHz. The series of shadowgraph images showed the formation of clouds within a short distance from the nozzle exit (t = 0 ms), which grew downstream with increasing elapsed time. This was followed by the start of cloud separation near the nozzle (0.6 ms) and shrinkage of the cloud in the cloud image near the nozzle (1.2 ms). Subsequently, a cloud collapse occurred in the image (1.3 ms) at approximately 60 mm from the nozzle exit. Thus, the cavitation cloud experiences periodic growth, shrinkage, and collapse at a short distance from the nozzle exit [73] and is accompanied by unsteady fluctuations in the cloud behavior owing to the influence of turbulence generated in the shear layer. The cloud width increases with the axial distance from the nozzle, and the width reaches a maximum at approximately 50 mm in axial distance before approaching cloud collapse at 60 mm in the cavitating jet. The cloud of the cavitating jet is dispersed further downstream, where the surrounding bubbles are sparsely distributed rather than forming a cloud. It should be noted that the shadowgraph imaging allowed observation of the cloud as well as the dispersed bubbles near the cloud, while the direct imaging captured the blurred reflection light at the cloud interfaces.
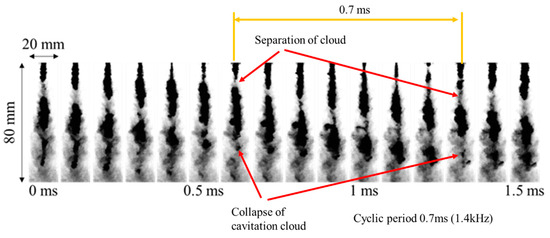
Figure 10.
Time-series observation of shadowgraph images of a cavitating jet.
Figure 11 and Figure 12 show the sequential shadowgraph images and corresponding frame-difference analysis images of the cavitating jet impacting the wall [73]. These images were captured using a high-speed camera operating at 100,000 frames when the planar wall was located 30 mm from the nozzle. The shadowgraph images in Figure 11 were taken in the plane perpendicular to the axis of the cavitating jet, resulting in the radial development of the cavitation cloud on the wall, as observed in the images. They showed periodic cloud behavior, and the first three images (a) to (c) were in the growth phase, which was followed by the shrinkage and collapse of the cavitating jet cloud (d). The cloud then spreads in the radial direction (e), similar to that in picture (a). These observations were consistent with the side view of the cavitating free jet shown in Figure 10.
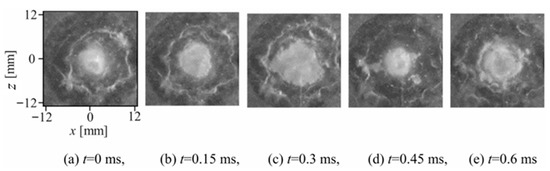
Figure 11.
Time-series shadowgraph images of a cavitating jet in axial observation. Reprinted from [73]. Copyright (2017), with permission from Elsevier.
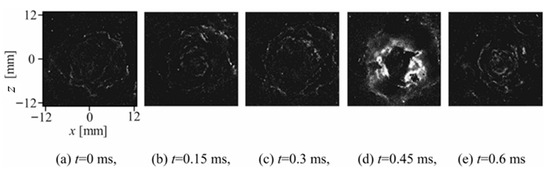
Figure 12.
Time-series frame difference shadowgraph images of a cavitating jet in axial observation. Reprinted from [73]. Copyright (2017), with permission from Elsevier.
The series of frame difference images in Figure 12 indicates a sudden change in the cloud structure at 0.45 ms (d), which corresponds to the collapse of the cavitation cloud. The cavitation cloud spreads along the wall in the radial direction, and the cloud collapse starts at a distance from the jet center, as observed in the high-intensity area in the frame-difference images in Figure 12d. The intensity magnitude of the frame difference images increases rapidly at the instant of cloud collapse (d), which is clearly observed in the area surrounding the cloud in the outer shear layer of the cavitating jet. This indicates that cloud collapse did not occur along the axis of the cavitating jet, but rather appeared in the outer shear layer. This result agreed with the pit distribution and erosion patterns shown in Figure 7. It should be noted that the cloud behavior of the cavitating jet on the wall was affected by the presence of the wall, which can be seen in the different axial positions of cloud collapse in the cavitating-free jet and cavitating jet on the wall in Figure 11 and Figure 12.
3.4. POD Analysis of Shadowgraph Images
Snapshot POD analysis was introduced into the statistical analysis of 2000 instantaneous shadowgraph images captured using a high-speed camera operating at a frame rate of 6000 frames/s [84]. Figure 13 shows the time-averaged properties of the shadowgraph image (0 POD mode (a)) and the fluctuating properties of images for the 1st mode (b), 2nd mode (c), and 3rd mode (d). It is noted that the 0 POD mode (a) is the mean flow of the cavitating jet along the jet axis. In contrast, the 1st, 2nd, and 3rd POD modes show fluctuating behavior of the cloud structure along the jet axis. Positive peaks appeared along the shear layer in all the fluctuating modes near the nozzle, and negative peaks were observed further downstream. These peaks indicate a growing structure near the nozzle, and a shrinking structure further downstream, followed by weaker positive and negative structures further downstream. It should be noted that the major fluctuating energies of the 1st and 2nd POD modes were 19% and 15% of the total energy, respectively, and the 3rd POD mode showed a much lower energy level of less than 4%. Therefore, the major fluctuating energy was involved in the 1st and 2nd POD modes. These results indicated that the cavitating free jet consisted of an axisymmetric structure across the cavitating jet, whereas it exhibited a periodic structure along the jet shear layer. These structures correspond to the periodic growth and shrinkage of the cavitating-jet cloud, as observed in the time-series images in Figure 10. The distance between the periodic structures along the jet axis corresponds to the wavelength of the periodic structure of the cavitating jet cloud, which is determined by the nozzle structure of the cavitating jet [46]. These results indicated that a periodic cloud structure can be produced along the jet shear layer in shadowgraph imaging, whereas it is not clearly observed in direct imaging [87]. This difference may suggest a better spatial resolution for shadowgraph imaging than for direct imaging.
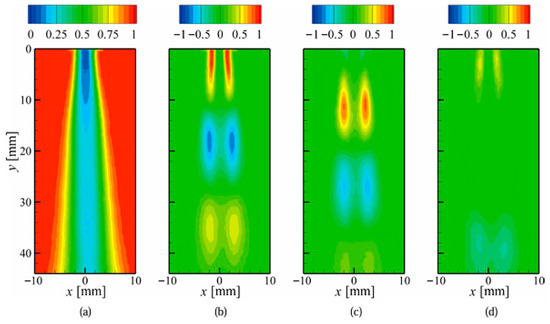
Figure 13.
Mean and fluctuating modes of cavitating jet images taken from POD analysis [84] (reproduced under Creative Commons Attribution 4.0 license). (a) Mean: (b) 1st mode, (c) 2nd mode, and (d) 3rd mode.
Figure 14 shows the reconstructed cavitating-jet structure from the mean and fluctuating POD modes of the 0 to 10th modes at four typical observation instants. The fluctuating energy of the ten POD modes accounted for more than 50% of the total energy. The reconstructed images show periodic variations in the cavitation cloud behavior, corresponding to the growth and shrinkage of the cavitating jet. This suggests that the periodicity of the cavitating-jet cloud structure can be represented well by the reconstruction of the lower POD modes. However, this reconstruction does not account for the cloud collapse phenomenon because it is a high-frequency phenomenon involved in higher POD modes. Therefore, further studies are required to reconstruct the high-frequency cloud collapse phenomenon using higher POD modes in the analysis.
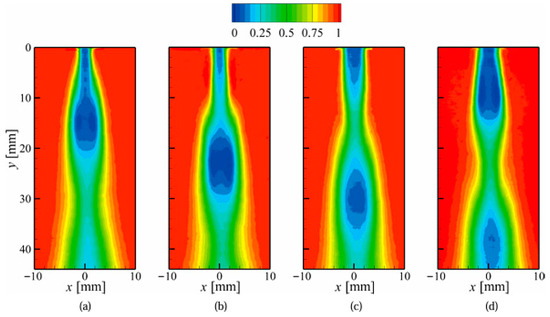
Figure 14.
Reconstructed shadowgraph images from the 0 to 10th POD modes [84] (reproduced under Creative Commons Attribution 4.0 license). (a) t = 0 ms, (b) t = 0.17 ms, (c) t = 0.33 ms, (d) t = 0.5 ms.
3.5. Laser-Schlieren Imaging of Shockwave in Cavitating Jet
Shockwave behavior in a cavitating jet was investigated by introducing laser-schlieren imaging, which is an experimental technique for visualizing shockwaves using laser illumination [89].
Figure 15 shows examples of laser-schlieren images of the cavitating free-jet issuing into a still water environment at a nozzle pressure of 12 MPa [86]. These images show shockwave formation in the cavitating jet, which occurs at cloud collapse and appears at a distance of approximately 30 to 60 mm from the nozzle exit along the jet centerline. Shockwave formation occurred independent of the presence of the wall. However, the shockwave formation scatters along the jet axis because the free jet is not restricted by the wall. Shockwaves can be generated by the reentrant jet mechanism at the instant of cloud collapse.
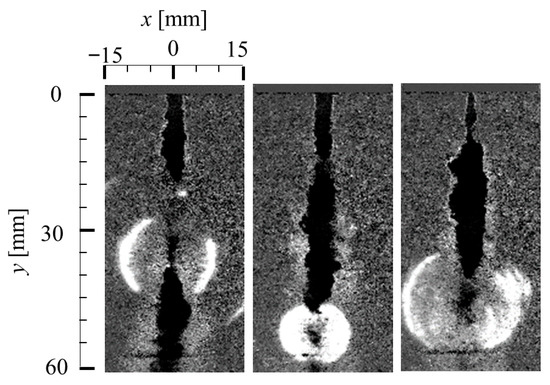
Figure 15.
Example of laser-schlieren images of a cavitating free jet (12 MPa). Reprinted from [86]. Copyright (2018), with permission from Elsevier.
Figure 16 shows the laser-schlieren images of the cavitating jet on the wall located 30 mm from the nozzle exit at the maximum erosion rate condition at a nozzle pressure of 12 MPa. The images captured by the high-speed camera show the formation of shockwaves caused by the cloud collapse. Several shockwaves were observed at the instant of time t = 0.3 ms (c), which were caused by the occurrence of several microjets at the instant of cloud collapse arising from the reentrant-jet mechanism.
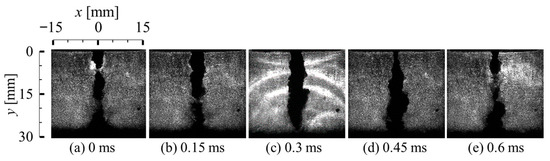
Figure 16.
Time-series laser-schlieren images of a cavitating jet on the wall (12 MPa). Reprinted from [86]. Copyright (2018), with permission from Elsevier.
Figure 17 shows the time variations in the impulsive pressure signal and shockwave formation along the jet axis, where the impulsive pressure signal was measured using the PVDF sensor, and the shockwaves were simultaneously observed using the laser-schlieren technique with a high-speed camera. The impulsive signal was normalized by the maximum signal amplitude in the time range, and the instant of shockwave formation was shown by the marks (●) in the figure. Peak impulsive pressure signals appeared almost periodically at the instants of shockwave formation, where synchronous shockwave formations were observed at the peak signals. Therefore, shockwave formation can be closely related to the re-entrant jet mechanism of cavitation cloud collapse and the microjet. It should be noted that several shockwaves were generated at the peak amplitudes of the impulsive pressure signal, as observed in the laser-schlieren images at the cloud collapse in Figure 16.
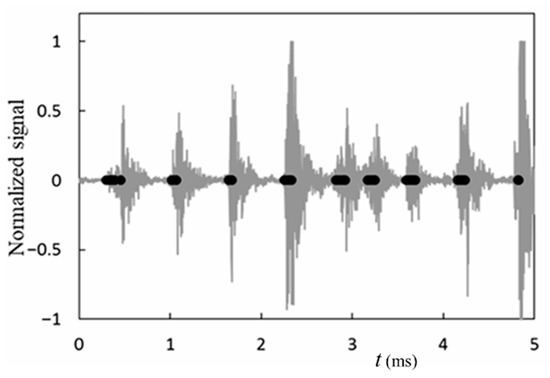
Figure 17.
Reprinted: impulsive-force signal and shockwave formation (●) on the wall (12 MPa). Reprinted from [86]. Copyright (2018), with permission from Elsevier.
To further investigate the occurrence of shockwaves in a cavitating jet with and without a wall, the initiation points of the shockwaves were evaluated by fitting a circular curve to the shockwave front. The results of the cavitating jet with and without a wall are shown in Figure 18, where x is the radial distance from the jet axis, and y is the axial distance from the nozzle exit. Shockwave formation in the cavitating free jet indicates the occurrence of a cavitation bubble collapse along the jet axis at a certain distance of 30 to 60 mm. On the contrary, the shockwave formation of the cavitating jet on the wall is widely distributed along the wall within a radial distance of ±10 mm from the jet axis, and confined to the region near the wall. This shockwave initiation position was almost consistent with the pit formation area shown in Figure 7a. These results indicate that the positions of shockwaves in the cavitating jet were significantly modified by the introduction of the wall, and they were located near the wall at a certain radial distance from the axis of the cavitating jet on the wall. This is because the cavitation cloud is highly influenced by the presence of the wall, resulting in the occurrence of cloud collapse in the limited radial distance of ±10 mm from the jet axis near the wall. It should be noted that the number of shockwaves near the jet axis was lower than that in the surrounding area. This is because a cavitation cloud is generated in the outer shear layer of the cavitating jet, whereas the central jet axis is filled with the waterjet, which is inactive in the erosion of the wall material. This explanation is consistent with the pit distributions shown in Figure 7a. Shockwave formation in the vicinity of the wall can be associated with the re-entrant jet mechanism during cloud collapse, resulting in the generation of impulsive pressure due to the formation of a microjet. However, the erosion pattern on the wall material may not be related to the shockwave pattern, because the scale of the erosion pattern is on the order of mm, whereas that of the cavitation pits generated by the shockwave is on the order of 0.1 mm or less [86]. Therefore, the impulsive pressure on the wall caused by the microjet could be the main cause of the cavitation erosion originating from the re-entrant jet mechanism near the wall. A further discussion of the correlation between the number of shockwaves and the erosion behavior is presented in the following section.
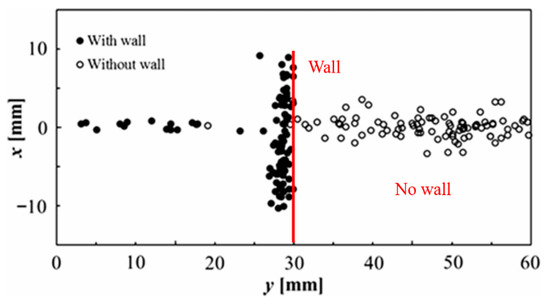
Figure 18.
Distribution of shockwave initiations of a cavitating jet with and without a wall (12 MPa). Reprinted from [86]. Copyright (2018), with permission from Elsevier.
3.6. Cross-Schlieren Imaging in Cavitating Jet
To clarify the erosion mechanism of a cavitating jet, the correlation between pits and shockwave initiations was examined using the cross-schlieren imaging technique. The experimental results demonstrated the relationship between the pits and periodic cloud collapse events, leading to the generation of impulsive pressures arising from the re-entrant jet mechanism of the cavitation cloud collapse. Shockwave initiation positions can be evaluated from two synchronous laser schlieren images taken from high-speed cameras.
Figure 19 shows the distribution of shockwave initiation positions obtained using the cross-schlieren imaging technique. This distribution was obtained from cross-schlieren imaging at the maximum erosion rate of the cavitating jet at a standoff distance of 30 mm and at a nozzle pressure of 12 MPa. Results were obtained from four repeated experiments with an observation time of 1 s. Subsequently, 800 pairs of shockwave images were analyzed to obtain the shockwave initiation distributions. They are distributed in a circular manner from the jet axis, with a lower density distribution near the jet axis. Furthermore, the shockwave initiation was densely distributed at radial distances within 10 mm of the jet axis. Therefore, the shockwave initiation distribution agrees with the pit distribution shown in Figure 7a. This indicated a similarity between the pit and shockwave initiation distributions over the wall material. Therefore, it is likely that the pits were caused by the microjets generated by the periodic cloud collapse event associated with the reentrant-jet mechanism of the cavitating jet. Shockwave images were not clearly observed at a lower injection pressure of 8 MPa because of the weaker re-entrant jet mechanism of the cavitating jet at low speeds.
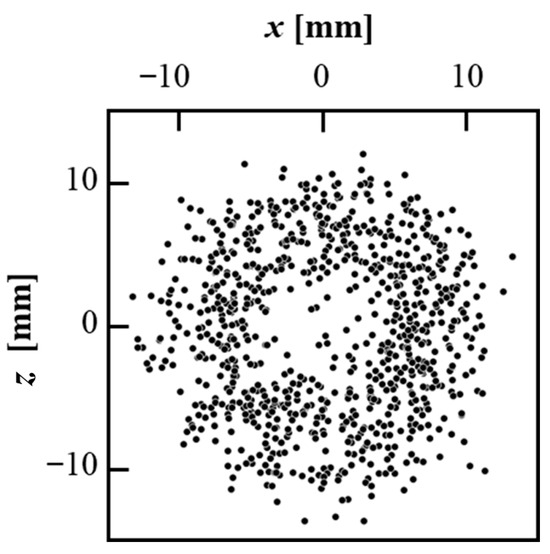
Figure 19.
Distribution of the shockwave initiations (P = 12 MPa, ys = 30 mm). Reprinted from [86]. Copyright (2018), with permission from Elsevier.
To better understand the erosion mechanism of a cavitating jet, a comparison of the radial distributions of the number of pits and shockwaves normalized by their maximums f/fmax under the same experimental conditions was made at 12 MPa nozzle pressure and 30 mm standoff distance in Figure 20. They show general agreement between the positions of the pits and shockwave initiation positions, especially in the inner region of the erosion pattern, suggesting a correlation between the pits and shockwave formation. The main features of these distributions agreed with each other, and the peaks were located approximately 7 mm from the jet axis. However, some deviations were observed in the outer region of the erosion pattern, r > 8 mm (r: radial distance), where the influence of surface roughness was evident in the erosion distribution ν/νmax. Furthermore, there remains considerable scattering of pits, shockwave initiation positions, and erosion distribution in the outer region.
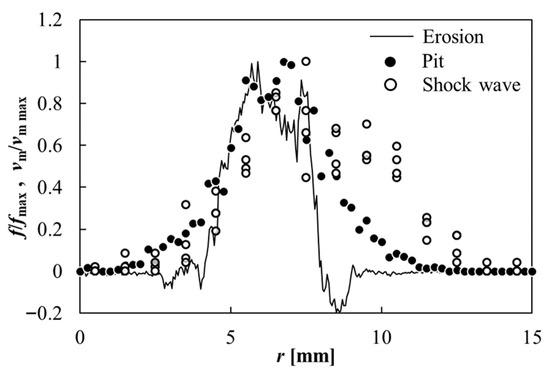
Figure 20.
Number density distribution of the pits and shockwave initiations (P = 12 MPa, ys = 30 mm). Reprinted from [86]. Copyright (2018), with permission from Elsevier.
4. Numerical Simulation of Cloud and Erosion Behaviors in a Cavitating Jet
Numerical simulation of cloud and erosion behaviors in cavitating jets is an important topic of interest in engineering. However, a limited number of such studies have been conducted in the literature. This may be due to the complexity of modeling the two-phase flow behavior of the cavitation cloud in liquid and the resulting erosion behavior of the wall material in the cavitating jet.
To simulate the growth of clouds and cloud collapse behaviors in a cavitating jet, unsteady cloud behavior must be modeled in the numerical simulation. The first study on cavitating jet behavior was conducted, assuming a spherical bubble in a cavitating jet, using the Rayleigh–Plesset equation to simulate the cavitation cloud [54]. Subsequently, a more realistic numerical simulation of the cavitating jet was conducted using a homogeneous bubbly mixture model with the unsteady Reynolds-averaged Navier–Stokes equations [53,55,56,57,93,94,95,96]. These simulations reproduced the periodic cloud behavior generated from the cavitating jet nozzle, which agreed with experimental observations. Numerical modeling was further improved by incorporating the influence of the phase change in the cloud [96]. Cloud behavior was numerically simulated using the unsteady Reynolds-averaged Navier–Stokes equations for an incompressible fluid flow combined with a cavitation model [95]. Emphasis was placed on the influence of the diverging angle of the nozzle on the cloud formation, and the result was experimentally verified [53]. Furthermore, the cloud behavior of the cavitating jet was numerically studied using various turbulence models [97,98,99,100], and better predictions were obtained using large-eddy simulation in comparison with the Reynolds-averaged modeling. This is because the small-scale vortices and transient cavitating-jet behavior cannot be reproduced by the time-averaging nature of the modeling.
However, numerical studies on the erosion behavior of cavitating jets are limited because they are related not only to cloud behavior but also to the pitting behavior of the wall material. Hsiao et al. [56] demonstrated that a hybrid numerical approach is powerful in predicting the cloud and pitting behaviors of wall materials. The cloud behavior of the cavitating jet was solved using the incompressible finite element method, and the pitting behavior associated with the shockwave formation was solved using the compressible finite difference method. These results reproduce the generation of a re-entrant jet mechanism near the wall, resulting in the formation of pits in the wall material. Furthermore, the numerical results for pit formation were compared with the experimental results, and it was found that the peak impulsive pressure deduced from the experiment was predicted to be lower than the actual applied pressure. Therefore, the prediction of cavitation erosion can be limited to qualitative agreement with experiments [72].
Recently, cloud behavior and cavitating-jet erosion were numerically studied by solving the compressible Navier–Stokes equations using the finite volume method combined with the homogeneous mixture model of the barotropic equilibrium cavitation approach, and the results were compared with experimental results [58].
Figure 21 shows the time-series observations of the iso-surface vapor (10%) and the pressure contour of the cavitating jet. The computational conditions for the inlet velocity were 200 m/s. The orthogonal plane at the bottom represents the pressure contour recorded on the wall. The time interval between each image is 24 μs. These cavitating-jet images show the periodic formation of a cavitation cloud downstream of the diverging nozzle, which illustrates the cloud behavior of the cavitating jet. The formation of high pressure occurs at the instant of cloud collapse (x). The numerical simulations of the cavitating jet reproduced the experimental mechanism of the cloud behavior of the cavitating jet.
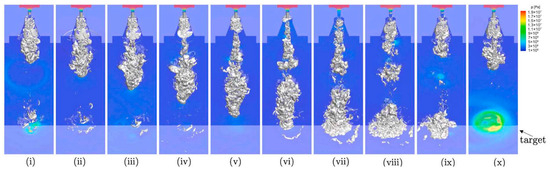
Figure 21.
Numerical simulation of cloud behavior and peak pressure field of a cavitating jet, the time interval between each image is 24 μs. Reprinted from [58]. Copyright (2022), with permission from Elsevier.
Figure 22 illustrates the numerical pit pattern deduced from the maximum impulsive pressure on the wall of a cavitating jet [58]. A comparative study of the experimental pit patterns in Figure 7a indicates that most of the pits were distributed on the outer part of the cavitating jet, and fewer pits were observed in the region near the jet axis. Thus, the experimental pit pattern was qualitatively reproduced in the numerical simulation. However, the mass-loss behavior of a cavitating jet was not so well simulated in the framework of this study. This might be related to the occurrence of roughness on the target wall caused by the advanced erosion behavior, suggesting the importance of studying cavitating jets on rough walls. This will be the focus of future studies.
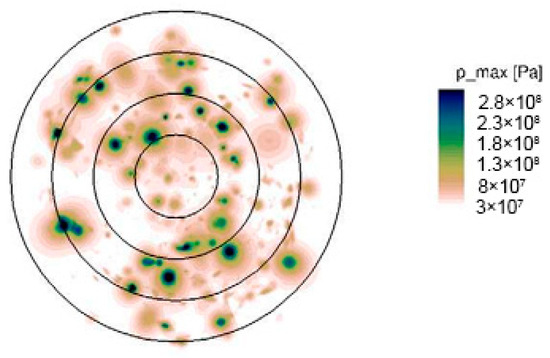
Figure 22.
Numerical maximum pressures on the wall of a cavitating jet. Reprinted from [58]. Copyright (2022), with permission from Elsevier.
5. Further Research Topics on Cavitating Jet
5.1. Cavitating-Jet Behavior on Rough Wall
The influence of surface roughness on cavitating-jet erosion was examined using groove roughness consisting of semicircular grooves with a depth of 0.19 mm and a pitch of 0.76 mm on the partially circular specimen, 30 mm × 40 mm, made of aluminum material, A1070. The experiments were conducted under maximum erosion rate conditions, with a standoff distance of 30 mm and an injection pressure of 12 MPa in a still water environment [101].
Figure 23 shows the time variation in the erosion rate of the cavitating jet on the rough wall compared with that on the smooth wall. The mass-loss measurement was made using a high-precision scale with a resolution of 0.01 mg, and the results are shown with the operating time t (s) of the cavitating jet. Error bars indicate two repeated experiments. Smooth wall erosion shows an incubation period of approximately 20 s, followed by a linear growth rate of erosion, whereas rough wall erosion starts with a large erosion rate with a small incubation period. The erosion rate of the rough wall was approximately 10 times higher than that of the smooth wall. This result can be attributed to the interaction of the cloud behavior with the groove roughness, although the mechanism is not clearly understood.
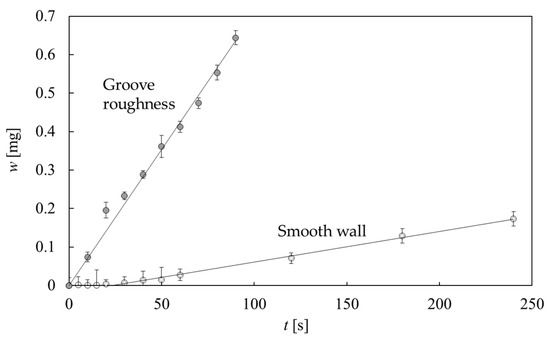
Figure 23.
Time variation in mass-loss measurement on smooth and groove roughness of a cavitating-jet [101] (reproduced under Creative Commons Attribution 4.0 license).
Figure 24 shows the scanning electron microscope (SEM) images of the rough walls before the cavitating jet at t = 0 s (a), after the jet operation at t = 30 s (b), and at t = 90 s (c). The SEM observation of the erosion pattern at t = 30 s (b) shows the initiation of plastic deformation over the groove bottom, which is combined with the wavy behavior on the side wall of the groove. With an increase in the time of the cavitating jet (c), the plastic deformation of the groove bottom and the wavy behavior of the side wall became more clearly observed, whereas larger pits were observed at the bottom of the roughness. These results indicate increased cavitating-jet erosion on the rough wall with an increase in the number of pits on the groove bottom. However, the erosion behavior was similar to that of the smooth wall, where smaller pits of around 100 μm in diameter were observed across the entire wall (t = 30 s, 90 s) [101]. However, rough-wall SEM observations showed an increased pit diameter of several hundred micrometers, with pits predominantly observed on the groove bottom. These large pits on the groove bottom could have been caused by the high-speed lateral jet generated by the microjet. This could have been caused by the re-entrant jet mechanism, which was observed at the groove bottom of the rough wall (c). A detailed examination showed not only large pits on the groove bottom, but also small pits on the entire wall surface. Further erosion mechanisms were studied using shadowgraphs and schlieren visualizations in Ref. [101]. However, the mechanism of the increased erosion rate owing to groove roughness is not clearly understood. For more details, see Ref. [101].
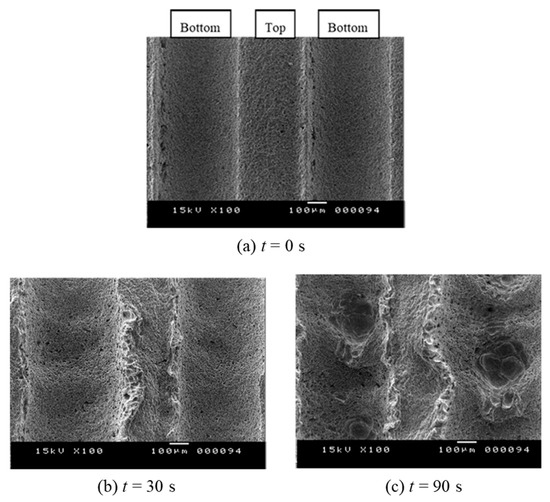
Figure 24.
SEM images of cavitating-jet erosion on groove roughness [101] (reproduced under Creative Commons Attribution 4.0 license).
5.2. Recent Studies on Cavitating Jet and Related Research
The cavitating jet was applied to various engineering fields, which included the hydraulic pulsed cavitating jet to improve drilling rate for deep wells [102,103], cavitating-jet behavior inside a poppet valve to improve the control performance [104,105], occurrence of cavitation in a two-phase boiling instability [106], cavitation peening of metals [107], analysis of natural gas hydrate erosion process [108], and cavitating-jet technique with double-hole nozzle [109]. The optimization of cavitation performance was studied in Venturi reactors through a joint suppression strategy [110], and the application of synchrotron X-ray–based particle image velocimetry to cavitating flow, which allowed the measurement of the velocity field of cavitating flow, was also investigated [111]. Further studies were carried out on the cavitating-jet technique for marine propeller materials [112]; multi-objective parameter design of self-oscillating cavitating-jet nozzles [113,114]; flow characteristics of rotating cavitating-jet nozzles [115]; ice-breaking studies using cavitating jets [116]; application of cavitating-jets using bubble collapse energy [117]; flow characteristics of composite cavitating-jet nozzles [118]; unsteady flow behavior of artificial-submerged cavitating-jets [119]; and erosion efficiency of cavitating-jets using multi-orifice nozzles [120].
Furthermore, recent studies on the mechanism of microjets caused by the collapse of cavitation bubbles and clouds are becoming increasingly active [23,121,122,123,124,125,126,127], where most research is focused on the microjet behavior from individual bubbles, while there are a few studies on microjets from cloud cavitations [122,125]. Due to the difficulty in measuring the velocity field of microjets, a numerical approach combined with experimental data is applied to evaluate the microjet behavior [23,123,124]. The flow visualization technique combined with the POD analysis was introduced into experiments on microjets, demonstrating a powerful tool for visualizing the microjet behavior [125]. Hopefully, these numerical models, combined with experimental techniques, will be helpful in studying the mechanism of microjets from a cloud in cavitating jets. Thus, the number of studies on cavitating jets and related research on microjets is increasing in a broad range of engineering fields.
6. Conclusions
In this study, recent advances in the development of experimental techniques for cavitating-jet research are reviewed, and the periodic cloud behavior and pit formation mechanism are discussed experimentally using high-speed imaging and further image analyses to evaluate the formation of clouds and pits on walls. Furthermore, a review of numerical simulation of a cavitating jet was performed to understand the recent advances in cavitating jet research. The results are summarized as follows:
- To understand the erosion behavior of a cavitating jet, experimental techniques such as high-speed imaging, frame difference analysis, POD analysis, pit sensors, PVDF sensors, laser-schlieren imaging, and cross-schlieren imaging are essential, and they have been introduced into cavitating-jet research. These experimental techniques allow high-speed visualization of periodic cloud behavior and the associated pit formation mechanism based on cloud collapse and microjets, leading to erosion initiation on the wall material.
- The erosion mechanism of the cavitating jet was highly correlated with the periodic cloud behavior, which underwent growth, shrinkage, and collapse, as observed by the frame difference and POD analyses. When the cavitation cloud collapsed near the wall, combined with the microjet mechanism, highly impulsive forces were generated, as detected by the pit and PVDF sensors. This results in pit formation on the wall material, leading to mass loss at the end of the incubation period.
- The cloud collapse event of the cavitating jet was associated with shockwave formation, which was visualized using the laser-schlieren technique. Further quantitative information on the shockwave initiation positions was evaluated using the cross-schlieren technique. Several shockwaves were generated near the wall at the instant of the peak impulsive forces caused by the microjets arising from the cloud collapse. It was found that the shockwave initiations are located near the wall within a certain radial distance from the jet axis, which was consistent with the observed pit formation area of the cavitating jet.
- The numerical simulation of the cloud and erosion behaviors of a cavitating jet was summarized to demonstrate the current state of the art in cavitating jet research. Although the cloud and pitting behaviors of the cavitating jet were accurately predicted by the numerical simulation, the prediction of cavitating jet erosion was not well studied in the framework of past studies. This is associated with the influence of roughness caused by erosion, which will be a future topic of interest.
- Further studies are required on a cavitating jet on a rough surface, where highly increased erosion occurs on the grooved rough wall due to the cavitating jet, while the mechanism of highly increased erosion is not clearly understood. Furthermore, current research on cavitating jets and related cavitation research topics, including the microjet mechanism, were briefly demonstrated for their wide application.
Funding
This work was partly supported by the JSPS KAKENHI, Grant Number JP22K05000, and the NEDO international collaborative research project, JPNP20005.
Institutional Review Board Statement
Not applicable.
Informed Consent Statement
Not applicable.
Data Availability Statement
The original contributions presented in this study are included in the article. Further inquiries can be directed to the corresponding author.
Acknowledgments
The author would like to express thanks to N. Bukharin of SAIT, Canada, and S. Iio of Shinshu University, Japan, for their helpful suggestions during the course of this study.
Conflicts of Interest
The author declares that he has no known competing financial interests or personal relationships that could have appeared to influence the work reported in this article.
References
- Blake, J.R.; Gibson, D.C. Cavitation bubbles near boundaries. Annu. Rev. Fluid Mech. 1987, 19, 99–123. [Google Scholar] [CrossRef]
- Brennen, C.E. Cavitation and Bubble Dynamics; Oxford University Press: New York, NY, USA, 1995. [Google Scholar]
- Lauterborn, W.; Ohl, C.D. Cavitation bubble dynamics. Ultrason. Sonochem. 1997, 4, 65–75. [Google Scholar] [CrossRef]
- Frank, J.-P.; Michel, J.M. Fundamentals of Cavitation; Kluwer Academic Pblishers: Dordrecht, The Netherlands, 2004. [Google Scholar]
- Kim, K.-H.; Chahine, G.L.; Franc, J.-P.; Karimi, A. Advanced Experimental and Numerical Techniques for Cavitation Erosion Prediction, Fluid Mechanics and Its Applications; Springer: Berlin, Germany, 2014. [Google Scholar]
- Sreedhar, B.K.; Albert, S.A.; Pandit, A.B. Cavitation damage: Theory and measurements—A review. Wear 2017, 372, 177–196. [Google Scholar] [CrossRef]
- Rayleigh, L. On the pressure developed in a liquid during the collapse of a spherical cavity. Lond. Edinb. Dublin Philos. Mag. J. Sci. 1917, 34, 94–98. [Google Scholar] [CrossRef]
- Plesset, M.S. The dynamics of cavitation bubbles. ASME J. Appl. Mech. 1949, 71, 277–282. [Google Scholar] [CrossRef]
- Gilmore, F. Growth or Collapse of a Spherical Bubble in a Viscous Compressible Liquids; Report no 26-4; Hydrodynamics Laboratory at the California Institute of Technology: Pasadena, CA, USA, 1952. [Google Scholar]
- Dular, M.; Coutier-Delgosha, O. Numerical modelling of cavitation erosion. Int. J. Numer. Methods Fluids 2009, 61, 1388–1410. [Google Scholar] [CrossRef]
- Tomita, Y.; Shima, A.; Takahashi, K. The collapse of a gas bubble attached to a solid wall by a shock wave and the induced impact pressure. ASME J. Fluids Eng. 1983, 105, 341–347. [Google Scholar] [CrossRef]
- Tomita, Y.; Shima, A. Mechanisms of impulsive pressure generation and damage pit formation by bubble collapse. J. Fluid Mech. 1986, 169, 535–564. [Google Scholar] [CrossRef]
- Vogel, A.; Lauterborn, W.; Timm, R. Optical and acoustic investigations of the dynamics of laser-produced cavitation bubbles near a solid boundary. J. Fluid Mech. 1989, 206, 299–338. [Google Scholar] [CrossRef]
- Philipp, A.; Lauterborn, W. Cavitation erosion by single laser-produced bubbles. J. Fluid Mech. 1998, 361, 75–116. [Google Scholar] [CrossRef]
- Isselin, J.-C.; Alloncle, A.-P.; Autric, M. On laser induced single bubble near a solid boundary: Contribution to the understanding of erosion. J. Appl. Phys. 1998, 84, 5766–5771. [Google Scholar] [CrossRef]
- Brujan, E.A.; Keen, G.S.; Vogel, A.; Blake, J.R. The final stage of the collapse of a cavitation bubble close to a rigid boundary. Phys. Fluids 2002, 14, 85–92. [Google Scholar] [CrossRef]
- Brujan, E.A.; Ikeda, T.; Matsumoto, Y. On the pressure of cavitation bubbles. Exp. Therm. Fluid Sci. 2008, 32, 1188–1191. [Google Scholar] [CrossRef]
- Brujan, E.A.; Ikeda, T.; Yoshinaka, K.; Matsumoto, Y. The final stage of the collapse of a cloud of bubbles close to a rigid boundary. Ultrason. Sonochem. 2011, 18, 59–64. [Google Scholar] [CrossRef]
- Ochiai, N.; Iga, Y.; Nohmi, M.; Ikohagi, T. Numerical analysis of nonspherical bubble collapse behavior and induced impulsive pressure during first and second collapses near the wall boundary. J. Fluid Sci. Technol. 2011, 6, 860–874. [Google Scholar] [CrossRef][Green Version]
- Peters, A.; Sagar, H.; Lantermann, U.; Moctar, O. Numerical modelling and prediction of cavitation erosion. Wear 2015, 338–339, 189–201. [Google Scholar] [CrossRef]
- Sonde, E.; Chaise, T.; Boisson, N.; Nelias, D. Modeling of cavitation peening: Jet, bubble growth and collapse, micro-jet and residual stresses. J. Mater. Process. Technol. 2018, 262, 479–491. [Google Scholar] [CrossRef]
- Fujisawa, N. Laser-induced cavitation bubble behavior on solid walls of different materials. Heat Mass Transf. 2022, 58, 499–504. [Google Scholar] [CrossRef]
- Zhai, Y.; Xu, W.; Luo, J.; Li, J. Experimental study on the characteristics of microjets and shock waves of cavitation bubbles near elastic boundaries. Ocean Eng. 2022, 257, 111664. [Google Scholar] [CrossRef]
- Chahine, G.L. Pressures generated by a bubble cloud collapse. Chem. Eng. Commun. 1984, 28, 355–367. [Google Scholar] [CrossRef]
- Yamaguchi, A.; Shimizu, S. Erosion due to impingement of cavitating jet. J. Fluids Eng. 1987, 109, 442–447. [Google Scholar] [CrossRef]
- Momma, T.; Lichtarowicz, A. A study of pressures and erosion produced by collapsing cavitation. Wear 1995, 186–187, 425–436. [Google Scholar] [CrossRef]
- Soyama, H.; Yamauchi, Y.; Adachi, Y.; Sato, K.; Shindo, T.; Oba, R. High-speed observations of the cavitation cloud around a high-speed submerged water-jet. JSME Int. J. Ser. B Fluids Therm. Eng. 1995, 38, 245–251. [Google Scholar] [CrossRef]
- Yamauchi, Y.; Soyama, H.; Adachi, Y.; Sato, K.; Shindo, T.; Oba, R.; Oshima, R.; Yamabe, M. Suitable region of high-speed sub merged water jets for cutting and peening. JSME Int. J. Ser. B Fluids Therm. Eng. 1995, 38, 31–38. [Google Scholar] [CrossRef]
- Soyama, H.; Lichtarowicz, A. Cavitating jets—Similarity correlations. J. Jet Flow Eng. 1996, 13, 9–19. [Google Scholar]
- Callenaere, M.; Franc, J.P.; Michel, J.-M.; Riondet, M. The cavitation instability induced by the development of a re-entrant jet. J. Fluid Mech. 2001, 444, 223–256. [Google Scholar] [CrossRef]
- Sato, K.; Saito, Y. Unstable cavitation behavior in a circular-cylindrical orifice flow. JSME Int. J. Ser. B Fluids Therm. Eng. 2002, 45, 638–645. [Google Scholar] [CrossRef][Green Version]
- Hattori, S.; Goto, Y.; Fukuyama, T. Influence of temperature on erosion by a cavitating liquid jet. Wear 2006, 260, 1217–1223. [Google Scholar] [CrossRef]
- Hutli, E.A.F.; Nedeljkovic, M.S. Frequency in shedding/discharging cavitation clouds determined by visualization of a sub merged cavitating jet. ASME J. Fluids Eng. 2008, 130, 021304. [Google Scholar] [CrossRef]
- Stanley, C.; Barber, B.; Milton, G. Rosengarten, Periodic cavitation shedding in a cylindrical orifice. Exp. Fluids 2011, 51, 1189–1200. [Google Scholar] [CrossRef]
- Nishimura, S.; Takakuwa, O.; Soyama, H. Similarity law on shedding frequency of cavitation cloud induced by a cavitating jet. J. Fluid Sci. Technol. 2012, 7, 405–420. [Google Scholar] [CrossRef][Green Version]
- Sato, K.; Taguchi, Y.; Hayashi, S. High speed observation of periodic cavity behavior in a convergent-divergent nozzle for cavitating water jet. J. Flow Control Meas. Vis. 2013, 1, 102–107. [Google Scholar] [CrossRef]
- Singh, S.; Choi, J.-K.; Chahine, G.L. Characterization of cavitation fields from measured pressure signals of cavitating jets and ultrasonic horns. ASME J. Fluids Eng. 2013, 135, 091302. [Google Scholar] [CrossRef]
- Wright, M.M.; Epps, B.; Dropkin, A.; Truscott, T.T. Cavitation of a submerged jet. Exp. Fluids 2013, 54, 1541. [Google Scholar] [CrossRef]
- Stanley, C.; Barber, T.; Rosengarten, G. Re-entrant jet mechanism for periodic cavitation shedding in a cylindrical orifice. Int. J. Heat Fluid Flow 2014, 50, 169–176. [Google Scholar] [CrossRef]
- Hutli, E.; Nedeljkovic, M.S.; Radovic, N.A.; Bonyár, A. The relation between the high speed submerged cavitating jet behavior and the cavitation erosion process. Int. J. Multiph. Flow 2016, 83, 27–38. [Google Scholar] [CrossRef]
- Watanabe, R.; Yanagisawa, K.; Yamagata, T.; Fujisawa, N. Simultaneous shadowgraph imaging and acceleration pulse measurement of cavitating jet. Wear 2016, 358, 72–79. [Google Scholar] [CrossRef]
- Liu, H.X.; Kang, C.; Zhang, W.; Zhang, T. Flow structures and cavitation in submerged waterjet at high jet pressure. Exp. Therm. Fluid Sci. 2017, 88, 504–512. [Google Scholar] [CrossRef]
- Peng, K.; Tian, S.; Li, G.; Alehossein, H. Mapping cavitation impact field in a submerged cavitating jet. Wear 2018, 396–397, 22–33. [Google Scholar] [CrossRef]
- Hutli, E.; Nedeljkovic, M.; Bonyar, A. Dynamic behavior of cavitation clouds: Visualization and statistical analysis. J. Braz. Soc. Mech. Sci. Eng. 2019, 41, 281. [Google Scholar] [CrossRef]
- Wu, Q.; Wei, W.; Deng, B.; Jiang, P.; Li, D.; Zhang, M.D.; Fang, Z.L. Dynamic characteristics of the cavitation clouds of submerged Helmholtz self-sustained oscillation jets from high-speed photography. J. Mech. Sci. Technol. 2019, 33, 621–630. [Google Scholar] [CrossRef]
- Soyama, H. Cavitating jet: A review. Appl. Sci. 2020, 10, 7280. [Google Scholar] [CrossRef]
- Hassan, E.; Bukharin, M.; Al-Kouz, N.; Zhang, J.-W.; Li, W.F. A review on the erosion mechanism in cavitating jets and their industrial applications. Appl. Sci. 2021, 11, 3166. [Google Scholar] [CrossRef]
- Soyama, H. Effect of nozzle geometry on a standard cavitation erosion test using a cavitating jet. Wear 2013, 297, 895–902. [Google Scholar] [CrossRef]
- Li, D.; Kang, Y.; Wang, X.C.; Ding, X.; Fang, Z. Effects of nozzle inner surface roughness on the cavitation erosion characteristics of high speed submerged jets. Exp. Therm. Fluid Sci. 2016, 74, 444–452. [Google Scholar] [CrossRef]
- Hutli, E.; Nedeljkovic, M.S.; Bonyár, A.; Légrády, D. Experimental study on the influence of geometrical parameters on the cavitation erosion characteristics of high speed submerged jets. Exp. Therm. Fluid Sci. 2017, 80, 281–292. [Google Scholar] [CrossRef]
- Kamisaka, H.; Soyama, H. Enhancing the aggressive intensity of a cavitating jet by introducing water flow holes and a long guide pipe. ASME J. Fluids Eng. 2020, 143, 031201. [Google Scholar] [CrossRef]
- Pan, Y.; Ma, F.; Liu, B.; Cai, T. Cavitation intensity and erosion pattern of a self-excited cavitating jet. J. Mat. Process. Technol. 2020, 282, 116668. [Google Scholar] [CrossRef]
- Wu, X.Y.; Zhang, Y.Q.; Tan, Y.W.; Li, G.S.; Peng, K.W.; Zhang, B. Flow-visualization and numerical investigation on the optimum design of cavitating jet nozzle. Pet. Sci. 2022, 19, 2284–2296. [Google Scholar] [CrossRef]
- Alehossein, H.; Qin, Z. Numerical analysis of Rayleigh–Plesset equation for cavitating water jets. Int. J. Numer. Methods Eng. 2007, 72, 780–807. [Google Scholar] [CrossRef]
- Peng, G.; Shimizu, S.; Fujikawa, S. Numerical simulation of cavitating water jet by a compressible mixture flow method. J. Fluid Sci. Technol. 2011, 6, 499–509. [Google Scholar] [CrossRef][Green Version]
- Hsiao, C.T.; Jayaprakash, A.; Kapahi, A.; Choi, J.K.; Chahine, G.L. Modelling of material pitting from cavitation bubble collapse. J. Fluid Mech. 2014, 755, 142–175. [Google Scholar] [CrossRef]
- Peng, G.Y.; Yang, C.X.; Oguma, Y.; Shimizui, S. Numerical analysis of cavitation cloud shedding in a submerged water jet. J. Hydrodyn. 2016, 28, 986–993. [Google Scholar] [CrossRef]
- Trummler, T.; Schmidt, S.J.; Adams, N.A. Numerical prediction of erosion due to a cavitating jet. Wear 2022, 498–499, 204304. [Google Scholar] [CrossRef]
- Okada, T.; Iwai, Y.; Hattori, S.; Tanimura, N. Relation between impact load and the damage produced by cavitation bubble collapse. Wear 1995, 184, 231–239. [Google Scholar] [CrossRef]
- Laborde, J.-L.; Bouyer, C.; Caltagirone, J.-P.; Gerard, A. Acoustic cavitation field prediction at low and high frequency ultra sounds. Ultrasonics 1998, 36, 581–587. [Google Scholar] [CrossRef]
- Escaler, X.; Farhat, M.; Avellan, F.; Egusquiza, E. Cavitation erosion tests on a 2D hydrofoil using surface-mounted obstacles. Wear 2003, 254, 441–449. [Google Scholar] [CrossRef]
- Dular, M.; Bachert, B.; Stoffel, B.; Sirok, B. Relationship between cavitation structures and cavitation damage. Wear 2004, 257, 1176–1184. [Google Scholar] [CrossRef]
- Krefting, D.; Mettin, R.; Lauterborn, W. High-speed observation of acoustic cavitation erosion in multibubble systems. Ultrason. Sonochem. 2004, 11, 119–123. [Google Scholar] [CrossRef] [PubMed]
- Zeqiri, B.; Hodnett, M.; Carroll, A.J. Studies of a novel sensor for assessing the spatial distribution of cavitation activity within ultrasonic cleaning vessels. Ultrasonics 2006, 44, 73–82. [Google Scholar] [CrossRef]
- Dular, M.; Osterman, A. Pit clustering in cavitation erosion. Wear 2008, 265, 811–820. [Google Scholar] [CrossRef]
- Franc, J.-P.; Riondet, M.; Karimi, A.; Chahine, G.L. Material and velocity effects on cavitation erosion pitting. Wear 2012, 274–275, 248–259. [Google Scholar] [CrossRef]
- Dular, M.; Delgosha, O.C.; Petkovsek, M. Observations of cavitation erosion pit formation. Ultrason. Sonochem. 2013, 20, 1113–1120. [Google Scholar] [CrossRef] [PubMed]
- Hattori, S.; Taruya, K.; Kikuta, K.; Tomaru, H. Cavitation erosion of silver plated coatings considering thermodynamic effect. Wear 2013, 300, 136–142. [Google Scholar] [CrossRef]
- Petkovsek, M.; Dular, M. Simultaneous observation of cavitation structures and cavitation erosion. Wear 2013, 300, 55–64. [Google Scholar] [CrossRef]
- Choi, J.-K.; Jayaprakash, A.; Kapahi, A.; Hsiao, C.-T.; Chahine, G.L. Relationship between space and time characteristics of cavitation impact pressures and resulting pits in materials. J. Mater. Sci. 2014, 49, 3034–3051. [Google Scholar] [CrossRef]
- Dular, M.; Petkovsek, M. On the mechanisms of cavitation erosion, Coupling high speed videos to damage patterns. Exp. Therm. Fluid Sci. 2015, 68, 359–370. [Google Scholar] [CrossRef]
- Choi, J.-K.; Chahine, G.L. Relationship between material pitting and cavitation field impulsive pressures. Wear 2016, 352–353, 42–53. [Google Scholar] [CrossRef]
- Fujisawa, N.; Kikuchi, T.; Fujisawa, K.; Yamagata, T. Time-resolved observations of pit formation and cloud behavior in cavitating jet. Wear 2017, 386, 99–105. [Google Scholar] [CrossRef]
- Arndt, R.E.; Paul, S.; Ellis, C.R. Application of piezoelectric film in cavitation research. J. Hydraul. Eng. 1997, 123, 539–548. [Google Scholar] [CrossRef]
- Wang, Y.C.; Huang, C.H.; Lee, Y.C.; Tsai, H.H. Development of a PVDF sensor array for measurement of the impulsive pressure generated by cavitation bubble collapse. Exp. Fluids 2006, 41, 365–373. [Google Scholar] [CrossRef]
- Wang, Y.C.; Chen, Y.W. Application of piezoelectric PVDF film to the measurement of impulsive forces generated by cavitation bubble collapse near a solid boundary. Exp. Therm. Fluid Sci. 2007, 32, 403–414. [Google Scholar] [CrossRef]
- Hattori, S.; Hirose, T.; Sugiyama, K. Prediction method for cavitation erosion based on measurement of bubble collapse impact loads. Wear 2010, 269, 507–514. [Google Scholar] [CrossRef]
- Soyama, H.; Sekine, Y.; Saito, K. Evaluation of the enhanced cavitation impact energy using a PVDF transducer with an acrylic resin backing. Measurement 2011, 44, 1279–1283. [Google Scholar] [CrossRef]
- Sugimoto, Y.; Yamanishi, Y.; Sato, K.; Moriyama, M. Measurement of bubble behavior and impact on solid wall induced by fiber-holmium: YAG laser. J. Flow Control Meas. Vis. 2015, 3, 135–143. [Google Scholar]
- Hujer, J.; Müller, M. Calibration of pvdf film transducers for the cavitation impact measurement. In Proceedings of the EFM17—Experimental Fluid Mechanics 2017, Mikulov, Czech Republic, 21–24 November 2017. [Google Scholar]
- Kang, C.; Liu, H.; Soyama, H. Estimation of aggressive intensity of a cavitating jet with multiple experimental methods. Wear 2018, 394–395, 176–186. [Google Scholar] [CrossRef]
- Chen, J.C.; Chang, H.Y.; Chen, J.J.; Chen, G.S. A piezoceramic sensor for detection of focused ultrasound-induced cavitation. IEEE Sens. J. 2019, 19, 10379–10385. [Google Scholar] [CrossRef]
- Hayashi, S.; Sato, K. Unsteady behavior of cavitating waterjet in an axisymmetric convergent-divergent nozzle: High speed observation and image analysis based on frame difference method. J. Flow Control Meas. Vis. 2014, 2, 94–104. [Google Scholar] [CrossRef]
- Watanabe, R.; Kikuchi, T.; Yamagata, T.; Fujisawa, N. Shadowgraph imaging of cavitating jet. J. Flow Control Meas. Vis. 2015, 3, 106–110. [Google Scholar] [CrossRef]
- Peng, K.; Tian, S.; Li, G.; Huang, Z.; Zhang, Z. Cavitation in water jet under high ambient pressure conditions. Exp. Therm. Fluid Sci. 2017, 89, 9–18. [Google Scholar] [CrossRef]
- Fujisawa, N.; Fujita, Y.; Yanagisawa, K.; Fujisawa, K.; Yamagata, T. Simultaneous observation of cavitation collapse and shock wave formation in cavitating jet. Exp. Therm. Fluid Sci. 2018, 94, 159–167. [Google Scholar] [CrossRef]
- Peng, C.; Tian, S.; Li, G. Joint experiments of cavitation jet: High-speed visualization and erosion test. Ocean Eng. 2018, 149, 1–13. [Google Scholar] [CrossRef]
- Fujisawa, N.; Horiuchi, T.; Fujisawa, K.; Yamagata, T. Experimental observation of the erosion pattern, pits, and shockwave formation in a cavitating jet. Wear 2019, 418–419, 265–272. [Google Scholar] [CrossRef]
- Settles, G.S. Schlieren and Shadowgraph Techniques, Visualizing Phenomena in Transparent Media; Springer Science & Business Media: Berlin/Heidelberg, Germany, 2012; pp. 111–122. [Google Scholar]
- Berkooz, G.; Holmes, P.; Lumley, J.L. The proper orthogonal decomposition in the analysis of turbulent flows. Annu. Rev. Fluid Mech. 1993, 25, 539–575. [Google Scholar] [CrossRef]
- Bernero, S.; Fielder, H.E. Application of particle image velocimetry and proper orthogonal decomposition on the study of a jet in counterflow. Exp. Fluids 2000, 29, S274–S281. [Google Scholar] [CrossRef]
- Watanabe, R.; Gono, T.; Yamagata, T.; Fujisawa, N. Three-dimensional flow structure in highly buoyant jet by scanning stereo PIV combined with POD analysis. Int. J. Heat Fluid Flow 2015, 52, 98–110. [Google Scholar] [CrossRef]
- Peng, G.Y.; Shimizu, S. Progress in numerical simulation of cavitating water jets. J. Hydrodyn. 2013, 25, 502–509. [Google Scholar] [CrossRef]
- Peng, G.; Okada, K.; Yang, C.; Oguma, Y.; Shimizu, S. Numerical simulation of unsteady cavitation in a high-speed water jet. Int. J. Fluid Mach. Syst. 2016, 9, 66–74. [Google Scholar] [CrossRef][Green Version]
- Yang, Y.; Li, W.; Shi, W.; Zhang, W.; El-Emam, M.A. Numerical investigation of a high-pressure submerged jet using a cavitation model considering effects of shear stress. Processes 2019, 7, 541. [Google Scholar] [CrossRef]
- Onishi, T.; Peng, Y.; Ji, H.; Peng, G. Numerical simulations of cavitating water jet by an improved cavitation model of compressible mixture flow with an emphasis on phase change effects. Phys. Fluids 2023, 35, 073333. [Google Scholar] [CrossRef]
- Li, L.; Xu, Y.; Ge, M.; Wang, Z.; Li, S.; Zhang, J. Numerical investigation of cavitating jet flow field with different turbulence models. Mathematics 2023, 11, 3977. [Google Scholar] [CrossRef]
- Schreiner, F.; Haese, M.G.; Skoda, R. Three-dimensional flow simulation and cavitation erosion modeling for the assessment of incubation time and erosion rate. Wear 2023, 524–525, 204747. [Google Scholar] [CrossRef]
- Liu, H.; Xu, Y.; Wang, Z.; Zhang, J.; Wang, J. Experimental and numerical simulations to examine the mechanism of nozzle geometry affecting cavitation water jets. Geoenergy Sci. Eng. 2024, 233, 212511. [Google Scholar] [CrossRef]
- Xu, Y.; Tian, J.; Wang, Z.; Zhang, J.; Li, S.; Yan, Y.; Ge, M. A comprehensive study on the flow field of cylindrical cavitation nozzle jet under different turbulence models. Ocean Eng. 2025, 315, 119596. [Google Scholar] [CrossRef]
- Fujisawa, N.; Yamagata, T.; Seki, R.; Ohki, M. Erosion mechanism of a cavitating jet on groove roughness. Fluids 2020, 6, 6. [Google Scholar] [CrossRef]
- Li, G.; Shi, H.; Liao, H.; Shen, Z.; Niu, J.; Huang, Z.; Luo, H. Hydraulic pulsed cavitating jet-assisted drilling. Pet. Sci. Technol. 2009, 27, 197–207. [Google Scholar] [CrossRef]
- Li, Z. Criteria for jet cavitation and cavitation jet drilling. Int. J. Rock Mech. Min. Sci. 2014, 71, 204–207. [Google Scholar] [CrossRef]
- Yuan, C.; Song, J.; Zhu, L.; Liu, M. Numerical investigation on cavitating jet inside a poppet valve with special emphasis on cavitation-vortex interaction. Int. J. Heat Mass Transf. 2019, 141, 1009–1024. [Google Scholar] [CrossRef]
- Zhang, Y.; Zhao, K.J.; Wu, X.; Tian, S.; Shi, H.; Wang, W.; Zhang, P. An innovative experimental apparatus for the analysis of natural gas hydrate erosion process using cavitating jet. Rev. Sci. Instrum. 2020, 91, 095107. [Google Scholar] [CrossRef]
- Holmes, A.; Ewing, D.; Ching, C.Y.; Fujisawa, N. Experimental study on boiling instability and occurrence of cavitation in a two-phase square pipe subjected to natural convection. Heat Mass Transf. 2020, 56, 2975–2982. [Google Scholar] [CrossRef]
- Soyama, H. Cavitation peening: A review. Metals 2020, 10, 270. [Google Scholar] [CrossRef]
- Yuan, C.; Zhu, L.; Du, Z.; Liu, S. Numerical investigation into the cavitating jet inside water poppet valves with varied valve seat structures. Eng. Appl. Comput. Fluid Mech. 2021, 15, 391–412. [Google Scholar] [CrossRef]
- Liu, B.; Gao, Y.; Ma, F. Aggressive ability improvement of self-resonating cavitating jets with double-hole nozzle. J. Pet. Sci. Eng. 2022, 214, 110476. [Google Scholar] [CrossRef]
- Ge, M.; Sun, C.; Zhang, G.; Coutier-Delgosha, O.; Fan, D. Combined suppression effects on hydrodynamic cavitation performance in Venturi-type reactor for process intensification. Ultrason. Sonochem. 2022, 86, 106035. [Google Scholar] [CrossRef]
- Ge, M.; Sun, C.; Zhang, X.; Coutier-Delgosha, O.; Zhang, G. Synchrotron X-ray based particle image velocimetry to measure multiphase streamflow and densitometry. Radiat. Phys. Chem. 2022, 200, 110395. [Google Scholar] [CrossRef]
- Usta, O.; Köksal, Ç.S.; Korkut, E. A systematic study into the cavitation erosion test for marine propeller materials by cavitating jet technique. Ocean Eng. 2023, 284, 115252. [Google Scholar] [CrossRef]
- Wang, T.; Li, G.; Song, M.; Zhao, Y.; Xu, W.; Zhao, F.; Wang, X. Multi-objective parameter optimized design of self-oscillating cavitation jet nozzles. Energies 2023, 16, 6737. [Google Scholar] [CrossRef]
- Zhao, Y.; Li, G.; Zhao, F.; Wang, X.; Xu, W. Analysis of macroscopic cavitation characteristics of a self-excited oscillating cavitation jet nozzle. J. Appl. Fluid Mech. 2023, 16, 2130–2141. [Google Scholar] [CrossRef]
- Wu, W.; Xu, Y.; Yan, Y.; Li, S.; Zhang, J.; Wang, Z. Investigation on the flow characteristics of rotating nozzle cavitation water jet flow field. J. Appl. Fluid Mech. 2024, 17, 2637–2651. [Google Scholar] [CrossRef]
- Yuan, G.; Ni, B.J.; Wu, Q.; Lu, W.; Xue, Y. Experimental study on ice breaking by a cavitating water jet in a Venturi structure. Appl. Therm. Eng. 2024, 239, 122095. [Google Scholar] [CrossRef]
- Zhang, H.; Fan, C.; Wang, L.; Lu, W.; Li, D. The generation methods and applications of cavitating jet by using bubble collapse energy. Energies 2024, 17, 5902. [Google Scholar] [CrossRef]
- Liu, H.; Nie, Z.; Liu, R.; Zhang, M. Research on jet characteristics of new composite cavitation nozzle. Proc. Inst. Mech. Eng. Part C J. Mech. Eng. Sci. 2025, 239, 6360–6372. [Google Scholar] [CrossRef]
- Zhang, X.; Liu, B.; Zhu, R.; Zhang, M.; Wang, S.; Li, B.; Xie, Z. Investigation on unsteady flow characteristics of an artificial-submerged cavitating jet based on the LES approach. Ocean Eng. 2025, 316, 119989. [Google Scholar] [CrossRef]
- Hu, X.; Yang, X.; Liu, J.; Wu, D.; Liu, Y. Improving cavitating jet erosion efficiency using a multi-orifice nozzle: Experimental and numerical study. Phys. Fluids 2025, 37, 085180. [Google Scholar] [CrossRef]
- Xie, Z.; Shi, W.; Zheng, Y.; Tan, L.; Tian, Q.; Cao, Y.; Zhou, J.; Ge, X. Simulation investigation on impact damage characteristics of metal plate by cavitating bubble micro-jet water hammer. Eng. Fail. Anal. 2020, 115, 104626. [Google Scholar] [CrossRef]
- Okita, K.; Miyamoto, Y.; Furukawa, T.; Takagi, S. Numerical study on stress in a solid wall caused by the collapse of a cavitation bubble cloud in hydraulic fluid. Int. J. Multiph. Flow 2022, 150, 103965. [Google Scholar] [CrossRef]
- Xiong, J.; Liu, Y.; Li, C.; Zhou, Y.; Li, F. Quantitative evaluation of the microjet velocity and cavitation erosion on a copper plate produced by a spherical cavity focused transducer at the high hydrostatic pressure. Ultrason. Sonochem. 2022, 82, 105899. [Google Scholar] [CrossRef]
- Shen, X.; Han, W.; Li, R.; Yang, S.; Nan, H.; Bai, L.; Dong, Y. Investigation of the impact load characteristics of micro-jet induced by cavitation collapse on rigid wall surface. Chem. Eng. J. 2024, 501, 157686. [Google Scholar] [CrossRef]
- Wang, J.; Wang, Z.; Xu, Y.; Yan, Y.; Xu, X.; Li, S. Evolution of cavitation clouds under cavitation impinging jets based on three-view high-speed visualization. Geoenergy Sci. Eng. 2024, 237, 212832. [Google Scholar] [CrossRef]
- Wei, L.; Liu, S.; Dong, F. Mechanism study of micro-jet generation induced by acoustic cavitation. J. Hydrodyn. 2024, 36, 1104–1117. [Google Scholar] [CrossRef]
- Li, J.; Luo, J.; Chen, S.; Qu, T.; Xu, W. Interaction between cavitation bubbles and cavitation erosion pits. Tribol. Int. 2025, 213, 111101. [Google Scholar] [CrossRef]


Disclaimer/Publisher’s Note: The statements, opinions and data contained in all publications are solely those of the individual author(s) and contributor(s) and not of MDPI and/or the editor(s). MDPI and/or the editor(s) disclaim responsibility for any injury to people or property resulting from any ideas, methods, instructions or products referred to in the content. |
© 2025 by the author. Licensee MDPI, Basel, Switzerland. This article is an open access article distributed under the terms and conditions of the Creative Commons Attribution (CC BY) license.