Abstract
High-pressure water jet technology is widely utilized for cleaning marine artificial structures due to its portability, efficiency, and environmental friendliness, yet traditional jets underperform in submerged environments. Gas-assisted water jet technology has predominantly been applied to rock breaking—where vertical forces are prioritized—with insufficient research into flow regime evolution, limiting its utility for cleaning applications. This study introduces a supercavitating high-pressure water jet aimed at improving underwater cleaning efficiency while lowering economic costs. Employing ANSYS Fluent—with the RNG k-ε turbulence model and mixture model—validated via high-speed camera experiments, we explored the flow regime evolution of both unconstrained and semi-constrained impinging jets. The key findings of this paper are as follows: The cavity evolves with a periodic “necking-bubbling” pattern, whose intensity correlates positively with gas outlet velocity and supply rate; moderate gas supply—with 120 L/min identified as optimal through orthogonal analysis—effectively delays water jet breakup. For semi-constrained jets, the wall-adjacent gas flow also exhibits “necking-bubbling”; small-angle impact (30° versus 60°) reduces near-wall shear vortices, enhancing gas cavity stability on the target plate. This study bridges the gap between gas-assisted jet technology and underwater cleaning requirements, offering theoretical insights and optimized parameters for efficient, low-cost marine structure cleaning. It thereby supports the sustainable exploitation of marine resources and the stable operation of key marine facilities.
1. Introduction
As global terrestrial resources become increasingly depleted, marine resource exploitation has emerged as a strategic priority for the international community. Subsea production systems and marine surface treatment technologies have overcome key marine environmental constraints, unlocking vast prospects for marine resource development [1]. However, the long-term immersion of core marine infrastructure (e.g., offshore platforms and ship hulls) in seawater gives rise to severe biofouling and corrosion issues, creating an urgent demand for advanced underwater cleaning technologies.
In the development process of China’s marine industry, ocean platforms, as the core infrastructure for offshore resource exploitation, are of self-evident importance. However, due to the long-term immersion in seawater, ocean platforms and ships are susceptible to corrosion and the influence of marine fouling organisms. This not only poses a threat to the security of the equipment but also shortens its service life. Particularly for ships, prolonged navigation in the ocean can lead to the attachment of various marine organisms and microorganisms to the hull, such as barnacles, seaweed, oysters, etc. These attachments not only spread with the ship to other sea areas, causing biological invasions and ecological imbalances, but also severely corrode the hull by secreting mucus, increasing the roughness and overall weight of the hull surface [2].
Traditional cleaning techniques typically require divers to operate high-speed rotating brushes underwater for equipment cleaning operations. This method not only demands that the operators possess masterly diving and underwater working skills but also involves intense physical labor, low work efficiency, and severe limitations on the water depth of operation. More critically, a large amount of debris splashes will be generated during the cleaning process, posing a potential safety threat to the workers and greatly reducing the safety of the operation [3].
Given the multitude of drawbacks associated with traditional cleaning methods, coupled with the increasing demand for cleaning of artificial structures in marine environments, there is an urgent need for a more efficient and safer cleaning technology. In fact, from the cleaning and drag reduction of ships to the cleaning and anti-corrosion of wind power pile foundations and the maintenance of offshore drilling platforms and cross-sea bridge pile foundations, efficient, purely physical, and intelligent cleaning technology has become indispensable. Considering the vast coastlines globally and the multitude of artificial structures built along the continental shelf, the cleaning of artificial structures in marine environments is undoubtedly a market with rich application scenarios and enormous potential.
Against this backdrop, high-pressure water jet cleaning technology under submerged conditions has emerged. It relies on the impact force of high-pressure water streams to remove biological fouling from surfaces such as ship hulls without the need for contact with the cleaned object, thereby circumventing some of the issues associated with traditional cleaning methods [4]. However, the efficiency of high-pressure cleaning in water will be affected due to the much higher viscosity of water compared to air. To enhance the cleaning efficiency, researchers have introduced cavitation effect, leading to the development of cavitation water jet technology [5]. This technology employs specially designed nozzles, and the low pressure formed locally by high-speed water jets can vaporize the surrounding water. The bubbles in the cavitation jet break when approaching the hull, resulting in extremely high local stresses and, consequently, greater cleaning ability [6]. Despite all this, compared to ground high-pressure water jet cleaning, its effective cleaning range underwater still needs to be improved.
Actually, since the 1940s and 1950s, high-pressure water jet technology has been utilized in mining extraction. Its application and research in the industrial sector have undergone continuous bubbling and deepening. Initially, the primary focus of exploration centered on augmenting water jet pressure to enhance its erosive performance. However, as technical research delved deeper, scholars gradually recognized that merely elevating pressure did not suffice to maximize the cleaning efficiency of the water jet [7]. Consequently, the research focus has shifted towards harnessing the full potential of the kinetic energy of the water jet. Since then, an array of novel jet technologies, encompassing pulse jets, cavitating jets, abrasive jets, abrasive slurry jets, and gas-assisted water jets, have sprung up vigorously, expanding the application scope of water jet technology from mining to a multitude of fields such as aerospace, marine, machinery, construction, transportation, forestry, textiles, and medicine [8].
Nevertheless, water jet technology still encounters formidable challenges when it comes to cleaning marine artificial bodies. Due to the prolonged immersion of most artificial bodies in seawater, the cleaning range and intensity of the water jet are significantly diminished when obstructed by ambient aquatic bodies [9]. Furthermore, it is pertinent to highlight that water jets are prone to cavitation when submerged. As the high-pressure jet passes through the nozzle, its velocity increases notably, leading to a precipitous drop in local pressure. Once the local pressure descends below the saturated vapor pressure at the operational temperature, cavitation bubbles emerge within the water jet [10,11,12]. The intricate processes of formation and annihilation of these bubbles wield a profound impact on the cleaning efficacy of the water jet.
The cleaning effect of microjets generated during the collapse of a single cavity under near-wall conditions on glass plates was investigated by Reuter et al. By varying the dimensionless cavity–wall collapse spacing, the researchers observed a multitude of distinct cleaning mechanism [13]. The impact effect of cavity collapse on the surfaces of hard aluminum alloy plate was explored by Soyama et al. Experimental results revealed that the fatigue life of these plates, cleaned by cavitation jet, was significantly enhanced. This finding lends substantial support to the application of water jets in the cleaning of marine artificial structures, such as ships [14]. The energy transport-based cavitation risk prediction model was proposed by Schenke and Terwisga, which offers an efficacious tool for evaluating potential damage during water jet cleaning. The model posits that when the cavitation bubble meets the collapse condition, its accumulated kinetic energy is converted into pressure waves, which then impact the jet target surface in a radial manner [15].
In recent years, the technology of cavitation water jet cleaning has seen development. Within this technology, a substantial amount of cavitation bubbles are induced in the vicinity of the high-velocity cleaning jet, and the target surface is impacted by a microjet generated from the collapse of these cavitation bubbles; this process results in an efficient cleaning effect. However, it is noteworthy that the cavitation phenomenon itself does not truly create an environment with low viscosity akin to that of air. Consequently, the jet impact efficiency still cannot match that of a terrestrial high-pressure water jet.
To tackle this challenge, gas-blown bubbles were introduced around the submerged water jet by Li, within the framework of rock-breaking experiments. The results revealed that the incorporation of gas vacuoles notably diminishes jet frictional resistance and energy loss, enhancing the effective working distance of the jet. Moreover, as the protective gas velocity increases, the jet’s isovelocity core length also tends to increase. Under atmospheric pressure submergence conditions, the isovelocity core length stabilizes at a gas velocity of 180 m/s, reaching approximately (13~14) D0, which corresponds to a 1.5~1.7-fold increase compared to a conventional submerged jet. Additionally, under both atmospheric and confining pressure submergence conditions, self-similarity is exhibited by the gas-protected jet [16]. In response to the issue of high jet resistance in the underwater environment, a novel method of transmedia jet rock breaking utilizing an underwater gas-assisted water jet was proposed by Liu. The influence of operating parameters and nozzle structural parameters on the rock-breaking performance of this underwater gas-assisted water jet was subsequently investigated. It was discovered that the volume of rock fragmentation first escalates and subsequently diminishes with an increment in airflow pressure. The determination of an optimal gas supply pressure at 0.4 MPa was made, which was found to be instrumental in optimizing the rock-breaking effect [17]. Giorgio and others summarized the models of bubble-induced turbulence (BIT) and the momentum exchange between bubble coalescence and breakup as well as the corresponding numerical simulation studies [18]. Akira SOU and others explored whether traditional cavitation numbers can be used to predict the formation of supercavitation in enhanced liquid jet atomization [19]. The results show that the thickness of the cavitation zone increases with the increase in the ratio Cu of the upstream nozzle cross-sectional area to the nozzle cross-sectional area, and the spray angle increases as Cu increases. The performance of underwater gas-assisted water jet technology for rock breaking has undergone in-depth research by Shang gang, employing numerical simulation and orthogonal test method. The results strongly suggest that whenever possible, high system pressure should be used. Moreover, the study reveals that an incidence angle of 75 degree and an erosion distance of 10 mm have been identified as the optimal parameters for underwater rock-breaking operations. Additionally, the use of an exponential nozzle is highly recommended [20]. The rock response and damage mechanism induced by a gas–liquid two-phase jet have undergone intensive investigation by Wang Rui. Revelations indicate that the interplay between high-pressure water and gas acts as a catalyst for alterations in rock pore structure and crack propagation. Moreover, a comparative analysis of the impact force exerted by high-pressure water jet, both with and without an air ring, on a given target has been conducted by Wang Rui, and the influence of air ring velocity on the speed and impact force of the water jet has also been deeply explored by him [21]. The impact of pivotal structural parameters of the jet nozzle on the kinetic properties of the jet through the orthogonal design method was investigated by Zhang, L. et al. Their objective was to delve into the variation patterns of multiple parameters, including the distribution of axial velocity, the velocities at different cross-sections, and the air content of the water jet with and without an air ring [22]. The underwater blasting effect of water jets, when accompanied by a coaxial protective airflow, was experimentally investigated by Poláček J. Upon comparison of the cutting depth across varying conditions, under appropriate pressure, it was determined that water jet exerts a destructive effect on materials at a target distance ranging from 60 to 120 mm [23]. In recent years, research based on supercavitation has expanded to areas such as aircraft [24] and underwater weapons [16,25].
Although previous studies have fully demonstrated the effectiveness of gas assistance in bolstering the performance of submerged jets and have deeply discussed the specific impacts of key parameters such as airflow velocity and system pressure on jet effects, current research and application of gas-assisted jets mainly focus on rock-breaking experiments and often emphasize maximizing rock-breaking ability through vertical impact. To date, no research has centered on the cleaning field, particularly the study of tangential impact jets that require large areas and high tangential forces.
However, there is still insufficient research and analysis on the flow regime evolution. When it comes to exploring the flow regime of a gas-assisted jet, existing research predominantly concentrates on an unconstrained low speed jet, and there is currently no clear understanding of the jet flow regime under high-speed and high-pressure conditions. Therefore, this study delves into the flow regime of a gas-assisted high-pressure water jet under a submerged environment and examines the scouring performance of the jet on a target plate at a tangential angle. The lack of this research limits a deeper understanding of the cleaning mechanism of this technology and hinders its further optimization and promotion in practical applications.
In order to investigate the flow regime evolution of supercavitating high-pressure water jets under submerged conditions and provide theoretical support for the cleaning application of this jet technology in submerged environments, this paper, based on existing research, adopts interdisciplinary theoretical methods such as thermodynamics and fluid mechanics and combines numerical simulation technology to study the behavior of supercavitating jets under various constraint conditions, including open spaces and impingement on target plates.
In conclusion, although existing research on gas-assisted jets has made progress in the field of rock breaking, there are two key limitations that hinder their application in underwater cleaning: first, the research focuses on vertical impact rock breaking, ignoring the requirements of large-area scouring and high tangential force needed for cleaning operations; second, research on flow field evolution is limited to low-speed jet scenarios, and there is a lack of effective basis for parameter optimization under high-speed and high-pressure underwater working conditions. To fill the above gaps, this paper conducts research through three innovations: adapting gas-assisted supercavitating jets to the needs of underwater cleaning and shifting to a tangential impact mode; establishing and validating a numerical model to systematically explore the evolution laws of flow fields under unconstrained and semi-constrained working conditions; clarifying the influence of key parameters on jet stability and cleaning performance, revealing the “necking-bubbling” mechanism and determining the optimal working conditions. This study effectively connects gas-assisted jet technology with the actual needs of underwater cleaning, fills the research gap in the evolution of high-speed and high-pressure flow fields, and the relevant theoretical results and optimized parameters not only provide theoretical support for tangential impact cleaning technology but also offer an efficient and low-cost solution for the cleaning of marine artificial structures, ultimately contributing to the sustainable development of marine resources and the stable operation of key facilities.
2. Methods
A numerical model of the supercavitating jet, constructed utilizing ANSYS (2022) Fluent numerical simulation software, is presented in this study. The model’s accuracy was verified through a comparison of simulation results against experimental data captured by a high-speed camera, thereby assessing its reliability. Following this validation, through numerical simulations, further exploration was conducted on the flow regime evolution of the jet under unconstrained and semi-constrained conditions of impacting the target plate, and the impact of varying operational parameters on its generation also underwent examination.
2.1. Jet Experiment Apparatus
Figure 1 elegantly depicts the structural design of the nozzle, which is composed of two primary elements: the nozzle holder and the nozzle cover. The nozzle holder’s rear end is affixed to the high-pressure water jet generator via a water hose engineered to withstand high pressures to ensure that it can withstand the impact of high-pressure water flow. Within the nozzle holder, a pressure equalization chamber is integrated. When the nozzle cover is secured to the nozzle holder, a slit emerges between this chamber and the cover. Gas is introduced into the pressure equalization chamber through the upper air pipe and, constrained by the downstream slit, is uniformly disseminated throughout the pressure equalization chamber before being evenly expelled through the slit. This innovative design ensures that the gas jet uniformly wraps around the water jet nozzle—even when supplied by a single air pipe—generating an annular airflow effect that reduces the ambient resistance of the water jet in submerged environment.
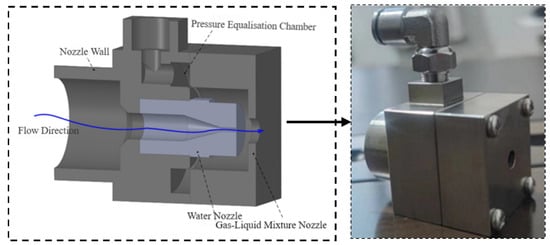
Figure 1.
Supercavitating high-pressure water jet nozzle structure.
Figure 2 illustrates the experimental platform for the submerged water jet, which consists of three main components: a submerged pool, an air compressor, and a water jet generation nozzle. To meticulously record the evolution of the water jet flow regime, a Phantom veo 1310 high-speed camera was utilized within the scope of this study.
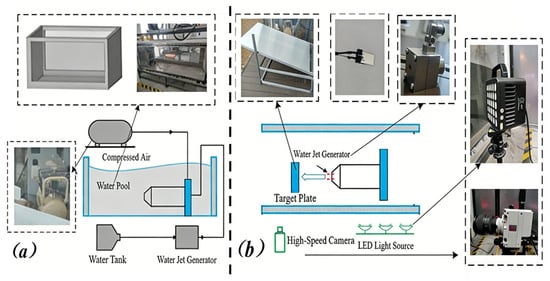
Figure 2.
Submerged water jet experimental platform side view (a) and top view (b).
To obtain the evolution law of the water jet flow regime, the initial step taken by this study involved arranging the supercavitating jet generator within the submerged pool, as depicted in Figure 3. Initially, the aperture of the lens was set to a fixed value; subsequently, the focal length of the lens was adjusted and secured. These adjustments were made to ensure adequate light intake and to maintain a consistent depth of field across varying operational conditions.
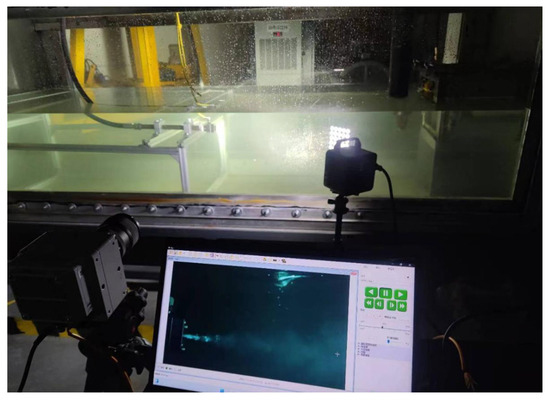
Figure 3.
Experimental device for evolution law of water jet flow regime.
Subsequently, the pressures of water and gas supply were meticulously regulated. Under varying operational conditions, the evolution of gas-assisted jet flow regime was meticulously documented by a high-speed camera. To ensure the detailed capture of the jet outlet and its distal development pattern, adjustments were made as necessary to the position of the high-speed camera, thereby altering the field of view.
2.2. Numerical Model
To simplify the numerical simulation and concentrate on core physical mechanisms, a set of rationalized assumptions is proposed herein. Firstly, the RNG k-ε turbulence model was employed to characterize turbulent behavior, as this model has been validated in prior jet studies for its precision in predicting high-speed, high-pressure turbulent flows—particularly cavitating jets with strong shear effects. Secondly, the mixture model was adopted for gas–liquid two-phase flow simulations, given its suitability for dense multiphase flows with moderate slip velocities, which aligned with the gas–liquid interaction features of supercavitating jets. Thirdly, the free surface was defined as a symmetric boundary and the computational domain periphery as an outlet boundary; the symmetric boundary eliminated convective/diffusive flux at the free surface, while expanding the computational domain ensured turbulence equilibrium in non-main flow regions. Finally, water and gas were treated as incompressible fluids: the jet pressure (≤20 MPa) and gas velocity (≤300 m/s) fell within the incompressible range for water (Mach number < 0.3), and gas compressibility effects were negligible under low-pressure gas supply conditions (≤0.3 MPa).
Simulations of the models were carried out using ANSYS Fluent, based on poly-hex core meshes that passed a grid independent test. To practically implement the supercavitation phenomenon in the gas-assisted model, the process integrated the RNG k-ε turbulence model and the mixture model to characterize high-speed, high-pressure gas–liquid two-phase flow. These models underwent validation through several jet studies [16,17,20,21].
The concept of the mass conservation equation in multiphase flow, known as the continuity equation, is defined by the change in mass per unit time, which is equivalent to the summation of the mass inflow at the boundary and the mass produced by the internal source within the region. Meanwhile, the total mass is expected to maintain a constant level. This principle is clearly demonstrated in Equation (1) [26].
In Equation (1), represents the mass-averaged velocity of the mixed fluid, which is defined as follows:
In Equation (1), denotes the density of the mixed fluid, and its definition is as follows:
In Equation (3), refers to the volume fraction of component k in the mixture.
The momentum equation for the mixture is derived by summing the individual momentum equations of all phases. It can be expressed as shown in Equation (4):
In Equation (4), represents the number of phases in multiphase flow, denotes the body force acting on a fluid element, and refers to the mixture viscosity, which can be calculated using the following expression:
In Equation (5), represents the drift velocity of the secondary phase, which can be calculated using the following expression:
The turbulence model is conceptualized as if the transient motion of turbulence is regarded as a composite of time-averaged and stochastic pulsation movements. As per the Reynolds time averaging method, the instantaneous value of the physical quantity can be articulated as a combination of the average and pulsation value. When this instantaneous value is reintroduced into the N-S equation, the Reynolds stress equation is derived. This equation features an additional component linked to the pulsation quantity, termed the Reynolds stress. To finalize the equation, the k-ε model, encompassing turbulent kinetic energy and turbulent kinetic energy dissipation rate [27], is employed. These two parameters serve to finalize and complement the Reynolds stress. The corresponding expression is presented hereinafter.
Turbulent kinetic energy [28] is as follows:
Dissipation rate is as follows:
The momentum equation (Equation (4)) captures dynamic behavior by incorporating viscous stresses, body forces, and interfacial momentum transfer through drift velocity (Equation (6)). The RNG k-ε model (Equations (7) and (8)) resolves turbulent fluctuations triggering cavitation when local pressure drops below saturated vapor pressure, while dimensionless groups (Re, Eu, ∏Q, Fr) guide parameter optimization.
Dimensional analysis based on Buckingham Pi theorem identifies core dimensionless groups governing the flow regime of gas-assisted supercavitating jets, simplifying the multiphase flow system and guiding simulations and experiments. Key physical quantities include p (water jet pressure), Q (gas supply rate), v (jet velocity), d (nozzle diameter), ρ (density), μ (viscosity), g (gravity), and σ (surface tension). Selecting ρ v d as fundamental dimensions, 4 core Pi groups are as follows:
- (1)
- Reynolds Number (Re): Re = ρvd/μ, characterizes inertial/viscous force ratio, dominating turbulence intensity and jet penetration.
- (2)
- Euler Number (Eu): Eu = p/(ρv2), reflects pressure-inertia balance, affecting cavitation stability and jet energy.
- (3)
- Dimensionless Gas Supply Rate (∏Q): ∏Q = Q/vd2: describes gas assistance intensity, determining gas layer thickness and jet protection effect.
- (4)
- Froude Number (Fr): Fr = v/, indicates inertial/gravity ratio; Fr > 50 in this study, so gravity’s impact is negligible.
These Pi groups simplify test design by reducing independent variables from 8 to 4, ensure consistent flow regime across different scales through similarity criteria, and guide key parameter optimization (e.g., Q = 120 L/min) by quantifying core mechanisms. They constrain the physical model and boundary conditions to guarantee simulation reliability.
2.3. Physical Model and Boundary Condition
In the preceding section, the nozzle geometry structure was elaborated upon. In this section, the focus shifts to modeling the flow field. As a result of the existence of pressure equalization slits, locally fine meshes emerge within the large-scale flow field. To circumvent the potential impact of these meshes on computational accuracy, this study initially delved into simplifying the numerical simulation of the nozzle structure.
Figure 4 illustrates the velocity cloud map distribution accompanied by velocity vectors of the nozzle structure before and after modeling simplification. In the original design, the pressure equalization bin was pivotal in facilitating the uniform diffusion of airflow, thereby securing a consistent outflow of gas from the outlet. Upon simplifying the inlet velocity while maintaining a constant inlet mass flow rate, it was observed that the outlet velocity retained a high degree of uniformity. Moreover, the axial and radial velocity distributions were essentially the same before and after the simplification process. Despite nuance in the flow patterns near the wall, such minute alterations in the flow field proved to have minimal impact on the subsequent evolution of the flow regime, primarily due to the fact that this region constitutes the core section of the water jet.
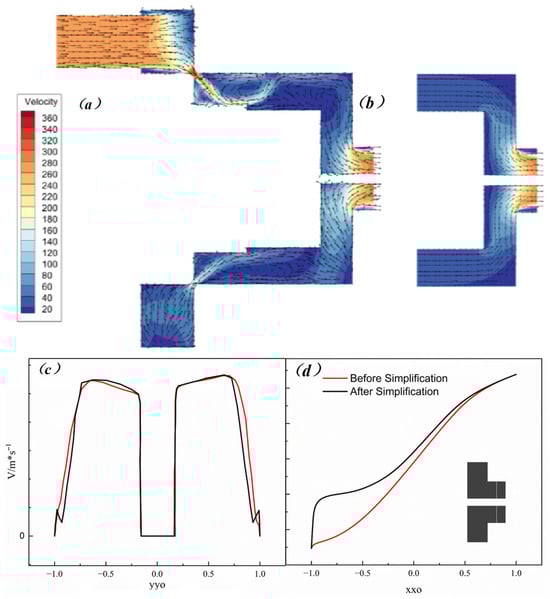
Figure 4.
Simplified comparison of nozzle structure modeling: (a) simplified pre-velocity distribution, (b) simplified post-velocity distribution, (c) radial velocity line chart before and after simplification, and (d) axial velocity line chart before and after simplification.
Figure 5 are presented as a computational model of a submerged supercavitating jet. The computational domain size of this model was rendered nondimensionalized by utilizing the inner diameter d of the water jet nozzle.
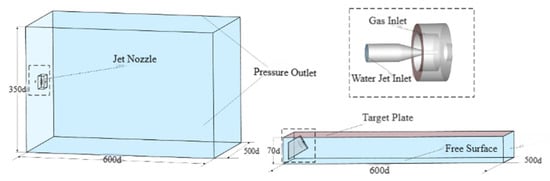
Figure 5.
Jet boundary definition diagram.
In this study, the water jet inlet was configured as a pressure inlet, whereas the gas jet inlet was set up as a velocity inlet. To guarantee equilibrium of turbulence distant from the main flow area, the computational domain was expanded, with the entire periphery of this domain being assigned as the outlet boundary. Furthermore, there was no convective or diffusive flux across the free surface of the submerged jet, and the gradient of flow parameters like velocity and gas volume fraction at the free surface was zero. Thus, to avoid outlet fluid directly opposite the target plate being drawn into the jet area, which could otherwise impact the flow, the free interface was designated as a symmetric boundary. This arrangement ensured an absence of convective and diffusive flux at the boundary.
In this study, the transient control equations were discretized by employing the finite volume method, aiming to simulate the flow regime. The time integrals were resolved through a second-order implicit scheme. For the convective terms, central difference format was selected, and these terms were computed by combining explicit body forces with an explicit multiphase flow model.
2.3.1. Verification of Grid Independence
In the grid-independence validation process, an evaluation was conducted utilizing the Grid Convergence Index (GCI) [29], which serves to quantify the computational errors attributable to varying grid quantities. The GCI, as applied in grid analysis, is delineated within Equation (9):
In Equation (9), is defined as the root mean squared error of the physical quantity of interest. The linear mesh refinement factor, denoted as , is utilized, with being set to √2 and being assigned a value of 2 in this study [30]. The safety factor, represented as , when applied over a range of three to more grids, is observed to adopt a value of 1.25.
In this study, the physical quantities of interest, encompassing velocity and turbulent kinetic energy, were selected for verification of grid independence on the central axis of the nozzle, as shown in Figure 6. To enhance computational efficiency, the RANS model and an implicit volume two-phase model were employed in this study, which were utilized to conduct steady-state calculations on four distinct geometric models across varying grid densities. Four grid densities were considered: the first grid density (780,678), the second (1,387,879), the third (2,370,919), and the fourth (4,074,966). The coarse grid was derived by thickening the fine grid by a factor of √2 in each direction. At the nozzle outlet, the size of the finest grid was designated to be 0.1 mm.
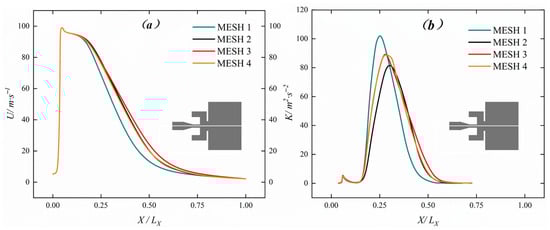
Figure 6.
The axial velocity (a) and turbulent kinetic energy; (b) the distribution of unconstrained jet.
Figure 6 presents the distribution of axial velocity and turbulent kinetic energy of the unconstrained jet under different grid densities. It can be seen that the results have attained stability upon the grid being encrypted to the third grid, revealing no notable disparity when juxtaposed with the outcomes derived from the further encrypted fourth grid. The average GCI for unconstrained grid velocities spanning from the third grid to the fourth grid stood at 2.87%. The outcomes of the independence test fell beneath the convergence criterion, whereas the leftover GCIs are enumerated in Table 1. Consequently, in the succeeding simulations, the third grid was chosen for computation.

Table 1.
Velocity and turbulent kinetic energy GCI distribution under unconstrained conditions.
After the mesh size of the unconstrained jet region was determined, the mesh near the wall of the impact target plate underwent further independence verification. During this verification process, the thickness of the first layer of the grid, as calculated by y+, remained constant. By employing the encryption logic mentioned above, three sets of grids with varying densities were created. In this section, turbulent kinetic energy was chosen for grid independence verification, specifically along the jet direction and along the axis at dimensionless distances x/d of 2 and 2.5 from the target plate. Figure 7 present the verification results, revealing that when encrypting to the second grid, the discrepancies in grid simulation outcomes were already minimal. Consequently, this study adopted the second grid for subsequent numerical computations. The final calculation grid, as depicted in Figure 8, was utilized.
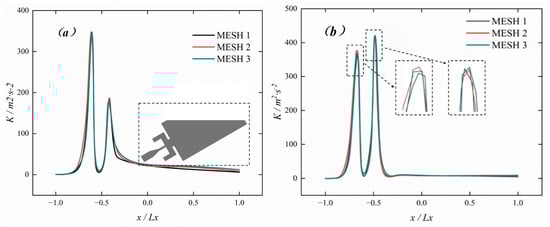
Figure 7.
Axial turbulent kinetic energy distribution of impact target grid. (a) z/d = 2 (b) z/d = 2.5.
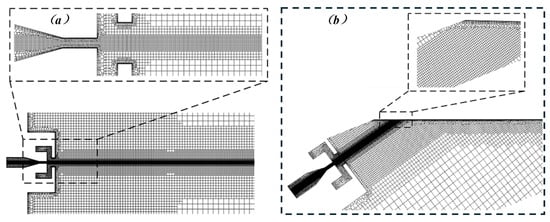
Figure 8.
The super-vacuum jet computational domain grid. (a) An unconfined jet; (b) jet impingement on a target plate.
2.3.2. Verification of Grid Accuracy
To enhance the reliability of the numerical model, the correctness of the simulation was verified in this section by adopting the aforementioned physical model along with the validated mathematical model. The verification process encompassed three primary components: the verification of time step independence, a comparative analysis contrasting numerical and theoretical calculation results, and a corroborative examination of numerical simulation outcomes against experimental findings.
In transient computation involving unsteady flow, the grid size and time step are found to exert a profound influence on the stability of the calculations. The Courant number stands as a crucial parameter, elucidating the relative relationship between time step and spatial lag, as delineated in Equation (10). Based on ANSYS providers and numerous investigations, it is advised that when undertaking explicit scheme for multiphase flow, the Courant number should be maintained within a range below 5 [31]. Hence, in this study, the Courant number was fixed at 5, and a strategy for setting time step was implemented, grounded in adaptive adjustments based on this number. Through this approach, the issue of numerical instability, potentially arising from disparities in time step, was mathematically resolved.
In the formula, the minimum grid size is defined by , set at 0.1 mm; the maximum Courant number is denoted by .
(1) Comparison of Simulation Calculation Outcomes with Theoretical Calculation Outcomes.
Numerous studies have elaborated on the theory of high-pressure water jet outlet velocity, and the currently accepted theoretical formula is presented in Equation (11) [32].
In the formula, is defined as the jet velocity, (m/s); is defined as the jet pressure, (MPa).
In Table 2, a comparison was made between the simulated outlet velocities of the water jet nozzle and the values calculated using the theoretical formula under various gas supply pressures; the results demonstrated a high degree of consistency between the two sets of data.
Table 2.
Comparison of theoretical and simulated values of different pressure jet velocities.
(2) Comparison of Numerical Simulation Outcomes with Experimental Outcomes.
In this study, experimental observations revealed that the cavity on the periphery of the unconstrained supercavitating jet exhibited a phenomenon of necking-bubbling. However, the stochastic nature of the necking-bubbling posed a challenge for its complete replication through numerical simulation. Thus, when numerical calculation simulates this phenomenon, it is considered that the numerical model is set correctly. The difficulty in maintaining stable control over experimental parameters often results in physical experimental observations that may not precisely align with simulation outcomes. Figure 9 illustrates that the numerical simulation had approximated the necking-bubbling phenomenon. However, the amplitude of the necking phenomenon depicted in the figure is relatively minor. It is hypothesized that this discrepancy may arise from the generation of numerous small bubbles due to the intense mixing of gas–liquid at the jet boundary, which obscures the jet’s surface and leads to an inconsistent observation of the necking degree with the actual state. Despite this, the flow regime of the external bubbles was successfully simulated by numerical calculations. Therefore, the numerical model was deemed accurate in this study.
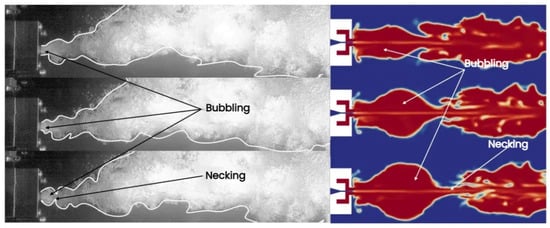
Figure 9.
The comparison between the experimental results and the simulation results of bubbling-necking phenomenon.
A comparative analysis between experimental and simulation outcomes is presented in Figure 10, viewed from an expanded perspective. The numerical simulation successfully captures the overall flow characteristics of the supercavitating jet, encompassing gas upward escape driven by buoyancy and bubble overflow. Nevertheless, minor discrepancies exist between the simulation results and experimental observations. The simulation underestimated the quantity of small bubbles at the jet boundary, which was ascribed to the inherent limitation of the mixture model in capturing micro-bubble formation. In addition, the bubble shape obtained from experiments exhibited higher irregularity due to unsteady ambient water disturbance, whereas the numerical simulation adopted the assumption of a relatively uniform flow field. The limitations of grid accuracy and the application of mixture models made it challenging to calculate the true structure of the bubbles with precision, but the key flow features, including the periodic “necking-bubbling” phenomenon of the cavity and the evolution of the gas–liquid interface, were consistent between the simulation and experiment. This consistency verified the reliability of the established numerical model and further confirmed that the RNG k-ε turbulence model coupled with the mixture model was applicable for simulating high-speed and high-pressure supercavitating jets, thereby providing a valid theoretical basis for subsequent flow regime analysis.
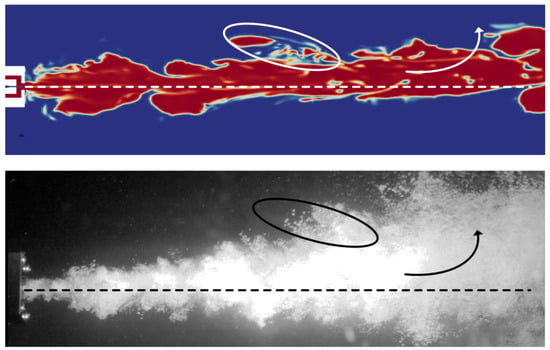
Figure 10.
The experimental results are compared with the simulation results.
In the experimental phase, impact data from various angles were captured. Owing to spatial constraints, data from the 30 degree impact under typical operating conditions were selected for comparative analysis, as illustrated in Figure 11. It was observed that a positive correlation persisted between the charge quantity and the force magnitude applied. Consequently, the numerical simulation value at point P0 was employed as the reference standard for the conversion of experimental values in this section so that this facilitated the comparison of pressures on the target plate. The numerical simulation was deemed accurate when its force trend aligned with that of the experimental results.
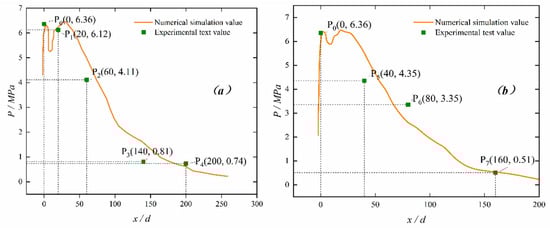
Figure 11.
Comparison of experimental measurements and numerical simulation values of impinging jets. (a) Axial data; (b) lateral data.
The trend of force variation at different points was observed to be similar to that of the impact simulation values, with the same order of magnitude, and the maximum force was observed to be exerted at the stagnation point P0. It should be noted that the pressure near the stagnation point was found to increase again after an initial decrease. Analysis revealed that this was due to the near-wall jet transitioning from radial to tangential motion. Due to the velocity discontinuity between this jet and the upper environmental fluid, shear vortices were formed in the main flow area of the free jet. These shear vortices interacted with the main flow field, creating a local high-pressure zone not far downstream of the stagnation point. This observation was consistent with trends reported in the literature [33]. From a numerical perspective, using the experimental values as the baseline, the difference was quantified using the formula |Experimental Value—Simulation Value|/Experimental Value × 100%. The results show that the percentage differences at each measurement point ranged from 4.74% to 7.41%, with an average difference of only 5.30%. Among them, the differences in stagnation points and pressure-stable regions were less than 5%, while the differences in the rapid pressure decay region were slightly higher (7.41%) due to the complex vortex motion. These differences mainly arose from the limitations of the mixture model in capturing microbubbles, minor turbulent disturbances in the experimental environment, and mesh resolution limitations. However, the overall difference was far below the acceptable CFD simulation threshold of 10–15%, and the core working region showed minimal differences, with force trends and magnitudes completely consistent, fully validating the reliability of the RNG k-ε turbulence model coupled with the mixture model for simulating supercavitating jets under high pressure and high gas flow rates. Consequently, the numerical simulation results for the impact jet were deemed reliable.
3. Results and Discussion
The structure of the jet flow field will be impacted by various jet generation parameters, which in turn determines the cleaning effect of the jet. In this study, a numerical simulation of the supercavitating high-pressure water jet was conducted, focusing on the analysis of the flow field structure, velocity field, and volume fraction. The flow field structure of the supercavitating high-pressure water jet was explored under two working conditions: unconstrained open space and semi-confined impact target, considering different operating parameters.
3.1. Typical Flow Regime Evolution Law in Unconstrained Supercavitating Jet
The evolution of the flow regime in an unconstrained jet within open spaces is impacted by multiple factors, including nozzle geometric parameters and working parameters, leading to present different flow characteristics. Through numerical simulation analysis, it was found by this study that the initial momentum of the liquid jet is primarily affected by variations in the working parameters of the water jet. More specifically, an augmentation in the initial momentum of the liquid jet facilitates an extension of the water jet’s core section distance. However, under a submerged environment, when the liquid jet loses the protection of gas bubbles, its kinetic energy experiences a rapid decay. Consequently, gas bubbles hold a decisive role in shaping the flow regime evolution of a supercavitating jet. Preliminary calculations have revealed the existence of three typical flow regimes in a supercavitating jet. Hence, this section aims to provide an in-depth elaboration on the flow regime of three typical flow fields represented by the three gas supply parameters: low (40 L/min), medium (100 L/min), and high (200 L/min).
- (1)
- The gas supply rate is 40 L/min.
Figure 12 illustrates the distribution cloud map of gas and liquid volume fraction in the initial stage of jet development under unconstrained conditions. The working parameters are defined as follows: the pressure at the water jet nozzle inlet is defined as 10 MPa, the diameter of the water jet nozzle is defined as 1 mm, the diameter of the water jet nozzle outlet is defined as 6 mm, and the gas supply rate at the nozzle is defined as 40 L/min.
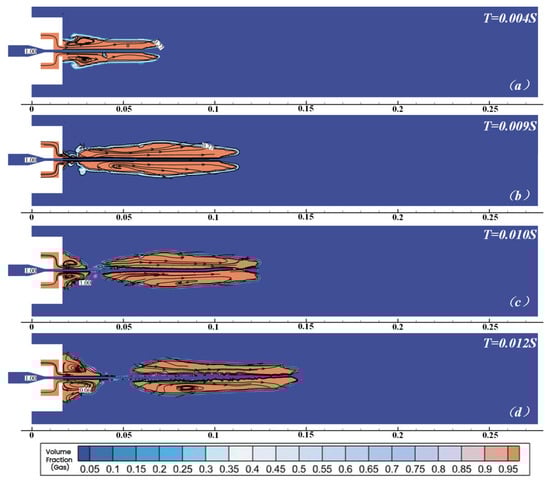
Figure 12.
The gas volume fraction of the unconstrained low-gas-supply jet in the initial stage of development. (a) T = 0.004 s; (b) T = 0.009 s; (c) T = 0.010 s; (d) T = 0.012 s.
In the initial stage of gas cavity formation (0.004 s), the gas cavity is not completely formed due to the small intake volume and the large momentum of the liquid jet. The front liquid jet, lacking the package of low-viscosity cavity areas, is directly exposed to the environmental medium. Consequently, the momentum of the liquid jet rapidly decays within a short period of time. Under submerged conditions, the development of the gas jet is significantly restricted due to the much higher density of the environmental medium compared to air. This results in uneven surface forces on the gas cavity, particularly in downstream areas where gas momentum is relatively low, hindering the development of a gas cavity at the top. However, the newly added gas jet at the rear maintains a large momentum. After being obstructed at the front end, a bubbling area gradually forms outside the jet, leading to the creation of a large vortex. This vortex structure induces external deformation of the jet and induces a trend of inward rotation in the external gas.
As the jet continues to develop, its flow regime evolution is observed to have transitioned into a novel phase. The necking phenomenon, triggered by the progression of vortices, has manifested at the rear of the initial cavity. This necking is attributed to the inward suction of internal vortices, which progressively penetrate the core area of the water jet. A deficiency in gas supply results in the low momentum of the subsequent gas replenishment, challenging the maintenance of cavity continuity with the gas of diminished momentum, as illustrated in Figure 12c. When necking occurs, a water jet area emerges, devoid of an air envelope. Consequently, the evolution of the flow regime during this stage exerts an adverse influence on the stability of the water jet.
As depicted in Figure 12d, with the further progression of the jet, cavities are reformed in the vicinity of the nozzle. Influenced by the resistance of the external medium, a bubbling structure similar to that of the previous cavity is exhibited by these newly formed cavities. Within the jet cavity, new inward rotating vortices are gradually formed.
In addition to the evolution of flow regime being analyzed, attention is also merited toward the velocity distribution of supercavitating jet in the initial stage. The velocity distribution, as shown in Figure 13, is represented by the external thick black solid line denoting the gas cavity contour.
Figure 13.
The velocity distribution of the unconstrained low-gas-supply jet in the initial stage of development. (a) T = 0.004 s; (b) T = 0.009 s; (c) T = 0.010 s; (d) T = 0.012 s.
In the initial stage of jet initiation, the rapid pace is maintained by the liquid jet, which possesses high momentum. However, significant resistance is encountered by the liquid jet as it is gradually exposed to the environmental medium without being enveloped by the low-viscosity cavity region. Consequently, a rapid decay in its velocity begins, as depicted in Figure 13a.
With the introduction of the gas jet and the formation of cavity, the core area of the jet is further developed downstream. Due to the enveloping effect of the gas on the jet, the direct contact area between the liquid and the environmental medium is reduced inside the gas cavity, thereby decreasing frictional drag, allowing for the jet velocity within the gas cavity to be maintained at a higher level, as shown in Figure 13b.
However, outside the gas cavity, significant changes are observed in the velocity distribution of the jet, particularly after the necking phenomenon occurs. A portion of the jet loses the protection of the gas cavity due to the necking phenomenon, thus being directly exposed and influenced by the environmental medium. Consequently, its velocity rapidly decreases, falling even below the velocity of the jet enveloped by the cavity downstream, as shown in Figure 13c. Furthermore, the velocity of the jet enveloped in the cavity rapidly decreases due to the lack of continuous water jet momentum supply downstream.
As depicted in Figure 14a, during the continued development, a pronounced bulging phenomenon was experienced by the second cavity due to the blocking effect at its front end, leading to further bubbling of the jet area downstream lacking cavity protection. In the ongoing development of the second cavity, the initial necking amplitude is small, causing its rear to be continuously replenished with gas and forming a relatively persistent gas cavity (0.012 to 0.03 s).
Figure 14.
The gas volume fraction of the unconstrained low-gas-supply jet in the middle stage of development. (a) T = 0.014 s; (b) T = 0.036 s; (c) T = 0.047 s; (d) T = 0.053 s.
As the cavity evolves to a particular phase, the necking phenomenon occurs again, as shown in Figure 14b. Nonetheless, due to its extended duration and the substantial size of cavity, the core section of the water jet is capable of being maintained at a distance reaching up to 0.25 m.
During the gas bulging process, the momentum of the gas gradually diminishes. Due to insufficient initial momentum of the gas supply, the buoyancy acting on the cavity body starts to become dominant, leading to a tendency for the gas to float upwards. Consequently, during the third instance of the necking-bubbling phenomenon, the gas is seen to rise and separate from the cavity, as clearly demonstrated in Figure 14c. In this process, portions of the cavity, while undergoing necking, are sucked upstream, impacting the nozzle wall. This interaction causes the water jet at 0.05 m to be partially exposed to the external medium, triggering the onset of momentum dissipation. Ultimately, around approximately 0.17 m, fragmentation of the water jet is initiated.
In the velocity distribution of the supercavitating jet, trends corresponding to the evolution of flow regime can be observed. As depicted in Figure 15b, in the core section of the water jet, detached from the bubble envelope at approximately 0.15 m, the kinetic energy of the jet begins to be dissipated gradually.
Figure 15.
The velocity distribution of the unconstrained low-gas-supply jet in the middle stage of development. (a) T = 0.014 s; (b) T = 0.036 s; (c) T = 0.047 s; (d) T = 0.053 s.
As the jet continues to evolve, a larger cavity cycle is observed to emerge, allowing for the core section of the jet to be sustained over a greater distance. Figure 15c illustrates that the core section of the jet, is observed to only begin exhibiting significant dissipation of kinetic energy after persisting up to a distance of 0.2 m. Due to the rising and overflowing of gas, along with the increased amplitude of cavity necking, the subsequent gas supply is deemed insufficient to form a complete gas cavity that can effectively envelop the water jet. Consequently, the water jet is exposed to the environmental medium at 0.05 m, and due to this insufficient gas encapsulation and protection, the water jet is deemed to have inadequate momentum replenishment. This means that the jet velocity cannot be effectively sustained, even when the downstream water jet remains enveloped by the cavity, as depicted in Figure 15d.
Under conditions of low gas supply, a supercavitating jet undergoes a sequence of periodic transformations, characterized by necking, expansion, and recoil, accompanied by upward gas escape. It is noteworthy, however, that the precise periodicity of these phenomena is not clearly defined, largely owing to the stochastic nature of gas and jet development, which exerts a degree of influence on the evolution of the flow regime through the magnitude of necking amplitude.
The aforementioned phenomenon is described, providing fundamental insights into the evolution of the flow regime of a supercavitating jet under low-gas-supply conditions. Due to space and effort constraints, this study did not further explore the specifics of flow regime evolution under these conditions. Nevertheless, several valuable conclusions are drawn through a comparison between the gas-assisted cavity jet and the pure water jet without gas assistance.
The velocity distribution contour map of the submerged jet without gas assistance is presented in Figure 16. The exit velocity of the jet approaches 100 m/s, which is close to the velocity calculated by empirical Formula (11). However, in submerged conditions, the momentum of the pure water jet dissipates rapidly, rendering it challenging to maintain its initial velocity. This outcome indicates that without gas assistance, the water jet encounters difficulties in sustaining high speed over extended distances in a submerged environment. Figure 16b compares the velocity of the supercavitating jet at the moment depicted in Figure 15c with the axial velocity of the jet without gas assistance. It is observed that with gas assistance, the water jet can significantly extend the distance of its core section under submerged conditions. This result comprehensively illustrates the efficacy of gas assistance in enhancing the performance of water jets.
Figure 16.
Comparison of axial velocity of jet without gas assistance and with gas assistance: (a) velocity contour map of jet without gas assistance, (b) axial velocity line graph of jet with gas assistance.
While gas-assisted technology has the potential to markedly enhance the performance of water jets, it is insufficient for maintaining a sustained and stable cavitation environment at low-gas-supply rates. During the development of the jet, the rapid replenishment to the necking area is hindered by the insufficient gas supply, affecting the stability of the cavity. Simultaneously, when the initial momentum of the gas is insufficient, the jet becomes susceptible to dominance by upward buoyancy during necking at the front end, resulting in upward escape and further exacerbating the deficiency of axial gas supply. To address these issues and enhance the performance of the water jet, the evolution of the flow regime in the supercavitating jet with increased gas supply is investigated in the subsequent study.
- (2)
- The gas supply rate is 100 L/min.
Under unconstrained conditions, the gas supply of the supercavitating jet, when increased to 100 L/min, exhibits a necking-bubbling phenomenon in its flow regime evolution. However, it is characterized by subtle differences compared to conditions of low gas supply. This is illustrated in Figure 17.
Figure 17.
The gas volume fraction of the unconstrained medium-gas-supply jet in the initial stage of development. (a) T = 0.001 s; (b) T = 0.002 s; (c) T = 0.004 s; (d) T = 0.005 s.
Initially, under low-gas-supply conditions, cavities are observed to be elongated and prone to necking. In comparison, cavities under medium-gas-supply conditions display a fuller morphology, characterized by a bulging diameter that has significantly increased to more than twice the original diameter. This change is attributed to an increase in the gas supply per unit time. Despite the front end of the cavity still being affected by a clogging effect, the sufficient gas supply accentuates the bulging phenomenon, as depicted in Figure 12a.
Secondly, the increase in gas supply significantly boosts the initial momentum of the gas jet. At the identical time point (0.005 s), the cavity, under conditions of medium gas supply, has progressed to 0.13 m, whereas under low-gas-supply conditions, it only reaches 0.06 m. This enhancement establishes a solid foundation for the development of a growing and stable cavity structure.
Worth noting is the observation, as illustrated in Figure 17b, that under conditions of medium gas supply, the necking trend at the rear end of the jet is similar to that at low gas supply. However, the original cavity structure is destroyed due to the phenomenon of rear gas impacting the wall during the bulging period. This destruction allows for more gas to be replenished to the downstream area, further strengthening the cavity structure. This phenomenon indicates that under conditions of medium gas supply, the gas jet possesses stronger kinetic energy and replenishment capability, which are instrumental in maintaining the stability of the cavity.
Furthermore, as evident from Figure 18, under conditions of medium gas supply, the gas jet can maintain a notably high flow velocity at the outlet, reaching up to 175 m/s, which is much higher than the maximum flow velocity at low gas supply. Simultaneously, the initial vortex is formed more rapidly, but after being impacted by the wall, the momentum of the vortex quickly dissipates, enabling the axial high-speed airflow to take precedence. Downstream bulging cavities are promptly replenished by this airflow, giving rise to a low-viscosity region. Consequently, the stability of the cavity is preserved, and the jet’s penetration force is enhanced.
Figure 18.
The velocity distribution of the unconstrained medium-gas-supply jet in the initial stage of development. (a) T = 0.001 s; (b) T = 0.002 s; (c) T = 0.004 s; (d) T = 0.005 s.
Finally, under medium-gas-supply conditions, larger cavities are formed, which can effectively sustain the core section of the water jet, pushing it further away. Inside the water jet area surrounded by the cavity, the jet velocity is maintained at a high level. Nevertheless, once the water jet detaches from the protection of the cavity, its kinetic energy will quickly dissipate.
During the process of further development, instability arises significantly at the flow interface. This instability is caused by the tangential velocity difference at the gas–liquid interface, combined with the influence of oblique shock waves from high-speed jets. As a result, the interface between gas bubbles and the external environment undergoes deformation, enabling vortices to persist and evolve. Notably, vortex development is more pronounced under medium-gas-supply conditions, as evident in Figure 19a, compared to scenarios with low gas supply.
Figure 19.
The gas volume fraction of the unconstrained medium-gas-supply jet in the middle stage of development. (a) T = 0.006 s; (b) T = 0.014 s; (c) T = 0.018 s; (d) T = 0.022 s.
The intense vortex action is observed to cause the jet to rupture prematurely at a distance of 0.1 m. It should be noted that despite the rupture, the jet does not entirely lose its kinetic energy. Figure 20a reveals that although the water jet underwent a rupture process in the middle, it was still enveloped by a low-viscosity cavity and did not dissipate kinetic energy as described earlier. Instead, the jet retains a higher velocity characteristic. This indicates that under conditions of medium gas supply, the jet, even after experiencing rupture, retains a degree of cleaning ability and penetration power.
Figure 20.
The velocity distribution of the unconstrained medium-gas-supply jet in the middle stage of development. (a) T = 0.006 s; (b) T = 0.014 s; (c) T = 0.018 s; (d) T = 0.022 s.
As the jet progresses further, the bubble is still observed to undergo necking-bubbling phenomena. At medium-gas-supply conditions, the necking phenomenon does not lead to cavity breakage, contrary to the scenario at low gas supply. This is attributed to the sufficient upstream gas volume and momentum. Instead, a low-viscosity region channel is formed within a distance of 0.15 m, and whether it can continue to form a gas cavity beyond 0.2 m is contingent upon the amplitude of the preceding necking.
The noteworthy aspect is that under medium-gas-supply conditions, the formation and maintenance mechanism of a gas cavity is found to be markedly distinct from those observed under low-gas-supply conditions. When subjected to a small necking amplitude, the obstructive effect on the gas jet is diminished, allowing the gas jet to travel further distances. Consequently, under conditions of ample gas supply, the gas cavity can sustain a greater distance, even with a minor necking amplitude. For instance, as depicted in Figure 20c, in the process of further development, with a small necking amplitude, the gas cavity is capable of being propelled at a velocity of 40 m/s to a distance of 0.25 m and may continue to extend further. In contrast, as seen in Figure 20b, with a large necking amplitude, the gas cavity is observed to completely disintegrate within a short distance of approximately 0.2 m during its progression.
In addition, under medium-gas-supply conditions, the jet velocity at the gas outlet is characterized by a relatively high value, and the velocity distribution is observed to exhibit significant randomness. The variation in this distribution, coupled with the velocity difference between the gas and the jet surface, and the presence of oblique shock waves, are collectively responsible for the premature fragmentation of the water jet at certain positions, such as at 0.05 m, as depicted in Figure 19c. However, due to the sufficient momentum of the high-pressure water jet, this fragmentation is quickly reconstructed, and due to the water jet almost always passing through the cavity, its speed remains largely unattenuated over a considerable distance, within 0.15 m. This observation suggests that despite undergoing more complex flow regime changes under medium-gas-supply conditions, the jet can still maintain a high level of stability and penetration.
In summary, with an increase in gas supply, the cavity is made fuller and the diameter of the cavity bulge is increased. However, due to the increased velocity difference at the interface with the water jet, it may also cause the jet to rupture prematurely over a short distance. Despite this, the jet performance under medium gas supply remains superior to that under low gas supply. This is because even if the jet ruptures, it is still moving in a low-resistance cavity, relying on the kinetic energy of the jet itself for supplementation, and the performance is still well. Furthermore, under medium gas supply, the phenomenon of necking-bubbling is observed, and the formation of stable gas channels is dependent on the amplitude of necking. Under conditions of low gas supply, gas movement primarily relies on water jet injection; in contrast, under medium gas supply, gas movement relies more heavily on its own momentum.
- (3)
- The gas supply rate is 200 L/min.
To further investigate the impact of increased gas supply on the evolution of supercavitating jet flow patterns, particularly the maintenance ability of the water jet core section, this study conducts simulation research with a gas supply of 200 L/min. As illustrated in Figure 21, at this supply rate, the position of the gas cavity remains similar to the previous working condition, which is mainly attributed to the higher resistance experienced by the front end in a pure water environment. Nevertheless, due to the increase in gas supply per unit time, the blockage phenomenon at the front end of the gas cavity is more significant, leading to a further increase in the bulging diameter.
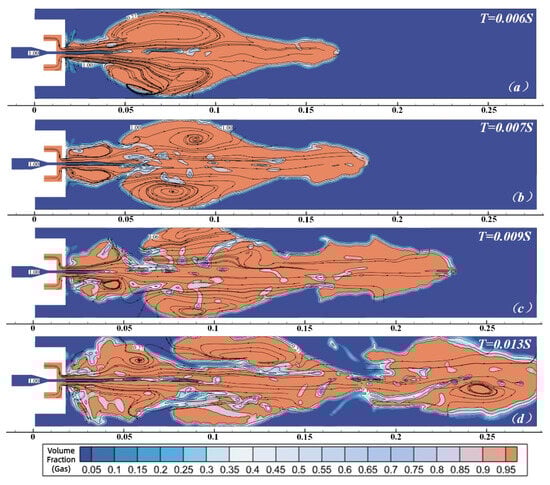
Figure 21.
The gas volume fraction of the unconstrained high-gas-supply jet in the initial stage of development. (a) T = 0.006 s; (b) T = 0.007 s; (c) T = 0.009 s; (d) T = 0.013 s.
From the trace in Figure 21a, it can be seen that the development of the cavity exhibits asymmetry. In the case of high momentum, large vortices are generated within the cavity, reaching velocities of up to 50 m/s. These vortices, due to their high momentum, trigger more severe necking phenomena, causing the jet to start breaking at the front end. This phenomenon is in stark contrast to the performance under low-gas-supply conditions, indicating the adverse effect of increased gas supply on jet stability.
It is worth noting that as the jet continues to develop, the broken jet will lose the continuous structure of the core section of the water jet and diffuse with high momentum towards the outside of the jet axis. As illustrated in Figure 21b, this phenomenon further intensifies the instability of the jet.
Meanwhile, due to severe necking and instability on the outside of the gas cavity, a substantial amount of external media is sucked into the interior of the bubble jet, as shown in Figure 21d. The bulging part of the cavity is cut off by these entrained jets, thereby diminishing the self-momentum of the gas cavity. From Figure 22, it can be seen that buoyancy gradually becomes dominant, causing the gas cavity to rise and overflow. This not only causes gas waste but also makes it difficult for the downstream gas region to achieve the expected effect. At the same time, the external medium sucked in by this part will also have an impact on the water jet wrapped in the low-viscosity area, causing the resistance of the water jet to increase and the jet to dissipate again.
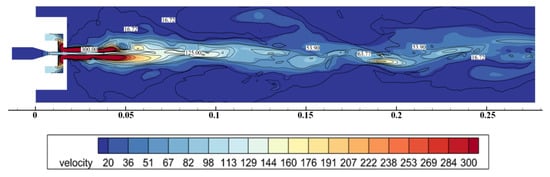
Figure 22.
The velocity distribution of the unconstrained high-gas-supply jet in the initial stage of development.
Furthermore, due to the swift velocity of the gas jet, which can reach 300 m/s or even higher, as shown in Figure 22, a larger velocity difference is generated at the interface between the gas jet and the water jet. This difference in velocity renders the surface tension of the core section of the water jet insufficient to resist the force of the external medium, leading to the early occurrence of Kelvin Helmholtz instability. Consequently, this has a negative impact on the jet stability expected in this study.
As illustrated in Figure 22, during the subsequent development process, the gas flow rate in the cavity can still reach around 50 m/s. Nevertheless, due to the water jet being broken at the front end and almost no complete and continuous water jet existing at the rear, even if the downstream flow velocity is shown to be relatively high on the velocity cloud map, it is primarily composed of gas and does not possess the expected water jet cleaning effect described in this study.
Figure 23 displays the volume and velocity distribution of the core section of the water jet at a relatively distant time after a period of development. It is observed that the core section only lasted a distance of 0.1 m when maintained at a longer distance, which did not display the superiority of higher gas supply compared to 0.15 m observed in the above. Simultaneously, excessive suction of the external medium caused the cavity to start breaking and overflowing at the front end. At the tail of jet development, as the gas momentum is depleted, the cavities gradually become affected by buoyancy and begin to move upwards.
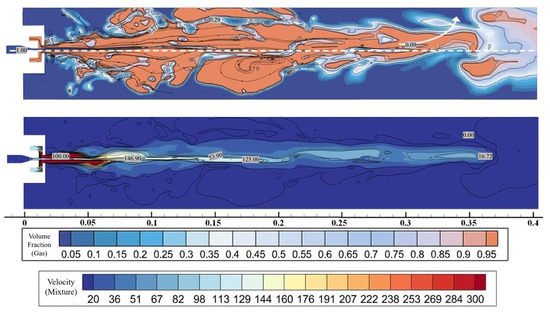
Figure 23.
The gas volume fraction and velocity distribution of the unconstrained high-gas-supply jet in the middle stage of development.
To comprehensively evaluate the unconstrained jet performance, the flow regime is characterized by two key indicators: necking intensity and jet penetration. The quantitative analysis results under different gas supply rates are estimated as shown in Table 3.
Table 3.
Quantitative analysis results under different gas supply rates.
In brief, this section examines the evolution of flow regime at higher gas supply rates. It was found that excessive gas supply actually had a negative impact on the maintenance of the core section of the water jet. The too rapid gas flow jet is found to induce the water jet to break prematurely. Simultaneously, the necking and suction effect of the cavity is enhanced, causing a substantial external medium to be sucked into the cavity. Under the combined action of these factors, gas cavity rupture and overflow at the front end, resulting in an insufficient gas supply at the rear. Therefore, while an increase in gas supply can be effective, it is not always beneficial. Of course, increasing gas supply may promote the generation of water jet cavitation, which may offer superior performance in scenarios where such a phenomenon is desirable, yet it is not what this study requires. Due to space and effort constraints, further exploration into the optimal gas supply volume is not pursued here.
3.2. Typical Flow Regime Evolution Law in Semi-Constrained Supercavitating Jet
As the exploration of flow regime evolution in this study is aimed to serve cleaning needs, this study continues to simulate the semi-constrained impinging jet to explore the dynamic characteristics of supercavitating jets when impacting the target plate.
It is noteworthy that based on the results observed in the above regarding the flow regime evolution of the unconstrained jet, a significant finding has emerged; due to the presence of gravity, the gas jet is subjected to huge buoyancy, stemming from the density difference, leading gas to float upwards. Therefore, in this case, when spraying from the bottom up, the surface of the target plate becomes covered with gas, allowing the wall jet to still travel within the low-resistance zone, and the kinetic energy dissipation of the wall jet is reduced, thereby enabling a larger cleaning area to be achieved.
It can be anticipated that when the target plate is impacted at a vertical angle, the maximum impact force can be obtained. However, upon diffusion on the target plate, the shear stress generated on the wall is almost negligible, meaning the cleaning effect of diffusion can be ignored. Consequently, this study concentrates on the flow regime evolution and force analysis subsequent to tangential impacts at angles of 15 and 30 degrees.
During the preliminary research, it was observed that the flow regime, under various working parameters, demonstrated similar characteristics, and the flow regime of the impinging jet was more affected by the impact angle. Consequently, the subsequent step of this study is directed towards simulating the working conditions with operating parameters of = 2 mm, = 8 mm, = 120 L/min, and = 10 MPa.
3.2.1. Flow Regime Evolution of Tangentially Impinging Jet
The distribution cloud map of gas and liquid volume fractions during the development stage of the wall jet is presented in Figure 24, where red denotes the volume fraction of the gaseous phase. It can be seen that the flow regime in the initial stage of the jet is basically the same as described above, showing necking expansion. However, due to the direct impact of the jet downstream on the target plate, the impact of downstream necking will not be transmitted to the upstream, and even if there is swelling in the upstream, it can rapidly progress downstream. Consequently, unlike the unconstrained jet, the initial stage of the jet, even with the same working parameters as described above, will not experience severe necking expansion, causing the gas jet to break and even affecting the core area of the water jet. Instead, a relatively stable gas cavity is exhibited.
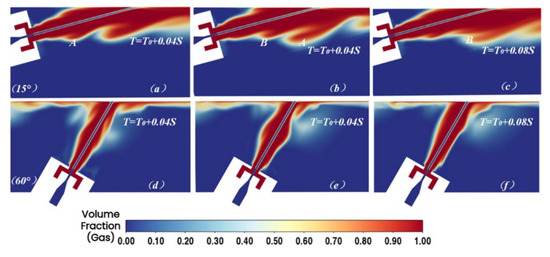
Figure 24.
The evolution diagram of the tangential impact flow state at different angles. (a) T = T0 + 0.04 s (15°); (b) T = T0 + 0.04 s (15°); (c) T = T0 + 0.04 s (15°); (d) T = T0 + 0.04 s (60°); (e) T = T0 + 0.04 s (60°); (f) T = T0 + 0.08 s (60°).
However, as the tangential angle increases, this study found that the necking phenomenon of the cavity jet becomes more severe. To illustrate this phenomenon, Figure 25 show the vorticity distribution under the Q criterion at a certain moment. It is observable that the vorticity is predominantly concentrated in the near-wall region and the jet outlet region.
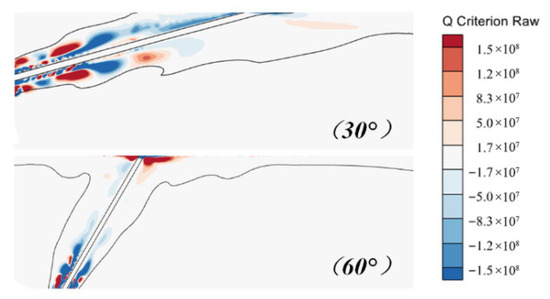
Figure 25.
The vorticity distribution of the Q criterion at a certain time at different angles.
In the jet outlet area, due to the sufficient initial gas momentum, a large velocity difference at the interface between the gas cavity and water jet is observed; therefore, there exists a maximum region with distributed vortices. Nevertheless, at the outlet stage, both the gas and water jet possess relatively ample momentum; hence, the larger vorticity here did not have a significant impact on the jet fragmentation. As the gas jet continues to develop, it sucked a portion of the environmental medium, leading to a decrease in momentum and vorticity, thereby resulting in a more stable outer gas cavity.
It is worth noting that in the near-wall region, the jet body transitions from radial to tangential motion, thus forming a radial wall jet. Due to the velocity discontinuity between this jet and the upper environmental fluid, shear vortices form in the mainstream region of the free jet, and the vorticity value will have a maximum at the wall. However, as the impact angle increases from small to large, this velocity discontinuity becomes more pronounced, resulting in a huge velocity gradient. Consequently, with an increase in the impact angle, the vorticity near the wall sharply increases, leading to more severe necking phenomenon in the near-wall region at large angles.
This study revealed that in the initial stage of near-wall impact jet, the necking-bubbling phenomena is similar to that of an unconstrained jet. As the impact angle increases, the necking phenomenon intensifies. Due to the large angle impact, the velocity discontinuity at the wall is more pronounced. The evolution law of the jet under different working parameters is basically the same as the above. Therefore, this section will not further elaborate on the flow regime evolution in the initial stage of the jet.
As the supercavitating jet continues to develop, the behavior of the cavity on the wall is depicted in Figure 26. The transparent material on the target plate is a rendering of the gas profile near the wall. It can be seen that when the supercavitating jet impacts the wall at 60°, the gas jet, influenced by gravity, adheres to the surface of the target plate and spreads around like water waves, then dissipates or overflows from the target plate. The reason for the appearance of waves is similar to the previously mentioned bulging phenomenon. From wave B in Figure 26f, it can be seen that wave B is a continuation of the upstream bulging phenomenon. The bulging jet part, upon striking the target plate, and over time, gradually evolves into an arc-shaped wave, as illustrated in Figure 26f. Meanwhile, due to the strong nonlinear instability of the wave surface, it is still possible to experience gas cavity fragmentation during the forward development of the airflow. As shown in Figure 26a,b, the gas cavity downstream of wave A has begun to rupture, and the rupture is gradually intensifying over time.
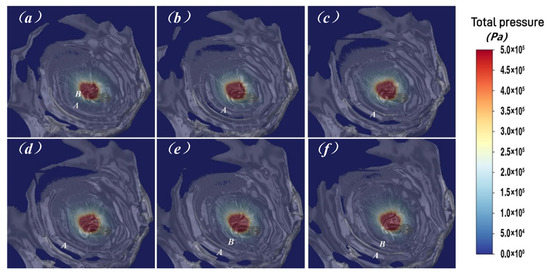
Figure 26.
Sixty-degree tangential impact space-time bubble and target plate total pressure (static pressure and dynamic pressure) distribution map: Progressing from (a–f) over time.
Compared to larger angle impacts, small-angle impacts shows another pattern in the evolution of the cavity on the target plate. As evident from Figure 27b, it can be seen that gas cavities gradually develop from a single cavity to three cavities after impacting the target plate, indicating a shift of the gas jet from the central axis to both sides. This phenomenon is attributed to the fact that the initial momentum of the gas jet can still maintain a relatively large level after impacting the wall. The reason for maintaining a large momentum is the tangential impact on the wall, which reduces the impact angle, thereby reducing kinetic energy loss. Consequently, a significant tangential velocity difference between the gas–liquid two phase interface is observed where the cavity just contacts the wall, leading to a phenomenon similar to “necking-bubbling”. In addition, the obstruction by the target plate contributes to the above phenomenon. However, due to the presence of vortices, gas cavities eventually rotate forward and diffuse outward, with only a portion of the gas being guided along the axis by a water jet.
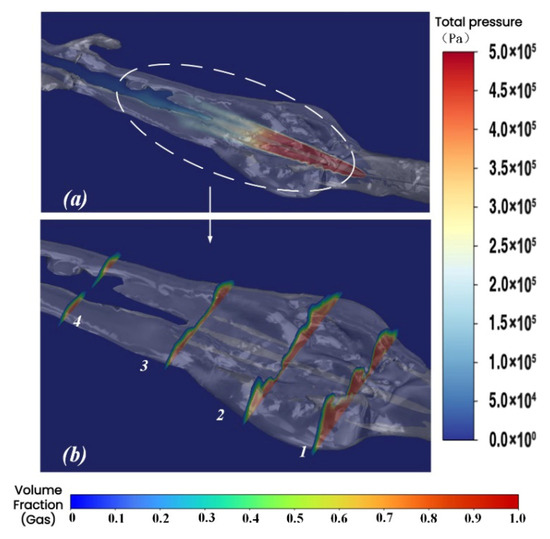
Figure 27.
Thirty-degree tangential impact space–time bubble and target plate total pressure (static pressure and dynamic pressure) distribution map: (a) Panorama; (b) Enlarged view.
Simultaneously, the small-angle tangential impact of the liquid jet is observed to allow the liquid phase to maintain a certain velocity and develop along the wall, causing a certain injection effect on the gas jet, resulting in a faster gas cavity velocity and thinner thickness on the central axis during the subsequent development process. Nevertheless, during the injection process, a portion of the gas will gradually be sucked into the liquid jet near the wall, causing a decrease in gas volume. When the gas volume is reduced to a certain extent, the liquid phase jet will be exposed to the environmental medium, resulting in a rapid decrease in kinetic energy.
3.2.2. Velocity Distribution of Tangentially Impinging Jet
According to the introduction, when cleaning marine artificial bodies, the tangential force is deemed more effective in cleaning marine organisms and other structures. Hence, the subsequent analysis of the force exerted on the target plate will be transformed into an analysis of the momentum of the tangential water jet flowing on the wall of the target plate. Given the positive correlation between velocity and momentum, the following discussion will be simplified to an analysis of velocity. Due to the presence of boundary layers, there will be a severe velocity gradient on the wall. To address this issue, a cross-section that crosses the height of the first layer of the two layers of mesh is selected for analysis.
As shown in Figure 28b, when the wall is impacted at a large angle, the velocity distribution is observed to exhibit a radiative pattern, which will result in a more concentrated force of the water jet impact. Upon diffusing on the wall of the target plate, the flow velocity is maintained at 90 m/s for approximately 20d. Subsequently, the jet velocity rapidly decreases within a distance of 15d due to the dissipating of the cavity protection. When the jet reduces the tangential impact angle, a slender velocity distribution is formed, allowing the flow velocity above 70 m/s to persist for a distance of 40d. Within the subsequent 40–80d distance, the flow velocity begins to significantly decrease. This is due to the evolution of the cavity, as the cavity near the axis gradually becomes thinner, reducing the protection of the jet. However, due to portions of the cavity still advancing with the jet, it can travel at a speed of 20 m/s to a distance of 140d, but at this speed, most of its cleaning ability is lost, retaining only a cleaning effect on some easily cleaned stains. From this, it can be seen that when a cleaning distance as far as possible is required, using a small-angle tangential cleaning can achieve the desired effect.
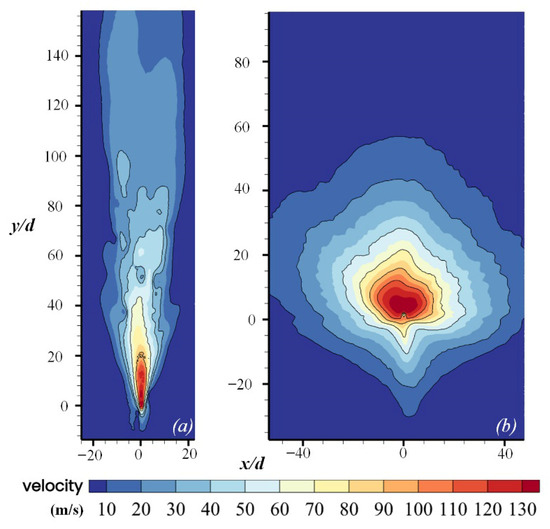
Figure 28.
Velocity distribution of target wall impacted by different angles: (a) Small angle; (b) Large angle.
By increasing the pressure and diameter of the water jet, the cleaning distance of the jet can be increased to some extent. However, this approach significantly increases energy consumption. Furthermore, influenced by the evolution of the cavity flow regime, despite these adjustments, the jet still cannot avoid losing its cleaning ability at a distance of more than 150d. Although this has significantly increased the cleaning distance in comparison to a submerged jet, this study indicates that there is potential for further optimization if the cavity flow regime is appropriately restricted.
4. Conclusions
This paper, focusing on supercavitating jets, employs a comprehensive approach combining experimental and numerical simulation methods to delve into the flow regime evolution in supercavitating high-pressure water jets. Through the visualization of transient and multiphase flow fields, this study reveals the development laws and underlying mechanisms of supercavitating high-pressure water jets under different operating parameters, enabling a comprehensive understanding of their behavior in submerged conditions. With the in-depth research on supercavitating high-pressure water jet technology, it is anticipated to bring breakthrough innovations to cleaning operations in the field of ocean engineering. This novel cleaning method is expected not only to achieve more efficient and economical operational outcomes but also to enhance environmental performance, contributing to the sustainable development and utilization of marine resources.
Initially, the dynamic characteristics of three typical unconstrained supercavitating jet, each represented by a distinct gas supply rate, are analyzed. Subsequently, the flow regime and velocity distribution of the supercavitating jet impact jet are examined, leading to the following conclusions being derived:
- (1)
- Regarding the periodic “necking-bubbling” phenomenon, observed in the development of cavity in a supercavitating jet, the intensity of this phenomenon is found to be directly proportional to the gas exit velocity and gas supply. In a submerged environment, the core section of supercavitating jet with gas assistance is maintained at a significantly greater distance than that of a jet without it.
- (2)
- Under low-gas-supply conditions, due to insufficient gas supply, the neck area is difficult to be filled by gas, and when gas necks at the front end, it is easily influenced by buoyancy and escapes upwards, being ultimately affected by the stability of the cavity. As the gas supply increases, the diameter of cavity bulging is observed to be increased. However, the jet may also be collapsed over a shorter distance by an increase in the velocity difference between the gas supply and the water jet interface. Nonetheless, the jet performance under high gas supply remains superior than that under low gas supply. However, when the gas supply increases further, the maintenance of the core section of the water jet is instead detrimentally affected.
- (3)
- After impacting the target plate, the semi-constrained jet is no longer influenced by downstream fluctuations, allowing the supercavitating jet to maintain a relatively stable cavity in the initial stage. Similar to an unconstrained jet, the “necking-expansion” phenomenon is also exhibited by the gas flow regime along its wall. Compared to large angles, the stability of the gas cavity on the target plate is enhanced by small-angle impact. This is because under small-angle impact, the velocity discontinuity at the wall is reduced, leading to decreased vorticity near the wall and mitigating the severity of the necking phenomenon. Furthermore, the cleaning distance is favorably extended by small-angle impact.
In comparison with previous studies predominantly focused on rock-breaking applications of gas-assisted water jets—where vertical impact force maximization is prioritized—the present work extends the research scope to submerged cleaning scenarios, emphasizing tangential impact performance and flow regime evolution. The finding that the supercavitating jet exhibits optimal stability and extended core section distance at a gas supply rate of 120 L/min (derived from orthogonal analysis) and complements the existing literature on gas supply parameter optimization, while the observation that small-angle (30°) tangential impact enhances cavity stability and cleaning distance fills the research gap in tangential jet behavior for marine cleaning. However, this study has several limitations: numerically, the mixture model employed could not fully capture the microscale dynamics of bubble collapse and fragmentation, leading to slight discrepancies in necking-bubbling amplitude compared to experimental observations; experimentally, the research was conducted under controlled laboratory conditions, without accounting for the effects of seawater salinity, temperature, and turbulent ambient flow in real marine environments; additionally, the cleaning efficacy was inferred from flow field characteristics rather than direct tests on actual marine biofouling. Future research should address these limitations by adopting more advanced multiphase flow models such as VOF with bubble dynamic sub-models to refine the simulation of gas–liquid interaction; conducting field experiments in real marine settings to validate the jet performance under complex environmental conditions; and optimizing the nozzle structure to mitigate the adverse effects of excessive gas supply on jet integrity. Furthermore, integrating the supercavitating jet with underwater robotic systems for automated cleaning operations could enhance its practical applicability in offshore infrastructure maintenance.
Author Contributions
H.Y.: Writing—review & editing, Writing—original draft, Visualization; C.Z.: Writing—original draft, Visualization; W.L.: Visualization, Validation; N.C.: Resources, Project administration, Methodology. All authors have read and agreed to the published version of the manuscript.
Funding
This research was funded by the China Coal Technology & Engineering Group Shanghai Co., Ltd. Grant number No. 02062223823Q.
Institutional Review Board Statement
Not applicable.
Informed Consent Statement
Not applicable.
Data Availability Statement
The original contributions presented in the study are included in the article, further inquiries can be directed to the corresponding author.
Conflicts of Interest
The authors declare no conflict of interest.
References
- Cheliyan, A.S.; Bhattacharyya, S.K. Fuzzy fault tree analysis of oil and gas leakage in subsea production systems. J. Ocean Eng. Sci. 2018, 3, 38–48. [Google Scholar] [CrossRef]
- Póvoa, A.A.; Skinner, L.F.; de Araújo, F.V. Fouling organisms in marine litter (rafting on abiogenic substrates): A global review of literature. Mar. Pollut. Bull. 2021, 166, 112189. [Google Scholar] [CrossRef]
- Oyeneyin, M.B. Challenges of Deepwater Developments. In Proceedings of the 3rd International Conference on Engineering Research and Development—Advances in Engineering, Science and Technology (ICERD 2010), Benin, Nigeria, 7–9 September 2010. [Google Scholar]
- Albitar, H.; Dandan, K.; Ananiev, A.; Kalaykov, I. Underwater Robotics: Surface Cleaning Technics, Adhesion and Locomotion Systems. Int. J. Adv. Robot. Syst. 2016, 13, 7. [Google Scholar] [CrossRef]
- Kalumuck, K.; Chahine, G.; Frederick, G.; Aley, P. Development of a DYNAJET cavitating water jet cleaning tool for underwater marine fouling removal. In Proceedings of the 9th American Waterjet Conference, Dearborn, MI, USA, 23–26 August 1997. [Google Scholar]
- Bahri, M.; Haghighat, F. Plasma-Based Indoor Air Cleaning Technologies: The State of the Art-Review. Clean-Soil Air Water 2014, 42, 1667–1680. [Google Scholar] [CrossRef]
- Cheng, X.; Zhang, S.; Ma, L.; Luo, Y. The application status and development prospects of high pressure water jet technology. Hydraul. Pneum. Seals 2019, 39, 1–6. [Google Scholar]
- Chen, Y.; Hu, Y. Research and application of ship hull fouling cleaning technologies. Surf. Technol. 2017, 46, 60–71. [Google Scholar]
- Haghbin, N.; Spelt, J.K.; Papini, M. Abrasive waterjet micro-machining of channels in metals: Comparison between machining in air and submerged in water. Int. J. Mach. Tools Manuf. 2015, 88, 108–117. [Google Scholar] [CrossRef]
- Lindau, J.W.; Pena, C.; Baker, W.J.; Dreyer, J.J.; Moody, W.L.; Kunz, R.F.; Paterson, E.G. Modeling of cavitating flow through waterjet propulsors. Int. J. Rotating Mach. 2012, 2012, 716392. [Google Scholar] [CrossRef]
- Liu, H.-X.; Shao, Q.-M.; Kang, C.; Gong, C. Impingement capability of high-pressure submerged water jet: Numerical prediction and experimental verification. J. Cent. South Univ. 2015, 22, 3712–3721. [Google Scholar] [CrossRef]
- Ji, B.; Cheng, H.; Huang, B.; Luo, X.; Peng, X.; Long, X. Research progresses and prospects of unsteady hydrodynamics characteristics for cavitation. Adv. Mech. 2019, 49, 201906. [Google Scholar]
- Reuter, F.; Mettin, R. Mechanisms of single bubble cleaning. Ultrason. Sonochem. 2016, 29, 550–562. [Google Scholar] [CrossRef]
- Soyama, H.; Takeo, F. Comparison between cavitation peening and shot peening for extending the fatigue life of a duralumin plate with a hole. J. Mater. Process. Technol. 2016, 227, 80–87. [Google Scholar] [CrossRef]
- Schenke, S.; van Terwisga, T.J. An energy conservative method to predict the erosive aggressiveness of collapsing cavitating structures and cavitating flows from numerical simulations. Int. J. Multiph. Flow 2019, 111, 200–218. [Google Scholar] [CrossRef]
- Li, J. Study on Characteristics of Gas Shrouded Water Jet and Rock-Erosion Experiments. Master’s Thesis, China University of Petroleum, Dongying, China, 2008. (In Chinese). [Google Scholar]
- Liu, S.; Shang, G.; Li, H. Experimental study on rock breaking performance of underwater cross medium jet. J. China Coal Soc. 2022, 47, 1723–1733. [Google Scholar]
- Besagni, G.; Varallo, N.; Mereu, R. Computational fluid dynamics modelling of two-phase bubble columns: A comprehensive review. Fluids 2023, 8, 91. [Google Scholar] [CrossRef]
- Sou, A.; Maulana, M.I.; Isozaki, K.; Hosokawa, S.; Tomiyama, A. Effects of nozzle geometry on cavitation in nozzles of pressure atomizers. J. Fluid Sci. Technol. 2008, 3, 622–632. [Google Scholar] [CrossRef]
- Shang, G. Research on Underwater Rock Breaking Performance of Gas-Assisted Water Jet. Master’s Thesis, China University of Mining and Technology, Xuzhou, China, 2021. (In Chinese). [Google Scholar]
- Wang, R. Research on Rock Breaking Law in Interactive Response and Fracture Mechanism of High-Pressure Gas-Liquid Two-Phase Jet. Master’s Thesis, China University of Mining and Technology, Xuzhou, China, 2018. (In Chinese). [Google Scholar]
- Zhang, L.; Qi, Q.; Ma, T.; Sun, L.; Wang, Y.; Chai, J. Flow field characteristic of water jet with air ring protective layer under submerged environment and the orthogonal optimization of nozzle structure. Energy Sci. Eng. 2023, 11, 227–240. [Google Scholar] [CrossRef]
- Poláček, J.; Hlaváčová, I.M.; Tyč, M. A short note about the impact action of a water jet stabilized by a coaxial air stream in the air and underwater. Materials 2021, 14, 5015. [Google Scholar] [CrossRef] [PubMed]
- Xu, C.; Khoo, B.C.; Cui, Y. Dynamic analysis of natural supercavitating flow during acceleration and deceleration of an axis-symmetric projectile. Phys. Fluids 2024, 36, 123313. [Google Scholar] [CrossRef]
- Gong, H.-X.; Tang, T.; Kong, L.-Q.; Wang, J.-X.; Ma, Y.-M.; Hao, X.-L.; Li, H. Research on combined damage characteristics of underwater armor-piercing and explosion based on supercavitating projectile. Thin-Walled Struct. 2025, 206, 112685. [Google Scholar]
- Elger, D.F.; LeBret, B.A.; Crowe, C.T.; Roberson, J.A. Engineering Fluid Mechanics; John Wiley & Sons: Hoboken, NJ, USA, 2020. [Google Scholar]
- Yakhot, V.; Orszag, S.A. Renormalization group analysis of turbulence. I. Basic theory. J. Sci. Comput. 1986, 1, 3–51. [Google Scholar] [CrossRef]
- Lueck, R. Calculating the Rate of Dissipation of Turbulent Kinetic Energy; Rockland Scientific International Tech. Note TN-028; Rockland Scientific International Inc.: Victoria, BC, Canada, 2013; Volume 18. [Google Scholar]
- Roache, P.J. Conservatism of the grid convergence index in finite volume computations on steady-state fluid flow and heat transfer. J. Fluids Eng.-Trans. ASME 2003, 125, 731–732. [Google Scholar] [CrossRef]
- Kosutova, K.; van Hooff, T.; Vanderwel, C.; Blocken, B.; Hensen, J. Cross-ventilation in a generic isolated building equipped with louvers: Wind-tunnel experiments and CFD simulations. Build. Environ. 2019, 154, 263–280. [Google Scholar] [CrossRef]
- Zhou, P.; Jiang, Y.; Liao, Y.; Li, J. The influence of adjustable parameters based on VOF method on the calculation accuracy and cost of bubble coalescence process. J. Cent. South Univ. (Nat. Sci. Ed.) 2023, 54, 2867–2877. (In Chinese) [Google Scholar]
- Lauterborn, W.; Bolle, H. Experimental investigations of cavitation-bubble collapse in the neighbourhood of a solid boundary. J. Fluid Mech. 1975, 72, 391–399. [Google Scholar] [CrossRef]
- Zhimou, L.; Guiting, M.; Yi, K. Experimental research of impact force distribution on rigid wall by high pressure waterjet. Min. Metall. Eng. 2016, 36, 13–16. [Google Scholar]


Disclaimer/Publisher’s Note: The statements, opinions and data contained in all publications are solely those of the individual author(s) and contributor(s) and not of MDPI and/or the editor(s). MDPI and/or the editor(s) disclaim responsibility for any injury to people or property resulting from any ideas, methods, instructions or products referred to in the content. |
© 2025 by the authors. Licensee MDPI, Basel, Switzerland. This article is an open access article distributed under the terms and conditions of the Creative Commons Attribution (CC BY) license.