

Alteration of the Gut Microbiota in Pigs Infected with African Swine Fever Virus

 , , , ,
  and
and 
Abstract
Simple Summary
Abstract
1. Introduction
2. Materials and Methods
2.1. Virus
2.2. Animals
2.3. Animal Experiment
2.4. Fecal DNA Extraction
2.5. Next-Generation Sequencing
2.6. Taxonomic Assignment of Sequence Reads
2.7. Statistical Analysis
3. Results
3.1. Microbiome Analysis
3.1.1. Characteristics of Sequencing Data
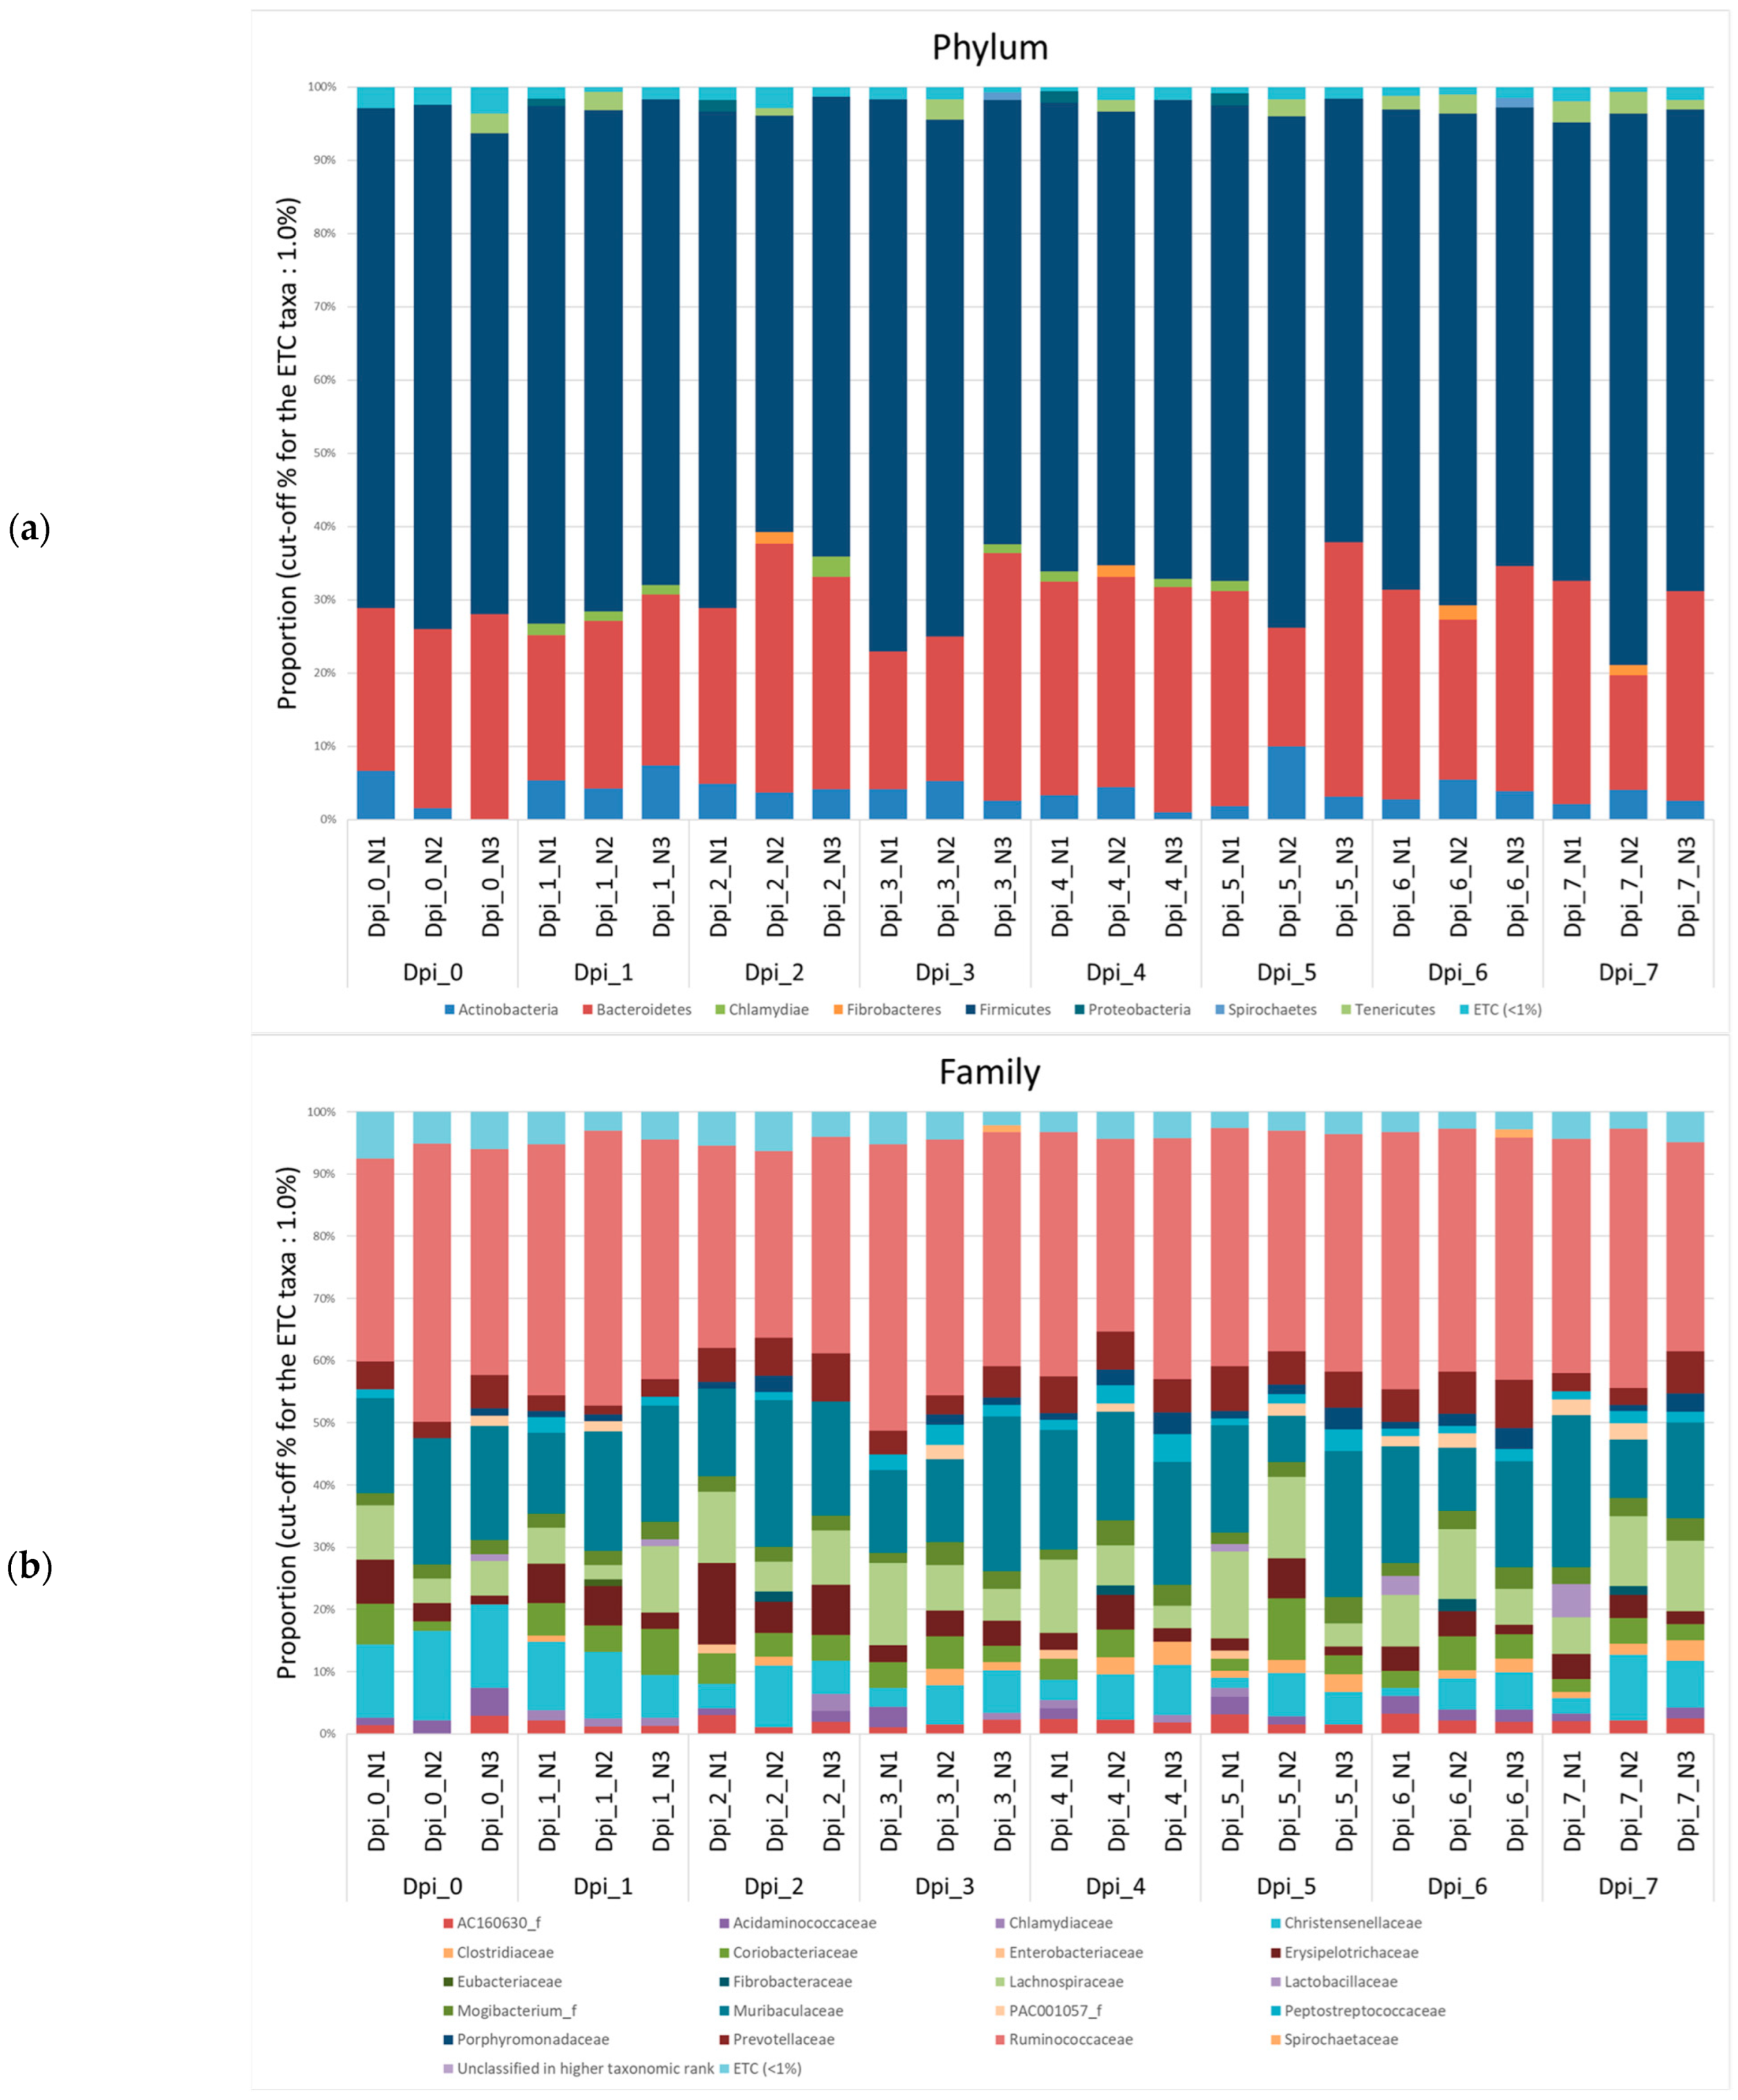
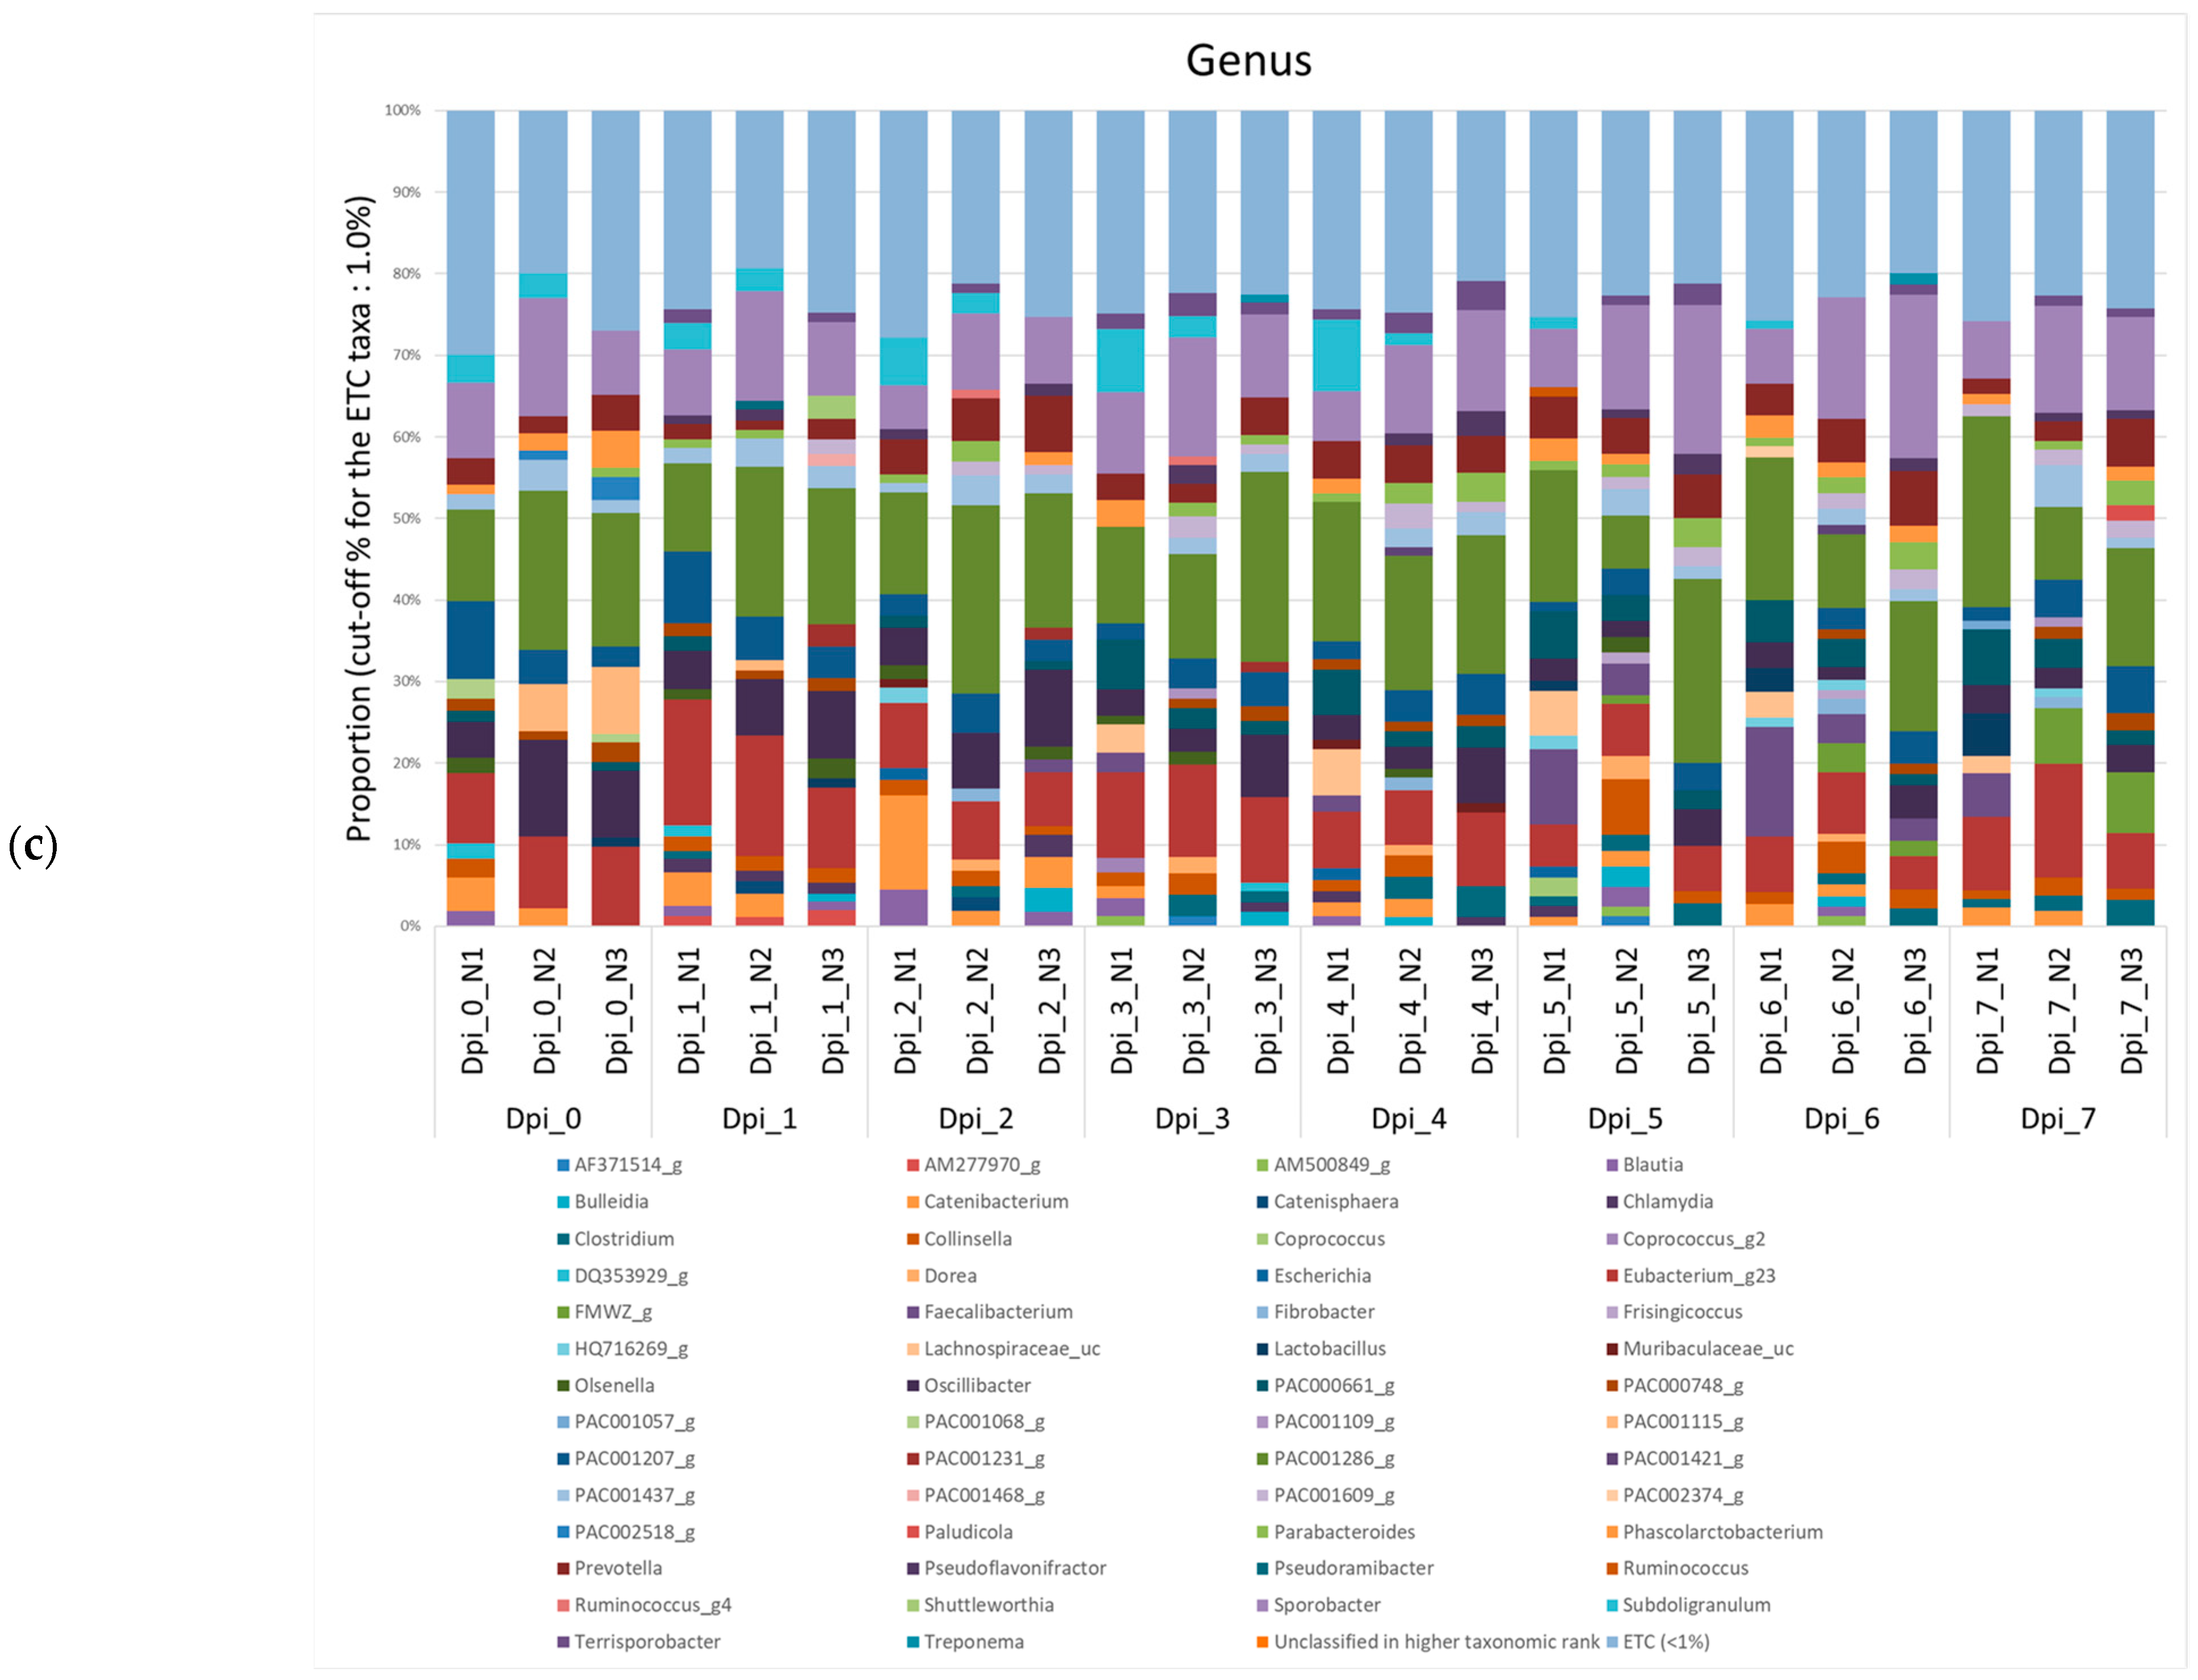
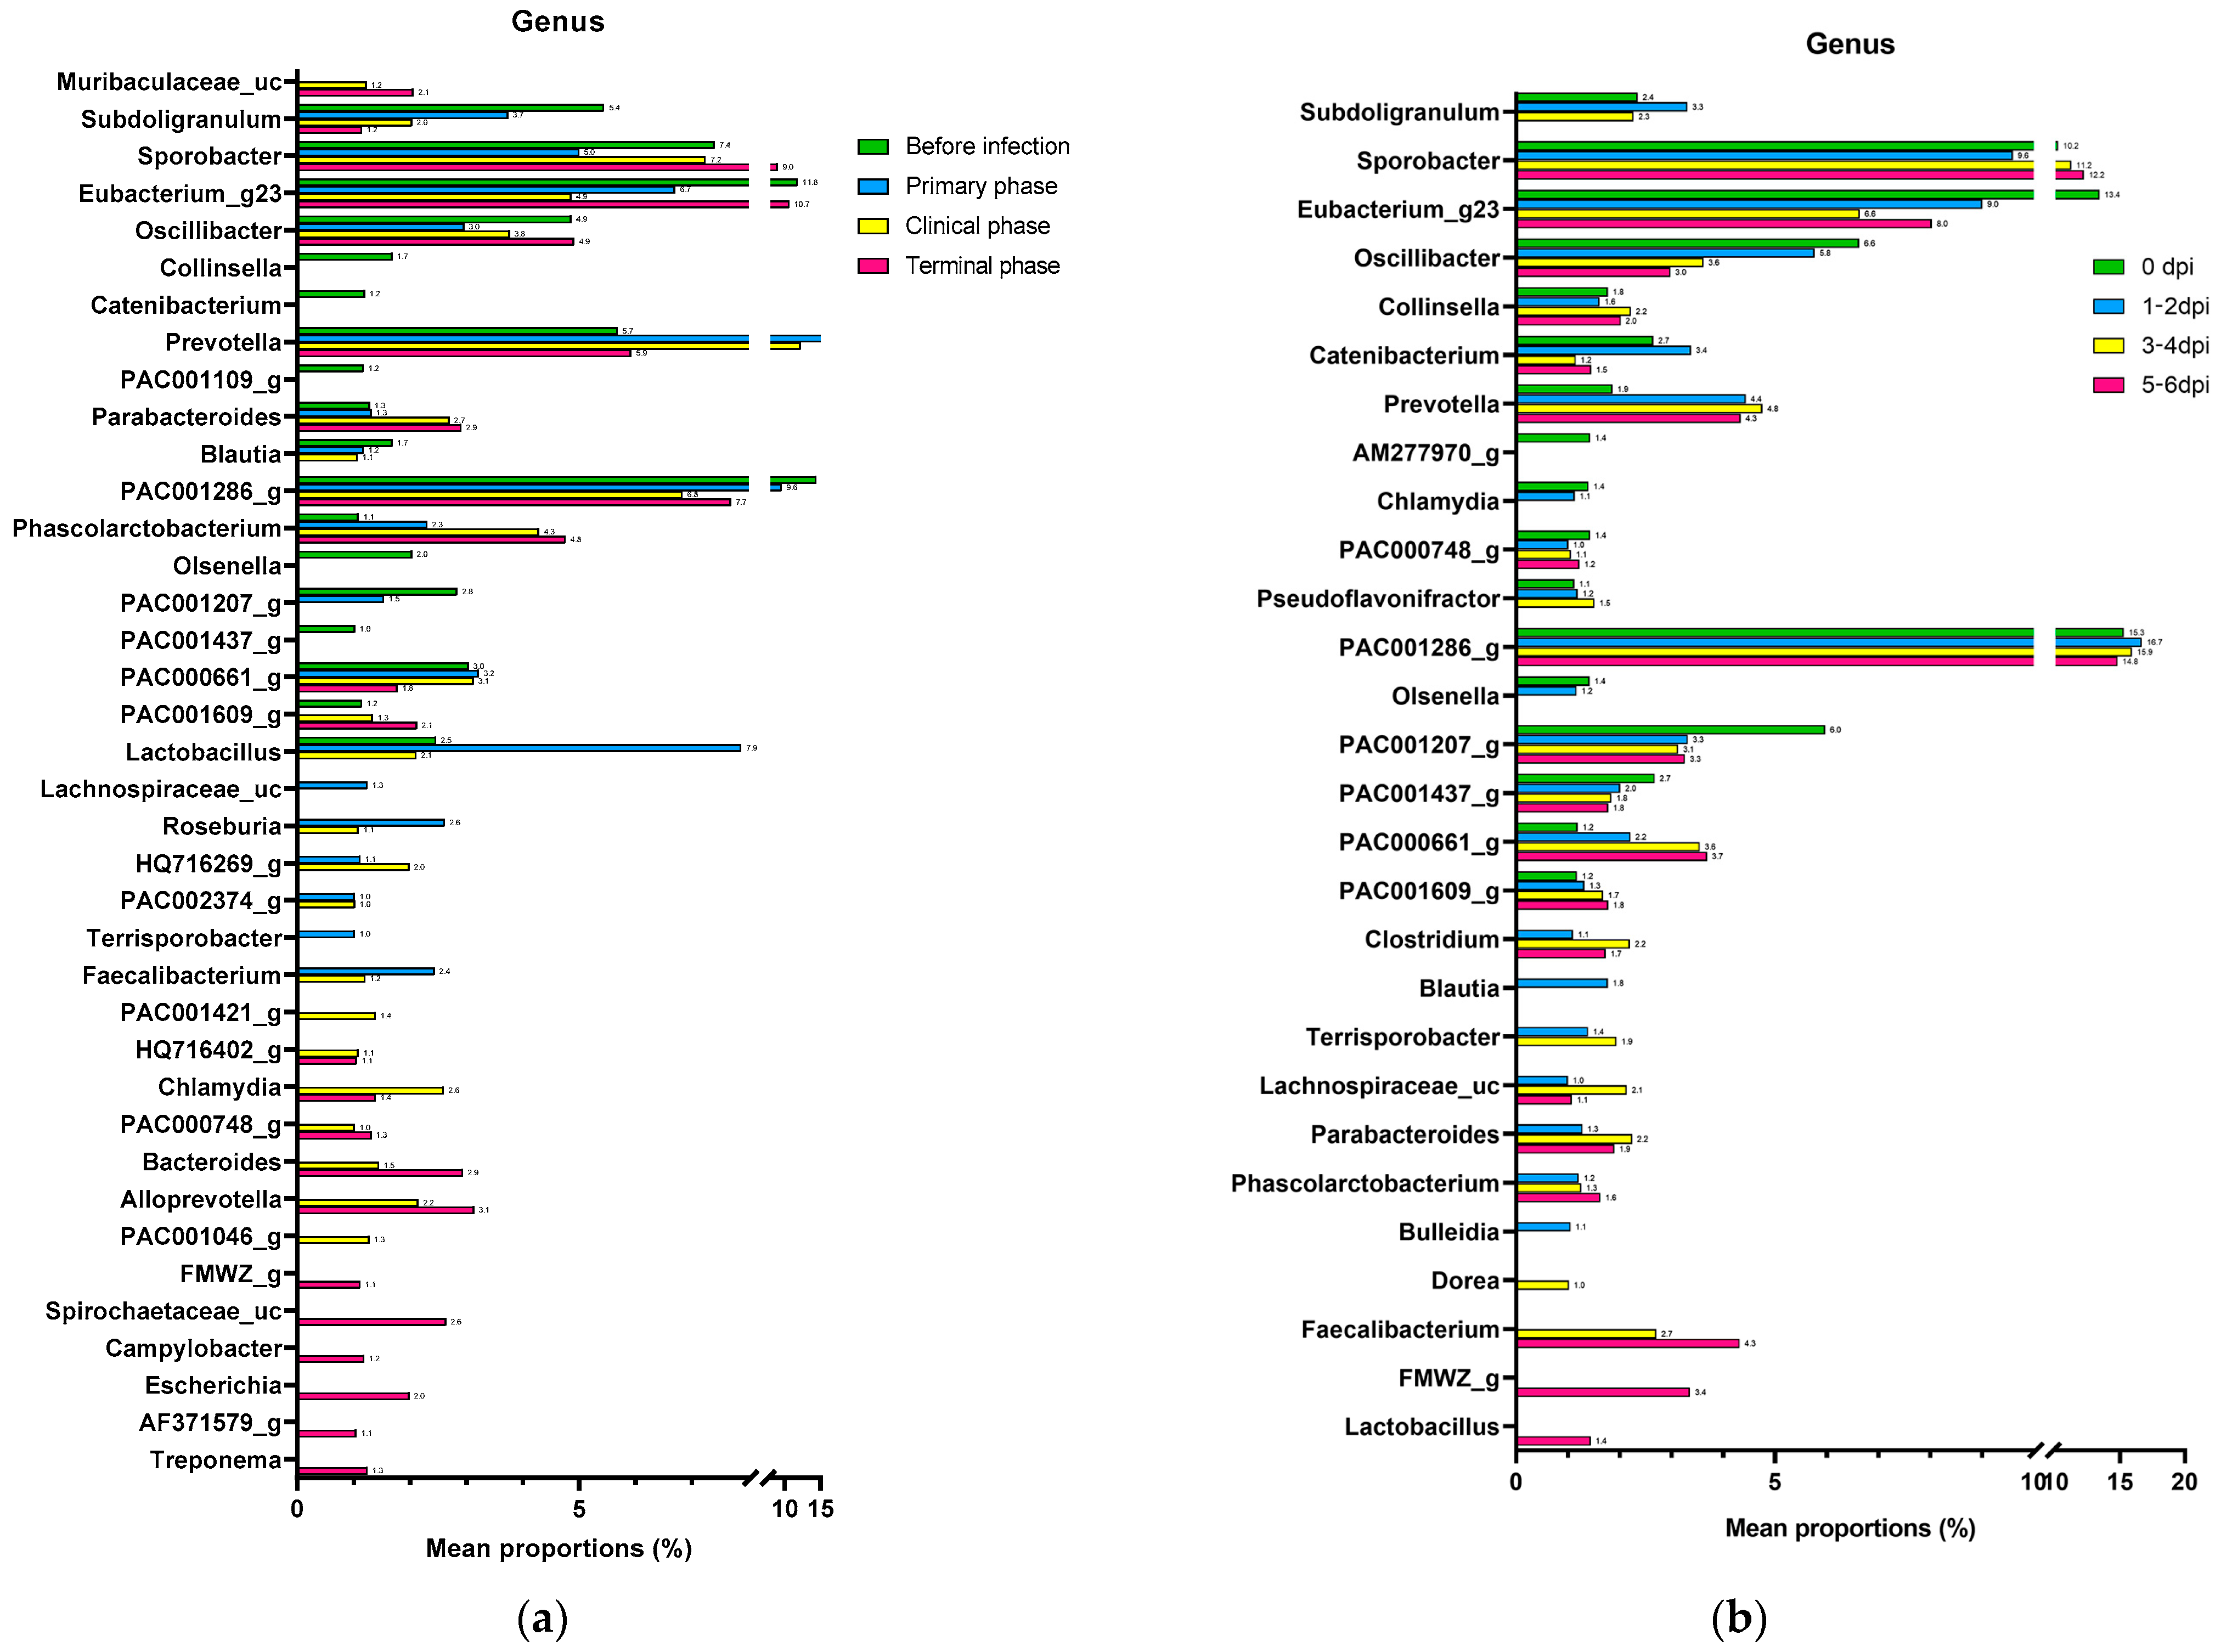
3.1.2. Composition Analysis (Community Bar Plot)
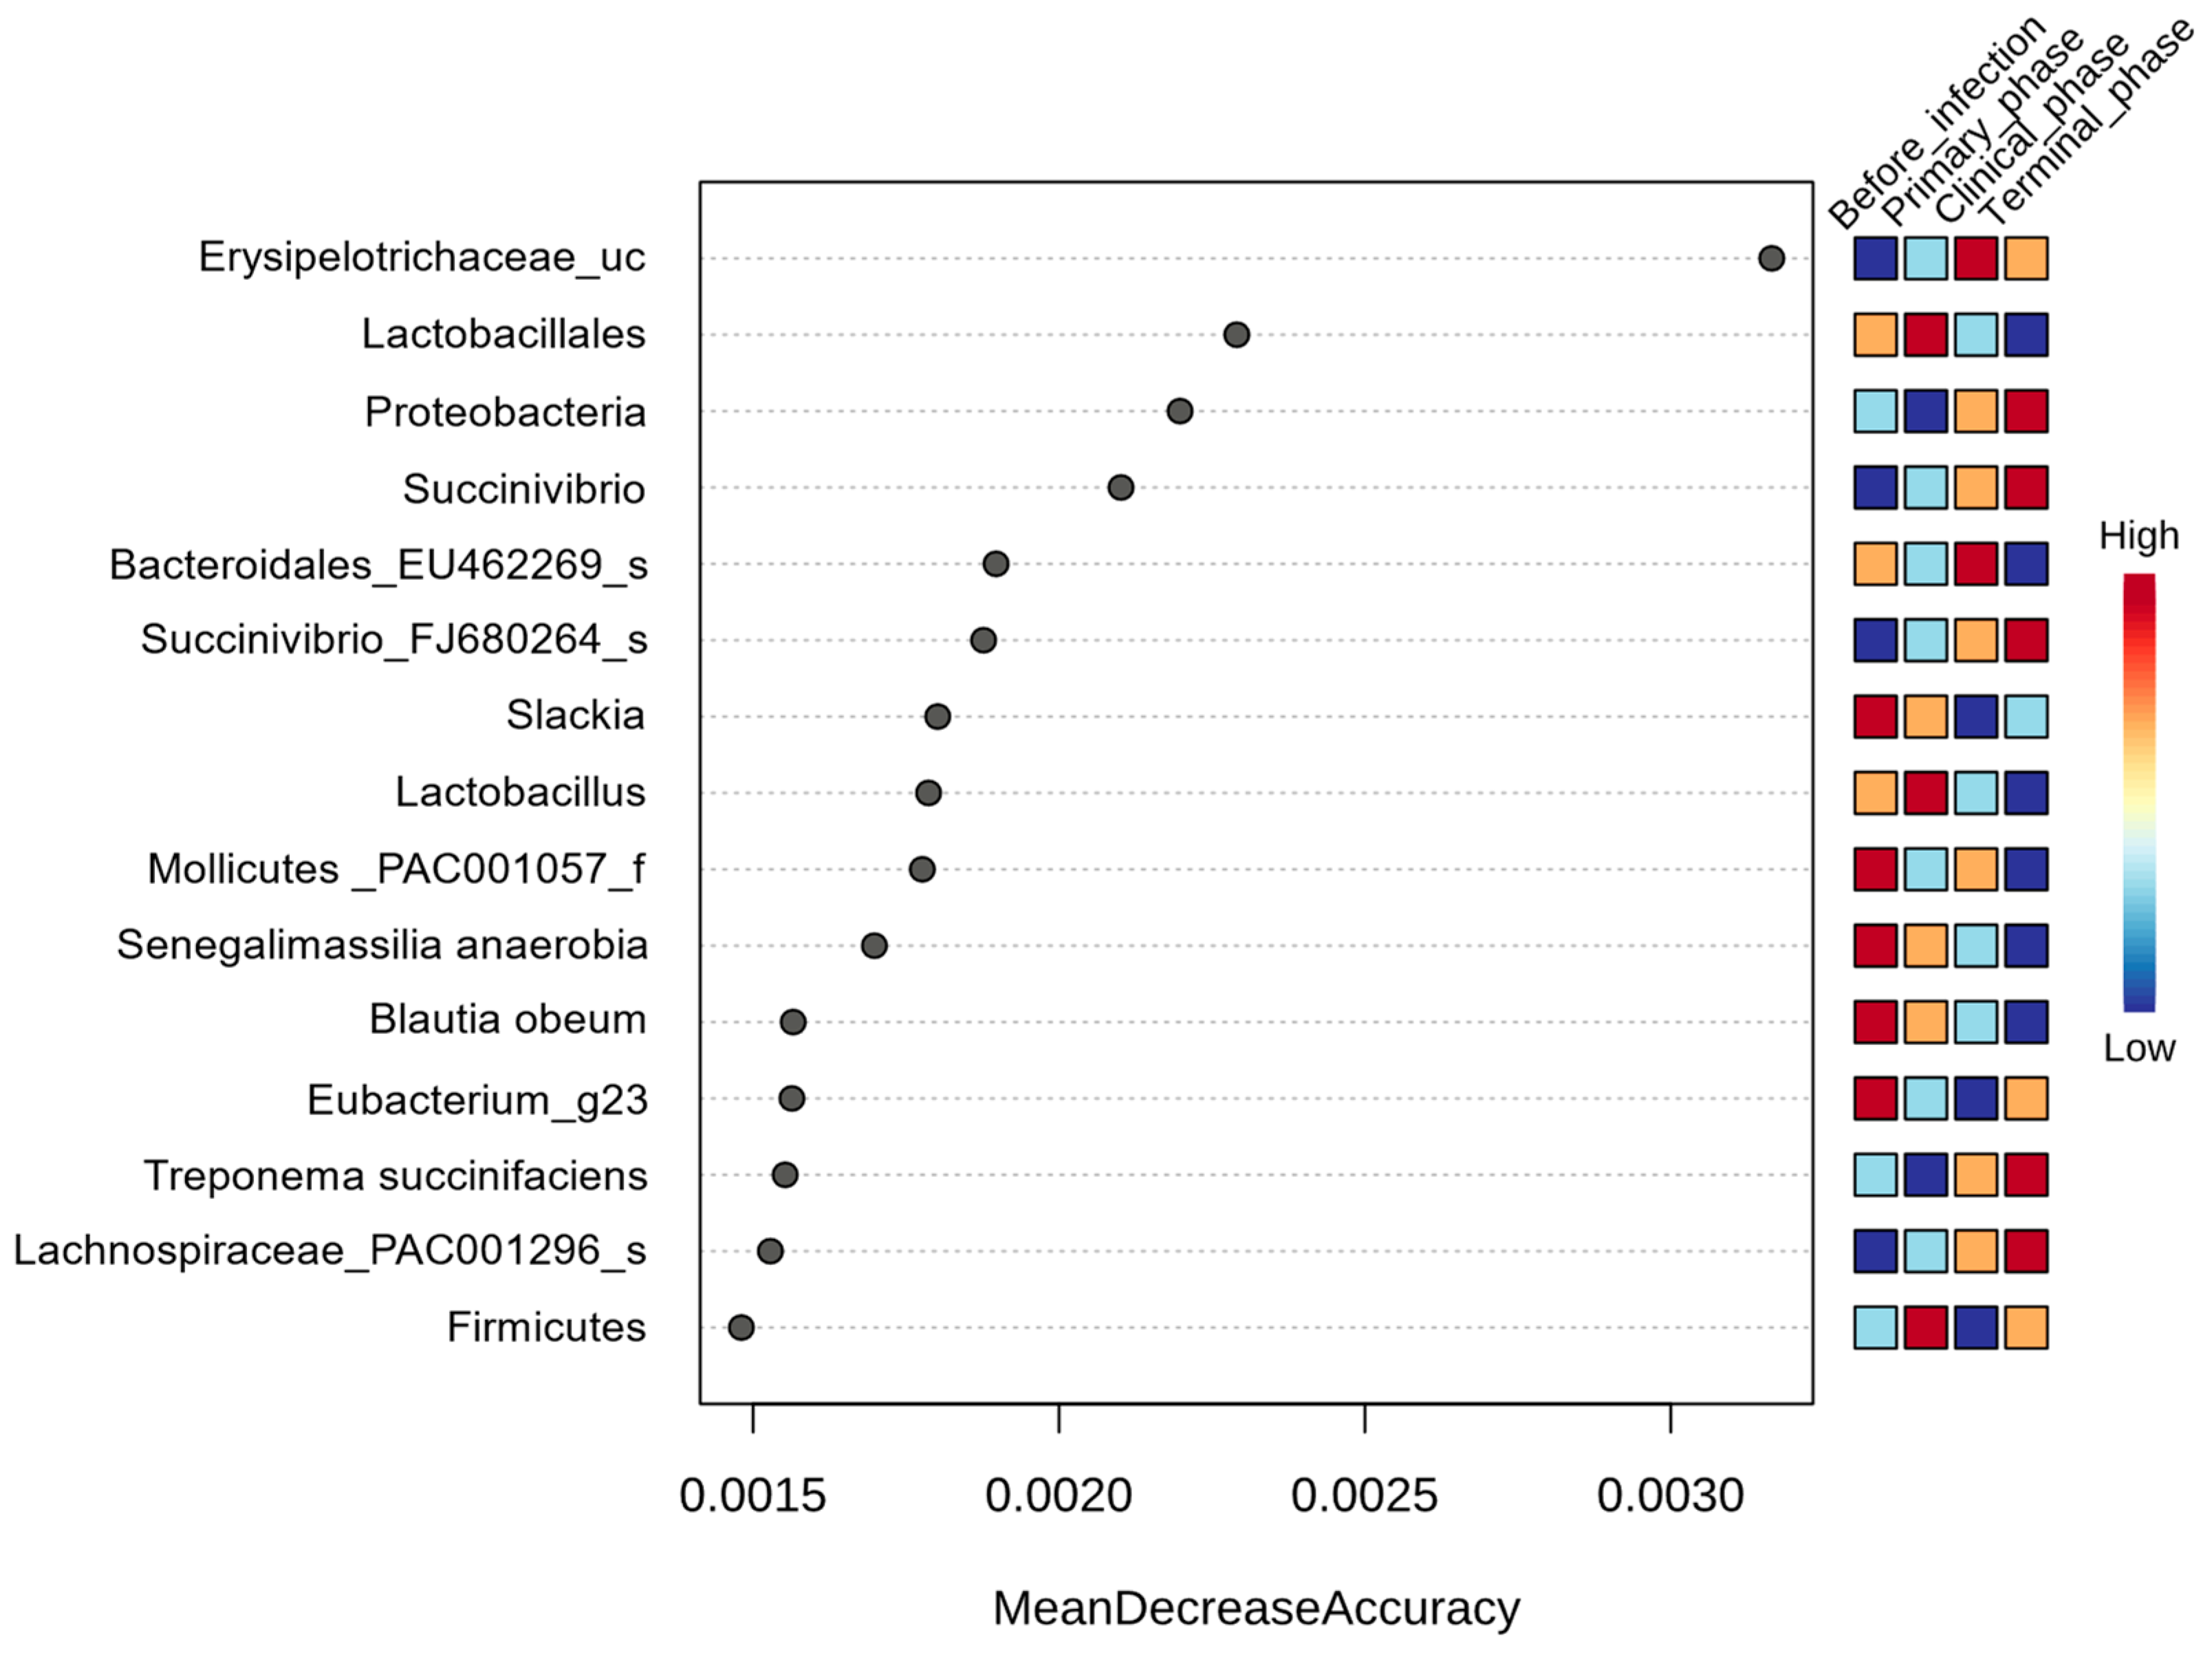
3.1.3. Random Forest Analysis
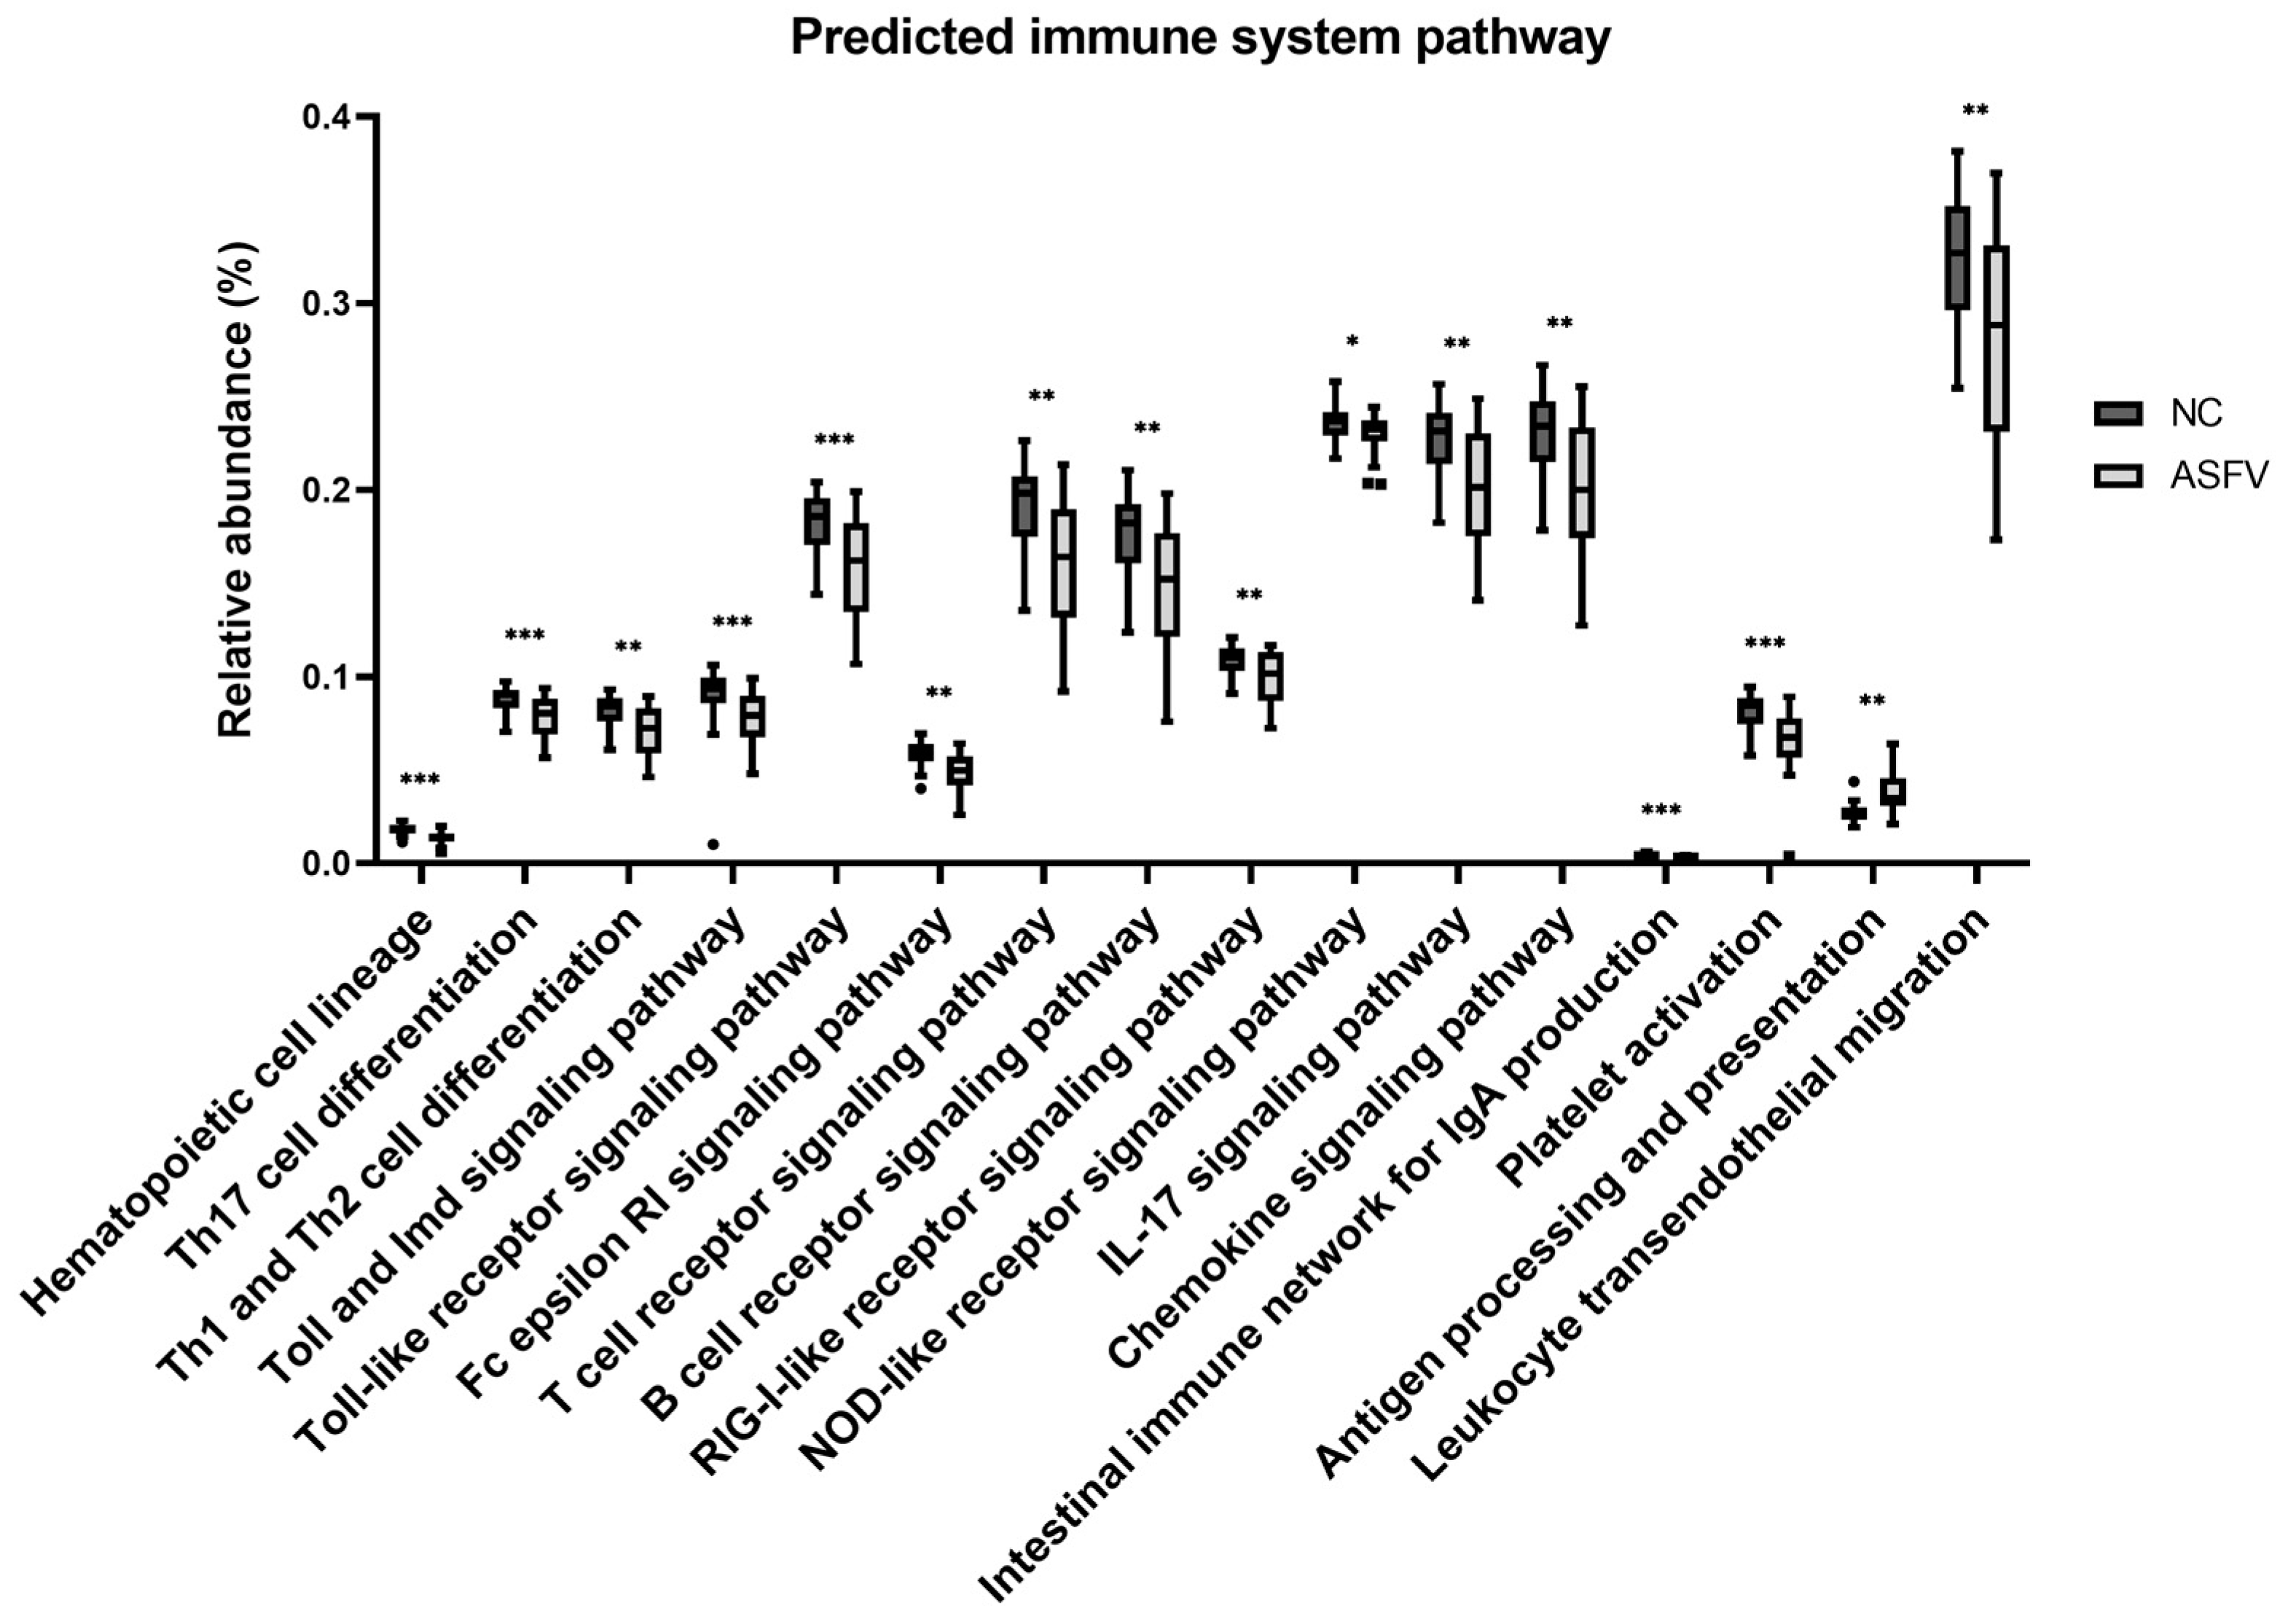
3.1.4. Differences of Predicted Immune System-Related Function
4. Discussion
5. Conclusions
Author Contributions
Funding
Institutional Review Board Statement
Informed Consent Statement
Data Availability Statement
Conflicts of Interest
Appendix A

| Primer Name | Sequence | |
|---|---|---|
| Forward primer | 515F | GTGCCAGCMGCCGCGGTAA |
| Reverse primer | 806R | GGACTACHVGGGTWTCTAAT |
| Rank | Sequence |
|---|---|
| Species | x ≥ 97% |
| Genus | 97 > x ≥ 94.5% |
| Family | 94.5 > x ≥ 86.5% |
| Order | 86.5 > x ≥ 82% |
| Class | 82 > x ≥ 78.5% |
| Phylum | 78.5 > x ≥ 75% |
| Rank | Taxon Name | log2FC | lfcSE | Pvalues | FDR |
|---|---|---|---|---|---|
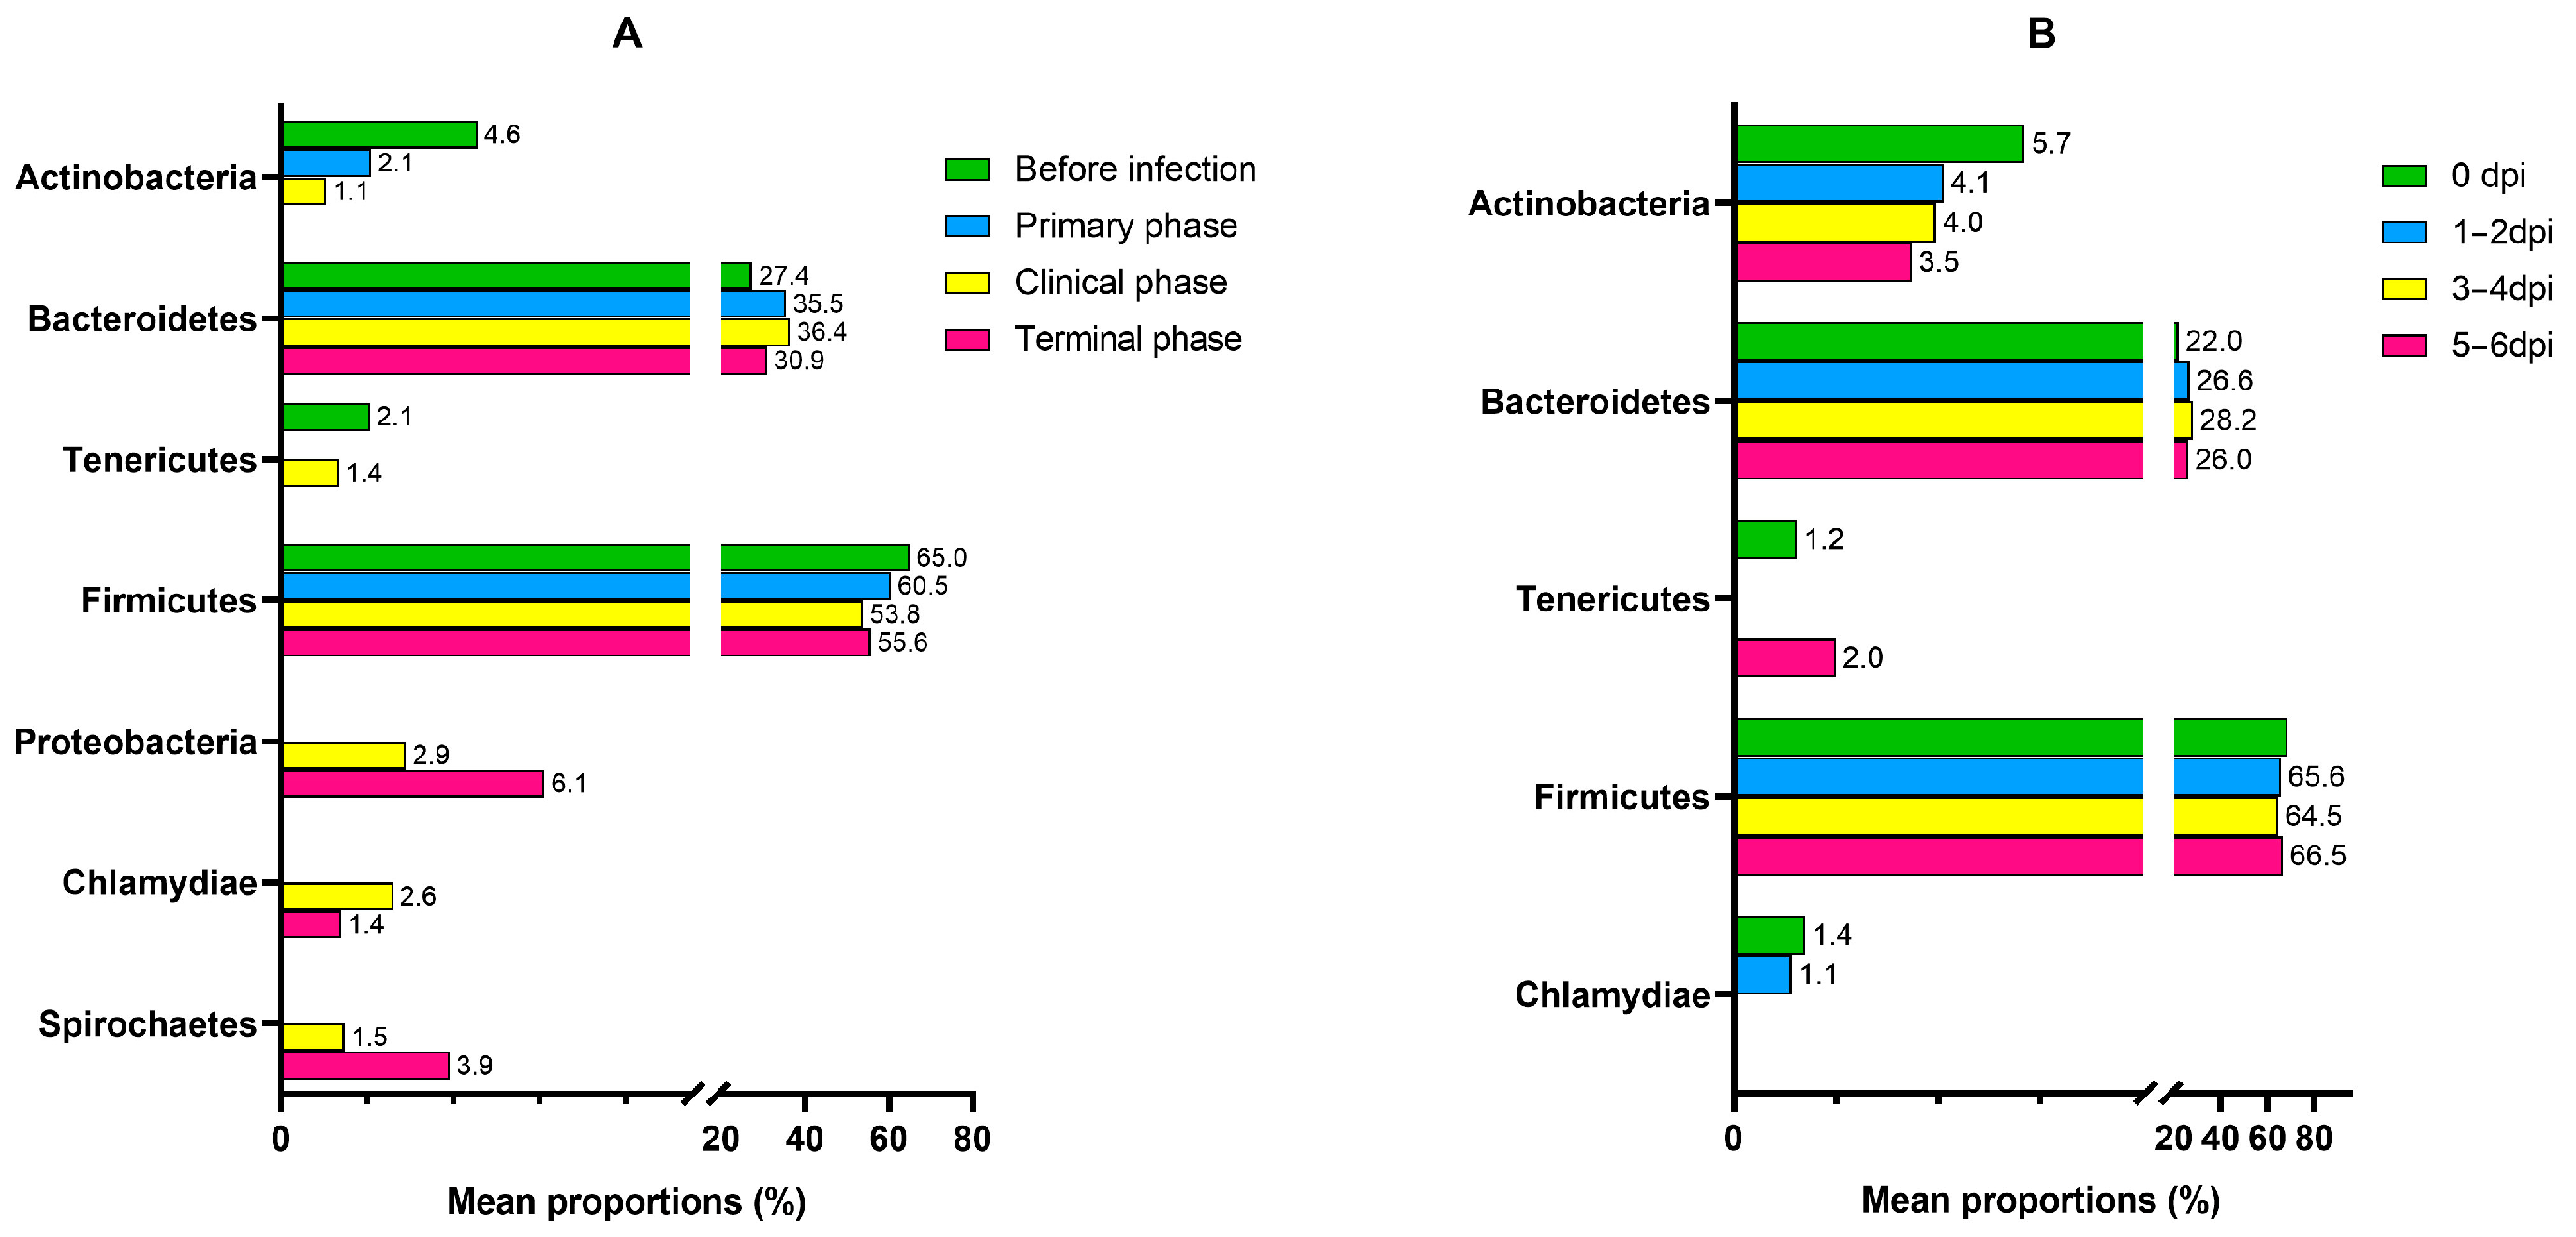
| Phylum | Proteobacteria | 5.1114 | 0.93166 | 4.10 × 10⁻⁸ | 3.96 × 10⁻⁶ |
| Actinobacteria | −2.2849 | 0.53324 | 1.83 × 10⁻⁵ | 0.000482 | |
| Tenericutes | −2.134 | 0.75353 | 0.004625 | 0.022923 | |
| Spirochaetes | 3.5424 | 1.297 | 0.00631 | 0.027896 | |
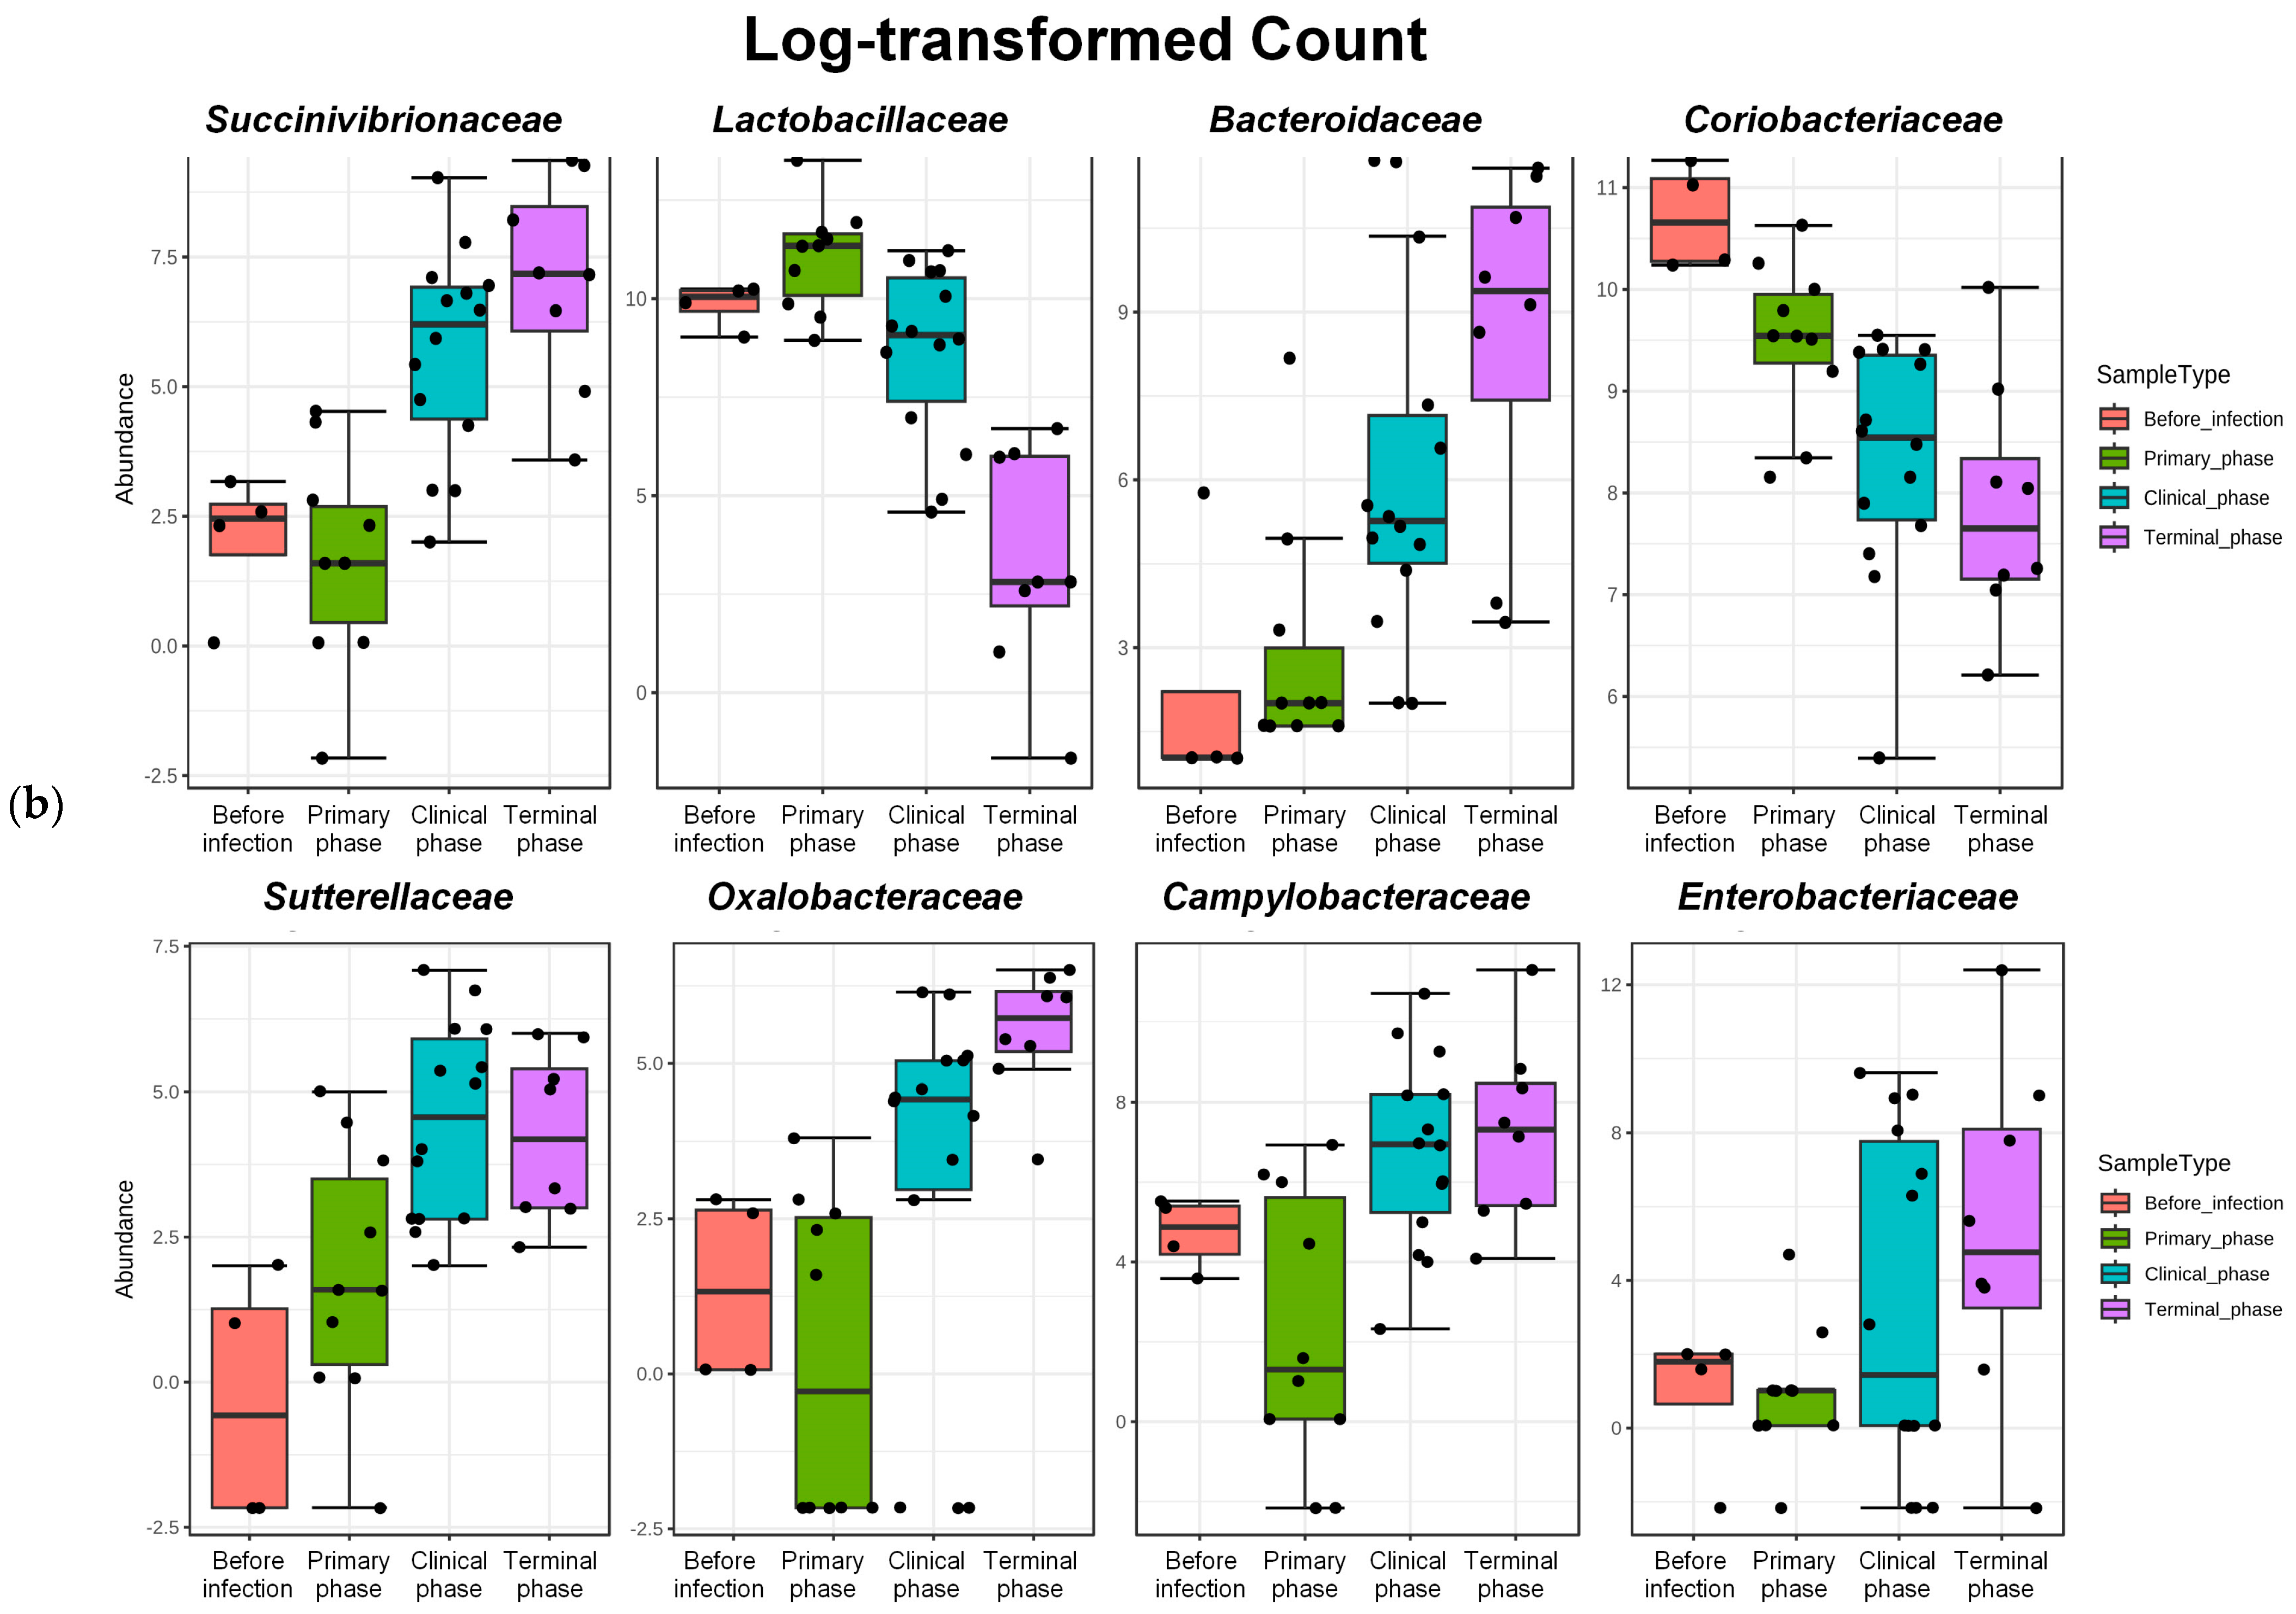
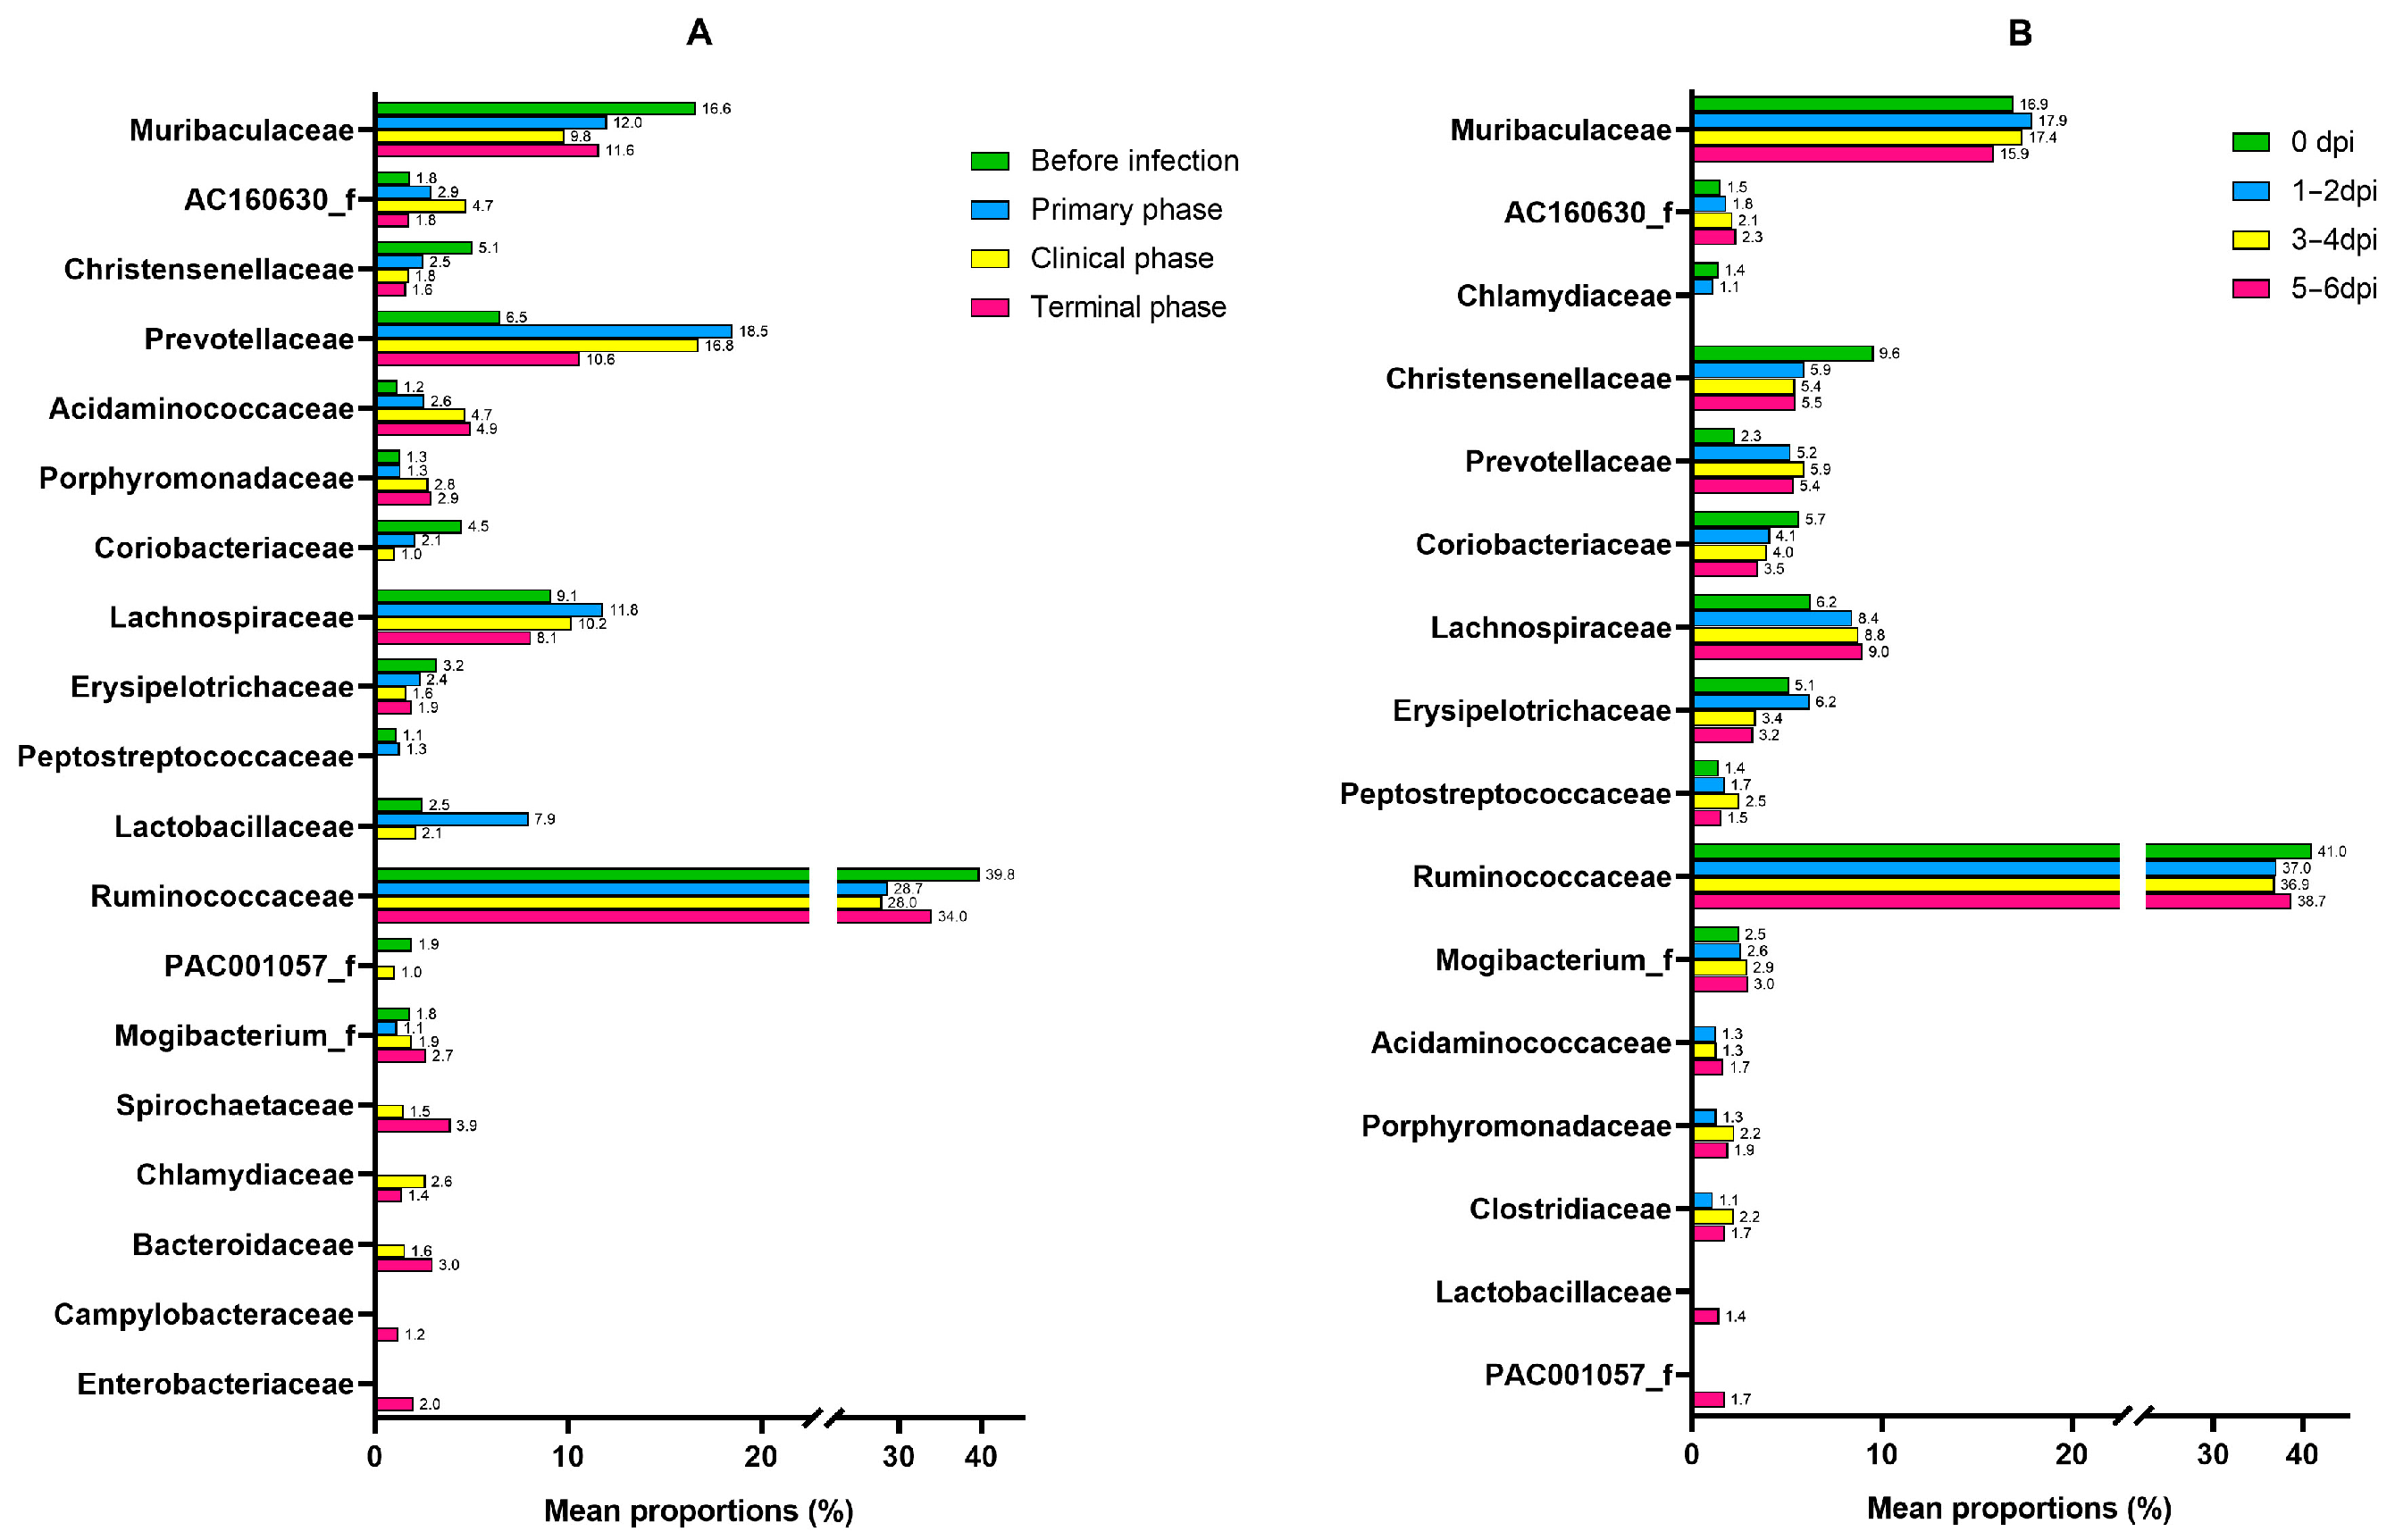
| Family | Succinivibrionaceae | 5.7109 | 1.0362 | 3.56 × 10⁻⁸ | 3.96 × 10⁻⁶ |
| Lactobacillaceae | −4.623 | 1.0155 | 5.30 × 10⁻⁶ | 0.000206 | |
| Bacteroidaceae | 6.5406 | 1.4896 | 1.13 × 10⁻⁵ | 0.000357 | |
| Coriobacteriaceae | −2.2905 | 0.55352 | 3.50 × 10⁻⁵ | 0.000815 | |
| Sutterellaceae | 4.4515 | 1.1659 | 0.000134 | 0.002069 | |
| Oxalobacteraceae | 4.0941 | 1.0951 | 0.000185 | 0.002708 | |
| Campylobacteraceae | 4.4795 | 1.2869 | 0.0005 | 0.00488 | |
| Enterobacteriaceae | 5.626 | 1.6928 | 0.000889 | 0.007247 | |
| PAC001057_f | −2.3488 | 0.75333 | 0.001821 | 0.012313 | |
| Acidaminococcaceae | 2.2465 | 0.72494 | 0.001943 | 0.012701 | |
| Rikenellaceae | 3.8817 | 1.4036 | 0.005682 | 0.026593 | |
| Spirochaetaceae | 3.5348 | 1.296 | 0.006382 | 0.028021 | |
| Selenomonadaceae | 2.9241 | 1.1269 | 0.009463 | 0.036691 | |
| Desulfovibrionaceae | 3.7273 | 1.491 | 0.012425 | 0.044272 | |
| Helicobacteraceae | 3.4036 | 1.3653 | 0.012668 | 0.044635 | |
| Porphyromonadaceae | 1.4226 | 0.57139 | 0.012787 | 0.044635 | |
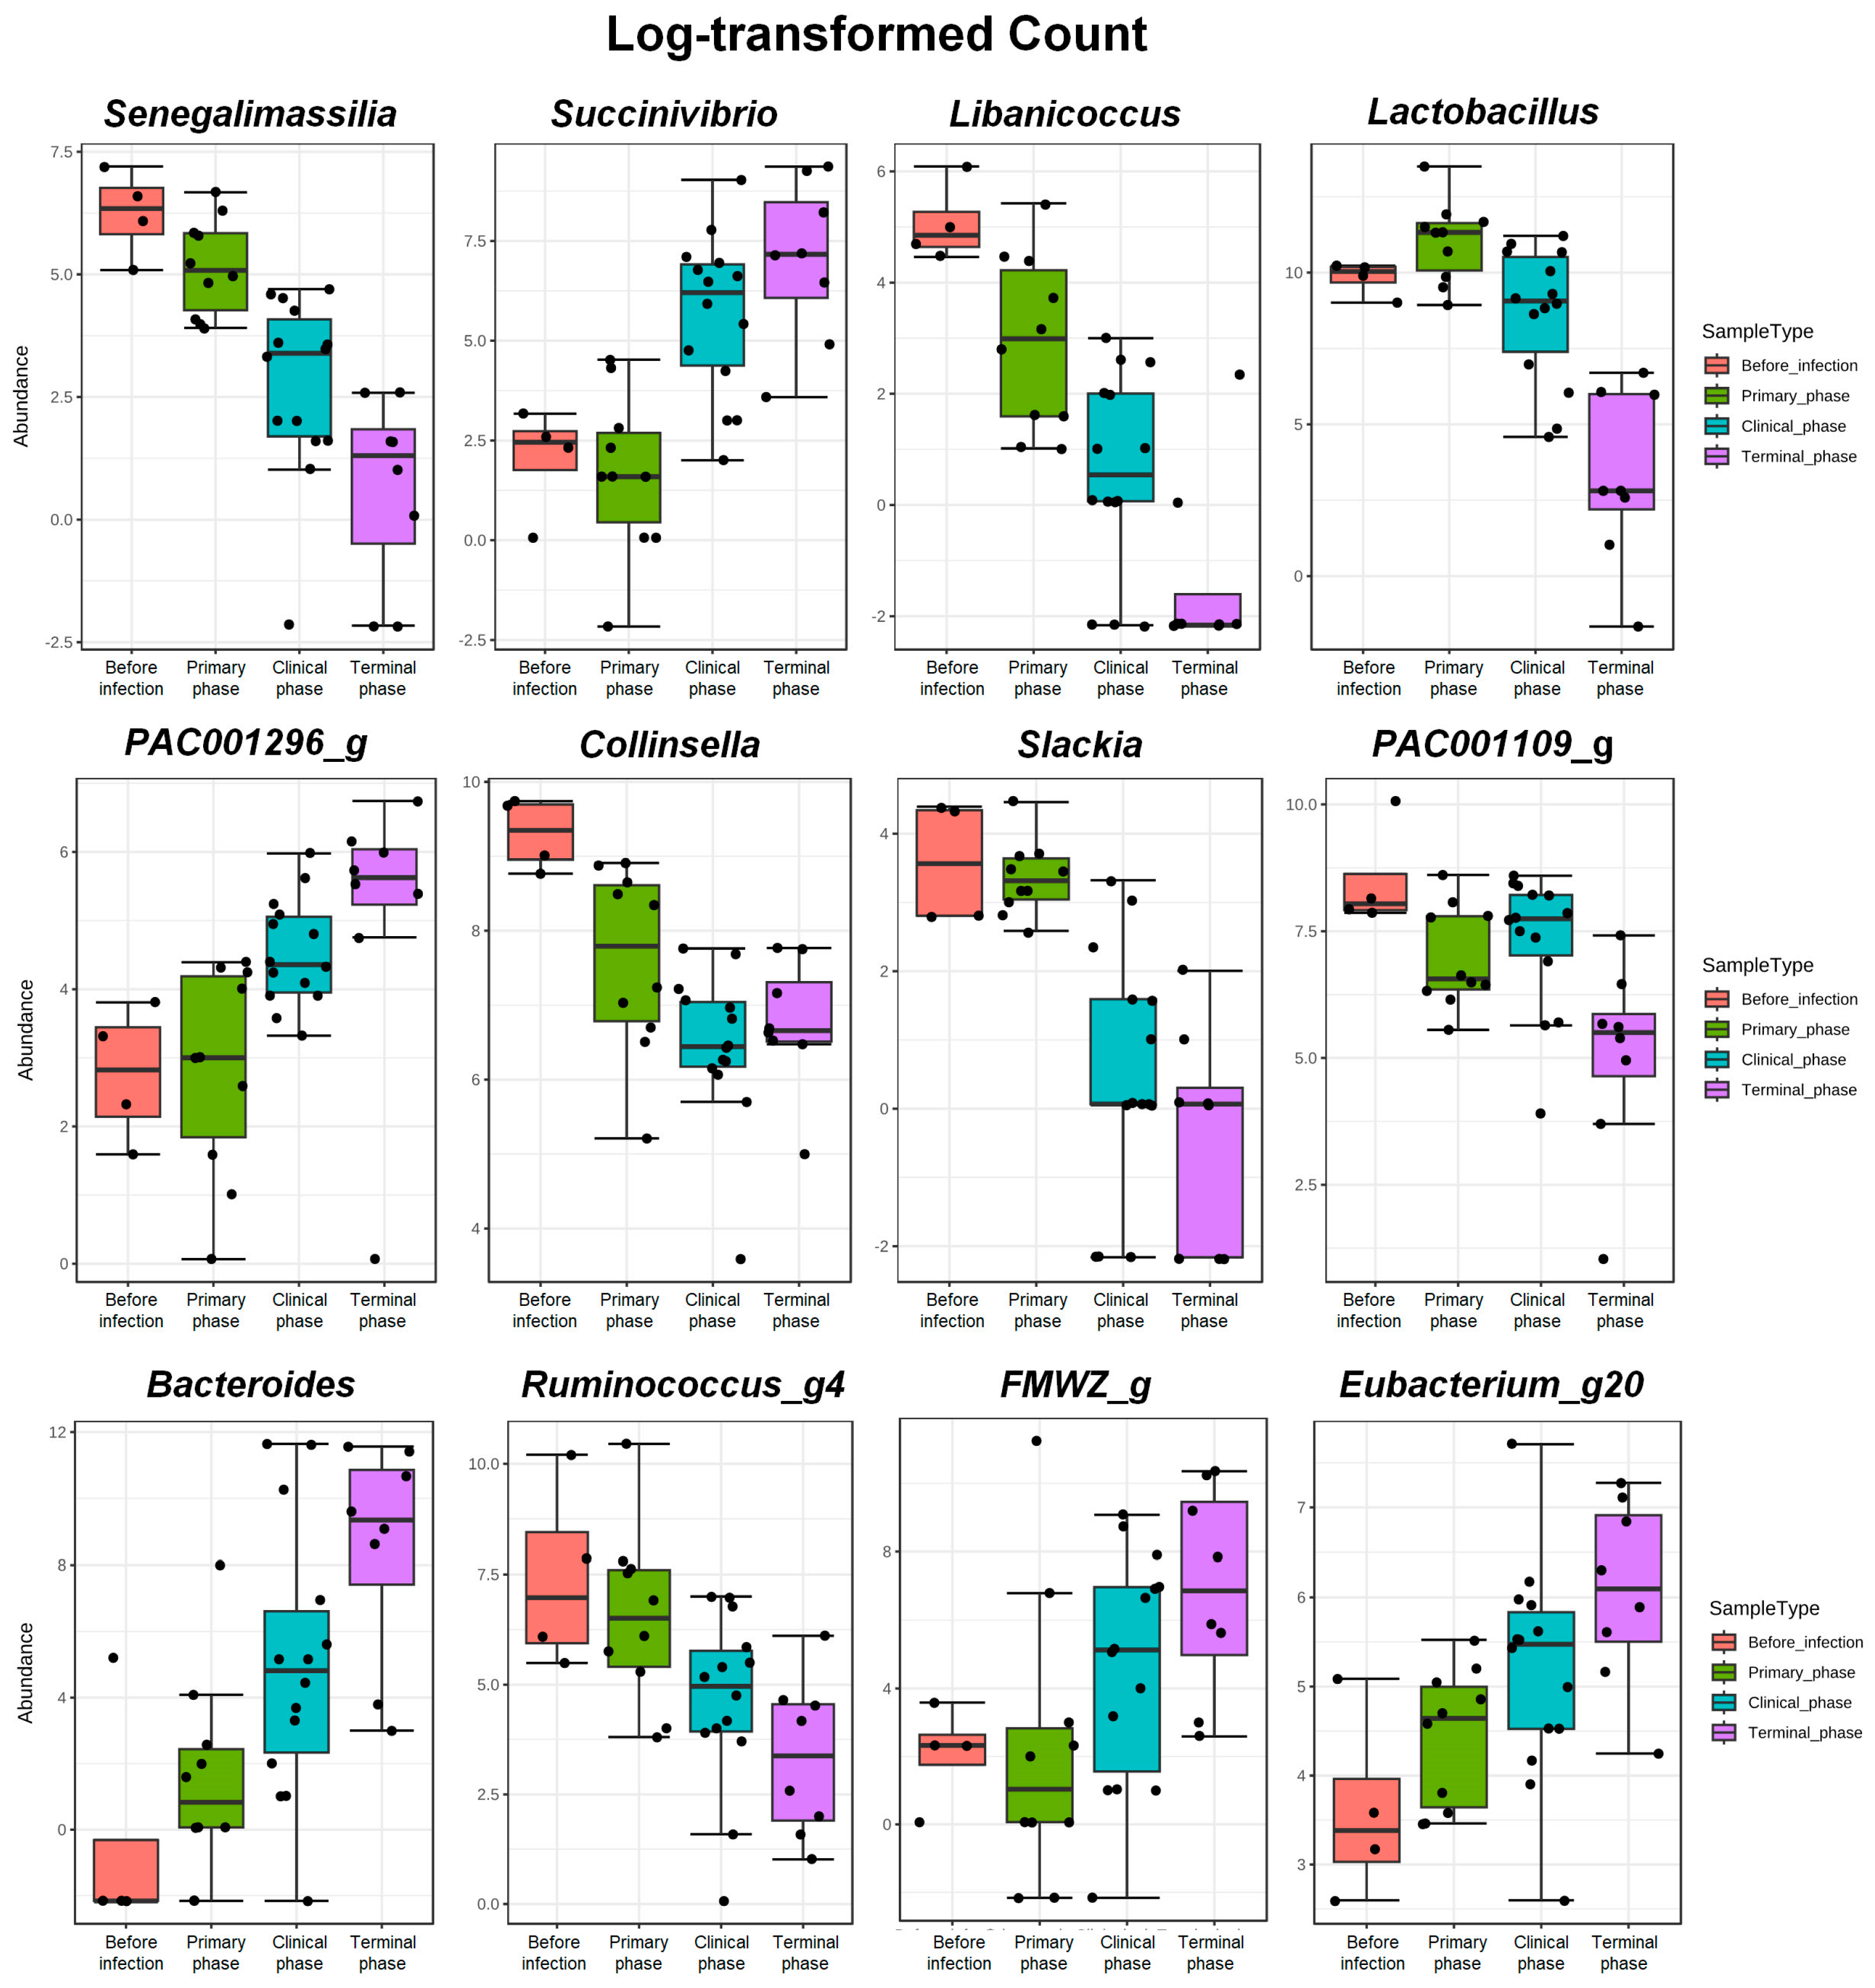
| Genus | Senegalimassilia | −4.887 | 0.7962 | 8.36 × 10⁻¹⁰ | 2.20 × 10⁻⁷ |
| Succinivibrio | 5.707 | 1.0362 | 3.64 × 10⁻⁸ | 3.96 × 10⁻⁶ | |
| Libanicoccus | −5.4583 | 1.0541 | 2.24 × 10⁻⁷ | 1.48 × 10⁻⁵ | |
| Lactobacillus | −4.612 | 1.0151 | 5.54 × 10⁻⁶ | 0.000206 | |
| PAC001296_g | 2.9423 | 0.67521 | 1.32 × 10⁻⁵ | 0.000385 | |
| Collinsella | −2.2055 | 0.51245 | 1.68 × 10⁻⁵ | 0.000458 | |
| Slackia | −3.425 | 0.85786 | 6.54 × 10⁻⁵ | 0.001361 | |
| PAC001109_g | −2.7295 | 0.69226 | 8.05 × 10⁻⁵ | 0.001576 | |
| Bacteroides | 7.2141 | 1.8313 | 8.17 × 10⁻⁵ | 0.001576 | |
| Ruminococcus_g4 | −4.0636 | 1.0337 | 8.46 × 10⁻⁵ | 0.001594 | |
| FMWZ_g | 6.3814 | 1.6396 | 9.94 × 10⁻⁵ | 0.001692 | |
| Eubacterium_g20 | 2.5903 | 0.67521 | 0.000125 | 0.002059 | |
| AF371579_g | 7.5437 | 1.9764 | 0.000135 | 0.002069 | |
| PAC000683_g | −6.6672 | 1.7683 | 0.000163 | 0.002432 | |
| Oxalobacter | 4.0869 | 1.0944 | 0.000188 | 0.002708 | |
| Spirochaetaceae_uc | 7.6252 | 2.0536 | 0.000205 | 0.002793 | |
| Fusicatenibacter | −4.2495 | 1.1467 | 0.000211 | 0.002823 | |
| Alloprevotella | 3.256 | 0.88813 | 0.000246 | 0.003142 | |
| Eubacterium_g17 | 3.5848 | 0.98495 | 0.000273 | 0.003286 | |
| EU009800_g | 3.4923 | 0.95981 | 0.000274 | 0.003286 | |
| Prevotellaceae_uc | 2.75 | 0.76604 | 0.000331 | 0.003635 | |
| PAC001421_g | 2.6834 | 0.755 | 0.000379 | 0.004 | |
| Coprococcus | −4.3742 | 1.2411 | 0.000424 | 0.004418 | |
| Marvinbryantia | −3.3581 | 0.95936 | 0.000465 | 0.004711 | |
| Campylobacter | 4.4661 | 1.2872 | 0.000521 | 0.005029 | |
| PAC001141_g | 4.0817 | 1.1799 | 0.000542 | 0.005101 | |
| PAC001068_g | −4.282 | 1.2437 | 0.000576 | 0.005356 | |
| PAC001100_g | −2.2164 | 0.64782 | 0.000623 | 0.005601 | |
| Lactobacillaceae_uc | −5.0569 | 1.4834 | 0.000652 | 0.005794 | |
| Escherichia | 5.6208 | 1.6916 | 0.000892 | 0.007247 | |
| Parasutterella | 4.1929 | 1.2722 | 0.000982 | 0.007744 | |
| EU463156_g | −6.0643 | 1.8722 | 0.001199 | 0.009034 | |
| Ruminococcus_g2 | −2.4388 | 0.75362 | 0.001212 | 0.009042 | |
| Eisenbergiella | 5.2408 | 1.6491 | 0.001483 | 0.010574 | |
| Phascolarctobacterium | 2.2816 | 0.71844 | 0.001494 | 0.010574 | |
| Catenibacterium | −3.1502 | 0.99908 | 0.001615 | 0.01111 | |
| Sutterella | 5.0939 | 1.6356 | 0.001844 | 0.012359 | |
| AB559589_g | −2.657 | 0.85484 | 0.001882 | 0.012511 | |
| Catonella | −4.1477 | 1.3497 | 0.002119 | 0.01363 | |
| PAC001177_g | −3.0393 | 1.0007 | 0.002388 | 0.014871 | |
| JX575929_g | −2.3167 | 0.77504 | 0.002798 | 0.016698 | |
| Dialister | −4.89 | 1.6448 | 0.002949 | 0.017152 | |
| AM277970_g | −2.4752 | 0.83725 | 0.003113 | 0.017712 | |
| AB009222_g | 2.951 | 1.0006 | 0.003186 | 0.017833 | |
| Blautia | −1.8036 | 0.61888 | 0.003565 | 0.0193 | |
| Subdoligranulum | −1.9553 | 0.67774 | 0.003914 | 0.020443 | |
| Clostridium_g24 | 2.9665 | 1.0343 | 0.00413 | 0.021351 | |
| PAC001274_g | −3.0487 | 1.0691 | 0.004349 | 0.022338 | |
| JN162689_g | −2.3714 | 0.83757 | 0.004637 | 0.022923 | |
| PAC001057_g | −3.9866 | 1.4097 | 0.004685 | 0.02293 | |
| GQ871718_g | −2.7815 | 0.98523 | 0.004754 | 0.02293 | |
| Alistipes | 3.8779 | 1.4034 | 0.005725 | 0.026611 | |
| PAC001241_g | −4.0975 | 1.4963 | 0.006174 | 0.027896 | |
| GQ451199_g | 2.2206 | 0.81493 | 0.006432 | 0.028021 | |
| PAC001686_g | −2.1176 | 0.77733 | 0.006447 | 0.028021 | |
| AB264065_g | −4.9889 | 1.8595 | 0.007298 | 0.031205 | |
| AY858394_g | −3.6125 | 1.3647 | 0.008118 | 0.033113 | |
| PAC002367_g | 4.522 | 1.7157 | 0.008398 | 0.033652 | |
| AF349416_g | −2.6947 | 1.0228 | 0.008424 | 0.033652 | |
| Erysipelotrichaceae_uc | 2.3661 | 0.8991 | 0.008497 | 0.033774 | |
| PAC001236_g | −2.2813 | 0.88392 | 0.009853 | 0.037913 | |
| Anaerotignum | 1.8293 | 0.72129 | 0.011207 | 0.04176 | |
| PAC001500_g | 4.928 | 1.9464 | 0.011347 | 0.041912 | |
| Parabacteroides | 1.4137 | 0.56493 | 0.012335 | 0.044272 | |
| CCYH_g | 2.5902 | 1.0357 | 0.012384 | 0.044272 | |
| Helicobacter | 3.3973 | 1.3649 | 0.012808 | 0.044635 | |
| DQ353924_g | −3.225 | 1.2969 | 0.01289 | 0.044635 | |
| PAC001137_g | 2.9533 | 1.1885 | 0.012956 | 0.044635 | |
| PAC002181_g | −2.854 | 1.1646 | 0.014262 | 0.048009 | |
| Olsenella | −2.2061 | 0.90023 | 0.014263 | 0.048009 |


References
- Vallée, I.; Tait, S.W.G.; Powell, P.P. African Swine Fever Virus Infection of Porcine Aortic Endothelial Cells Leads to Inhibition of Inflammatory Responses, Activation of the Thrombotic State, and Apoptosis. J. Virol. 2001, 75, 10372–10382. [Google Scholar] [CrossRef] [PubMed]
- Nguyen-Thi, T.; Pham-Thi-Ngoc, L.; Nguyen-Ngoc, Q.; Dang-Xuan, S.; Lee, H.S.; Nguyen-Viet, H.; Padungtod, P.; Nguyen-Thu, T.; Tran-Cong, T.; Rich, K.M. An Assessment of the Economic Impacts of the 2019 African Swine Fever Outbreaks in Vietnam. Front. Vet. Sci. 2021, 8, 686038. [Google Scholar] [CrossRef]
- Rock, D. Challenges for African swine fever vaccine development—“… perhaps the end of the beginning.”. Vet. Microbiol. 2017, 206, 52–58. [Google Scholar] [CrossRef] [PubMed]
- Li, Z.; Chen, W.; Qiu, Z.; Li, Y.; Fan, J.; Wu, K.; Li, X.; Zhao, M.; Ding, H.; Fan, S.; et al. African Swine Fever Virus: A Review. Life 2022, 12, 1255. [Google Scholar] [CrossRef] [PubMed]
- Franzoni, G.; Graham, S.P.; Giudici, S.D.; Bonelli, P.; Pilo, G.; Anfossi, A.G.; Pittau, M.; Nicolussi, P.S.; Laddomada, A.; Oggiano, A. Characterization of the interaction of African swine fever virus with monocytes and derived macrophage subsets. Vet. Microbiol. 2017, 198, 88–98. [Google Scholar] [CrossRef]
- Dixon, L.; Islam, M.; Nash, R.; Reis, A. African swine fever virus evasion of host defences. Virus Res. 2019, 266, 25–33. [Google Scholar] [CrossRef]
- Zhu, J.J.; Ramanathan, P.; Bishop, E.A.; O’donnell, V.; Gladue, D.P.; Borca, M.V. Mechanisms of African swine fever virus pathogenesis and immune evasion inferred from gene expression changes in infected swine macrophages. PLoS ONE 2019, 14, e0223955. [Google Scholar] [CrossRef]
- Blome, S.; Franzke, K.; Beer, M. African swine fever—A review of current knowledge. Virus Res. 2020, 287, 198099. [Google Scholar] [CrossRef]
- Sencio, V.; Machado, M.G.; Trottein, F. The lung–gut axis during viral respiratory infections: The impact of gut dysbiosis on secondary disease outcomes. Mucosal Immunol. 2021, 14, 296–304. [Google Scholar] [CrossRef]
- Park, S.; Steinegger, M.; Cho, H.-S.; Chun, J. Metagenomic Association Analysis of Gut Symbiont Limosilactobacillus reuteri Without Host-Specific Genome Isolation. Front. Microbiol. 2020, 11, 585622. [Google Scholar] [CrossRef]
- Moon, S.H.; Koh, S.E.; Oh, Y.; Cho, H.S. Exposure to low concentrations of mycotoxins triggers unique responses from the pig gut microbiome. Korean J. Vet. Serv. 2020, 43, 39–44. [Google Scholar] [CrossRef]
- Honda, K.; Littman, D.R. The microbiota in adaptive immune homeostasis and disease. Nature 2016, 535, 75–84. [Google Scholar] [CrossRef]
- Samuelson, D.R.; Welsh, D.A.; Shellito, J.E. Regulation of lung immunity and host defense by the intestinal microbiota. Front. Microbiol. 2015, 6, 1085. [Google Scholar] [CrossRef] [PubMed]
- Lv, L.-X.; Jiang, H.-Y.; Yan, R.; Li, L. Interactions Between Gut Microbiota and Hosts and Their Role in Infectious Diseases. Infect. Microbes Dis. 2019, 1, 3–9. [Google Scholar] [CrossRef]
- Kim, C.H.; Park, J.; Kim, M. Gut Microbiota-Derived Short-Chain Fatty Acids, T Cells, and Inflammation. Immune Netw. 2014, 14, 277–288. [Google Scholar] [CrossRef] [PubMed]
- Wang, H.; Wei, C.-X.; Min, L.; Zhu, L.-Y. Good or bad: Gut bacteria in human health and diseases. Biotechnol. Biotechnol. Equip. 2018, 32, 1075–1080. [Google Scholar] [CrossRef]
- Harper, A.; Vijayakumar, V.; Ouwehand, A.C.; ter Haar, J.; Obis, D.; Espadaler, J.; Binda, S.; Desiraju, S.; Day, R. Viral Infections, the Microbiome, and Probiotics. Front. Cell. Infect. Microbiol. 2021, 10, 596166. [Google Scholar] [CrossRef]
- Xu, H.; Wei, Y.; Ma, H.; Liu, Y.; Zhang, Y.; Hu, L.; Li, J. Alterations of Gut Microbiome in the Patients With Severe Fever With Thrombocytopenia Syndrome. Front. Microbiol. 2018, 9, 2315. [Google Scholar] [CrossRef]
- Argüello, H.; Rodríguez-Gómez, I.M.; Sánchez-Carvajal, J.M.; Pallares, F.J.; Díaz, I.; Cabrera-Rubio, R.; Crispie, F.; Cotter, P.D.; Mateu, E.; Martín-Valls, G.; et al. Porcine reproductive and respiratory syndrome virus impacts on gut microbiome in a strain virulence-dependent fashion. Microb. Biotechnol. 2022, 15, 1007–1016. [Google Scholar] [CrossRef]
- King, K.; Chapman, D.; Argilaguet, J.M.; Fishbourne, E.; Hutet, E.; Cariolet, R.; Hutchings, G.; Oura, C.A.L.; Netherton, C.L.; Moffat, K.; et al. Protection of European domestic pigs from virulent African isolates of African swine fever virus by experimental immunisation. Vaccine 2011, 29, 4593–4600. [Google Scholar] [CrossRef]
- Hershey, B.J.; Hagart, J.L.; Havas, K.A. Clinical Indicators of Moribundity in Swine Experimentally Inoculated with African Swine Fever Virus. J. Am. Assoc. Lab. Anim. Sci. 2021, 60, 96–102. [Google Scholar] [CrossRef] [PubMed]
- Wang, S.; Zhang, J.; Zhang, Y.; Yang, J.; Wang, L.; Qi, Y.; Han, X.; Zhou, X.; Miao, F.; Chen, T.; et al. Cytokine Storm in Domestic Pigs Induced by Infection of Virulent African Swine Fever Virus. Front. Vet. Sci. 2021, 7, 601641. [Google Scholar] [CrossRef] [PubMed]
- Kazantseva, J.; Malv, E.; Kaleda, A.; Kallastu, A.; Meikas, A. Optimisation of sample storage and DNA extraction for human gut microbiota studies. BMC Microbiol. 2021, 21, 158. [Google Scholar] [CrossRef]
- CJ Bioscience, Inc. 16S rRNA Microbiome protocol For Illumina iSeq 100. Available online: https://help.ezbiocloud.net/16s-mtp-protocol-for-illumina-iseq-100/ (accessed on 13 February 2019).
- Yoon, S.-H.; Ha, S.-M.; Kwon, S.; Lim, J.; Kim, Y.; Seo, H.; Chun, J. Introducing EzBioCloud: A taxonomically united database of 16S rRNA gene sequences and whole-genome assemblies. Int. J. Syst. Evol. Microbiol. 2017, 67, 1613–1617. [Google Scholar] [CrossRef] [PubMed]
- Rognes, T.; Flouri, T.; Nichols, B.; Quince, C.; Mahé, F. VSEARCH: A versatile open source tool for metagenomics. PeerJ 2016, 4, e2584. [Google Scholar] [CrossRef]
- Basler, C.F. Molecular pathogenesis of viral hemorrhagic fever. Semin. Immunopathol. 2017, 39, 551–561. [Google Scholar] [CrossRef]
- Borca, M.; Gay, C.; Risatti, G.; O’Toole, D.; Li, H.; Kuhn, J.H.; Lewis, C.E.; Loiacono, C.M.; White, D. Viral Hemorrhagic Fevers of Animals Caused by DNA Viruses. In Global Virology I—Identifying and Investigating Viral Diseases; Shapshak, P., Sinnott, J.T., Somboonwit, C., Kuhn, J.H., Eds.; Springer: New York, NY, USA, 2015; pp. 319–343. [Google Scholar]
- Geisbert, T.W.; Hensley, L.E.; Gibb, T.R.; Steele, K.E.; Jaax, N.K.; Jahrling, P.B. Apoptosis Induced In Vitro and In Vivo During Infection by Ebola and Marburg Viruses. Lab. Investig. 2000, 80, 171–186. [Google Scholar] [CrossRef]
- Brandtzaeg, P. Mucosal Immunity: Induction, Dissemination, and Effector Functions. Scand. J. Immunol. 2009, 70, 505–515. [Google Scholar] [CrossRef]
- Shale, M.; Schiering, C.; Powrie, F. CD4+T-cell subsets in intestinal inflammation. Immunol. Rev. 2013, 252, 164–182. [Google Scholar] [CrossRef]
- Salguero, F.J. Comparative Pathology and Pathogenesis of African Swine Fever Infection in Swine. Front. Vet. Sci. 2020, 7, 282. [Google Scholar] [CrossRef]
- Al Bander, Z.; Nitert, M.D.; Mousa, A.; Naderpoor, N. The Gut Microbiota and Inflammation: An Overview. Int. J. Environ. Res. Public Health 2020, 17, 7618. [Google Scholar] [CrossRef] [PubMed]
- Zaneveld, J.R.; McMinds, R.; Thurber, R.V. Stress and stability: Applying the Anna Karenina principle to animal microbiomes. Nat. Microbiol. 2017, 2, 17121. [Google Scholar] [CrossRef] [PubMed]
- Vasquez, R.; Oh, J.K.; Song, J.H.; Kang, D.-K. Gut microbiome-produced metabolites in pigs: A review on their biological functions and the influence of probiotics. J. Anim. Sci. Technol. 2022, 64, 671–695. [Google Scholar] [CrossRef]
- Maslowski, K.M.; Vieira, A.T.; Ng, A.; Kranich, J.; Sierro, F.; Yu, D.; Schilter, H.C.; Rolph, M.S.; Mackay, F.; Artis, D.; et al. Regulation of inflammatory responses by gut microbiota and chemoattractant receptor GPR43. Nature 2009, 461, 1282–1286. [Google Scholar] [CrossRef] [PubMed]
- Park, J.; Kim, M.; Kang, S.; Jannasch, A.; Cooper, B.; Patterson, J.; Kim, C. Short-chain fatty acids induce both effector and regulatory T cells by suppression of histone deacetylases and regulation of the mTOR–S6K pathway. Mucosal Immunol. 2015, 8, 80–93. [Google Scholar] [CrossRef] [PubMed]
- Tamanai-Shacoori, Z.; Smida, I.; Bousarghin, L.; Loreal, O.; Meuric, V.; Fong, S.B.; Bonnaure-Mallet, M.; Jolivet-Gougeon, A. Roseburia spp.: A marker of health? Futur. Microbiol. 2017, 12, 157–170. [Google Scholar] [CrossRef]
- Siddiqui, M.T.; Cresci, G.A.M. The Immunomodulatory Functions of Butyrate. J. Inflamm. Res. 2021, 14, 6025–6041. [Google Scholar] [CrossRef]
- Mukherjee, A.; Lordan, C.; Ross, R.P.; Cotter, P.D. Gut microbes from the phylogenetically diverse genus Eubacterium and their various contributions to gut health. Gut Microbes 2020, 12, 1802866. [Google Scholar] [CrossRef]
- Van Hul, M.; Le Roy, T.; Prifti, E.; Dao, M.C.; Paquot, A.; Zucker, J.-D.; Delzenne, N.M.; Muccioli, G.G.; Clément, K.; Cani, P.D. From correlation to causality: The case of Subdoligranulum. Gut Microbes 2020, 12, 1849998. [Google Scholar] [CrossRef]
- Liu, X.; Mao, B.; Gu, J.; Wu, J.; Cui, S.; Wang, G.; Zhao, J.; Zhang, H.; Chen, W. Blautia—A new functional genus with potential probiotic properties? Gut Microbes 2021, 13, 1875796. [Google Scholar] [CrossRef]
- Qin, P.; Zou, Y.; Dai, Y.; Luo, G.; Zhang, X.; Xiao, L. Characterization a Novel Butyric Acid-Producing Bacterium Collinsella aerofaciens Subsp. Shenzhenensis Subsp. Nov. Microorganisms 2019, 7, 78. [Google Scholar] [CrossRef] [PubMed]
- Downes, J.; Dewhirst, F.E.; Tanner, A.C.R.; Wade, W.G. Description of Alloprevotella rava gen. nov., sp. nov., isolated from the human oral cavity, and reclassification of Prevotella tannerae Moore et al. 1994 as Alloprevotella tannerae gen. nov., comb. nov. Int. J. Syst. Evol. Microbiol. 2013, 63, 1214–1218. [Google Scholar] [CrossRef] [PubMed]
- Tang, S.; Xin, Y.; Ma, Y.; Xu, X.; Zhao, S.; Cao, J. Screening of Microbes Associated With Swine Growth and Fat Deposition Traits Across the Intestinal Tract. Front. Microbiol. 2020, 11, 586776. [Google Scholar] [CrossRef]
- Pietrucci, D.; Teofani, A.; Milanesi, M.; Fosso, B.; Putignani, L.; Messina, F.; Pesole, G.; Desideri, A.; Chillemi, G. Machine Learning Data Analysis Highlights the Role of Parasutterella and Alloprevotella in Autism Spectrum Disorders. Biomedicines 2022, 10, 2028. [Google Scholar] [CrossRef] [PubMed]
- Cui, Y.; Zhang, L.; Wang, X.; Yi, Y.; Shan, Y.; Liu, B.; Zhou, Y.; Lü, X. Roles of intestinal Parabacteroides in human health and diseases. FEMS Microbiol. Lett. 2022, 369, fnac072. [Google Scholar] [CrossRef]
- Ramakrishna, C.; Kujawski, M.; Chu, H.; Li, L.; Mazmanian, S.K.; Cantin, E.M. Bacteroides fragilis polysaccharide A induces IL-10 secreting B and T cells that prevent viral encephalitis. Nat. Commun. 2019, 10, 2153. [Google Scholar] [CrossRef]
- Zafar, H.; Saier, M.H., Jr. Gut Bacteroides species in health and disease. Gut Microbes 2021, 13, 1848158. [Google Scholar] [CrossRef]
- Bank, N.C.; Singh, V.; Rodriguez-Palacios, A. Classification of Parabacteroides distasonis and other Bacteroidetes using O-antigen virulence gene: RfbA-Typing and hypothesis for pathogenic vs. probiotic strain differentiation. Gut Microbes 2022, 14, 1997293. [Google Scholar] [CrossRef]
- Koropatkin, N.M.; Cameron, E.A.; Martens, E.C. How glycan metabolism shapes the human gut microbiota. Nat. Rev. Genet. 2012, 10, 323–335. [Google Scholar] [CrossRef]
- Sudhaharan, S.; Chavali, P.; Vemu, L. Anaerobic brain abscess. Iran. J. Microbiol. 2016, 8, 120–124. [Google Scholar]
- Fernández-Veledo, S.; Vendrell, J. Gut microbiota-derived succinate: Friend or foe in human metabolic diseases? Rev. Endocr. Metab. Disord. 2019, 20, 439–447. [Google Scholar] [CrossRef] [PubMed]
- Cho, K.-H.; Hong, S.-K.; Jang, M.-K.; Ryu, J.-H.; Kim, H.-J.; Lee, Y.-R.; Roh, I.-S.; Sohn, H.-J.; Kang, H.-E.; Park, J.-Y. Comparison of the Virulence of Korean African Swine Fever Isolates from Pig Farms during 2019–2021. Viruses 2022, 14, 2512. [Google Scholar] [CrossRef] [PubMed]
- Huang, M.-Z.; Wang, S.-Y.; Wang, H.; Cui, D.-A.; Yang, Y.-J.; Liu, X.-W.; Kong, X.-J.; Li, J.-Y. Differences in the intestinal microbiota between uninfected piglets and piglets infected with porcine epidemic diarrhea virus. PLoS ONE 2018, 13, e0192992. [Google Scholar] [CrossRef] [PubMed]
- Pabst, R. The pig as a model for immunology research. Cell Tissue Res. 2020, 380, 287–304. [Google Scholar] [CrossRef] [PubMed]
- Smith, D.R.; Holbrook, M.R.; Gowen, B.B. Animal models of viral hemorrhagic fever. Antivir. Res. 2014, 112, 59–79. [Google Scholar] [CrossRef]


| Phase | ASFV-Infected Pigs | |||
|---|---|---|---|---|
| P1 | P2 | P3 | P4 | |
| Before infection | 0 dpi | 0 dpi | 0 dpi | 0 dpi |
| Primary phase | 1–2 dpi | 1–2 dpi | 1–2 dpi | 1, 3, 4, 5 dpi |
| Clinical phase | 3, 4, 6 dpi | 3, 4, 5, 6 dpi | 3, 4, 6, 7 dpi | 6, 7, 8 dpi |
| Terminal phase | 7, 8 dpi | 7, 8 dpi | 9, 10 dpi | 9, 11 dpi |
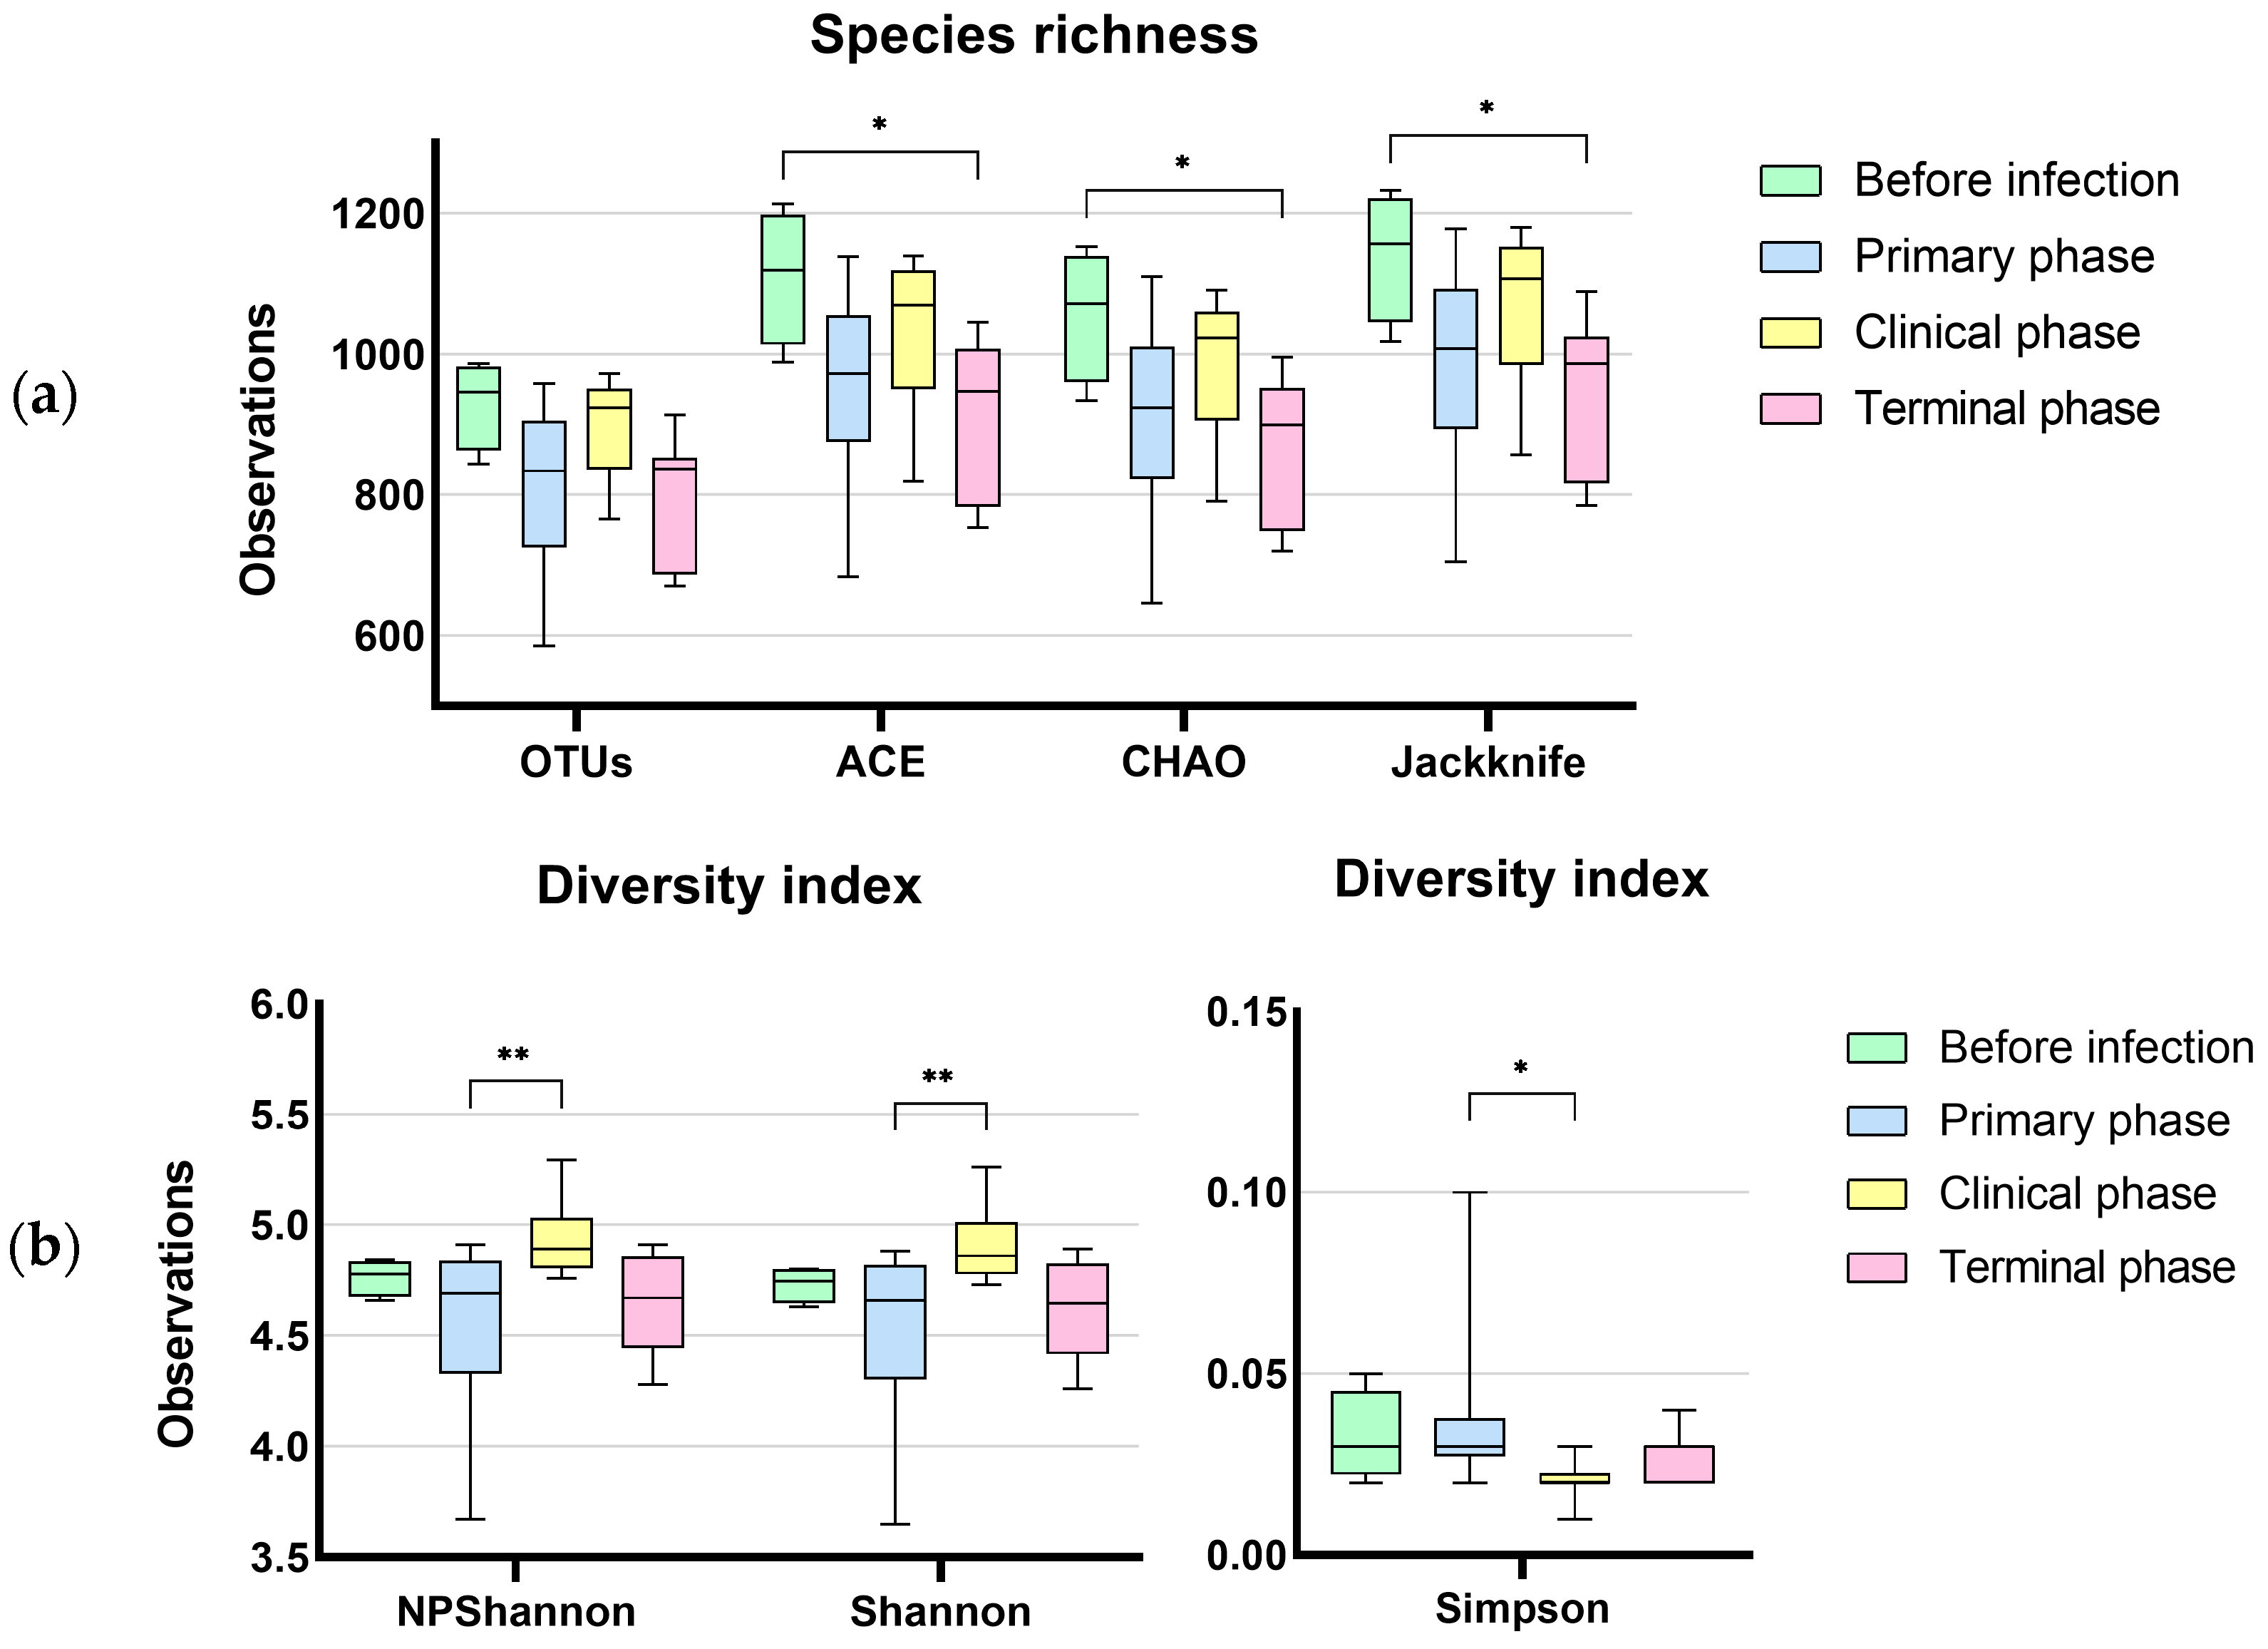
| Sampling Depth | Richness Index | Diversity Index | Good’s Coverage (%) | |||
|---|---|---|---|---|---|---|
| Reads | ACE | Chao1 | Shannon | Simpson | ||
| Before infection | 55,096 | 1058.47 ± 76.52 a | 1016.49 ± 73.01 a | 4.73 ± 0.06 a | 0.03 ± 0.01 a | 99.78 ± 0.01 |
| Primary phase | 51,696 | 917.49 ± 129.44 ab | 882.01 ± 124.97 ab | 4.54 ± 0.36 ab | 0.04 ± 0.02 ab | 99.78 ± 0.05 |
| Clinical phase | 54,088 | 996.82 ± 85.54 ab | 963.34 ± 79.98 ab | 4.91 ± 0.16 b | 0.02 ± 0.01 b | 99.81 ± 0.04 |
| Terminal phase | 45,985 | 883.79 ± 90.74 b | 849.29 ± 88.40 b | 4.62 ± 0.21 ab | 0.03 ± 0.01 ab | 99.77 ± 0.03 |
| No. | Subclass | Definition | Mean Relative Abundance (%) | p-Value | p-Value (FDR) | |
|---|---|---|---|---|---|---|
| NC | ASFV | |||||
| 1 | Cell differentiation | Hematopoietic cell lineage | 0.01815 | 0.01390 | 1.74 × 10⁻⁵ | 0.000228 |
| 2 | Th17 cell differentiation | 0.08841 | 0.07897 | 0.000158 | 0.000806 | |
| 3 | Th1 and Th2 cell differentiation | 0.08243 | 0.07100 | 0.000332 | 0.001345 | |
| 4 | Receptor signaling | Toll and Imd signaling pathway | 0.09005 | 0.07785 | 2.83 × 10⁻⁵ | 0.000293 |
| 5 | Toll-like receptor signaling pathway | 0.18316 | 0.15916 | 0.000149 | 0.0008 | |
| 6 | FC epsilon RI signaling pathway | 0.05917 | 0.04857 | 0.00023 | 0.001054 | |
| 7 | T-cell receptor signaling pathway | 0.19233 | 0.16120 | 0.000555 | 0.001915 | |
| 8 | B-cell receptor signaling pathway | 0.17812 | 0.14869 | 0.001539 | 0.003663 | |
| 9 | RIG-I-like receptor signaling pathway | 0.10932 | 0.10016 | 0.003627 | 0.007403 | |
| 10 | NOD-like receptor signaling pathway | 0.23561 | 0.23022 | 0.009057 | 0.014872 | |
| 11 | Cytokine signaling | IL-17 signaling pathway | 0.22743 | 0.20248 | 0.000826 | 0.002402 |
| 12 | Chemokine signaling pathway | 0.23114 | 0.20199 | 0.001401 | 0.003447 | |
| 13 | Others | Intestinal immune network for IgA production | 0.00403 | 0.00274 | 3.19 × 10⁻⁵ | 0.000301 |
| 14 | Platelet activation | 0.08215 | 0.06607 | 8.55 × 10⁻⁵ | 0.000585 | |
| 15 | Antigen processing and presentation | 0.02735 | 0.03802 | 0.000332 | 0.001345 | |
| 16 | Leukocyte transendothelial migration | 0.32469 | 0.28145 | 0.00431 | 0.008448 | |
Disclaimer/Publisher’s Note: The statements, opinions and data contained in all publications are solely those of the individual author(s) and contributor(s) and not of MDPI and/or the editor(s). MDPI and/or the editor(s) disclaim responsibility for any injury to people or property resulting from any ideas, methods, instructions or products referred to in the content. |
© 2023 by the authors. Licensee MDPI, Basel, Switzerland. This article is an open access article distributed under the terms and conditions of the Creative Commons Attribution (CC BY) license (https://creativecommons.org/licenses/by/4.0/).
Share and Cite
Ko, Y.-S.; Tark, D.; Moon, S.-H.; Kim, D.-M.; Lee, T.G.; Bae, D.-Y.; Sunwoo, S.-Y.; Oh, Y.; Cho, H.-S. Alteration of the Gut Microbiota in Pigs Infected with African Swine Fever Virus. Vet. Sci. 2023, 10, 360. https://doi.org/10.3390/vetsci10050360
Ko Y-S, Tark D, Moon S-H, Kim D-M, Lee TG, Bae D-Y, Sunwoo S-Y, Oh Y, Cho H-S. Alteration of the Gut Microbiota in Pigs Infected with African Swine Fever Virus. Veterinary Sciences. 2023; 10(5):360. https://doi.org/10.3390/vetsci10050360
Chicago/Turabian StyleKo, Young-Seung, Dongseob Tark, Sung-Hyun Moon, Dae-Min Kim, Taek Geun Lee, Da-Yun Bae, Sun-Young Sunwoo, Yeonsu Oh, and Ho-Seong Cho. 2023. "Alteration of the Gut Microbiota in Pigs Infected with African Swine Fever Virus" Veterinary Sciences 10, no. 5: 360. https://doi.org/10.3390/vetsci10050360
APA StyleKo, Y.-S., Tark, D., Moon, S.-H., Kim, D.-M., Lee, T. G., Bae, D.-Y., Sunwoo, S.-Y., Oh, Y., & Cho, H.-S. (2023). Alteration of the Gut Microbiota in Pigs Infected with African Swine Fever Virus. Veterinary Sciences, 10(5), 360. https://doi.org/10.3390/vetsci10050360