Abstract
Although the presence of large wood (LW) has long been recognized to enhance watershed function, land use impact on LW remains poorly understood. Using a series of six watersheds, we investigate the relationships between LW recruitment zones, LW size, and LW jam occurrence and land use. Although the results in general show urban land use to severely limit LW, they also stress that agricultural land use may be positively correlated to LW. Occurrence of potentially productive LW recruitment zones is nevertheless best correlated to total forest land cover and forested riparian area. However, the lack of mature forest due to previous widespread deforestation linked to historical agricultural land use is likely a limiting legacy effect. Since the pattern of land use seen in the study area is typical of much of the developed world, our results suggest the limiting of LW may be a major way in which watersheds are impacted in many regions. Accordingly, reintroduction of LW represents a significant opportunity to restore watersheds on a broad scale. Specifically, we propose a mix of passive conservation and active restoration of LW sources and that the targeting of these tactics be planned using the spatial analysis methods of this study.
1. Introduction
Large wood (also known in the literature as large woody debris or LWD) has long been recognized as having an important influence on physical and ecological processes in stream channels and watersheds of all orders and gradients [1,2,3,4]. Large wood (LW) acts as an important structural element in aquatic habitats that supports high levels of abundance and diversity of fish and invertebrates by providing cover and increasing habitat complexity [2,3,4,5,6,7,8]. LW can also provide a strong physical linkage between terrestrial and aquatic ecosystems [9,10]. The presence of LW also allows for the accumulation and storing of coarse organic matter, which serves as a vital ecological energy base and enhances biogeochemical cycling of nutrients and other constituents in watershed ecosystems [3,7,11,12].
The presence of LW in stream channels influences pool formation, frequency, and morphology; increases flow resistance, sediment storage and sorting, and longitudinal variation of channel depth and width; and promotes bank stabilization and the creation of bars [3,7,11,12,13,14]. Furthermore, by directing flow into the streambed, LW can increase hyporheic exchange, which is known to enhance water quality [15,16]. When clustered into jams, LW influences streamflow and channel pattern more than individual wood pieces [17,18]. For instance, jams can initiate lateral channel migration by increasing the elevation of the streambed and water surface. Additionally, the presence and frequency of jams is thought to be an indicator of stream wood transport capacity [3,6].
With respect to recruitment, LW in low-gradient watersheds enters stream channels primarily through bank erosion and blow down of whole trees or branches and is cycled over time throughout the channel, banks, and floodplain [6,13]. Subsequent to their formation in the channel, LW accumulations or jams can be deposited on the floodplain through flooding events or abandoned through lateral channel migration; when floodwaters or the meandering channel eventually return (LW jams themselves promoting both floodplain inundation and lateral channel migration), remnants can re-enter a stream and contribute to new LW accumulations [6]. LW remnants can also remain situated on the floodplain for decades and provide habitat for a variety of terrestrial organisms [6]. Those remnants remaining stable over long time periods may represent a sizable carbon reservoir [4,19,20] and aid in replenishing supplies of new key members (larger pieces of LW which serve as an impetus for the accumulation of LW in stream channels and the formation of jams, and subsequently as a jam anchor) by protecting developing riparian forests from erosion long enough for trees to grow large [6,21].
As the degree of development/urbanization of many watersheds has increased over time, the potential for LW generation has been reduced due to widespread deforestation and direct channel modifications [3,4,6]. In many cases LW and LW jams are directly removed from the stream channel to improve navigation, protect bridges and other infrastructure, recover marketable timber, and eliminate perceived barriers to fish migration [6,8,12,22]. Often the production and recruitment of LW is also restricted by stream management projects aimed at reducing channel migration (e.g., riprap, gabions, stream bank armoring, etc.). As a consequence of these LW-limiting practices, habitat simplification and reduced stream ecological function can become rampant [4].
The composition and age of watershed forests also stands to affect LW recruitment potential. Comparisons of contemporary forest composition with lake sediment pollen analysis (as a proxy for historic forest composition) show that human disturbance of forests has resulted in a decrease in abundance of larger late-successional species and an increase in abundance of smaller early-successional species [23]. Such comparisons indicate that, despite regional natural reforestation in some areas, forests are not yet returning to their pre-settlement composition, and that contemporary forests are often a fragmented patchwork of young regrowth stands [23]. This type of forest composition in riparian zones severely limits the production and recruitment into stream channels of LW, especially key members. Such impacts on the age and composition of watershed forests therefore can be considered a legacy effect which compounds that of contemporary land use/urbanization in limiting potential for LW generation. Indeed, even when riparian forests are restored, full recovery of processes that allow for sufficient LW recruitment can lag forest regeneration by centuries [7].
Although the impact of urbanization, land use, and forest composition on LW recruitment and LW sizes has been noted in the literature [1,2,3,7,8,10,12,19,24,25,26], few studies document the character and extent of these impacts at the watershed scale. Fewer still document such impacts on watersheds in the eastern United States where urbanization and land use in general is relatively intensive and spatially pervasive, has a longer history, and has broadly shifted over the course of the past century from almost completely agricultural to a mix of urban, suburban, and agricultural. It stands to reason that the limiting of LW is a major way such patterns of spatially, temporally, and categorically heterogeneous land use—which is ubiquitous across not just the eastern U.S. but much of the developed world—contribute to the degradation of water resources and aquatic ecosystems. Therefore, in order to combat the problem, it is important to assess and document the phenomenon spatially on the broad scale at which it exists. Active and passive efforts toward restoring LW sources informed by such knowledge could represent a significant opportunity for effective restoration of watershed function and ecosystems in regions that have experienced complex, heterogeneous land use change.
With this study we aim to demonstrate how this could be done by using (Geographic Information System) GIS as a novel approach to determine the current distribution of functional LW recruitment zones—areas of forested land cover within 30 m of a stream channel [27]—in the Niagara Subbasin, a 2051 km2 catchment comprising six watersheds located in western New York, a region dominated by the complex, heterogeneous patterns of land use change described hereinabove. In addition, in order to show the extent that LW is limited by urbanization and land use impacts in the study area, in-stream LW loads will be approximated based on field surveys of LW pieces and LW accumulations or “jams” and compared to similar surveys in other regions. The implications of our findings for stream restoration and watershed management in regions with heterogeneous land use will be discussed.
2. Materials and Methods
2.1. Study Area
In the United States watersheds are delineated by the U.S. Geological Survey using a nationwide system based on surface hydrologic features. A hierarchical hydrologic unit code (HUC) consisting of two additional digits for each level in the hydrologic unit system is used to identify any hydrologic area. The system divides the country into 21 regions (two-digit), 222 subregions (four-digit), 370 basins (six-digit), 2,270 subbasins (eight-digit), ~20,000 watersheds (10-digit), and ~100,000 subwatersheds (12-digit). The Niagara Subbasin in western New York is designated with the HUC 04120104 and comprises the Niagara River (HUC 0412010406), Lower Tonawanda Creek (HUC 0412010405), Ellicott Creek (HUC 0412010404), Middle Tonawanda Creek (HUC 0412010403), Murder Creek (HUC 0412010402), and Upper Tonawanda Creek (HUC 0412010401) watersheds (Figure 1).

Figure 1.
The Niagara Subbasin and its watersheds, western New York, USA.
Over the last two centuries these watersheds have experienced urbanization and different types of land use to varying degrees (Table 1) with significant impacts. Aquatic habitat loss and species extirpation have been reported, including the loss of eight species of fish, 17 species of mollusk, and one species of macro-invertebrate [28]. However, these watersheds have not been impacted homogenously. Aquatic Habitat Viability Ratings—which attribute categorizations from very good (ecologically desirable status; requires little intervention for maintenance) to poor (restoration increasingly difficult; may result in extirpation of target species)—in the active river area (ARA) [29] and Identified Threats (local conditions susceptible to impact streams) both vary considerably (Table 2) with the exception that “lack of riparian buffers” is listed as an Identified Threat for all six watersheds [28].

Table 1.
Area, population density, and land cover information for each of the six study watersheds. LW Recruitment Zone = 30 m buffer of the stream channel [27].
Table 2.
Aquatic habitat viability ratings for each of the six study watersheds. Very Good = ecologically desirable status, requires little intervention for maintenance; Good = indicator within acceptable range of variation, some intervention required for maintenance; Fair = outside acceptable range of variation, requires human intervention; Poor = restoration increasingly difficult, may result in extirpation of native species [28].
2.2. Methodology
2.2.1. In-stream surveys
In order to describe current wood loadings in the Niagara Subbasin and reveal the in-stream signature of LW recruitment zones, two sites—one 1.5 km reach at Ellicott Creek and one 1.5 km reach at Murder Creek (Figure 1)—were chosen for field surveys of in-stream LW. These sites were selected because their upstream environments are typical of the region (mixed land use), they have a relatively low gradient, and are not located directly downstream of any dams, weirs, waterfalls, or other features that might have a significant local impact on LW loadings. More specifically, the Ellicott Creek watershed is located in the southern-central area of the Niagara Subbasin. Its eponymous main channel is a 72 km-long tributary of Tonawanda Creek that drains an area of 310.9 km2. A 1.5 km reach of Ellicott Creek near Bowmansville, NY was surveyed (Site 1). Murder Creek is also a tributary of Tonawanda Creek and drains an area of 188.8 km2. The Murder Creek watershed is situated in the eastern part of the Niagara Subbasin directly to the east of the Ellicott Creek watershed (Figure 1). A 1.5 km reach of Murder Creek near Akron, NY was surveyed (Site 2). Stream channel width at sites 1 and 2 ranged from 15 to 25 m with mostly wadable depths ≤ 1 m.
For each of the LW survey reaches, pieces of LW found in the stream channel over 5 cm in diameter and greater than 30 cm in length were inventoried [3,24]. Each piece was measured for length using a measuring tape, and mid-length diameter was determined using a caliper. LW jam locations were inventoried, geo-located using a hand-held GPS unit, and classified according to Wallerstein & Thorne [30]. Specifically, jams spanning the width of the stream channel and where water flows under or over and under the jam were classified as “underflow” jams. Other channel-spanning jams where water flowed only over the jam were classified as “dam” jams. Jams where key members did not span the stream channel and from which streamflow was directed away and into the channel or opposite bank were classified as “deflector” jams. Jams where key members were positioned parallel to streamflow were classified as “parallel” jams. In this classification, parallel jams tend to be smaller and less influential on streamflow and channel morphology than the other three jam classifications [3,30].
Volume of in-stream LW load per unit stream length was approximated by using the formula for the volume of a cylinder to calculate the average volume of a piece of LW found in the stream channel as follows:
where r = ½ mean mid-length diameter, h = mean length, and v = volume. (It should be noted that the value of v is likely to be somewhat positively skewed because the diameter of a piece of LW was often observed to decrease out from mid-length.) The following formula can then be used to determine the volume of wood found per stream length:
where n = number of pieces found, l = stream length surveyed, and y = total volume of LW.
π r2h = v
(v n) / l = y
2.2.2. LW Recruitment Zone Distribution
For each of the six watersheds studied, LW recruitment zones were created using data obtained from the USDA-NRCS Geospatial Data Gateway, including stream hydrography data, watershed boundary data, and land cover classification [31]. LW recruitment zones were defined as a 30 m buffer along the main stream channel [27] and were made using ArcGIS. Once the 30 m buffers were created, land cover classification data were converted from raster to polygon to allow for attribute selection of forested classifications (deciduous, coniferous, and mixed) within the buffer. Areas for total LW recruitment zone and forested LW recruitment zone were then calculated and compared to determine what percentage of each watershed’s LW recruitment zone is currently forested and therefore potentially a source of LW. These percentages were then used to compare potential LW sources for each watershed which could be targeted for conservation (passive restoration).
However, although mapping forested LW recruitment zones is appropriate for displaying inventories and spatial trends at the watershed scale, it is too fine a resolution for the whole Niagara Subbasin as at such a scale forested LW recruitment zone polygons appear as small scattered points which fails to render a sufficient visualization. To address this issue, a kernel density analysis was conducted. For each of 3,028 polygons of forested LW recruitment zones produced from the conversion of raster land cover data to polygon, centroid points where determined and mapped. Kernel density analysis was then performed for the centroid points. The result is a smooth visualization of point locations that clearly communicates variations in point density across an area. Although accuracy decreases when polygons are converted to centroid points because the original polygons each point represents range somewhat in size, kernel density analysis based on centroids allows for the display of spatial trends over a larger geographic extent as that of the subbasin scale.
2.2.3. Correlation Analysis
Finally, a correlation analysis was performed to identify the relationship between total area of LW recruitment zones, total forested LW recruitment zones, and commonly measured land use/land cover data, including percent agricultural, forested, and developed as well as population density.
3. Results
3.1. In-stream Surveys
At study Site 1 at Ellicott Creek (1.5 km stream length surveyed) a total of 134 pieces of LW were found (Figure 2) and six LW jams were identified. The mean length of LW pieces was 425 cm, median length was 404 cm, and the length range was 1,475 cm (45 cm to 1,520 cm). The mean mid-length diameter of LW pieces was 14 cm, median mid-length diameter was 12.4 cm, and mid-length diameter range was 38.5 cm (5.5 cm to 44 cm). With respect to the six LW jams found at study Site 1 and categorized according to Wallerstein & Thorne [30], two were classified as parallel jams, two as deflector jams, one as an underflow jam, and one as a dam jam. Accordingly, Site 1 at Ellicott Creek was found to have an LW density of 10.3 pieces per 100 m and a jam density of 0.5 per 100 m.

Figure 2.
Relationship between length and diameter of large wood (LW) as measured during field surveys of in-stream LW at Site 1 at Ellicott Creek (Series 1, 1.5 km-long stream section, n = 134) and at Site 2 at Murder Creek (Series 2, 1.5 km-long stream section, n = 181).
At study Site 2 at Murder Creek (1.5 km stream length surveyed) a total of 181 pieces of LW were found (Figure 2) and five LW jams were identified. The mean length of LW pieces was 376 cm, median length was 400 cm, and the length range was 1,278 cm (50 cm to 1,328 cm). The mean mid-length diameter of LW pieces was 15.6 cm, median mid-length diameter was 13.2 cm, and mid-length diameter range was 47.5 cm (5.3 cm to 52.8 cm). Of the five LW jams identified at study Site 2, four jams were classified as deflector jams and one as a parallel jam. Accordingly, Site2 at Murder Creek was found to have an LW density of 12.1 pieces per 100 m and a jam density of 0.3 jams per 100 m.
Volume of LW loadings based on in-stream surveys was approximated using the formulas described in Section 2.2.1 (π r2 h = v; (v n) / l = y). The approximate total volume of LW found at Site 1 at Ellicott Creek was 28.1 m3 for an in-stream of LW load of 18.8 m3/km or 1.9 m3/100 m. For Site 2 at Murder Creek the approximate total volume of LW found was 47.1 m3 for an in-stream LW load of 31.4 m3/km or 3.1 m3/100 m.
3.2. LW Recruitment Zone Distribution
Analysis of LW recruitment zone buffers and forested land cover polygons for the Niagara Subbasin indicated that there is a total of 195 km2 of LW recruitment zone, 32.6 km2 or 16.7% of which is forested (Table 3, Figure 3 and Figure 4). Of all the watersheds studied, Upper Tonawanda Creek (50% Agriculture, 8% Developed, 34% Forested) had the highest proportion of forested LW recruitment zone (17.1 km2 or 27.3%), while the Niagara River (18% Agriculture, 51% Developed, 15% Forested) had the lowest proportion of forested LW recruitment zone (1.5 km2 or 7%) (Table 3).
Table 3.
Total area (km2) of large wood (LW) recruitment zone (areas within 30 m of stream channel), total area (km2) of forested LW recruitment zone, and percent forested LW recruitment zone for each of the six watersheds of the Niagara Subbasin.

Figure 3.
Map illustrating forested large wood (LW) recruitment zones in the Middle Tonawanda Creek, Murder Creek, and Upper Tonawanda Creek watersheds.

Figure 4.
Map illustrating forested large wood (LW) recruitment zones in the Niagara River, Lower Tonawanda Creek, and Ellicott Creek watersheds.
In terms of forested LW recruitment zone distribution, kernel density analysis results show that the Upper Tonawanda Creek and Middle Tonawanda Creek watersheds, along with the eastern upstream section of the Ellicott Creek watershed, have the highest density of forested—and therefore potentially functional—LW recruitment zones in the Niagara Subbasin (Figure 5). The Murder Creek watershed and the eastern upstream area of the Lower Tonawanda Creek watershed also have a significant but more moderate density of forested LW recruitment zones. The Niagara River watershed and the western downstream sections of the Lower Tonawanda Creek and Ellicott Creek watersheds have the lowest density of forested LW recruitment zones in the study area (Figure 5).
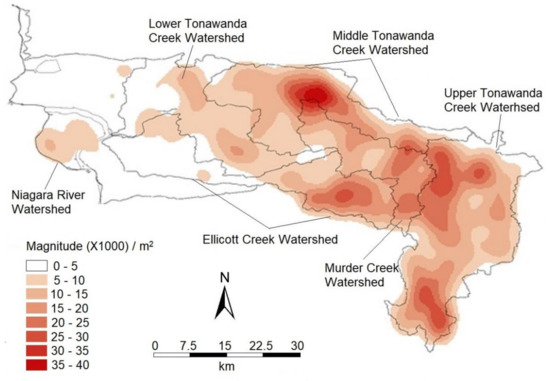
Figure 5.
Kernel density analysis illustrating the density (magnitude) of polygons corresponding to forested large wood (LW) recruitment zones in the Niagara Subbasin.
3.3. Correlation Analysis.
Figure 6 indicates the linear correlation coefficient between total area of LW recruitment zones, total forested area of LW recruitment zones, and commonly measured land use data. Although land use is thought to affect forested LW recruitment zone occurrence—population density, percent developed land, and percent impervious surfaces are not significantly correlated (p > 0.05) to the occurrence of forested LW recruitment zones. Similarly, percent agricultural land in a watershed is not significantly correlated to forested LW recruitment zones. Only the percentage of forest land cover in a watershed was significantly correlated to the occurrence of forested LW recruitment zones (Figure 6).
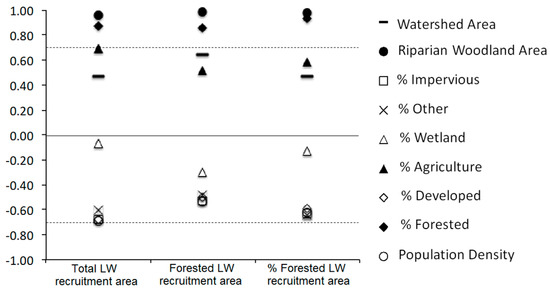
Figure 6.
Correlation coefficient between large wood (LW) recruitment zone area, forested LW recruitment zone area, and percentage of LW recruitment zone area that is forested-from Table 3) and select land cover variables (from Table 1). Dashed lines indicate significant correlation levels (if r > 0.70 or r < −0.70, then p < 0.05; n = 6).
4. Discussion
The Ellicott Creek and Murder Creek watersheds where in-stream LW surveys were conducted are in many ways representative of others in the study area (Table 1) and present lower LW and LW jam densities than other land use-impacted watersheds where similar studies have been conducted. For instance, LW densities in New England streams have been found to be 17.4 pieces per 100 m and LW jam frequency to be 4.4 per 100 m on average [3,7]. Similarly, streams in West Virginia and Pennsylvania have been found to average of 16.1 pieces of LW per 100 m [25]. Moreover, in the western U.S. where deforestation has been less rampant and some old growth forests remain (e.g., Alaska, Washington, Montana, Oregon, California), densities of in-stream LW are frequently reported to be greater than 30 pieces per 100 m [25], roughly three times those found in this study.
In addition to being tied to impacts of urbanization/land use, it is likely the low density of LW in the study watersheds is also tied to forest composition. LW recruitment may lag forest regeneration by centuries [7], and the presence of large mature trees in LW recruitment zones to provide key members is critical for in-stream LW accumulation and especially LW jam development [6]. According to forest composition surveys conducted in the region, forests in the study watersheds are composed of a fragmented patchwork of young regrowth stands [23]. Indeed, field observations confirmed the virtual absence of large mature trees in the LW recruitment zones of the study watersheds, suggesting that forest age and composition also play a role in the low LW and LW jam density observed. Further, the sizes of in-stream LW measured at Site 1 at Ellicott Creek and Site 2 at Murder Creek are consistent with a scarcity of key members and LW size distribution being dominated by pieces too small to form into large jams that span the width of the channel (15-25 m) (Figure 2). Ultimately, the slow regeneration of forests observed in the region [23,32,33] and the lag known to exist between forest regeneration and LW recruitment [7] suggests that without intervention the streams of these watersheds are likely to lack LW and suffer consequential impacts to habitat, water quality, and physical function long into the future.
In terms of distribution of potentially functional LW recruitment zones (forested areas within 30 m of the stream channel [27]) among the study watersheds, only between 7% and 28% of LW recruitment zones are forested (Table 3). Moreover, only two watersheds—Upper Tonawanda Creek and Murder Creek—have a “Good” Aquatic Habitat Viability Rating [28]. This suggests that for much of the area studied watersheds have been severely impacted and that potentially productive LW recruitment zones are lacking.
Urban and suburban land uses are known to often result in the degradation of riparian areas as in many instances roads, parking lots, buildings, lawns, etc. encroach toward streams [34,35]. Accordingly, it may be expected that urbanization—high-density development as well as low-density suburban development—is partly responsible for the observed patterns as the most urbanized watersheds in the study area tend to have low potential for LW recruitment (Table 1 and Table 3, Figure 3 and Figure 4). However, correlation analysis indicates that although levels of development, population density, and percent impervious surface are indeed negatively correlated to total area of forested LW recruitment zone, the correlation is not statistically significant. Instead, forested LW recruitment zone area is only significantly correlated to total forest land cover. Although this positive correlation is unsurprising since forested areas are needed for LW generation, the correlations seen illustrate the complex relationships between urbanization/land use/land cover and LW recruitment. Indeed, these findings suggest, perhaps unexpectedly, that extent of urbanization alone is not a best predictor of functional LW recruitment zones in watersheds with heterogeneous land use/land cover. Likewise, albeit also not statistically significant, the positive correlation seen between the percentage of land used for agriculture and occurrence of forested LW recruitment zones in the study watersheds further stresses the complex relationship between LW recruitment and land use. Indeed, unlike other regions where agriculture is more intensive, industrial, and monocultural, most agricultural uses in the study area are relatively small farm operations with varied practices (poultry, legumes, dairy cows, corn, etc.) where wooded lots and wooded riparian areas can often be found.
In terms of Aquatic Habitat Viability, urbanization seems to have the most drastic effect as the three watersheds with the highest degrees of such development have the lowest Aquatic Habitat Viability Ratings (Table 1 and Table 2). On the opposite end of the spectrum, the two watersheds with the highest Aquatic Habitat Viability Rating in the study area (Good) have a relatively high percentage of land used for agriculture (>50%) and relatively high forest cover (25–34%) but low urbanization (4–8%) (Table 1 and Table 2). Although agricultural land use has been tied in many cases to watershed degradation owing to, among other things, excessive nutrient (nitrogen, phosphorus) and pesticide losses to streams [36,37], our results suggest that, in contrast to urban/suburban land use, agricultural land use as it is in the study area may not necessarily negatively impact LW recruitment nor Aquatic Habitat Viability Rating.
Although the occurrence of forested LW recruitment zones is greatly limited in the Niagara Subbasin, there are significant areas with a high density of forested and therefore potentially functional LW recruitment zones (Figure 5). From a management standpoint these areas may be where land conservation in which development, timber harvesting/clearing (especially extraction of key members), agricultural uses, etc. are prohibited or severely limited through zoning, easements, acquisitions, etc. would be the most suitable approach for LW generation enhancement. However, in most of the study area, especially in the most urbanized watersheds, there is little that land conservation practices can do to restore LW production and recruitment because there are very few forested LW recruitment zones to protect (Figure 5). Instead, at these locations, which are generally in the western part of the study area as seen in Figure 4 and Figure 5, active stream restoration practices such as the addition of root wads, cross vanes, j-hooks, engineered log jams, floodplain reconnection/bank re-grading, and/or side channel addition may be required. Some of the known effects of these restoration practices include enhanced habitat for fish and macro-invertebrates through the creation of eddies, pools, and enhanced hyporheic flow; improvement in stream water quality with the creation of denitrification hot spots; and stream bank erosion reduction [38,39,40,41,42]. All these effects are known benefits of natural LW and LW jams [4,18].
5. Conclusions
Through a detailed investigation of the occurrence of forested LW recruitment zones and in-stream LW density in a series of watersheds with varying degrees of urbanization and types of land use, this study further constrains the relationship between urbanization/land use/land cover and LW recruitment and in-stream loads. Although the results linked high population density, elevated percentage of impervious surface, and high degree of urbanization to a lack of potentially functional recruitment zones for LW, they also reveal that agricultural land use in the study area is positively correlated to the occurrence of forested riparian areas at the watershed scale. In addition, although LW recruitment zones are generally considered to be restricted to areas within 30 m of stream channels [27], total forested land cover appears to be highly correlated to forested LW recruitment zones at the watershed scale. However, in the study area, like in many regions with significant urbanization and spatially, temporally, and categorically heterogeneous land use, forests are often fragmented and young which strongly limits LW recruitment (especially that of key members) and, as a result, in-stream LW loads.
Using a combination of in-stream surveys and GIS analysis, the hybrid methodology of this study offers a way in which LW may be evaluated over larger areas toward informing watershed management, regional land use planning, and land conservation. With the exception of select areas with the highest density of forested LW recruitment zones where land conservation is susceptible to being a successful approach to enhance the number and size of in-stream LW, for the long run, in places where forested LW recruitment zones are scarce, active LW restoration through the addition of root wads, cross vanes, j-hooks, engineered log jams, and/or floodplain reconnection/bank re-grading may be more suitable than conservation for LW management and achieve many of the benefits (increased habitat, enhanced water quality, stream bank stabilization) normally provided by LW and LW jams.
Author Contributions
Conceptualization, M.T.A.; methodology, M.A; formal analysis, M.T.A. and P.G.V.; investigation, M.T.A.; writing—original draft preparation, M.T.A.; writing—review and editing, M.T.A. and P.V; visualization, M.T.A. and P.G.V. Both authors have read and agreed to the published version of the manuscript.
Funding
This research received no external funding.
Acknowledgments
The authors would like to thank the editor and reviewers as well as Sean J. Bennett and Chris P.S. Larsen. The authors would like to acknowledge the U.S. Department of Agriculture—Natural Resources Conservation Service for public data access.
Conflicts of Interest
The authors declare no conflict of interest.
References
- Roth, N.E.; Allan, J.D.; Erickson, D.L. Landscape influences on stream biotic integrity assessed at multiple spatial scales. Landsc. Ecol. 1996, 11, 141–156. [Google Scholar] [CrossRef]
- Angradi, T.R.; Schweiger, E.W.; Bolgrien, D.W.; Ismert, P.; Selle, T. Bank stabilization, riparian land use and the distribution of large woody debris in a regulated reach of the upper Missouri River, North Dakota, USA. River Res. Appl. 2004, 20, 829–846. [Google Scholar] [CrossRef]
- Costigan, K.H.; Daniels, M.D. Spatial pattern, density and characteristics of large wood in Connecticut Streams: Implications for stream restoration priorities in southern New England. River Res. Appl. 2013, 29, 161–171. [Google Scholar] [CrossRef]
- Wohl, E.; Bledsoe, B.P.; Fausch, K.D.; Kramer, N.; Bestgen, K.R.; Gooseff, M.N. Management of Large Wood in Streams: An Overview and Proposed Framework for Hazard Evaluation. J. Am. Water Resour. Assoc. 2016, 52, 315–335. [Google Scholar] [CrossRef]
- Kail, J.; Hering, D.; Muhar, S.; Gerhard, M.; Preis, S. The use of large wood in stream restoration: Experiences from 50 projects in Germany and Austria. J. Appl. Ecol. 2007, 44, 1145–1155. [Google Scholar] [CrossRef]
- Latterell, J.J.; Naiman, R.J. Sources and dynamics of large logs in a temperate floodplain river. Ecol. Appl. 2007, 17, 1127–1141. [Google Scholar] [CrossRef] [PubMed]
- Magilligan, F.J.; Nislow, K.H.; Fischer, G.B.; Wright, J.; Mackey, G.; Laser, M. The geomorphic function and characteristics of large woody debris in low-gradient rivers, coastal Maine, USA. Geomorphology 2008, 97, 467–482. [Google Scholar] [CrossRef]
- Lassettre, N.S.; Kondolf, G.M. Large woody debris in urban stream channels: Redefining the problem. River Res. Appl. 2012, 28, 1477–1487. [Google Scholar] [CrossRef]
- Lienkaemaper, G.W.; Swanson, F.J. Dynamics of large woody debris in streams in old growth Douglas-fir forests. Can. J. For. Res. 1987, 17, 150–156. [Google Scholar] [CrossRef]
- Bahuguna, D.; Mitchell, S.J.; Miquelajauregui, Y. Windthrow and recruitment of large woody debris in riparian stands. For. Ecol. Manag. 2010, 259, 2048–2055. [Google Scholar] [CrossRef]
- Daniels, M.D. Distribution and dynamics of large woody debris and organic matter in a low-energy meandering stream. Geomorphology 2006, 77, 286–298. [Google Scholar] [CrossRef]
- Kasprak, A.; Magilligan, F.J.; Nislow, K.H.; Snyder, N.P. A LIDAR-derived evaluation of watershed-scale large woody debris sources and recruitment mechanisms: Coastal Maine, USA. River Res. Appl. 2012, 28, 1462–1476. [Google Scholar] [CrossRef]
- Tecle, A.; Bojonell, H.A.; King, J.G. Effects of harvesting headwater forest watersheds on woody debris and stream channel characteristics. J. Ariz. Nev. Acad. Sci. 2001, 33, 98–112. [Google Scholar]
- Wohl, E.; Scott, D.N. Wood and sediment storage and dynamics in river corridors. Earth Surf. Process. Landf. 2017, 42, 5–23. [Google Scholar] [CrossRef]
- Sawyer, A.H.; Cardenas, M.B. Effect of experimental wood addition on hyporheic exchange and thermal dynamics in a losing meadow stream. Water Resour. Res. 2012, 48. [Google Scholar] [CrossRef]
- Wagenhoff, A.; Olsen, D.A. Does large woody debris affect the hyporheic ecology of a small New Zealand pasture stream? N. Z. J. Mar. Freshw. Res. 2004, 48, 547–559. [Google Scholar] [CrossRef]
- Keller, E.A.; Swanson, F.J. Effects of large organic material on channel form and fluvial processes. Earth Surf. Process. 1979, 4, 361–380. [Google Scholar] [CrossRef]
- Mao, L.; Ugalde, F.; Iroumé, A.; Lacy, S.N. The Effects of Replacing Native Forest on the Quantity and Impacts of In-Channel Pieces of Large Wood in Chilean Streams. River Res. Appl. 2017, 33, 73–88. [Google Scholar] [CrossRef]
- Guyette, R.P.; Cole, W.G.; Dey, D.C.; Muzika, R.M. Perspectives on the age and distribution of large wood in riparian carbon pools. Can. J. Fish. Aquat. Sci. 2002, 59, 578–585. [Google Scholar] [CrossRef]
- Madej, M.A. Redwoods, restoration, and implications for carbon budgets. Geomorphology 2010, 116, 264–273. [Google Scholar] [CrossRef]
- Montgomery, D.R.; Abbe, T.B. Influence of logjam-formed hard points on the formation of valley-bottom landforms in an old-growth forest valley, Queets River, Washington, USA. Quat. Res. 2006, 65, 147–155. [Google Scholar] [CrossRef]
- Wohl, E. A legacy of absence: Wood removal in US rivers. Prog. Phys. Geogr. 2014, 38, 637–663. [Google Scholar] [CrossRef]
- Wang, Y.C.; Larsen, C.P.S.; Kronenfeld, B.J. Effects of clearance and fragmentation on forest compositional change and recovery after 200 years in western New York. Plant Ecol. 2010, 208, 245–258. [Google Scholar] [CrossRef]
- Comiti, F.; Andreolia, A.; Lenzia, M.A.; Mao, L. Spatial density and characteristics of woody debris in five mountain rivers of the Dolomites. Geomorphology 2006, 78, 44–63. [Google Scholar] [CrossRef]
- Cordova, J.M.; Rosi-Marshall, E.J.; Yamamuro, A.M.; Lamberti, G.A. Quantity, controls and functions of large woody debris in Midwestern USA streams. River Res. Appl. 2007, 23, 21–33. [Google Scholar] [CrossRef]
- Iroumé, A.; Mao, L.; Ulloa, H.; Ruz, C.; Andreoli, A. Large wood volume and longitudinal distribution in channel segments draining catchments with different land use, Chile. Open J. Mod. Hydrol. 2014, 4, 57. [Google Scholar] [CrossRef]
- Rinella, D.J.; Booz, M.; Bogan, D.L.; Boggs, K.; Sturdy, M.; Rinella, M.J. Large woody debris and salmonid habitat in the Anchor River basin, Alaska, following an extensive spruce beetle (Dendroctonus rufipennis) outbreak. Northwest Sci. 2009, 83, 57–69. [Google Scholar] [CrossRef]
- Buffalo Niagara Waterkeeper. Healthy Niagara: Niagara River Management Plan (Phase 1). Available online: https://bnwaterkeeper.org/projects/healthyniagara (accessed on 13 October 2020).
- Smith, M.P.; Schiff, R.; Olivero, A.; MacBroom, J.G. The Active River Area: A Conservation Framework for Protecting Rivers and Streams; The Nature Conservancy: Boston, MA, USA, 2008. [Google Scholar]
- Wallerstein, N.P.; Thorne, C.R. Influence of large woody debris on morphological evolution of incised, sand-bed channels. Geomorphology 2004, 57, 53–73. [Google Scholar] [CrossRef]
- USDA-NRCS Geospatial Data Gateway. Available online: https://datagateway.nrcs.usda.gov (accessed on 13 October 2020).
- Wang, Y.C.; Kronenfeld, B.J.; Larsen, C.P.S. Spatial distribution of forest landscape change in western New York from presettlement to the present. Can. J. For. Res. 2009, 39, 76–88. [Google Scholar] [CrossRef]
- Larsen, C.P.S.; Kronenfeld, B.J.; Wang, Y.C. Forest composition: More altered by future climate change than by Euro-American settlement in western New York and Pennsylvania. Phys. Geogr. 2012, 33, 3–20. [Google Scholar] [CrossRef]
- Malanson, G.P. Riparian Landscapes; Cambridge University Press: Cambridge, UK, 1993. [Google Scholar]
- Orewole, M.O.; Alaigba, D.B.; Oviasu, O. Riparian corridors encroachment and flood risk assessment in Ile-Ife: A GIS perspective. Open Trans. Geosci. 2015, 2. [Google Scholar] [CrossRef]
- Ouyang, W.; Song, K.; Wang, X.; Hao, F. Non-point source pollution dynamics under long-term agricultural development and relationship with landscape dynamics. Ecol. Indic. 2014, 45, 579–589. [Google Scholar] [CrossRef]
- Tournebize, J.; Chaumont, C.; Mander, U. Implications for constructed wetlands to mitigate nitrate and pesticide pollution in agricultural drained watersheds. Ecol. Eng. 2017, 103, 415–425. [Google Scholar] [CrossRef]
- Kasahara, T.; Hill, A.R. Effects of riffle-step restoration on hyporheic zone chemistry in N-rich lowland streams. Can. J. Fish. Aquat. Sci. 2005, 63, 120–133. [Google Scholar] [CrossRef]
- Bernhardt, E.S.; Sudduth, E.B.; Palmer, M.A.; Allan, J.D.; Meyer, J.L.; Alexander, G.; Follstad-Shah, J.; Hassett, B.; Jenkinson, R.; Lave, R.; et al. Restoring rivers one reach at a time: Results from a survey of U.S. river restoration practitioners. Restor. Ecol. 2007, 15, 482–493. [Google Scholar] [CrossRef]
- Craig, L.S.; Palmer, M.A.; Richardson, D.C.; Filoso, S.; Bernhardt, E.S.; Bledsoe, B.P. Stream restoration strategies for reducing river nitrogen loads. Front. Ecol. Environ. 2008, 6, 529–538. [Google Scholar] [CrossRef]
- Passeport, E.; Vidon, P.; Forshay, K.; Harris, L.; Lazar, J.; Kaushal, S.S.; Kellogg, D.Q.; Mayer, P.M.; Stander, E. Ecological engineering practices for the reduction of non-point source N in human influenced landscapes: A guide for watershed managers. Environ. Manag. J. 2013, 51, 392–413. [Google Scholar] [CrossRef]
- Gallisdorfer, M.S.; Bennett, S.J.; Atkinson, J.F.; Ghaneeizad, S.M.; Brooks, A.P.; Simon, A.; Langendoen, E.J. Physical Scale Model Designs for Engineered Log Jams in Rivers. J. Hydro-Environ. Res. 2014, 8, 115–128. [Google Scholar] [CrossRef]


Publisher’s Note: MDPI stays neutral with regard to jurisdictional claims in published maps and institutional affiliations. |
© 2020 by the authors. Licensee MDPI, Basel, Switzerland. This article is an open access article distributed under the terms and conditions of the Creative Commons Attribution (CC BY) license (http://creativecommons.org/licenses/by/4.0/).