Abstract
Understanding aquifer lithofacies and depth of occurrence, and what factors influence its quality and chemistry are of paramount importance to the management of groundwater resource. Subsurface lithofacies distribution was characterized by resistivity and validated with available subsurface geology. Resistivity values varied from less than 100 Ωm to above 1000 Ωm. Lithofacies identified includes clay, clayey sand, sand and peat. Shallow unconfined and confined aquifers occurred at depths ranging from 0 to 12 m and 18 to 63 m, respectively. Geochemistry and multivariate statistical analysis consisting of principal component analysis (PCA) and cluster analysis (CA) were used for the determination of quality and groundwater evolution. Groundwater types depicted by Piper plots were Ca3+, Cl− and Na+, Cl−, which was characterized by low dissolved ions, slightly acidic and Fe2+. The dominant variables influencing groundwater quality as returned by PCA were organic pollution resulting from swampy depositional environment, anthropogenic effects resulting from septic and leachates from haphazard dumpsites mixing with groundwater from diffuse sources. In addition, the weathering and dissolution of aquifer sediments rich in feldspar and clay minerals have considerable impact on groundwater quality. CA depicted two distinct types of groundwater that are significantly comparable to those obtained from Piper plots.
1. Introduction
Groundwater aquifers of the western Niger Delta are essentially the single source of potable and industrial sources of water. The quality of groundwater is relevant to what specific function and purpose it may be used for [1]. The quality of groundwater is affected by the geology of the subsurface through which it interacts [2], anthropogenic effects and surface–groundwater interaction [3] and biogeochemical reactions [4]. The depth at which aquifers occur beneath the earth surface also plays a significant purpose in affecting the quality of groundwater. Aquifers mantled by impermeable geological materials tend to retard migration of contaminants and are less vulnerable to contamination compared to those with underlying permeable materials. Thus the quality of groundwater in an aquifer is essentially controlled by the lithology above and within it [5].
Recent studies in the western Niger Delta region have been focused mainly on physicochemical and descriptive statistical analysis of groundwater quality. This statistical tool that has been used is relatively inadequate and is not capable of reducing data into the small weighty factors needed to explain important relationships that may exists among groundwater variables. In addition, it is characterized by the severity of omitting very essential relationships among variables [6]. The ineffectiveness associated with it can be solved with application of multivariate analysis. Multivariate statistical analysis deals with multiple variables and important factors concerning relationships among parameters responsible for groundwater quality that are retained on reduction into smaller weighty factors [7,8,9,10].
Principal component analysis and cluster analysis are important elements of multivariate statistical analysis. They have attracted wide usage in understanding factors affecting groundwater quality by grouping water of similar variables into components, which aid in the identification of the source and chemistry of groundwater. They have been used expansively for distinguishing groundwater quality influenced by anthropogenic sources from those affected by natural factors, without being subjective [11,12]. Consequently, multivariate statistical analysis has become an indispensable tool desirable for better understanding groundwater quality, for determination of the origin of pollution and for spatial variations associated with water quality for enhanced ground and surface water management [13].
Several studies involving multivariate statistical analysis exist in the literature but with scarce information on the western Niger Delta [14] discovered that groundwater quality had been modified by evaporation, mineralization and anthropogenic effects on aquifers around the Yinchuan region of northwestern China from multivariate analysis. Similarly, [15] distinguished groundwater quality from the western Nile Delta, which has been modified by mineralization, mining tails and saltwater intrusion, from those contaminated by industrial, domestic and agricultural wastes. Furthermore, [16] used geochemical and multivariate statistical analysis to identify the sources of similarities and differences in pollution and quality of groundwater at two different locations in New Mexico, USA.
The objectives of study were (1) to identify the subsurface lithofacies of the materials that constitute aquifer and aquicludes, (2) to determine the groundwater quality from the alluvial plains and to assign factors shaping their quality, (3) to use the dimension reduction technique associated with multivariate analysis to explain similarity among groundwater parameters, (4) to establish factors controlling groundwater quality and evolution, and (5) to classify groundwater into group and identify factors that influence them from cluster analysis. The implication of the study is to ensure the availability of accurate and concise groundwater quality data relevant to policy developers and water managers for the effective and robust management of groundwater resources for sustainable development.
2. Location of Study and Description
Koko is sandwiched between the banks of the Benin River and Ethiope River (Figure 1). The converging of the Benin and Ethiope rivers at Koko probably makes it a confluence town. It was popularly known as a hub of trade during the colonial era. Apart from these two rivers, there is a man-made stream known as Utankpo creek, which connects both rivers.
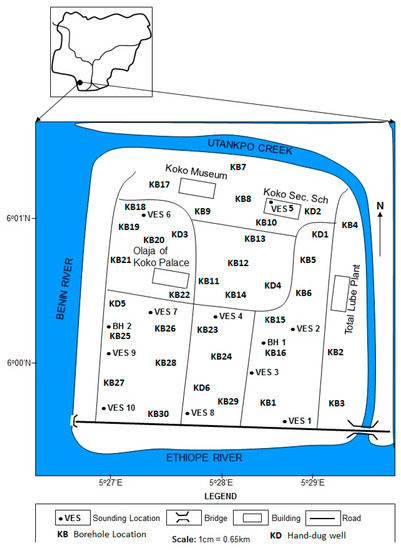
Figure 1.
Location map showing vertical electrical resistivity soundings (VES) and sample distributions.
Historically, the Utankpo creek was constructed by slaves. In the time past, the man-made channel was used to convey goods from the Benin River to the Koko River for shipment. There was a seaport in the early “80s” and Koko became popular with the dumping of toxic waste in the late “80s”.
Currently, there are petroleum tank farms and a major lubricating blending plant, which belongs to Total Nigeria limited. The floodplains of the Ethiope and the Benin Rivers support freshwater swamps and rainforest vegetation. Two seasons characterized the study area are the dry and raining seasons. The dry season lasts from November to March, while the raining season is from April to October. Temperature varies in accordance with the prevailing two climatic conditions and daily averages range from 24 to 28 °C and from 29 to 34 °C. The occupations of the inhabitants are mostly fishing, shipping, logging and sand mining.
3. Geology and Hydrogeological Setting
The subsurface geology of Koko is similar to other areas in the Niger Delta. Depositional environments have a strong influence on the sediment types and composition. Slight changes in lithology are common in certain places across the area. The major sediment types that form the Somebreiro-Warri Deltaic Plain sands are unconsolidated silts, sands, clays, gravels and peats [17], which are the main constituents of the Benin Formation. The Benin Formation is uniquely distinctive from other stratigraphic formations in the Niger Delta basin in having intrinsic properties of aquifers. It consists predominantly of unconsolidated silts, clays, sand, peat and gravel and occasionally intercalation of shales. It is the only freshwater bearing formation among the other stratigraphy of the Niger Delta. Its thickness is estimated to be 2000 m and slight variations in thickness are common. Geologically, its age ranges from Oligocene to Pleistocene [17]. The hydrocarbon of the Niger delta is sourced from the Agbada Formation, which can be found at the middle of the Niger Delta stratigraphy [18]. It consists of a succession of shale and sand that alternate. The shale has been known to be rich in fossils and is controversially regarded as the source of hydrocarbon, while the sands are the reservoir rocks of the formation. The Agbada formation is highly faulted with numerous growth faults and listric faults. Its thickness is around 3000 m and aged from Oligocene to Eocene. The Akata Formation is the base of the Niger Delta sedimentary basin and it overlies the Cretaceous basement complex [18]. The formation is highly pressured and, compositionally, it is made up of open marine facies. Its thickness is estimated to be 1000 m and it is aged from Eocene to Paleocene [17]. It has not been penetrated by drilling and in the adjacent Anambra basin; the equivalent of the Akata Formation is the Imo shale.
The study area consists of unconfined, confined and semi-confined aquifers mainly of alluvial origin and Quaternary aged. They are productive aquifers, high yielding and characterized by high specific capacities, as well as high recharge rate. The static water level of the aquifers is very high; it often ranges from less than 0.4 to 5 m. Areas close to the river and swamps have a water level almost at the ground surface, which increases with distance from these surface water bodies. These surface water bodies are essentially discharge zones of groundwater. Water level is greatly affected by seasonal variations, which is clearly noticeable during the wet season, when the water table is almost at the ground surface, especially around rivers and swampy areas. In dug wells, the water level is low, with some areas having a static water level up to 4 to 5 m in the dry season. The Koko catchment is drained by three major rivers, Benin, Ethiope and the Utankpo creek-channel, connecting the Benin and the Ethiope rivers; they are freshwaters all year round. Wetlands and swamps are common; they probably contribute to the recharge of aquifers. The aquifers are characterized by grain sizes that range from fine through medium to coarse-grained sands and gravels.
4. Materials and Methods
4.1. Resistivity Data Acquisition
The subsurface lithofacies underneath the study area was revealed through the acquisition of resistivity data with an ABEM SAS 4000 Terrameter and the Schlumberger configuration [19] was selected for the acquisition. A total of eight vertical electrical resistivity soundings (VES) were acquired using a maximum electrode spacing of AB/2 that ranged from 200 to 300 m (Figure 1). The acquired apparent resistivity data was processed and converted into true resistivity and individual earth layers with Resist software [20]. Resist software is iterative inversion processing software, which is specifically designed for 1D resistivity data interpretation [21]. The resulting true resistivity and earth layers were interpreted into lithofacies and calibrated with subsurface geology of the area obtained from available boreholes. In addition, the subsurface lithofacies distribution at various depths was derived from resistivity variations and a cross section map was generated from SURFER 8 terrain and surface modeling software.
4.2. Groundwater Sampling and Laboratory Analysis
One-litre capacity plastic containers were used for groundwater sample collection. Prior to sampling, the borehole was flushed for 5 min. This was to ensure that static water in the borehole was abstracted in order to sample groundwater from the aquifer. To prevent contamination of containers, they were thoroughly washed and raised with sample. Sensitive parameters that are unstable were determined in situ with WTW-pH meter model pH/91 and conductivity meter model L/92. Parameters determined in situ include pH, total dissolve solids and electrical conductivity. Samples were replicated into two; those for cation analysis had their pH reduced to 2 by acidifying with HNO3 and those for anions were not acidified. In the field, samples were stored in coolers with ice and subsequently refrigerated prior to laboratory analysis. The standard laboratory procedure stipulated by the America Public Health Association [22] was strictly adhered to in the laboratory analysis of the collected samples. The results were later compared with quality endorsed by the Nigerian Standard for Drinking Water Quality [23,24].
The results of the laboratory analysis of 20 groundwater parameters were processed further by subjecting them to statistical analysis using SPSS statistic software version 20.
5. Results and Discussion
5.1. Lithofacies Distribution
The isoresistivity map of the cross sections generated for the study area at depths ranging from 10 to 50 m is shown in Figure 2. Clays were observable in the extreme northwestern and southwestern parts which laterally changed to sandy clay/clayey sand in northeastern and southeastern parts respectively. Lenses of clays surrounded by sandy clay/clayey sand were found in the northeastern and southeastern parts. The other parts, constituting about 60% of the area, were underlain by sand. At depths of 20 m, over 80% of the area is underlain by sand, which constitutes the aquiferous zone.
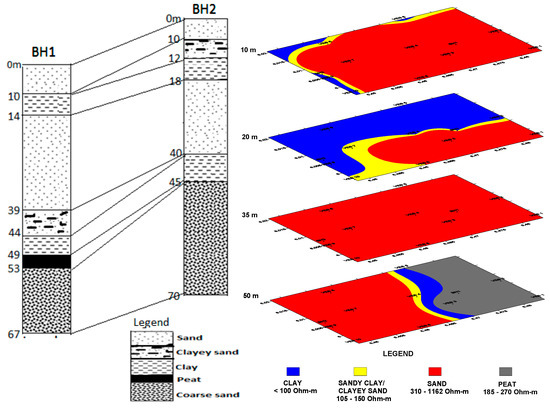
Figure 2.
A cross section of subsurface lithofacies distribution across the study area at depths of 10 m to 50 m (left), while BH1 and BH2 (right) are borehole lithofacies, which correlate with resistivity data.
Clays and sandy clay/clayey sand were observed in the southeastern parts. At depths of 35 m, about 55% of the subsurface is mainly sand, which forms part of the aquiferous zone. The sands sandwiched by sandy clay/clayey sand in the northern and southern parts represent 40% of the area. In the northwestern part of the area clays were delineated.
The lithofacies distribution at 50 m shows a stripped pattern, sand underlay about 65% of the area, which increasingly changes to sandy clay/clayey sand northwards. Around the extreme north, a layer of peat was delineated in a belt trending in a northwest–northeast direction. The resistivity variation within the peat layer varied between 185 and 270 Ohm-m These values are consistent with those reported by [25], whose values varied between 200 and 300 Ohm-m. Our result is, however, contrasted with those described by [26], whose peat resistivity values were slightly less than 100 Ohm-m. The resistivity of peat to a certain degree is dependent on the degree of decomposition and moisture content [26]. This is probably reflected in the different values of peat resistivity they described. For instance, an increase in the resistivity of peat is attributable to its high organic content; the high resistivity values measured in this study may be adduced to the organic content of the peat. The thickness of the peat from borehole 1 and as showed in lithological log of BH1 is about 4 m. Noticeably in BH1, the peat occurs at depths of 49 m to 53 m, but is conspicuously absent in BH2 (Figure 2). The proximity of BH2 to the Benin River probably presented an unfavourable environment for the preservation of peat at the time of deposition. The absence of which is probably adduced to the complete decomposition of peat, which was promoted by the available sufficient oxygen that led to the destruction of the peat in this area. The oxygen may have been supplied by the flowing rivers, whose water was oxygen rich and was supplied to the evolving peat.
5.2. Hydrogeoechemistry of Groundwater
Descriptive statistics were primarily employed to obtain the preliminary characteristics of groundwater quality. Table 1 presents the descriptive statistics performed on 20 variables determined from 36 spatially collected groundwater samples. To determine the quality of groundwater, the results (Table 1) were compared with the Nigerian Standard for Drinking Water Quality requirement [23]. There is a significant difference in the concentrations of cations, heavy metals, anions, TDS, electrical conductivity (EC), BOD, hardness and pH. The pH indicates that the groundwater from the study area is realistically acidic, a trend associated with groundwater aquifers in the Niger Delta region. The TDS values are below the permissible limit, except KD5, with a value of 574.12 mg/L. The values of EC are satisfactory as the majority of them are far less than the maximum standard, except for KD5, with a value of 815.24 μS/cm. The groundwater from the area is generally soft since most of the concentrations of total hardness (TH) are appreciably lower than the acceptable limit. The acceptable limit for bio-chemical oxygen demand (BOD) in groundwater is not given; however, its presence suggests organic pollution. The values of BOD revealed by the analysis are lower for most of the borehole samples but are higher for the shallow aquifers, particularly the dug wells. The source of organic pollutant in the groundwater beneath the study area is probably adduced to the decomposed trees and peats synonymous with a swampy depositional environment. The presence of a modern freshwater swamp in the area essentially buttressed organic sources of groundwater pollution. A comparison analysis of the concentrations of anions (HCO3−, Cl−, NO3−, PO4−) with the required standard reflects values that are appreciably far below the desired standards, except KD5 with a raised Cl− concentration of 116.57 mg/L but significantly far less than 250 mg/L standard.

Table 1.
Descriptive statistic of the results of laboratory analysis of the physiochemical variables of groundwater.
A similar NO−3 elevated concentration is notably seen in KD4 with a value of 23.05 mg/L. The elevated values measured for Cl− and NO−3 are commonly associated with the shallow dug wells, this underpinned that they are probably products of dumpsites and septic tanks [27,28]. The concentrations of the major cations (Ca2+, Na+, K+ and Mg2+) are certainly lower than the recommended maximum requirements for a suitable and potable drinking water. Similar concentrations that were essentially below the acceptable limit were also exhibited among the heavy metals (Cu2+, Cd2+, Zn2+, Pb2+ and Cr3+). The concentrations of the different heavy metals in the groundwater are inconsequential to the overall quality. Compelling evidence for dissolved iron in groundwater is that it may appear red or brown a few hours after abstraction from the aquifer. Of the 36 groundwater samples, eight of them, comprising KD1, KD6, KD4, KB7, KB14, KB17, KB19 and KB24 (Figure 1) have concentrations of Fe2+ greater than the 0.3 mg/L, the allowable limits required for a potable water. These 8 samples were noticed to change colour from colourless to a brownish colour some few hours after collection.
It is noteworthy that the groundwater quality determined from the 20 variables of the 36 samples analyzed is desirable and adequate for drinking. The above submission is justified by groundwater samples having greater percentages of their chemical compositions that are appreciably lesser than the desirable standard for groundwater quality [23]. There is a striking variation in the concentrations of all parameters, which is shown by the coefficient of variation (CV). The CV for the major cations varied from 1.279 to 1.967 and from 0.459 to 1.235 for the major anions. The heavy metals have CV that varied from 0.652 to 3.651. This discernable variation is probably attributable to the geology of the area and to anthropogenic activities. Despite the fact that the groundwater from the shallow dug wells is still potable, its quality has been slightly affected by anthropogenic activities, unlike the boreholes samples.
5.3. Groundwater Types
Piper diagram is often used for the categorization of groundwater systems into types [28,29,30,31]. The extent of mixing of different water types can also be unraveled by the plotting of a Piper diagram. The major advantage of using the Piper diagram in the grouping of groundwater systems is based on the identification of the major ions influencing quality of groundwater. The Piper diagram (Figure 3) depicted samples that plotted mostly in the central triangle and a few others plotted on both sides of it; this is an indication of the absence of a dominant cation type. For the anion, all samples clustered on the extreme left triangle, thus indicating a chloride-dominated water type (Figure 3). Having no dominant type suggests wide variability among the groundwater samples. This is reflected by the high standard deviation variation between chloride and the cations. Consequently, the type of groundwater for the area is Ca+ + Na+ + Cl− type (Figure 3). A similar water type was obtained by [30] for the Warri-Effurun groundwater system, caused by groundwater dilution by leachate from an open dumpsite. This probably suggests the groundwater system underneath the area is experiencing mixture of different water types caused by anthropogenic sources of septic on site failure and mixing of leachates from the dumpsites, which are preponderant.
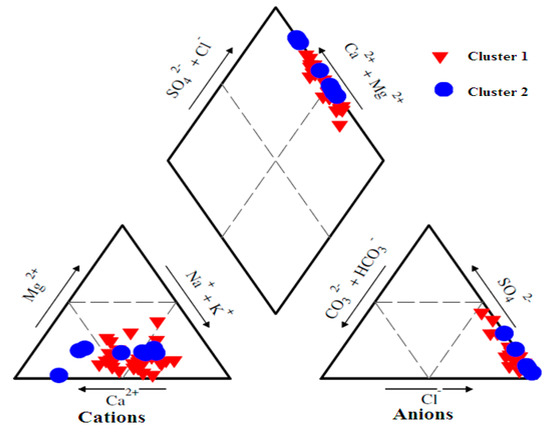
Figure 3.
Piper plot for the classification of major anions and cations into groundwater types.
5.4. Groundwater Variables Correlation Matrix
The significance of conducting correlation amid groundwater variables is to discern the relationships existing among them. The result of correlation performed on the 20 groundwater variables is shown in Table 2. Except for K+ and HCO−3, TDS and EC have a significant and positive correlation with all the major ions and correlated positively and negatively with Pb2+ and Cd3+ amid the heavy metals. With the exclusion of Mg2+ and Pb2+, both BOD and TH correlated significantly with Cl−, SO−4, PO−4, NO−3, Ca2+ and Cd3+. The correlation of TH with Ca2+ and Mg2+ explains relevantly their roles in influencing the total hardness of groundwater. TH has a strong correlation with SO−4, which may impose the property of permanent hardness of water. The very low concentration of TH, which is substantially lower than the maximum requirement, weakens the above claim. However, it underscores the fact that SO−4 concentration is considerably inconsequential to the overall hardness of the groundwater.
Table 2.
Correlation matrix of 20 groundwater variables.
5.5. Principal Component Analysis
In order to identify the dominant variables, which have a significant effect on the quality of groundwater, 20 standardized variables were subjected to principal component analysis (PCA). The use of PCA involves the reduction of correlated variables into smaller uncorrelated variables called principal components (PCs) [16]. The correlation matrix shown in Table 2 depicted vital correlations among the various groundwater variables. They reflect association and relationship between one groundwater variable and another. This relationship can be used to decipher the basic factors controlling groundwater quality [14,32]. Eigenvalues of 1 and higher are considered appropriate for the extraction of relevant factors modifying groundwater quality. Consequently, 6 PCs were extracted, which accounts for the 77% of the total variance in the initial groundwater variables (Table 3). In PCA, the first sets of PCs displayed explain the most significant processes responsible for the variations existing in the initial variables. The first two sets of PCs accounted for the most variance at 36% and 12%, respectively, while the others 4 PCs accounted for variance, which ranged from 6 to 9% (Table 3).
Table 3.
Loading of variables of 6 principal components (PCs) of groundwater quality analyzed.
PC1 explained 36% of the total variance and substantially correlated with EC, TDS and BOD. This suggests that these variables have significant relationships with organic matter. The high factor loading on EC, BOD and TDS underscored the influence dissolve ions have on the groundwater quality. The high factor loading of BOD is related to the peat sediments in some of the aquifers and human activities. PC1 also has a strong positive loading on Cl− and TH, SO4−, NO3− PO4−, Pb2+ and a moderately positive loading on Ca2+. The association of NO3− PO4− implies point source contamination, which is related to dumpsites, sewage and organic matter decomposition [1,33]. The presence of Cl− and TDS suggests waste from dumping site or sewage [34].
The high positive loading on K+ and Na+, moderate positive HCO3− and moderate negative Fe2+ and Zn2+ in PC2 accounted for 12% of the total variance responsible for the groundwater quality. This may be connected to their degree of association in having a common source of origin. K+ and Na+ are usually found in sediments rich in feldspars and clay minerals or may be the product of their weathering. The aquifers in the sediment water bearing formation of the Niger Delta basin contain some feldspars and clay minerals, and these are the probable source of K+ and Na+. Clay minerals are known to absorb metals in their surfaces. The negative loading of Fe2+ and Zn2+ is an indication that K+ and Na+ originated differently. Their occurrence in this PC2 is associated with their absorption on the surface of clay sediments within and those that cap most aquifers. It is most likely that these metals originated from dumpsites or sewage. There is also the possibility of originating from gas faring that is often associated with petroleum exploitation activities in the Niger Delta [35]. They are introduced into aquifer by the dissolution of CO2− in rainwater through infiltration and percolation. The low acidity of groundwater from the study area may enhance their leaching into the unsaturated and saturated zones, while HCO3− promotes their removal from these zones. Their removal from groundwater by HCO3− may be the reason they are negatively loaded in this group.
Of the total variance modifying the quality of groundwater, PC3 contributes a trivial sum of 8.87%. The strong and moderate positive loading on Mg2+ and Ca2+ suggest their association and individual contribution to the total hardness of the groundwater, which is connected to a common geogenic source. Ca2+ and Mg2+ in groundwater could also be derived from the sediments of aquifer rich in feldspar and clay minerals. In addition, there is a high factor loading on Cd2+ as seen from the strong positive correlation, which probably indicates anthropogenic activities. The inclusion of Cd2+ in this component may also relate to its absorption by clay minerals, which are the source of Ca2+ and Mg2+ in the groundwater.
PC4 describes 7.36% of the total variance influencing the quality of groundwater. In this component, there is a high factor loading on Cr3+ and moderate loading on Fe2+ with slight but weak negative and positive loading on Cu3+ and Na+, respectively. The variable in this component expresses processes of natural groundwater mineralization, and the loading of Cr3+, Fe2+ and Cu3+ may result from anthropogenic effects of humans.
PC5 and PC6 are characterized by strong loading on Cu3+ and Zn2+ with little but moderate contribution by pH, which is an indication of moderate solubility. These two PCs account for 6.8% and 5.93%, respectively, of the total variance controlling groundwater quality. The presence of Cu3+ and Zn2+ in this group probably suggests that they are introduced into aquifers by natural and anthropogenic sources. The acidity, as reflected by the low pH of the groundwater, may enhance the mobility of these metals during groundwater flow.
5.6. Cluster Analysis
Cluster analysis was employed in categorizing groundwater quality variables into distinctive groups of clusters 1 and 2 (Figure 4 and Table 4). The existence of two clusters invariably suggests that the groundwater in the area under investigation is characterized by two different water qualities. Cluster 1 has the highest number of samples and consists mostly of samples collected from boreholes, while cluster 2 consists of samples from 2 boreholes and 6 shallow dug wells. The inclusion of boreholes KB5 and KB4 (Table 5) in cluster 2 invariably indicates that the boreholes are as shallow as dug wells; this probably revealed common sources of contaminations occasioned by their shallow depths.
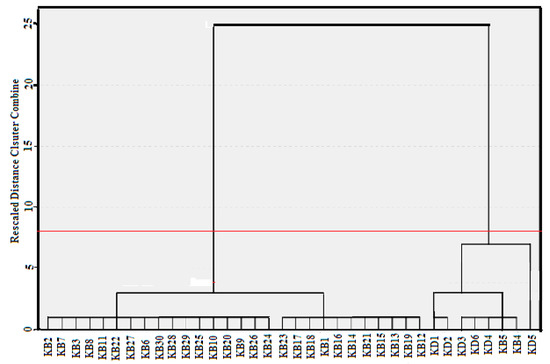
Figure 4.
Dendrogram from cluster analysis of water samples depicting 2 clusters.
Table 4.
Mean concentration of groundwater quality parameters for the 2 clusters of water samples.
Table 5.
Samples present in each of the clusters of the Dendrogram.
Figure 4 clearly shows that cluster 1 is subdivided into two sub-clusters, A (17 samples) and B (11 samples), while cluster 2 is subdivided into 3 sub-clusters, C (5 samples), D (2samples) and E (1 sample). Sub-clusters A and B have mean TDS concentrations of 40.9 mg/L (ranging from 17.6 to 55.8 mg/L) and 69.73 mg/L (ranging from 4.58 to 49.8 mg/L), respectively. Sub-clusters C, D and E have mean concentrations of TDS of 208.57 mg/L (ranging from 173.14 to 225.15 mg/L), 324.42 mg/L (ranging from 298.67 to 350.27 mg/L) and 574.12 mg/L, respectively. TH, EC, TDS, PO4−, NO3−, major anions and cations− concentrations increase substantially from clusters 1 to 2. The sequence of cations and anions preponderance in the water samples of cluster 1 is Na+ > Ca2+ > K+ > Mg2+ and Cl− > SO4−. The order for Cluster 2 is Ca2+ > Na+ > Mg2+ > K+ and Cl− > SO4−. The concentration of NO3− and PO4− and heavy metals in the water samples of both clusters appeared insignificant. However, the slightly elevated level of them in cluster 2, especially NO3− and PO4−, indicates contamination. The principal groundwater types for cluster 1 are Na+ + Ca2+- Cl− and Na+ Ca2+- SO4−. It is observed that this groundwater type has the lowest mean concentration ions, except for Na+, K+ and HCO3−. The groundwater type of cluster 2 is Ca2+ + Na+, Cl− and Ca2+ Na+, SO4−. The high concentrations of Cl− and slight enhanced level of NO3− and PO4− concentrations attest to the fact that anthropogenic effects have considerable influence on the groundwater quality in cluster 2, which is mainly due to the shallow nature of the boreholes and dug wells that are more importantly more vulnerable to migrating contaminants.
Figure 5 shows two clusters obtained from the cluster analysis of 20 groundwater variables. Cluster 1 represents measures of NO3− SO4−, Ca2+, Na+ and pH (sub-cluster 2) and Cl−, TH (sub-cluster 3)
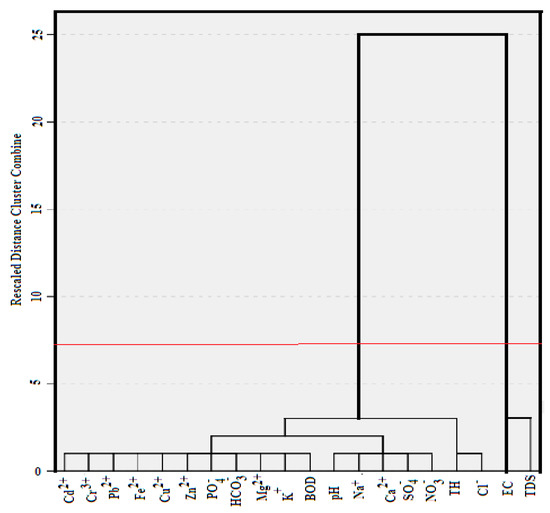
Figure 5.
Two clusters obtained from cluster analysis of 20 groundwater variables.
BOD, K+, HCO3−, PO4−, Zn2+, Cu2+, Fe2+, Pb2+, Cr3+ and Cd2+ (Sub-cluster 1) and cluster 2 are represented by the measure of EC and TDS. These distinctive groups invariably indicate that two factors are responsible for the modification of groundwater quality in the area. These factors could be ascribed to contaminations emanating from anthropogenic effects and natural hydrogeological processes associated with aquifers. Several processes may control the quality of groundwater in cluster 1. Ionic exchange, mineral dissolution and anthropogenic sources are responsible for the reshaping of groundwater quality. Anthropogenic sources of contamination involving leachates and septic tanks mixing with groundwater may have influenced groundwater quality in cluster 2.
6. Conclusions
Resistivity data was coupled with borehole logs to study the lithofacies of the subsurface geology. The results revealed that the subsurface geology consists of clay, sand, sandy clay and peat facies. The geochemical analysis of groundwater revealed water with a composition that was marginally variable across the study area. The variation emanated from different geochemical sources, which are greatly influenced by the depth at which the aquifers occur and the type of subsurface lithofacies distributed across the area. The EC, TDS and other dissolve ions are conspicuously and significantly lower than the known acceptable limits. The overall quality of the groundwater is generally desirable and satisfactorily potable, despite being of acidic characteristics and having enhanced iron concentrations, which are typical to the aquifers of the Niger Delta region.
The data reduction technique associated with PCA was excellently and appropriately used in the study to reduce 20 variables obtained from 36 groundwater samples into the three most conspicuous and significant variables, which have greater control over groundwater quality. These variables EC, TDS and BOD and their correlative equivalents, Cl− and TH, SO4−, NO3− PO4−, Pb2+ of PC 1, are indicative of having evolved from the same hydrogeological source. The association of these variables has sufficiently strengthened the fact that dissolve ions have played significant roles in the modification of groundwater quality.
The high factor loading of BOD is indicative of groundwater that has evolved from its mixing with anthropogenic sources of contaminants and probably from the peat sediments found in areas far from vicinities of both the Ethiope and Benin rivers.
The source of the major anion variables is attributable to the probable weathering and dissolution of feldspar and clay sediments of the water bearing Benin Formation. While the heavy metals are of insignificant concentrations in the groundwater across the study area, their availability is adduced to anthropogenic contamination involving gas flaring, point and non-point sources. The correlation of some heavy metals with some of the major ions suggests the same source of origin. The heavy metals are probably deposited along with the feldspar and clay-rich sediments of the aquifer or are filtrates of absorbed metal from the surface of clay deposits during vertical percolation and lateral groundwater flows.
The 20 variables were categorized by cluster analysis into two distinctive groups. The existence of two clusters is in support of groundwater being characterized by two different water qualities. These distinctive groups invariably indicate two factors that are responsible for the modification of groundwater quality in the area. These factors could be ascribed to contaminations emanating from anthropogenic activities and natural hydrogeological processes associated with aquifers. Several processes responsible for the reshaping of groundwater quality are ionic exchange, mineral dissolution and anthropogenic sources.
Author Contributions
O.O.-A. conceived and designed the research. O.O.-A. and K.E.A. acquired the resistivity data and groundwater samples. K.E.A. interpreted resistivity data O.O.-A. wrote most parts of the paper and revised and edited the manuscript while K.E.A. wrote resistivity aspect and geology of the study area. C.F.U. edited the manuscript.
Funding
This research received no external funding.
Conflicts of Interest
The authors declare no conflict of interest.
References
- Srinivasamoorthy, K.; Gopinath, M.; Chidambaram, S.; Vasanthavigar, M.; Sarma, V. Hydrochemical characterization and quality appraisal of groundwater from Pungar sub basin Tamilnadu India. J. King Saud Univ.-Sci. 2014, 26, 37–52. [Google Scholar] [CrossRef]
- Dillon, P.J.; Kirchner, W.B. The effects of geology and land use on the export of phosphorous from watersheds. Water Res. 1975, 9, 125–148. [Google Scholar] [CrossRef]
- Sophocleous, M. Interactions between groundwater and surface water: The state of the science. Hydrogeol. J. 2002, 10, 52–67. [Google Scholar] [CrossRef]
- Brunke, M.; Gonser, T. The ecological significance of exchange processes between rivers and groundwater. Freshw. Biol. 1997, 37, 1–33. [Google Scholar] [CrossRef]
- Ohwoghere-Asuma, O.; Aweto, K.E.; Chinyem, F.I.; Nwankwoala, H.O. Assessing the Protective Capacity of Aquifers Using Very-Low-Frequency Electromagnetic Survey. Geosciences 2018, 8, 150. [Google Scholar] [CrossRef]
- Ashley, R.P.; Lloyd, J.W. An example of the use of factor analysis and Cluster analysis in groundwater chemistry interpretation. J. Hydrol. 1978, 39, 441–444. [Google Scholar] [CrossRef]
- Jackson, J.E. A User’s Guide of Principal Component; Wiley: New York, NY, USA, 1991. [Google Scholar]
- Meglen, R.R. Examining large databases: a chemometric approach using principal component analysis. Marine Chem. 1992, 39, 217–237. [Google Scholar] [CrossRef]
- Pazand, K. Geochemistry and multivariate statistical analysis for fluoride occurrence in groundwater in the Kuhbanan basin, Central Iran, Model. Earth Syst. Environ. 2016, 2, 72. [Google Scholar] [CrossRef][Green Version]
- Qian, J.; Wang, L.; Ma, L.; Lu, Y.H.; Zhao, W.; Zhang, Y. Multivariate statistical analysis of water chemistry in evaluating groundwater, geochemical evolution and aquifer connectivity near a large coalmine, Anhui, China. Environ Earth Sci. 2016, 75, 747. [Google Scholar] [CrossRef]
- Dragon, K. Application of factor analysis to study contamination of semi- confined aquifer (Wickopolska buried valley aquifer, Poland). J. Hydrol. 2006, 331, 12–279. [Google Scholar] [CrossRef]
- Lambrakis, N.; Antonakos, A.; Panagoponlous, G. The use of multi-component statistical analysis in hydrological environmental research. Water Resour. 2004, 38, 1862–1872. [Google Scholar]
- Nayan, J.K.; Krishna, G.B. Multivariate statistical evaluation of heavy metals in the surface water sources of Jia Bharali river basin, North Brahmaputra plain, India. Appl. Water Sci. 2016, 10, 1–10. [Google Scholar] [CrossRef]
- Zhang, X.; Qian, H.; Chen, J.; Qiao, L. Assessment of Groundwater Chemistry and Status in a Heavily Used Semi-Arid Region with Multivariate Statistical Analysis. Water 2014, 6, 2212–2232. [Google Scholar] [CrossRef]
- Asaad, M.A.; Abdelazim, N.; Valeriano, O.C.S. Groundwater Quality Investigation Using Multivariate Analysis––Case Study: Western Nile Delta Aquifer, Egypt. Intern. J. Environ. Sci. Develop. 2016, 7, 1–9. [Google Scholar]
- Environmental Sciences Laboratory. Multivariate Statistical Analysis of Water Chemistry in Evaluating the Origin of Contamination in Many Devils Wash, Shiprock, New Mexico. Doc. No. S09257, 2016. Available online: www.l m.doe.gov/WorkArea/linkit.aspx?Link (accessed on 1 November 2018).
- Allen, J.R.L. Late Quaternary Niger Delta and Adjacent Area. Sedimentary Environment and lithofcaies. Bull. AAPG 1965, 49, 547–600. [Google Scholar]
- Short, K.C.; Stauble, A.J. Outline of geology of the Niger Delta. Bull. AAPG 1967, 54, 761–779. [Google Scholar]
- Zohdy, A.A.R. The auxiliary point method of electrical sounding interpretation and its relationship to Dar Zarrouk parameters. Geophysics 1965, 30, 644–650. [Google Scholar] [CrossRef]
- Koefeod, O. Geosounding Principles 1. Resistivity Sounding Measures; Elsevier: Amsterdam, The Netherlands, 1979; 275p. [Google Scholar]
- Vander-Velpen, B.P.A. RESIST; Version 1. 0. MSc. Research Project; ITC: Delft, The Netherlands, 1988.
- Rice, E.W.; Baird, R.B.; Eaton, A.D. Standard Methods for the Examination of Water and Waste Water, 39th ed.; American Public Health Association, American Water Works Association, Water Environment Federation: Washington, DC, USA, 2011. [Google Scholar]
- NSDWQ. Nigeria Standard for Drinking Water Quality, Nigeria Industrial Standard; Standard Organization of Nigeria Governing Council: Abuja, Nigeria, 2007.
- WHO/UNICEF. Meeting the MDG Drinking Water and Sanitation: A Mid-Term Assessment of Progress; World Health Organizatiom: Geneva, Switzerland, 2004. [Google Scholar]
- Comas, X.; Slater, L.; Reeve, A.S. Pool patterning in a northern peatland: Geophysical evidence for the role of postglacial landforms. J. Hydrol. 2011, 399, 173–184. [Google Scholar] [CrossRef]
- Asadi, A.; Huat, B.B.K. Electrical resistivity of tropical peat. Elec. J. Geotech. Engr. 2009, 14, 1–9. [Google Scholar]
- Susaiappan, S.; Somanathan, A.; Duraipandian, J. A Geophysical Investigation of Resistivity and Groundwater Quality near a Corporate Solid Waste. Dump. Pol. J. Environ. Stud. 2015, 24, 2761–2766. [Google Scholar] [CrossRef]
- Ohwoghere-Asuma, O.; Aweto, K.E.; Akpoborie, I.A. Investigations of Groundwater Quality and Evolution in an Estuary Environment: A case study of Burutu Island, Western Niger Delta, Nigeria. Environ. Hydrol. 2012, 22, 1–14. [Google Scholar]
- Piper, A.M. A graphic procedure in geochemical interpretation of water analysis. Trans. Am. Geophys. Union 1994, 25, 914–923. [Google Scholar] [CrossRef]
- Akpoborie, I.A.; Aweto, K.E.; Ohwoghere-Asuma, O. Urbanization and Major Ion Hydrogeochemistry of the Shallow Aquifer at the Effurun—Warri Metropolis, Nigeria. Environ. Pollu. 2015, 4, 1. [Google Scholar] [CrossRef]
- Amadi, A.N.; Olasehinde, P.I.; Yisa, J.; Okosun, E.A.; Nwankwoala, H.O.; Alkali, Y.B. Geostatistical Assessment of Groundwater Quality from Coastal Aquifers of Eastern Niger Delta, Nigeria. Geosciences 2012, 2, 51–59. [Google Scholar] [CrossRef][Green Version]
- Li, P.Y.; Qian, H.; Wu, J.H. Hydrochemical characteristics and evolution laws of drinking groundwater in Pengyang County, Ningxia, Northwest China. J. Chem. 2011, 8, 565–575. [Google Scholar]
- Liu, C.; Lin, K.; Kuo, Y. Application of factor analysis in the assessment of groundwater quality in a black disease area in Taiwan. Sci. Total Environ. 2003, 313, 77–89. [Google Scholar] [CrossRef]
- Matthess, G. The Properties of Groundwater; Willey: New York, NY, USA, 1982. [Google Scholar]
- Omo-Irabor, O.O.; Olobaniyi, S.B.; Oduyemi, K.; Akunna, J. Surface and groundwater water quality assessment using multivariate analytical methods: A case study of the Western Niger Delta, Nigeria. Phys. Chem. 2008, 33, 666–673. [Google Scholar] [CrossRef]


© 2019 by the authors. Licensee MDPI, Basel, Switzerland. This article is an open access article distributed under the terms and conditions of the Creative Commons Attribution (CC BY) license (http://creativecommons.org/licenses/by/4.0/).