Abstract
This study numerically investigates the NO removal performance of a staged catalyst substrate employed in an industrial marine after-treatment system. The computational domain is based on the lab-scale experimental device used for measuring pressure drop, serving as a digital twin to accurately reproduce the staged catalyst configuration prior to its application in full-scale industrial reactors. Experiments were conducted to estimate the parameters for a porous model, employed for efficient computation of flow and reactive mass transfer inside the catalyst substrate without needing a complex computational mesh of the monolith structure. A reaction mechanism from the literature was modified and verified for marine SCR reactors. The three-dimensional numerical simulations in this study indicate that the NO removal in the staged catalyst substrate varies depending on the catalyst configuration, primarily due to differences in the upstream flow uniformity. This study demonstrates that relocating a single catalyst substrate to the downstream position improved conversion by 6.5 percentage points, while a two-stage catalyst configuration yielded a 15.5 percentage-point increase under identical exhaust conditions. In addition, the residence time exhibited significant variations depending on the catalyst arrangement and inlet velocity, highlighting it as a critical parameter governing NO reduction performance. The findings in the present study can serve as a reference for future analyses conducted under practical conditions in industrial-scale marine SCR systems.
1. Introduction
Given the escalating climate change crisis, there is a pressing need to address greenhouse gas emissions, not only from land-based sources but also from maritime transportation and related activities. The International Maritime Organization (IMO) adopted the 2023 IMO Strategy on Reduction in GHG Emissions from Ships, declaring a goal to reach net-zero GHG emissions from international shipping by or around 2050. To achieve this, a specific target has been set to ensure that zero or near-zero GHG emission technologies represent at least 5%, striving for 10%, of the energy used by international shipping by 2030 [1]. In line with efforts to protect the polar environment, the IMO has recently emphasized the impact of Black Carbon emissions on glacial melting and adopted recommendatory guidelines for its measurement and reduction [2]. Geographical restrictions are also tightening; starting in March 2026, the Canadian Arctic and the Norwegian Sea will be designated as Nitrogen Oxides Emission Control Areas (NOx ECAs), subjecting ships to stringent Tier III standards [3]. Complementing these technical rules, the European Union (EU) is accelerating decarbonization through economic instruments by fully integrating the shipping sector into its Emissions Trading System (ETS) from 2026 [4], and mandating eco-friendly infrastructure like Onshore Power Supply (OPS) under the AFIR regulation [5].
To comply with these rigorous nitrogen oxide (NOx) emission standards, Selective Catalytic Reduction (SCR) technology has become the industry standard for marine applications. Originating from the automotive sector, SCR technology is mature [6], but its application to marine vessels presents unique challenges due to the massive scale of the systems. The two primary catalyst types employed are copper-exchanged SSZ-13 zeolite (Cu-CHA), common in diesel vehicles [7,8], and Vanadium-based catalysts (V2O5-WO3/TiO2), which are preferred in marine environments for their sulfur resistance [9,10]. Unlike compact automotive units, marine after-treatment systems involve large exhaust ducts and reactors, which inherently suffer from severe non-uniformity in flow velocity and temperature distributions. To mitigate these issues, extensive research has been conducted on designing various static mixers to enhance mixing efficiency and flow uniformity [11,12,13]. In terms of reactor design, the catalyst is typically supported by ceramic or metallic monolith substrates, whose thermal properties—such as heat capacity and conductivity—significantly influence the internal thermal distribution under external heat loss conditions [14].
Along with hardware developments, computational modeling has evolved to support these designs. While simplified one-dimensional (1D) models [15,16] and reduced-order models [17] are still widely used for kinetic studies due to their computational efficiency, they often rely on the assumption of uniform flow, thus failing to capture the complex spatial variations inherent in large-scale marine reactors. 3D Computational Fluid Dynamics (CFD) simulations are essential for capturing complex flow behaviors such as the injection of Urea Water Solutions [18,19]. In large-scale marine SCR systems, spatial temperature deviations can be a decisive factor in reducing overall NOx emissions [14]. Moreover, CFD simulations are capable of analyzing the influence of a suction probe within the monolith channel [20], and Large-Eddy Simulation (LES) makes resolving the transition flow possible after the monolith channel [21].
To overcome the limitations of the use of simplified models, e.g., a porous model, and to ensure the reliability of the numerical approach, this study adopts an experiment measuring the differential pressure in the lab-scale device. Instead of relying solely on theoretical simulations, a 3D CFD model was constructed at the exact scale of the experimental apparatus, serving as a digital twin. Experiments were conducted under various inlet velocities and substrate arrangements (single and double configurations) to estimate the parameters of a porous medium model, which enables efficient computation of flow and reactive mass transfer within the catalyst substrate without requiring a computationally expensive detailed mesh of the monolithic structure. In addition, a reaction mechanism reported in the literature was modified and validated for application to marine SCR reactors. This study investigates the correlation between flow uniformity and NO reduction performance as functions of catalyst staging and inlet velocity, and demonstrates that, in addition to catalyst and reaction process development, the optimization of flow characteristics is a critical factor in enhancing the performance of SCR systems.
2. Numerical Methodology
2.1. Governing Equations
The numerical simulations in this study are three-dimensional, steady-state, incompressible flow within porous media, incorporating heat and reactive mass transfer. The commercial software CFD-ACE+ 2025.0 [22] is employed. Mass and momentum conservation in conservative are written by
Here, denotes the fluid density, is the pressure, is the viscosity of the fluid, is the permeability, and represents the quadratic drag factor. denotes the shear stress tensor, while represents the porosity, a measure of the void fraction in the porous media. is the three-dimensional velocity vector consisting of . It should be noted that represents the physical velocity (the velocity of flow passing through the porous media), rather than the superficial velocity . The last two terms in Equation (2) account for the additional hydraulic resistance exerted by the porous matrix on the flow field. This corresponds to the Darcy–Forchheimer equation for the pressure drop through the porous media with length in the direction.
Energy and species conservation within the porous media are formulated as follows:
where is the total enthalpy of the fluid. denotes the effective thermal conductivity.
in Equation (3) represents the energy source term, corresponding to the heat of reaction. and in Equation (4) are the mass fraction and diffusive flux of species , respectively. is the volumetric reaction rate of species , defined by the following:
where is the surface-to-volume ratio and is the rate of heterogeneous reaction of species .
2.2. Reaction Model
The standard SCR reaction mechanism adopted in this study consists of the following steps:
These reactions correspond to adsorption–desorption (R1), oxidation (R2), and the standard SCR reaction (R3), respectively. Fast SCR and SCR pathways are excluded from this analysis due to the absence of pre-oxidation catalysts [23]. In the absence of upstream oxidation catalysts, marine exhaust gas streams are characterized by a NO-dominant NOx composition, with insufficient NO2 to establish the equimolar NO:NO2 ratio required for the Fast SCR reaction [24,25]. Accordingly, the NOx reduction process proceeds predominantly via the standard SCR pathway. The kinetic rate expressions for R1–R3 were adapted from Chatterjee et al. [23]. Specifically, the mole fraction at the surface site was employed instead of the site fraction for steady-state calculations in the present study. The modified rate equations are as follows:
This simplified reaction model is advantageous for integration with large-scale CFD simulations as it reduces computational cost associated with calculating the unsteady site fractions with stiff chemistry.
The reaction model was verified against the experimental data measured by Koo et al. [26]. Two-dimensional simulations under steady-state conditions were employed for verification of the reaction model. The kinetic parameters for the rate equations, Equations (6)–(9), originate from Chatterjee et al. [23], with modifications made to the pre-exponential factor and activation energy for the SCR reaction to achieve the best fit with the experimental data. Specifically, to reflect the characteristic active sites of the commercial marine SCR catalyst used in the reference experiment, the pre-exponential factor was fine-tuned from to , and the activation energy from 55 kJ/mol to 60 kJ/mol. The catalytic monolith substrate was modeled by the porous model using the permeability and quadratic drag factor . The thermal conductivity of the substrate is calculated as follows [27]:
Based on the experimental conditions of Koo et al. [26], the inlet gas composition was set to 400 ppm of , 400 ppm of , 10% of , and 8% of , with Helium () used as the balance gas. The inlet temperature ranges between 230 and 430 °C, and the area velocity is 25 m/h. The conversion was calculated by the average NO mole fractions at the inlet and outlet boundaries. Figure 1 presents the predicted NO conversion in comparison with the experimental data from Koo et al. [26]. The results demonstrate that, with the modified parameters for the SCR reaction, both predicted and measured values are in good agreement. The results demonstrate that, with the modified parameters for the SCR reaction, both predicted and measured values are in good agreement, showing a maximum deviation of 2.3% of conversion.
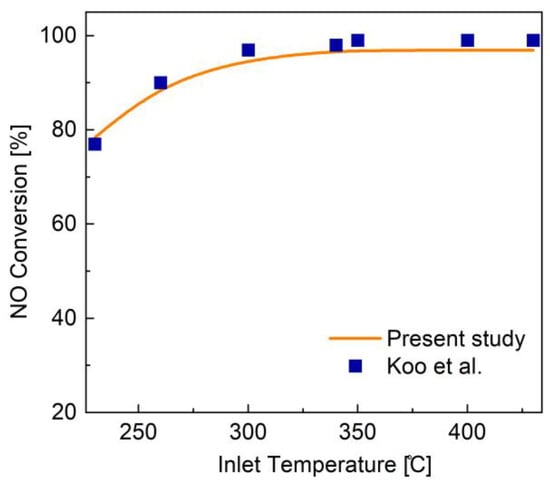
Figure 1.
Verification of reaction model by comparing the predicted NO conversion in the present study with the experimental study by Koo et al. [26].
3. Pressure Drop Measurement
This section introduces the experimental device for measuring the pressure drop through the catalyst substrates. Figure 2 shows the experimental device designed to quantitatively evaluate hydraulic resistance due to the gas flowing through the staged catalyst substrates. The device consists of a blower that generates air flow, a thermal anemometer
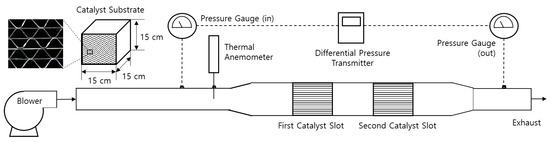
Figure 2.
Experimental device for measuring the pressure drop across the staged catalyst substrates under various inlet gas velocities (Testo 405i, Testo SE & Co. KGaA, Titisee-Neustadt, Germany) that measures flow velocity, two pressure gauges (HISCO CL.1.5, HISCO Inc., Seoul, Republic of Korea) with a differential pressure transmitter (Dwyer Magnehelic, Dwyer Instruments, Inc., Michigan City, IN, USA), and a test section where the catalyst substrates are mounted. The inlet velocity was controlled by adjusting the blower’s output, and the highest blower output corresponds to approximately 7 m/s depending on the hydraulic resistance. The pressure drop across the substrates was measured using pressure gauges installed at the upstream and downstream of the substrate, and the differential pressure was collected by the transmitter and written via a data logger (Graphtec GL840, Graphtec Corporation, Tokyo, Japan) in real time. Thus, the system allows a precise analysis of pressure drop in terms of the number of substrate layers and variations in flow velocity. The size of the monolith substrate is 15 cm × 15 cm × 15 cm, where the cell density and porosity are 200 cell per square inch (cpsi) and 0.92, respectively.
The inlet has a circular cross-section with an inner diameter of 7.2 cm and expands through a diffuser section into a square cross-section matching the dimensions of the catalyst substrate. To prevent by-pass flow around the catalyst substrate, additional acrylic fixtures were installed upstream and downstream of the substrate to secure its position. These acrylic components were designed with an inner diameter slightly smaller than that of the catalyst front face, thereby firmly holding the substrate and effectively blocking any peripheral flow around it. In practical marine applications, the spacing between the first and second catalyst stages is typically designed to be at least equal to the length of a single catalyst substrate. Thus, the inter-substrate distance was set equal to the length of one catalyst substrate in the lab-scale setup
Figure 3 illustrates the pressure drop curves in terms of the flow velocity for two configurations: (i) the use of a single catalyst substrate and (ii) the use of two catalyst substrates. The pressure drop in both cases monotonically increases with increasing flow velocity, consistent with the non-linear behavior of turbulent flow through porous media. At the lowest blower output, the measured velocity and pressure drop with a single substrate are 1.0 m/s and 20 Pa, and those for the double substrate are 0.8 m/s and 30 Pa. At the highest possible blow output, the values for the single substrate are 7.7 m/s and 340 Pa, and for the double substrate, they are 6.8 m/s and 460 Pa, respectively. Due to the doubled hydraulic resistance, the double substrate configuration exhibits a higher pressure drop—roughly double that of the single substrate case. The experiments were conducted at ambient temperature. Their primary objective was to measure the pressure drop across the actual catalyst substrate and to determine the corresponding parameters for the porous model. The porous model derived from these experiments was subsequently employed to analytically investigate the conversion behavior under realistic temperature conditions. Note that, due to the maximum airflow limitation of the blower in the present lab-scale setup, experiments were conducted only up to approximately 7 m/s. Accordingly, some uncertainty may arise when extrapolating beyond the tested velocities, potentially leading to discrepancies up to 2.5 mbar under realistic conditions.
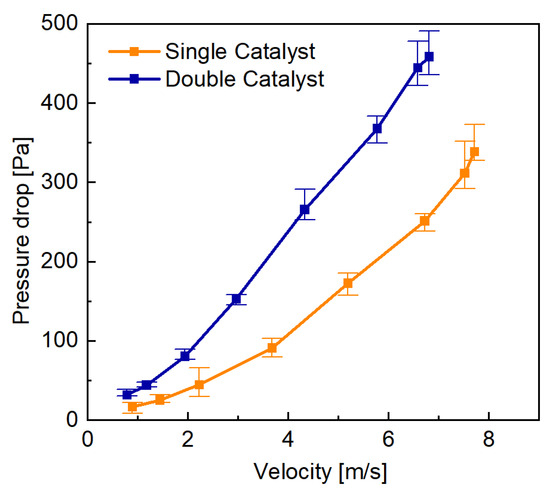
Figure 3.
Measured pressure drop for the single catalyst substrate (orange) and the double catalyst substrate (blue) depending on the flow velocity.
The experimental results clearly demonstrate that the pressure drop follows a second-order polynomial characteristic with velocity, described by the Darcy–Forchheimer relationship. The steeper slope in pressure drop curve in the double substrate case confirms that the inertial resistance factor plays a dominant role in the high-velocity regime, typical of marine exhaust flows. The data acquired from these experiments—specifically the pressure–velocity curves—were crucial for estimating the permeability ( and inertial resistance factor . The estimated values in the present experiment are 0.263 mm2 and 0.015, employed for the porous model in the CFD-ACE+ simulations. While the experimental uncertainty is primarily attributed to the pressure transducer accuracy (±10%), the high degree of fit (R2 = 0.997) between the experimental data and the model predictions confirms the reliability of the estimated coefficients. Note that the computational domain of the porous model excludes the explicit representation of the microstructure and is instead modeled as a cuboidal (void) porous region, where momentum resistance is imposed according to the estimated porous properties. The porous model has been extensively validated through numerous previous studies [14,28,29] for predicting the pressure drop characteristics of multi-channel structures, including monolithic configurations.
4. Results and Discussion
The measured porous parameters and verified reaction models described in Section 2 and Section 3 were employed for CFD simulations with a view to numerically investigate the NO removal efficiency depending on the configuration of the staged catalyst substrate. The computational domain is identical to the experimental device used for measuring pressure drop, as shown in Figure 2, aiming to develop a digital twin of the staged catalyst configuration prior to applying it in the industrial-scale SCR rectors. The 3D numerical simulations of flow, heat and reactive mass transfer under steady state were conducted with the test conditions, varying stage configuration and inlet velocity. Those test conditions are summarized in Table 1. In Table 1, the inlet velocity of 35 m/s denotes the inlet boundary velocity (u) prescribed at the upstream duct of the computational domain. The baseline value of 35 m/s was selected to represent a practical marine operating condition; Jang [30]. reported an exhaust gas velocity of 35 m/s at an engine load of 350 kW, which also falls within the commonly cited marine exhaust-velocity range of approximately 30–40 m/s. The inlet temperature for all test cases is set to 633 K (360 °C) and the thermal boundary condition at the wall is adiabatic. The 3V2O5–7MoO3/TiO2 catalyst (denoted as 3V7Mo/TiO2) was selected for the SCR process and uniformly coated onto each metal monolith composed of alternating flat and corrugated metallic foils. The cell density of the monolith substrate is 200 cpsi, which has 0.275 cm of hydraulic diameter of a single channel in the monolith. The total void fraction of the substrate is 0.636. Further details regarding the catalyst preparation and monolith substrate are available in Kim et al. [29].

Table 1.
Test conditions for numerical simulations of NO removal in staged catalyst substrates.
Figure 4 compares the velocity distributions for three different catalyst substrate configurations, all of which are operated under identical inlet velocity, 35 m/s. To accurately represent fully developed flow, the upstream pipe length was sufficiently extended ahead of the catalyst section. As a result, the flow experiences resistance induced by the hydraulic resistance of the catalyst substrate. In all three cases, the velocity decreases as the flow expands within the diffuser section, indicating flow spreading; however, the flow characteristics within the expansion region vary depending on the catalyst location. Compared to Case 1 and Case 3, where the catalyst is positioned in the first stage, Case 2 exhibits a more unified velocity distribution in the diffuser section, suggesting enhanced flow homogenization prior to entering the catalyst. A significant reduction in flow velocity is observed between the catalyst substrate, demonstrating the flow-uniformizing effect caused by the hydraulic resistance of the catalyst.
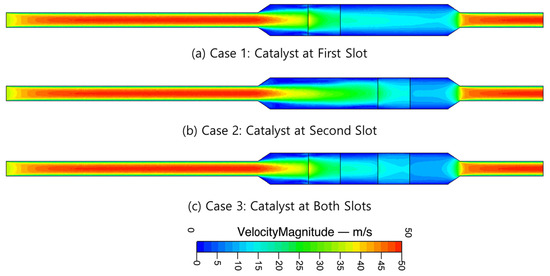
Figure 4.
Comparison of velocity distributions from the cases with the catalyst placed at the first slot (a) and at the second slot (b), and at both slots (c), corresponding to Cases 1–3.
Welten’s uniformity index [31] was employed to quantitatively evaluate the flow uniformity downstream of the catalyst substrate:
In addition, the residence time of the flow passing through the catalyst substrate can be defined as follows.
Figure 5 compares the uniformity index evaluated at the outlet of each catalyst substrate with the corresponding residence time through each catalyst layer. First, Cases 1, 2, and 3, having identical inlet velocity, are compared. The flow uniformity at the first catalyst in Cases 1 and 3 exhibits similar values; however, despite using an identical single catalyst substrate, Case 2—where the catalyst is installed in the second slot—shows a higher flow uniformity. For Case 3, employing a two-stage catalyst configuration, the flow uniformity at the second catalyst is the highest among the three cases, although the difference compared to Case 2 is marginal.
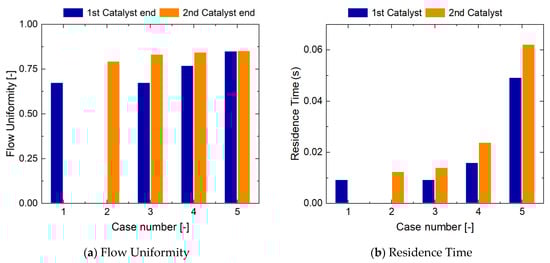
Figure 5.
Flow uniformity at the end of each catalyst and residence time of the flow passing through each catalyst substrate for the five test cases.
When comparing Cases 3, 4, and 5, which employ the same two-stage catalyst configuration but differ in inlet velocity, the flow uniformity at the second catalyst is consistently higher than that at the first catalyst for all cases. Furthermore, a clear increasing trend in flow uniformity is observed as the inlet velocity decreases. This tendency can be correlated with the residence time shown in Figure 5b. As the inlet velocity decreases, the residence time at each catalyst stage increases significantly. As suggested by the uniformity trends, more uniform flow tends to occur at lower mean velocities, which is reflected in the increased residence time. Although the magnitude of change differs, the flow uniformity and residence time exhibit qualitatively similar trends.
Figure 6 illustrates the NO mole fraction distributions for Cases 1, 2, and 3. In all three cases, a decreasing trend in NO concentration is observed as the flow passes through the catalyst layers due to the SCR reactions occurring within the catalyst substrates. In Cases 1 and 3, which include a first-stage catalyst, NO is observed to concentrate toward the central region at the onset of the diffuser section as a result of flow inertia. In contrast, Case 2, which does not include a first-stage catalyst, exhibits a more uniform radial distribution of NO in the diffuser region, with NO spreading more evenly across the expanded cross-section. This behavior is consistent with the previously discussed results for flow uniformity and residence time. Among the three cases, Case 1 shows a relatively higher NO mole fraction at the outlet. Despite employing a single catalyst layer, the outlet NO mole fraction distributions of Cases 2 do not exhibit a noticeable difference against those from Case 3 having double catalyst substrates.
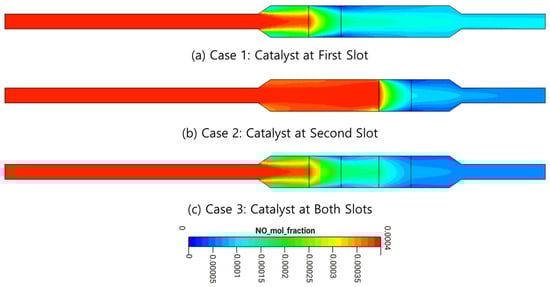
Figure 6.
Distributions of NO mole fractions from the cases with the catalyst placed at the first slot (a) and at the second slot (b), and at both slots (c), corresponding to Cases 1–3.
Figure 7 compares the total pressure drop and the total NO conversion for the five test cases. The pressure drop shows a strong dependence on the inlet velocity. Accordingly, Cases 1, 2, and 3, which operate at higher inlet velocities, exhibit similar pressure drops, whereas lower pressure drops are observed for Cases 4 and 5 as the inlet velocity decreases. Among Cases 1, 2, and 3, Case 3, employing two catalyst layers, results in the highest pressure drop. Even though both Cases 1 and 2 use a single catalyst layer, Case 2—where the catalyst is positioned downstream—exhibits a slightly larger pressure drop. This indicates that achieving higher flow uniformity and longer residence time is associated with an increased pressure loss.
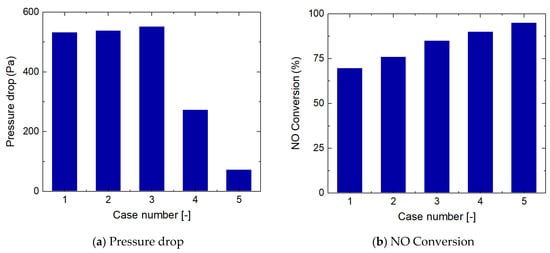
Figure 7.
Comparison of pressure drop and NO conversion efficiency from the five test cases.
As shown in Figure 7b, the total NO conversion increases sequentially from Case 1 to Case 5. Although Cases 1 and 2 employ an identical single catalyst layer, the catalyst placement significantly influences the flow uniformity and residence time, as discussed previously. Consequently, Case 2 exhibits a higher NO conversion than Case 1, where the catalyst is installed upstream. Owing to the use of a two-stage catalyst configuration, Case 3 achieves a higher NO conversion than Cases 1 and 2. Furthermore, Cases 4 and 5, which operate at lower inlet velocities, exhibit even higher NO conversion, confirming the strong correlation between reduced inlet velocity and enhanced NO reduction performance.
In the present study, the inlet temperature was fixed and adiabatic wall boundary conditions were applied; therefore, temperature variations arise solely from the heat released by the chemical reactions. Figure 8 compares the temperature distributions for Cases 1, 2, and 3. Since the temperature field is governed by the reaction heat, the resulting distributions exhibit a pattern that is effectively inverted relative to the NO distributions shown in Figure 6. Consistent with the previously discussed NO conversion results, the magnitude of reaction heat increases from Case 1 to Case 3. The temperature primarily increases in the axial direction within the catalyst substrates, while downstream of the catalyst layers, heat is more uniformly redistributed through convection and flow recirculation. It should be noted that, despite the flow uniformization achieved through the catalyst layers, the highest temperatures are still observed in the central region of the reactor.
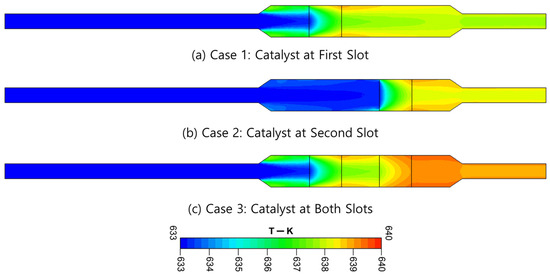
Figure 8.
Temperature distributions from the cases with the catalyst placed at the first slot (a) and at the second slot (b), and at both slots (c), corresponding to Cases 1–3.
To further investigate these effects, Figure 9 compares the radial distributions of temperature and NO concentration at the outlet of each catalyst layer. The NO and temperature profiles at the upstream catalyst, shown in Figure 9a,c, exhibit more pronounced radial variations than those observed at the downstream catalyst in Figure 9b,d. This radial dependence diminishes as the number of catalyst stages increases and as the inlet velocity decreases, corresponding to an increase in residence time (or flow uniformity). These results indicate that the reaction rate is highest in the central region of the catalyst, while relatively weaker reactions occur toward the outer radial regions. Considering these coupled flow and reaction characteristics, localized radial rearrangement of the catalyst and optimization of the catalyst staging could be implemented depending on the operating conditions.
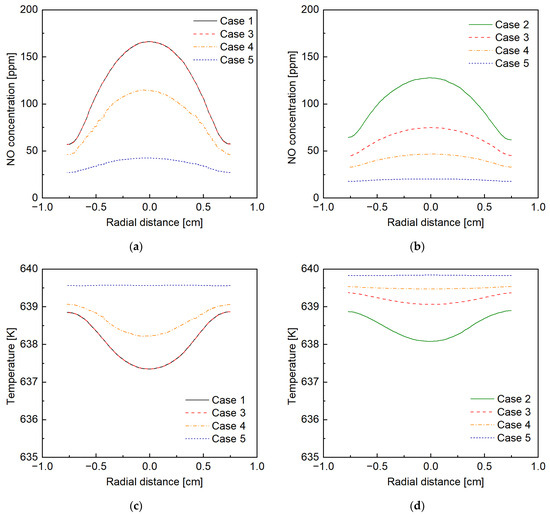
Figure 9.
Comparison of NO concentration and temperature profiles at the end of catalyst substrates. NO concentration from the five test cases from the end of first catalyst (a) and the end of second catalyst (b), temperature from the end of first catalyst (c) and the end of second layer (d). Case 2, which does not have the first layer, is missing in (a,c). Case 1, which does not have the second layer, is missing in (b,d), accordingly.
From the results shown in Figure 5 and Figure 7, the NO conversion performance of a staged catalyst system at full scale can be inferred. As the number of catalyst stages increases, the total pressure drop across the catalyst correspondingly increases, and the residence time—exhibiting a trade-off relationship with pressure drop—is also expected to increase due to the reduced bulk flow velocity within the reactor. Although adding additional catalyst stages contributes to enhanced NO conversion, the results indicate that securing a sufficiently enlarged upstream flow region ahead of the catalyst has a more pronounced effect on improving flow uniformity and, consequently, catalytic performance. In particular, the expansion of the upstream flow field was found to significantly enhance both the spatial uniformity of the velocity distribution and the overall NO conversion efficiency. In practical catalytic reactor systems, different types of catalysts are generally arranged sequentially in upstream and downstream configurations rather than stacking identical catalyst modules, as assumed in the present study. Nevertheless, the underlying influences on flow uniformity and residence time are expected to exhibit trends comparable to those observed in this work.
For compliance with the IMO Tier III NOx emission standard, the allowable NOx emission limits depend on the engine’s rated speed (n, in rpm), as specified in Regulation 13 of MARPOL Annex VI: 3.4 g/kWh for n < 130 rpm, 9·n−0.2 g/kWh for 130 ≤ n < 2000 rpm, and 2.0 g/kWh for n ≥ 2000 rpm for ships operating in designated NOx Emission Control Areas (ECAs) under Tier III conditions [3]. Based on these limits, required NO conversion efficiencies were estimated for representative engine-out NOx levels typical of low-, medium-, and high-speed marine engines to determine the NOx reduction needed to satisfy Tier III, with practical design targets generally in the range of approximately 80–85% NO conversion to ensure compliance under varying operating conditions. Also, it is worth mentioning that, to isolate the pure aerodynamic effects of catalyst staging on flow uniformity, the present study assumed perfect upstream mixing with a fixed Ammonia-to- Ratio (ANR) of 1.0. Evaluations of variable ratios and potential ammonia slip are beyond the scope of this study but remain critical subjects for future research under real-world operational variations. In future studies, flow diagnostic techniques such as LDA or PIV will be considered to measure mean velocity distributions and turbulence levels upstream and downstream of the catalyst, thereby providing experimental cross-validation of the CFD-predicted flow uniformization effects and improving the reliability of staging design guidelines toward industrial-scale implementation.
5. Conclusions
This study numerically investigated the NO removal performance of a staged catalyst substrate employed in an industrial marine after-treatment system. The computational domain was developed based on a lab-scale experimental apparatus used for pressure drop measurements, serving as a digital twin to accurately represent the staged catalyst configuration prior to its application in full-scale industrial SCR reactors. The results demonstrate that flow uniformity, governed by catalyst staging and inlet velocity, plays a crucial role in NO reduction performance. The case with a single substrate positioned at the first slot achieved a conversion of 69.8%, whereas relocating the substrate downstream to the second slot increased the conversion to 76.3%. This improvement is attributed to enhanced flow uniformity resulting from a sufficiently developed flow field before the catalyst. The use of a two-stage catalyst configuration further increased the conversion to 85.3%. Additionally, decreasing the inlet velocity led to an increase in residence time, resulting in a maximum conversion of 95.3%. Furthermore, the findings indicate that localized radial rearrangement of the catalyst and the optimization of catalyst staging can be effectively implemented depending on the operating conditions. These results highlight that, in addition to catalyst and reaction process development, the optimization of flow characteristics is a critical factor in enhancing SCR system performance. Overall, this study provides practical guidance for the design of staged catalyst configurations in industrial-scale marine SCR reactors.
Author Contributions
Conceptualization, K.P. and M.W.; methodology, K.P. and H.I.; software, K.P.; validation, H.I. and M.W.; formal analysis, G.R.B.; investigation, M.W.; resources, M.W.; data curation, K.P.; writing—original draft preparation, K.P. and M.W.; writing—review and editing, M.W.; visualization, G.R.B.; supervision, M.W.; project administration, M.W.; funding acquisition, M.W. All authors have read and agreed to the published version of the manuscript.
Funding
The findings in this study are results of a study on the “Busan Regional Innovation System & Education (RISE)” Project, supported by the Ministry of Education and Busan Metropolitan City (2025-RISE-02-002-008) and also supported by the Korea Institute of Industrial Technology as “Development of the super clean modular platform technology based on AI for eco-friendly ship to respond to IMO 2020/2050 regulations” (grant number: KITECH EH-22-0014). We thank Kyungwon Engineering and Communication (KWEnC) for joint participation in the RISE project and their technical support on CFD simulations.
Data Availability Statement
The data presented in this study are available on request from the corresponding author.
Conflicts of Interest
The authors declare no conflicts of interest.
References
- MEPC, R. 2023 IMO Strategy on Reduction of GHG Emissions from Ships; International Maritime Organization: London, UK, 2023. [Google Scholar]
- MEPC, R. Resolution MEPC.394(82) (Adopted on 4 October 2024) Guidelines on Recommendatory Black Carbon Emission Measurement, Monitoring and Reporting; International Maritime Organization: London, UK, 2024. [Google Scholar]
- ClassNK. Designation of the Canadian Arctic Area and Norwegian Sea Area as Emission Control Areas under MARPOL ANNEX VI (Regulations for the Prevention of Air Pollution from Ships); Nippon Kaiji Kyokai (ClassNK): Chiba, Japan, 2025. [Google Scholar]
- European Parliament and the Council of the European Union. Directive (EU) 2023/959 of the European Parliament and of the Council of 10 May 2023 Amending Directive 2003/87/EC Establishing a System for Greenhouse Gas Emission Allowance Trading Within the Union and Decision (EU) 2015/1814 Concerning the Establishment and Operation of a Market Stability Reserve for the Union Greenhouse Gas Emission Trading System; Publications Office of the European Union: Luxembourg, 2023; pp. 134–226. [Google Scholar]
- European Parliament and the Council of the European Union. Regulation (EU) 2023/1804 of the European Parliament and of the Council of 13 September 2023 on the Deployment of Alternative Fuels Infrastructure, and Repealing Directive 2014/94/EU; Publications Office of the European Union: Luxembourg, 2023; pp. 1–47. [Google Scholar]
- Koebel, M.; Elsener, M.; Kleemann, M. Urea-SCR: A promising technique to reduce NOx emissions from automotive diesel engines. Catal. Today 2000, 59, 335–345. [Google Scholar] [CrossRef]
- Li, P.; Xin, Y.; Zhang, H.; Yang, F.; Tang, A.; Han, D.; Jia, J.; Wang, J.; Li, Z.; Zhang, Z. Recent progress in performance optimization of Cu-SSZ-13 catalyst for selective catalytic reduction of NOx. Front. Chem. 2022, 10, 1033255. [Google Scholar] [CrossRef] [PubMed]
- Wang, J.; Zhao, H.; Haller, G.; Li, Y. Recent advances in the selective catalytic reduction of NOx with NH3 on Cu-Chabazite catalysts. Appl. Catal. B 2017, 202, 346–354. [Google Scholar] [CrossRef]
- Ye, B.; Jeong, B.; Lee, M.-J.; Kim, T.H.; Park, S.-S.; Jung, J.; Lee, S.; Kim, H.-D. Recent trends in vanadium-based SCR catalysts for NOx reduction in industrial applications: Stationary sources. Nano Converg. 2022, 9, 51. [Google Scholar] [CrossRef] [PubMed]
- Siebecke, E.; Hahn, C.; Groß, A.; Kureti, S. Simultaneous HCHO and SCR conversion in lean-burn gas engine exhaust using V2O5/WO3-TiO2 catalysts. Appl. Catal. A 2025, 705, 120435. [Google Scholar] [CrossRef]
- Zhang, C.; Sun, C.; Wu, M.; Lu, K. Optimisation design of SCR mixer for improving deposit performance at low temperatures. Fuel 2019, 237, 465–474. [Google Scholar] [CrossRef]
- Jang, J.; Na, S.; Roh, H.; Ahn, S.; Choi, G. Spraying and Mixing Characteristics of Urea in a Static Mixer Applied Marine SCR System. Energies 2021, 14, 5788. [Google Scholar] [CrossRef]
- Jung, C.; Lee, S.; Jang, J.; Na, S.; Choi, G.; Choi, M.; Park, Y. Performance optimization of static mixer in urea-SCR system considering flow and turbulence characteristics. Results Eng. 2025, 26, 104951. [Google Scholar] [CrossRef]
- Woo, M.; Gu, Y.; Kim, G.-M.; Kim, M.; Kim, H.S.; Lim, D.-H. Numerical Study on NO Conversion Characteristics of Ceramic and Metallic Monoliths Under Steady-State External Heat Loss in Marine After-Treatment System. Korean J. Chem. Eng. 2024, 41, 225–235. [Google Scholar] [CrossRef]
- Wei, L.; Chen, Y.-R.; Marino, S.; Gu, Y.; Epling, W.S. Kinetic modeling of NH3-selective catalytic reduction (SCR) over a mildly hydrothermally aged commercial Cu-SSZ-13 catalyst. Chem. Eng. J. 2023, 467, 143318. [Google Scholar] [CrossRef]
- Bozbağ, S.E. Kinetic model comparison and elucidation of mass transfer limitations in NH3-SCR reactors using Vanadia based washcoats with different thicknesses. Chem. Eng. Sci. 2021, 246, 116892. [Google Scholar] [CrossRef]
- Walander, M.; Sjöblom, J.; Creaser, D.; Lundberg, B.; Tamm, S.; Edvardsson, J. Efficient Experimental Approach to Evaluate Mass Transfer Limitations for Monolithic DOCs. Top. Catal. 2019, 62, 391–396. [Google Scholar] [CrossRef]
- Birkhold, F.; Meingast, U.; Wassermann, P.; Deutschmann, O. Analysis of the Injection of Urea-Water-Solution for Automotive SCR DeNOx-Systems: Modeling of Two-Phase Flow and Spray/Wall-Interaction. SAE Trans. 2006, 115, 252–262. [Google Scholar]
- Birkhold, F.; Meingast, U.; Wassermann, P.; Deutschmann, O. Modeling and simulation of the injection of urea-water-solution for automotive SCR DeNOx-systems. Appl. Catal. B 2007, 70, 119–127. [Google Scholar] [CrossRef]
- Hettel, M.; Antinori, C.; Deutschmann, O. CFD Evaluation of In Situ Probe Techniques for Catalytic Honeycomb Monoliths. Emiss. Control Sci. Technol. 2016, 2, 188–203. [Google Scholar] [CrossRef]
- Hettel, M.; Daymo, E.; Schmidt, T.; Deutschmann, O. CFD-Modeling of fluid domains with embedded monoliths with emphasis on automotive converters. Chem. Eng. Process.-Process Intensif. 2020, 147, 107728. [Google Scholar] [CrossRef]
- ESI. CFD-ACE+ Modules Manual Part 1; ESI CFD Inc.: Huntsville, Alabama, 2009. [Google Scholar]
- Chatterjee, D.; Burkhardt, T.; Bandl-Konrad, B.; Braun, T.; Tronconi, E.; Nova, I.; Ciardelli, C. Numerical Simulation of Ammonia SCR-Catalytic Converters: Model Development and Application; SAE International: Warrendale, PA, USA, 2005. [Google Scholar]
- Chen, Z.; Liu, Q.; Liu, H.; Wang, T. Recent Advances in SCR Systems of Heavy-Duty Diesel Vehicles—Low-Temperature NOx Reduction Technology and Combination of SCR with Remote OBD. Atmosphere 2024, 15, 997. [Google Scholar] [CrossRef]
- Nova, I.; Ciardelli, C.; Tronconi, E.; Chatterjee, D.; Weibel, M. NH3-NO/NO2 SCR for diesel exhausts after treatment: Mechanism and modelling of a catalytic converter. Top. Catal. 2007, 42, 43–46. [Google Scholar] [CrossRef]
- Koo, J. Performance Investigation on New Developed Maritime SCR Catalysts for Medium Speed Engine. In Proceedings of the CIMAC Congress, Helsinki, Finland, 6–10 June 2016. [Google Scholar]
- Hayes, R.E.; Kolaczkowski, S.T. Introduction to Catalytic Combustion; Taylor & Francis: London, UK, 1998. [Google Scholar]
- Woo, M.; Giannopoulos, G.; Rahman, M.M.; Swanson, J.; Stettler, M.E.J.; Boies, A.M. Multiscale numerical modeling of solid particle penetration and hydrocarbons removal in a catalytic stripper. Aerosol Sci. Technol. 2021, 55, 987–1000. [Google Scholar] [CrossRef]
- Kim, M.; Kim, H.S.; Jae, J.; Woo, M.; Lim, D.-H. De-NOx performance of a metal monolithic substrate depending on cell density. Energy Environ. 2025, 0958305X251354919. [Google Scholar] [CrossRef]
- Jang, J. Experimental Study on the Effects on De-NOx Performance and Catalyst Regeneration with Application of Burner in Marine SCR System. In Proceedings of the CIMAC Congress 19, Vancouver, WA, Canada, 10–14 June 2019. [Google Scholar]
- Weltens, H.; Bressler, H.; Terres, F.; Neumaier, H.; Rammoser, D. Optimisation of Catalytic Converter Gas Flow Distribution by CFD Prediction; SAE International: Warrendale, PA, USA, 1993. [Google Scholar]


Disclaimer/Publisher’s Note: The statements, opinions and data contained in all publications are solely those of the individual author(s) and contributor(s) and not of MDPI and/or the editor(s). MDPI and/or the editor(s) disclaim responsibility for any injury to people or property resulting from any ideas, methods, instructions or products referred to in the content. |
© 2026 by the authors. Licensee MDPI, Basel, Switzerland. This article is an open access article distributed under the terms and conditions of the Creative Commons Attribution (CC BY) license.