Abstract
Paint manufacturing wastewater contains complex mixtures of solvents, resins, surfactants, pigments, and polymeric additives that result in high chemical oxygen demand (COD), toxicity, and poor biodegradability. Conventional physicochemical treatment provides limited removal of dissolved organics, and the pollutant-level behavior of paint effluents during biological treatment remains insufficiently characterized. This study addresses this gap by evaluating a sequential anaerobic–aerobic batch process treating three distinct synthetic paint wastewater samples. This study is a comparative investigation of sequential biological treatment across multiple paint wastewater variants, combined with high-resolution LC–MS to track compound-level transformations. Treatment performance was assessed through COD removal, biogas generation, pH and redox behavior, and LC–MS profiling of organic contaminants. The anaerobic stage achieved 70–95% COD removal depending on wastewater type. Aerobic polishing increased overall removal efficiencies, while PWW3 exhibited reduced stability during extended operation. LC–MS analysis showed substantial decreases in the number and intensity of chromatographic peaks and demonstrated degradation of phthalates, glycol ethers, organophosphate plasticizers, and solvent-derived compounds. The study provides integrated performance- and pollutant-level assessment of sequential anaerobic–aerobic treatment of paint wastewater and demonstrates the influences of wastewater heterogeneity in biological degradation pathways.
1. Introduction
Paint waste waters represent one of the most challenging wastewater streams to treat due to their high organic load, chemical complexity, and intrinsic toxicity. Paint manufacturing activities typically generate large quantities of wastewater during pigment dispersion, equipment washing, formulation adjustments, and packing operations. These wastewaters contain heterogeneous mixtures of organic solvents, polymeric resins, surfactants, dispersants, dyes, stabilizers, biocides, plasticizers, heavy metals, and suspended solids [1,2]. The presence of these constituents results in elevated chemical oxygen demand (COD), high total solids, strong coloration, and, in many cases, acute and chronic toxicity to aquatic organisms. When inadequately treated effluents are discharged into surface waters, they cause depletion of dissolved oxygen, formation of toxic intermediates, bioaccumulation of hazardous chemicals, and long-term ecological disruption [3]. These concerns are amplified by the increasing global demand for paints in construction, automotive, infrastructure maintenance, and industrial applications.
The paint industry is inherently water intensive. During manufacturing and equipment cleaning alone, as much as 80% of the generated effluent volume originates from wash water used to remove residual pigments, binders, and additives from mixers, reactors, and filling lines [3]. As a result, paint wastewater is characterized by significant variability in composition, depending on raw materials, operating conditions, and cleaning schedules. The broad diversity of organic and inorganic components makes this wastewater markedly recalcitrant. Conventional removal methods are often insufficient, and disposal without adequate treatment poses a substantial environmental hazard. Sustainable management and treatment of these effluents have therefore become a priority for industries and regulatory bodies alike. With increasing constraints on freshwater availability and stringent discharge norms, developing energy-efficient and robust treatment techniques is essential not only for pollution control but also for promoting water recovery and reuse within the manufacturing cycle [4].
A wide range of physicochemical treatment processes have been applied to paint wastewater, including coagulation–flocculation, adsorption using activated carbon, microfiltration and ultrafiltration, and advanced oxidation processes (AOPs) such as Fenton, ozone, and photocatalysis [5,6]. Coagulation–flocculation is frequently employed as a primary treatment step to remove suspended solids, pigments, binders, and colloidal materials. Although effective for solid–liquid separation, it typically leaves a substantial residual COD due to the persistence of dissolved organic compounds [5,6]. Furthermore, large volumes of sludge are produced, posing additional challenges related to disposal, cost, and secondary pollution.
Advanced oxidation processes are capable of degrading many complex organics through the generation of hydroxyl radicals; however, they are energy-intensive, require chemical dosing, and may generate undesirable by-products [7,8]. Their performance is also highly sensitive to wastewater composition, pH, and the presence of radical scavengers. Membrane-based operations provide excellent separation efficiency but suffer from fouling, high operational costs, and limited effectiveness for low-molecular-weight dissolved organics. Adsorption processes are constrained by adsorbent regeneration costs and rapid saturation when treating high-strength effluents. Overall, these physicochemical treatments struggle to provide complete mineralization of the wide array of organic pollutants present in paint wastewater, highlighting the limitations of single-step treatment strategies [9].
Biological treatment has increasingly emerged as a viable alternative due to its cost-effectiveness, sustainability, and capacity to achieve significant organic matter degradation. However, the toxicity and complex nature of paint effluents can inhibit microbial growth and metabolism, reducing the efficiency of conventional aerobic biological systems. Phenolics, acrylic polymers, phthalates, glycol ethers, and certain solvent-based additives in paint formulations may exert toxic effects, causing loss of biomass activity, reduced biodegradability, and process instability [10,11,12]. To overcome these limitations, sequential anaerobic–aerobic treatment systems have gained attention in recent years for their ability to degrade complex and refractory compounds through complementary microbial pathways [11,13].
In a sequential anaerobic–aerobic system, high-strength wastewater is first subjected to anaerobic digestion, where hydrolytic and methanogenic microorganisms convert a portion of the biodegradable organic load into biogas. Anaerobic digestion is particularly advantageous for concentrated effluents because it requires lower energy input, generates valuable methane, and produces minimal sludge compared to aerobic processes. It also initiates the breakdown of complex macromolecules and reduces COD significantly, thereby decreasing the aeration energy required in subsequent aerobic treatment [11,13]. Following anaerobic digestion, the partially treated wastewater undergoes aerobic oxidation, where facultative and aerobic microorganisms further degrade intermediate metabolites, volatile fatty acids (VFAs), and other compounds not fully processed anaerobically. This two-stage treatment harnesses the strengths of both redox environments, enabling more degradation of recalcitrant compounds and improving effluent quality [6,9]. It has been reported that acidogenic anaerobic sequencing batch reactors can successfully degrade chlorinated aromatic compounds such as 2,4-dichlorophenoxyacetic acid (2,4-D), demonstrating the capability of anaerobic stages to initiate the transformation of persistent organic pollutants prior to further treatment [14].
While COD reduction provides a bulk measure of treatment performance, it does not reveal how specific toxic compounds are degraded, transformed, or persist in the treated effluent. Thus, a deeper understanding of pollutant behavior within sequential treatment systems is essential for assessing environmental risks, optimizing bioprocess performance, and designing complementary polishing technologies.
High-resolution analytical techniques such as liquid chromatography–mass spectrometry (LC–MS) offer powerful capabilities for identifying and tracking individual contaminants in complex wastewater matrices. LC–MS can detect a wide range of polar and nonpolar compounds, including phthalates, organophosphate esters, surfactants, plasticizers, and solvents commonly present in paint wastewater. Recent advances in mass spectrometry, particularly high-resolution quadrupole time-of-flight (QTof) systems, enable accurate mass measurements, structural elucidation, and quantification of degradation products. Integrating LC–MS analysis with biological treatment studies provides valuable insights into pollutant fate, biotransformation pathways, and the persistence of toxic compounds that may escape conventional bulk analyses.
In this context, there is a critical need to evaluate biological treatment processes using paint wastewater streams while simultaneously characterizing pollutant transformation at the molecular level. Such studies can reveal the strengths and limitations of sequential anaerobic–aerobic systems and inform the development of tailored treatment approaches for industrial applications.
The novelty of this work lies in the comparative long-term evaluation of multiple synthetic paint wastewater in a sequential anaerobic–aerobic batch reactor system, combined with semi-quantitative LC–MS-based tracking of pollutant transformation. Unlike studies focusing on single-component synthetic feeds or short-term trials, this work examines how variations in synthetic paint wastewater composition influence reactor stability, biodegradation efficiency, and inhibitory behavior over extended operation.
2. Materials and Methodology
2.1. Sample Preparation
Treatment was conducted using three synthetic paint wastewater variants (PWW1, PWW2, and PWW3) prepared in the laboratory. Base paint materials were obtained from a paint manufacturing facility in Mangalore, Karnataka, India, and subsequently used to formulate synthetic wastewater by controlled dilution with water. The wastewater was not collected as raw industrial effluent; rather, industrial paint samples were used as source material for preparing representative synthetic matrices. The collected paint materials were stored at 4 °C. No pre-treatment such as filtration or settling was applied prior to dilution. The initial undiluted synthetic wastewater exhibited high COD and solids content, consistent with concentrated paint residues.
Table 1 presents the key initial characteristics determined from laboratory tests of the three synthetic paint wastewaters used in the study prior to dilution. Industrial paint wastewater composition can vary significantly based on production schedules, cleaning routines, and dilution with other effluents. To capture this variability, the collected paint wastes which were originally high-strength and viscous were diluted with water at different ratios to create wastewater reflecting a range of discharge scenarios.

Table 1.
Characteristics of undiluted paint wastewater samples used in the study.
2.2. Reactor Set-Up
Four anaerobic and four aerobic reactors were utilised in the experimental study as detailed in Figure 1. Among the four reactors, one was assigned as the control reactor both in the anaerobic and aerobic stages. Three anaerobic reactors (AN1, AN2, and AN3) were mixed with three different paint wastewaters and the control reactor without paint wastewater. Each anaerobic reactor was constructed from a cylindrical glass bottle, 2.5 L total volume, 12 cm diameter and 20 cm height, with a working liquid volume of 2.0 L. The reactors were sealed with rubber corks fitted with gas outlets connected to identical 2.5 L gas-collection bottles filled with water as shown in Figure 1. The biogas which was produced from anaerobic reactors was directed into the gas measuring cylinders for volumetric quantification by water displacement. Thus, the volume of gas produced from the anaerobic reactors was measured using the gas measuring cylinders and was recorded daily.
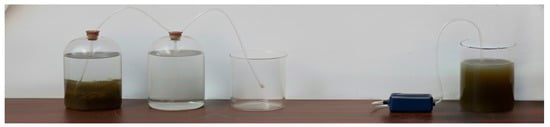
Figure 1.
Experimental setup with a sequential anaerobic and aerobic reactor.
Three aerobic reactors (A1, A2, and A3) were seeded with effluent from the anaerobic reactors AN1, AN2 and AN3 respectively. The fourth control reactor of the aerobic stage was fed from the AN4 anaerobic control reactor. The aerobic reactors consisted of 2.5 L polypropylene beakers of 14 cm diameter × 18 cm height, with a working volume of 2.0 L, run in parallel to the anaerobic units. Each was equipped with a fine-bubble diffuser connected to an air pump to maintain dissolved oxygen higher than 2 mg/L, sufficient for aerobic biodegradation.
The system was operated in sequential batch mode with a 24 h cycle time. Feeding and decanting were performed once daily. After each anaerobic reaction phase, reactors were allowed to settle for 30 min, after which 1.0 L of supernatant was decanted and directly transferred to the corresponding aerobic reactor without intermediate equalization.
In the aerobic reactors, 1.0 L of treated effluent was discarded daily prior to feeding to maintain a constant working volume. The mode of transfer between the anaerobic and aerobic stages was operated in a direct and sequential manner. At the end of each anaerobic reaction cycle, the contents of the anaerobic reactors were allowed to settle for 30 min, after which a defined volume of clarified supernatant was directly transferred to the corresponding aerobic reactors. No intermediate equalization tank, storage step, or holding period was employed between the two stages. Mixing in the anaerobic reactors was achieved primarily through biogas-induced agitation, without mechanical stirring, whereas mixing in the aerobic reactors was provided by continuous aeration supplemented by occasional manual stirring to maintain biomass suspension and uniform conditions. The entire system was operated at ambient laboratory temperature (27–30 °C) without external temperature control or heating. This operational approach ensured a true sequential anaerobic–aerobic configuration and minimized artificial hydraulic or physicochemical alterations between stages.
2.3. Reactor Operation
The anaerobic reactors were seeded with thick anaerobic sludge (250 mL) collected from a Upflow Anaerobic Sludge Bed (UASB) reactor at the Mangalore municipal sewage treatment plant. The aerobic reactors were seeded with activated sludge from the National Institute of Technology Karnataka, Surathkal sewage treatment plant. Seed sludge was rinsed and sieved through a 250 μm mesh before use. The anaerobic sludge had 12,000 mg/L Mixed Liquor Suspended Solids (MLSS), and the aerobic sludge had 3000 to 3200 mg/L MLSS and 2500 mg/L Mixed Liquor Volatile Suspended Solids (MLVSS), providing adequate biomass levels.
Reactors were initially acclimated using a synthetic starch-based feed with 2100 ± 50 mg/L COD supplemented with 1000 mg/L sodium bicarbonate for pH buffering. The feed was enhanced with macronutrients magnesium sulfate (MgSO4·7H2O), ammonium chloride (NH4Cl), potassium dihydrogen phosphate (KH2PO4) and a trace metal solution containing ferric chloride (FeCl3·6H2O), manganese chloride (MnCl2·4H2O), copper chloride (CuCl2·2H2O), zinc chloride (ZnCl2), cobalt chloride (CoCl2·6H2O), nickel chloride (NiCl2·6H2O), sodium molybdate (Na2MoO4·2H2O), and boric acid (H3BO3) to ensure nutrient sufficiency and biological stability [2], all chemicals were of analytical grade and procured from HiMedia Laboratories Pvt. Ltd. (Mumbai, India) and Merck Life Science Pvt. Ltd. (Mumbai, India) to ensure nutrient sufficiency and biological stability. After inoculation, 1 L of the synthetic feed was added, and the anaerobic reactors were sealed; aerobic units were aerated. This process was repeated daily for 15 days, achieving quasi-steady-state conditions with consistent COD removal and biogas production.
Each wastewater variant (PWW1, PWW2, and PWW3) was treated in an independent anaerobic–aerobic reactor pair operated in parallel under identical conditions. In addition, a control reactor pair fed with starch was operated simultaneously. Performance trends reported in the study therefore reflect consistent behavior observed within each dedicated reactor system over the 120-day operational period. The initial COD of the three undiluted paint wastewater taken was determined to be 19,200 mg/L, 15,360 mg/L and 12,480 mg/L, indicating a highly concentrated organic pollutant load. To enable microbial communities, especially anaerobic and aerobic consortia, to gradually adapt to the toxic and complex compounds present in the wastewater, a serial dilution strategy was employed during the startup and acclimatization phase of the reactor. A staged dilution strategy was employed exclusively during the startup and acclimation phase to prevent shock loading from inhibitory paint constituents. Reactors were initially fed with highly diluted synthetic wastewater (1:10,000), followed by gradual increases in influent strength (1:1000; 1:100; and finally 1:10). This approach allowed microbial communities to adapt progressively to increasing concentrations of complex an [15]. Paint manufacturing wastewaters can exhibit wide variability in concentration depending on raw material usage, cleaning frequency, and dilution with process water. To reflect this variability and to avoid microbial shock from inhibitory paint constituents, a staged dilution strategy was employed. The influent concentration was gradually increased from 1:10,000 to 1:10 (v/v). This approach allowed evaluation of reactor response across a broad range of wastewater strengths while facilitating microbial adaptation. The 1:10 dilution represented the highest and most challenging loading condition investigated.
At 1:10 dilution, the wastewater COD approached a more realistic operational load while still being within a tolerable range for acclimated anaerobic or aerobic reactors [16,17,18]. Controlled operational parameters in sequencing batch reactors, such as settling time and biomass retention mechanisms, have been shown to influence microbial selection and reactor stability, supporting the importance of optimized operational strategies during startup and stabilization phases [19]. The microbial consortia have likely developed sufficient enzymatic capacity and resistance to inhibitory compounds, ensuring stable reactor performance and biogas production. This staged approach reflects best practices in literature for treating toxic or high-strength industrial wastewater, where stepwise loading helps in biofilm formation, enzyme induction, and adaptation of microbial community structure [10,13]. Key benefits of this strategy are that it prevents biomass washout or collapse during startup, encourages selective enrichment of resistant microbial strains, reduces lag phase and improves long-term process stability and industrial loading practices in lab-scale studies. At the operational dilution of 1:10, the influent COD concentration to the anaerobic reactors was approximately 2100 mg/L. The reactors were operated in sequential batch mode with a working volume of 2.0 L and a daily exchange volume of 1.0 L per cycle. Based on a 24 h cycle time, the resulting Organic Loading Rate (OLR) was 1050 mg COD/(L·day). This OLR corresponds to the stabilized operational phase and not the initial acclimation period, during which significantly lower influent COD concentrations were applied
The fourth reactor pair served as a control, fed with only starch. Oxidation–Reduction Potential (ORP) was monitored throughout: anaerobic reactors maintained −100 to −250 mV, suitable for methanogenesis, and aerobic reactors ranged from +50 to +200 mV. The system was operated at ambient lab temperature (27–30 °C) without temperature control. Batch settling and decanting ensured biomass retention and prevented sludge washout. No significant foaming was observed.
2.4. Instrumentation and Analytical Methods
The subsequent characterization of the wastewater encompassed essential parameters, and these parameters were measured using established methodologies. All analytical measurements were conducted using standard procedures to ensure data quality and reproducibility. COD was measured by the dichromate closed reflux titrimetric method according to Standard Methods [20], using a Spectroquant TR 420 photometer (Merck Group, Darmstadt, Germany). The pH was measured using a digital pH meter, Eutech Instruments, an instrumentation and analytical equipment brand from Thermo Fisher Scientific, with roots in Singapore., calibrated with pH 4.0, 7.0, and 10.0 buffers. The anaerobic reactor pH was particularly monitored, as maintaining a pH above 6.5 is important for methanogenic activity. Alkalinity was measured on select samples by titration to pH 4.5 with 0.02 N sulfuric acid to ensure sufficient buffering in the anaerobic reactor [20]. The bicarbonate alkalinity helped keep the anaerobic pH in a favorable range (typically observed to stay between 6.8 and 7.4 throughout most of the operation). ORP was measured using a handheld ORP electrode (Thermo Fisher ORP meter, Singapore) to gauge the redox conditions. In anaerobic reactors, ORP values staying between −100 to −220 mV indicated a strong reducing environment conducive to methanogenesis, while the aerobic reactors showed positive ORP values reflecting oxidative conditions. These ORP readings were consistent with expectations and served as a quick diagnostic of reactor health. MLSS and MLVSS were measured to assess biomass concentration in the reactors. MLSS was determined by filtering a known volume of well-mixed reactor sample through a pre-weighed 0.45 μm glass fiber filter, washing with distilled water, drying the filter at 103–105 °C for at least 1 h, and then weighing it after cooling in a desiccator [20].
For MLVSS, the same dried filter was ignited in a muffle furnace at 550 °C for 15–20 min to burn off volatile organic matter, then cooled and weighed again. The weight loss upon ignition represents the volatile suspended solids in the sample. These measurements were performed weekly. Sludge yield and settling were observed qualitatively; the anaerobic sludge was granular and settled well, whereas the aerobic sludge formed lighter flocs but still settled within 30 min at the end of each cycle. Volatile fatty acids (VFAs) in the anaerobic reactor were monitored semi-quantitatively using a titration method.
To assess the transformation of organic contaminants, LC–MS analysis was performed on paint wastewater samples collected before treatment, after anaerobic treatment, and after sequential aerobic treatment.
Prior to LC–MS analysis, samples were diluted with LC–MS–grade water to ensure that signal intensities were within the linear response range of the instrument. Chlorpyrifos (50 μg/L) was added as an internal standard prior to analysis. All samples were filtered through 0.22 μm PTFE syringe filters and analyzed directly without solvent extraction or solid-phase extraction due to the complex and variable nature of the paint wastewater matrix. LC–MS analysis was performed using a Waters Acquity UPLC H-Class Plus system coupled to a Waters Xevo G2-XS Quadrupole Time-of-Flight (QTof) (Waters Corporation, Milford, MA, USA), high-resolution mass spectrometer equipped with electrospray ionization (ESI). Chromatographic separation was achieved on a reverse-phase Bridged-Ethyl Hybrid (BEH) C18 column (2.1 × 100 mm, 1.7 μm) with an injection volume of 5 μL. The mobile phases consisted of water with 0.1% formic acid (A) and acetonitrile with 0.1% formic acid (B), operated at a flow rate of 0.3 mL/min under the following gradient program: 5% B (2 min) → 95% B (20 min) → hold (3 min) → re-equilibrate (3 min). The column temperature was maintained at 40 °C.
The mass spectrometer was operated in positive ESI mode with LockSpray calibration using leucine enkephalin (m/z 556.2771) for real-time mass correction. Source parameters included a capillary voltage of 3.0 kV, source temperature of 120 °C, and desolvation gas flow of 800 L/h at 350 °C. Data were acquired over a mass range of m/z 50–1500 in Mass Spectrometry Elevated Energy (MSE) mode using low collision energy (4 eV) and high collision energy (15–40 eV). Procedural blanks consisting of LC–MS–grade water were analyzed intermittently to assess background contamination and instrument carryover, and no significant carryover was observed between injections. Data processing was performed using MassLynx v4.1 with ChromaLynx and TargetLynx modules. Compounds were tentatively identified based on accurate mass measurement (<5 ppm mass error), retention time, and fragmentation spectra, with comparison to reported literature values [2,17]. Semi-quantitative removal trends were estimated using relative peak area reduction between untreated and treated samples, normalized to chlorpyrifos as an internal standard.
3. Results and Discussions
All three anaerobic reactors transitioned to steady-state conditions within 12–15 days, evidenced by consistent COD removal exceeding 80% for three consecutive days. This adaptation phase is typical of microbial consortia exposed to complex substrates, where initial performance is subdued due to the lag in enzymatic response and biomass acclimatization [14,21].
The sludge volume index (SVI) of the aerobic sludge was 115 mL/g. This falls within the normal range of 100–150 mL/g, indicating dense flocs and effective settling. The specific methanogenic activity (SMA) of the anaerobic sludge was 490 mg COD/(g VSS·day) with acetate as substrate. This was well within typical ranges for acclimated anaerobic biomass (0.2 to 1.0 g COD/(g VSS·day), confirming robust methanogen activity.
Daily MLSS/MLVSS data were monitored to gauge biomass growth. MLSS ranged from 1500 to 5000 mg/L, with MLVSS constituting nearly 1050 to 3000 mg/L of MLSS. In our reactors, MLSS stabilized on the order of 3000 mg/L with MLVSS 2200 mg/L, consistent with strong biomass levels. These concentrations indicate sufficient aerobic biomass to handle the increasing organic loads.
3.1. Anaerobic Reactor Performance
3.1.1. COD Removal Efficiency
From Figure 2, during the initial phase (0–20 days), COD removal progressively increased as anaerobic consortia acclimated to the complex mixture of solvents, acrylic polymers, and plasticizers intrinsic to PWW1. This acclimation period corresponds to the establishment of syntrophic pathways and methanogenic activity, reflected by steadily improving COD conversion trends [15]. From approximately day 20 to day 60, the reactor achieved a stable removal range between 70% and 90%, signifying effective hydrolysis, acidogenesis, and methanogenesis within the anaerobic environment. The consistently negative ORP values (−100 to −220 mV) during this interval confirmed maintenance of strong reductive conditions favorable for methanogenic biomass.
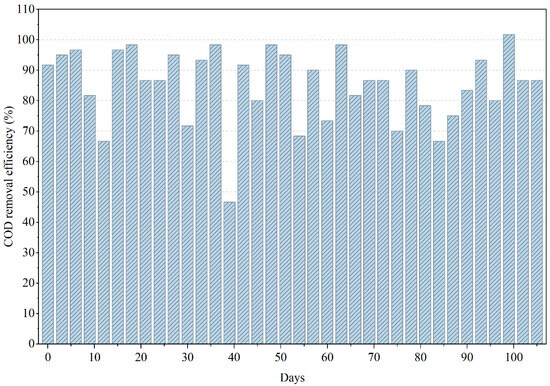
Figure 2.
Variations in COD removal efficiency during the anaerobic treatment of PWW1.
Beyond day 60, the reactor exhibited noticeable fluctuations in COD removal, suggesting transient inhibition events or accumulation of intermediate volatile fatty acids (VFAs). These instabilities are characteristic of anaerobic degradation of paint wastewater, where certain constituents such as phthalates, glycol ether derivatives, and high-molecular-weight additives—exert inhibitory pressure on methanogens when present at elevated concentrations or when biodegradation intermediates accumulate. The slight decline in removal efficiency observed toward the end of the operational period implies that inhibitory metabolites or recalcitrant compounds may have begun to accumulate faster than they were degraded. Such behavior aligns with reported literature on paint effluents, where persistent aromatic compounds slow methanogenesis, occasionally shifting biogas composition toward higher CO2 fractions.
During the initial 15–20 days, the reactor underwent the expected acclimation period, yet COD removal efficiency remained above 55%, indicating that the organic constituents in PWW2 were comparatively less inhibitory to anaerobic metabolism as shown in Figure 3. As the microbial community adapted, removal efficiencies consistently increased and stabilized between 65% and 85%, with peak values approaching 90% around the midpoint of the operational cycle. This stable performance can be attributed to the presence of more oxygenated and moderately biodegradable solvents in PWW2, which favor acidogenesis and methanogenesis. Correspondingly, ORP values remained within the methanogenic range (−150 to −225 mV), confirming a well-maintained anaerobic environment conducive to efficient COD.
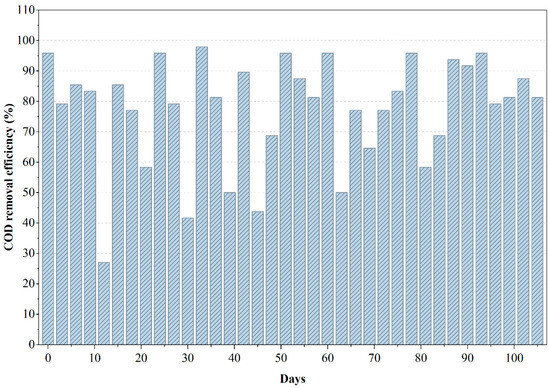
Figure 3.
Variations in COD removal efficiency during the anaerobic treatment of PWW2.
Minor fluctuations observed in the COD removal curve, particularly around days 20, 45, and 80, suggest intermittent shifts in substrate availability or temporary inhibition. However, the rapid recovery following each dip indicates a resilient anaerobic microbial structure capable of re-establishing syntrophic balance. This behavior aligns with reported studies in which wastewaters containing moderate levels of phthalates and oxygenated solvents promote stable but dynamic methanogenic activity [22,23]. The comparatively flatter COD removal profile in PWW2 demonstrates a more uniform biodegradability pattern relative to PWW1, reinforcing the inference that this wastewater matrix contains fewer high-molecular-weight or strongly inhibitory compounds.
From Figure 4, it can be inferred that the COD removal profile of the anaerobic reactor treating PWW3 reveals an initial phase of exceptional performance followed by a progressive decline in treatment efficiency over time. During the first 60 days, COD removal reached values as high as 90–95%, indicating that the microbial community rapidly adapted to the wastewater and effectively degraded the readily biodegradable fraction. This early stability suggests that PWW3 contained a significant proportion of solvent-based organics and low-molecular-weight compounds that anaerobic microbes could metabolize efficiently. However, after this initial high-performance period, the reactor began to exhibit a gradual reduction in COD removal efficiency, signaling functional stress on the microbial system. The sustained decline in COD removal beyond day 90 is indicative of inhibitory compound accumulation or the emergence of toxic by-products that are known to impede methanogenesis in long-term anaerobic operation. PWW3, as later confirmed by LC–MS analysis, contained heavier aromatic fractions, epoxy resin derivatives, and certain phthalate-like compounds that degrade slowly and may exert inhibitory pressure when present in high concentrations. The reduction in COD removal efficiency coincided with signs of acidification, likely driven by volatile fatty acid (VFA) accumulation that surpassed the buffering capacity of the system. Such trends are consistent with literature documenting microbial inhibition in anaerobic reactors treating complex effluents, particularly those with high fractions of solvent-based and aromatic constituents [6,24].
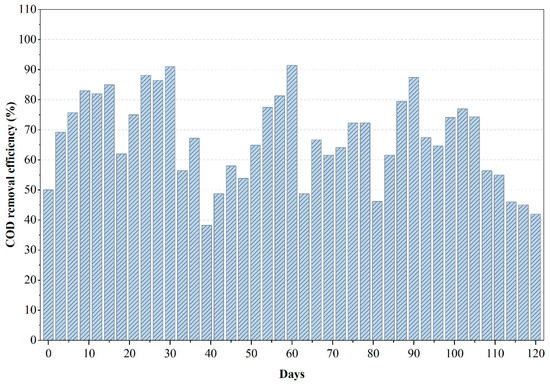
Figure 4.
Variations in COD removal efficiency during the anaerobic treatment of PWW3.
3.1.2. Biogas Production and Methane Yield
Moradi et al. (2023) [15] demonstrated that biochar addition improved methane yields significantly; while we did not use biochar, acclimation likely enhanced our yields similarly. The decline in gas output due to inhibitory buildup mirrors known trends in anaerobic treatment of such effluents [13]. Following the peak in biogas production (Figure 5), the reactor experienced noticeable fluctuations and a gradual decline in gas output, consistent with the inhibitory trends observed in COD removal for PWW1. These irregularities are indicative of potential accumulation of volatile fatty acids (VFAs) or partially degraded intermediates that can suppress methanogenic activity. The presence of high-molecular-weight additives and aromatic constituents in PWW1 may also have contributed to microbial inhibition during extended operation, as such compounds are known to slow methanogenesis or shift gas composition toward a higher CO2 fraction. The decline in biogas production reinforces the sensitivity of anaerobic digestion to toxic or recalcitrant components commonly found in paint wastewater and highlights the importance of sequential aerobic polishing to ensure substantial degradation of the remaining intermediates.
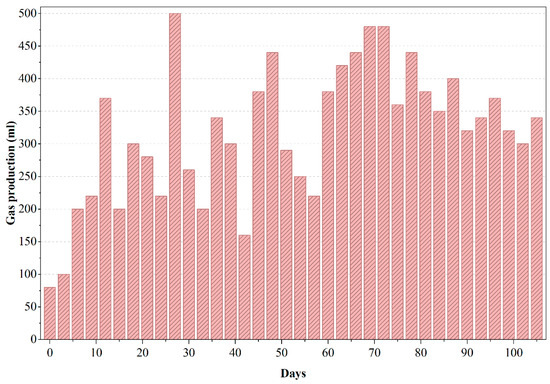
Figure 5.
Gas production of anaerobic reactor treating PWW1.
In Figure 6, PWW2 displayed broader fluctuations (70–98%) with dips on days 20, 45, and 80. The transient nature of these declines suggests a dynamic microbial response to changes in substrate complexity. Such recoveries are commonly observed in aerobic treatment of paint and dye wastewater, where intermediate compounds induce temporary stress [25,26]. PWW3 showed a continuous decline in COD removal from ~95% to ~40% by day 110. This trend strongly implies persistent toxicity or accumulation of recalcitrant compounds. Literature has recorded similar inhibitory effects during prolonged aerobic treatment of solvent-based effluents where oxidant demand outpaces biomass capacity [5,7,27]. Biogas production in the anaerobic phase of PWW2 was slightly lower than for PWW1, and a slight accumulation of volatile fatty acids was noted (indicated by a transient drop in pH to ~6.8).
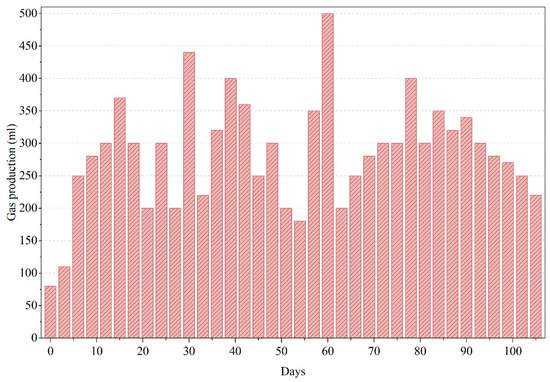
Figure 6.
Gas production of anaerobic reactor treating PWW2.
The system’s alkalinity buffer was sufficient to neutralize this, and pH stabilized as methanogenesis caught up. During the aerobic phase, increased microbial oxidation led to further breakdown of intermediates, eliminating most remaining organics and restoring effluent pH to neutral. Biogas production in the anaerobic reactor was the lowest for PWW3 as shown in Figure 7, and methane yield was suppressed, indicating that a significant portion of the organic carbon was not converted to biogas (probably end up as residual COD or intermediate products). The anaerobic stage experienced a drop in pH to ~6.5 at one point, signaling volatile acid accumulation; this required the addition of buffering to prevent process upset. The system’s response—slower gas production, acid buildup, and need for pH control suggests that certain PWW3 constituents inhibited or slowed anaerobic microbial activity. The overall COD removal efficiency for the system treating PWW3 approached 85%, which is comparable to or better than several physicochemical treatment methods.
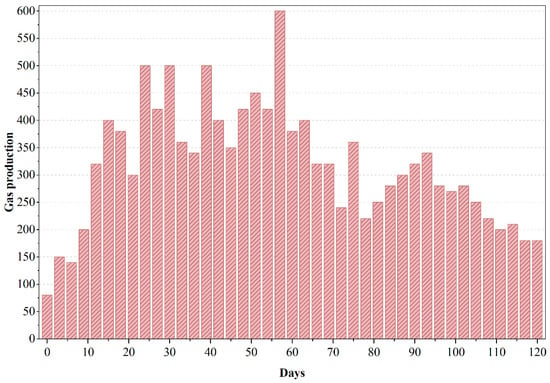
Figure 7.
Gas production of anaerobic reactor treating PWW3.
3.2. Aerobic Reactor Performance
COD Removal Efficiency
The aerobic stage following anaerobic digestion further refined COD removal, with distinct performance patterns across the three paint wastewaters. PWW1 maintained high COD removal efficiency (75–98%) throughout, with minor dips around days 35 and 60, followed by recovery as highlighted in Figure 8. This trend reflects strong resilience of aerobic biomass and sufficient buffering against residual volatile acids or phthalate-like intermediates [8].
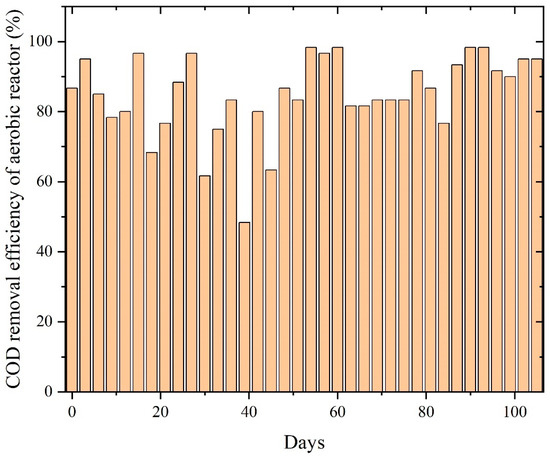
Figure 8.
COD removal efficiency of aerobic reactors treating PWW1.
Minor dips observed around days 35 and 60 correspond to temporary fluctuations likely associated with shifts in influent composition or variations in the concentration of anaerobic metabolites. Nevertheless, the rapid recovery following each dip highlights the resilience and adaptability of the aerobic microbial community. The effective removal of remaining organic fractions—including phthalate fragments, glycol-based solvents, and other oxidizable intermediates—aligns with established mechanisms in which aerobic oxidation complements anaerobic pathways by facilitating ring cleavage, β-oxidation, and complete mineralization. The consistently high COD removal performance observed in Figure 8 confirms that PWW1 is well suited to sequential anaerobic–aerobic treatment and that aerobic polishing is essential for achieving substantial degradation of complex paint wastewater constituents.
The aerobic reactor rapidly improved COD removal as biomass adapted to the effluent characteristics, efficiently oxidizing VFAs, solvent residues, and intermediate compounds originating from the anaerobic stage. Once acclimated, the reactor-maintained COD removal values were largely between 80% and 98%, indicating that PWW2 contains organic fractions amenable to aerobic degradation, as shown in Figure 9. The smooth performance trend, with fewer fluctuations compared to PWW1, suggests that PWW2 possesses a more biodegradable profile and lower concentrations of inhibitory compounds such as aromatic plasticizers or high-molecular-weight additives. The sustained high removal efficiency reflects robust activity of heterotrophic and facultative aerobic microorganisms responsible for the oxidation of organic residues. Although minor and infrequent variations appear in the COD removal curve, the aerobic reactor demonstrated rapid resilience and recovery after each dip, indicating stable microbial health and strong oxygen transfer conditions. These small deviations are likely linked to periodic shifts in the composition of anaerobic effluent or variations in organic loading. However, the consistent return to high performance underscores the suitability of aerobic treatment for polishing PWW2, especially given its composition dominated by oxygenated solvents and moderately complex organics.
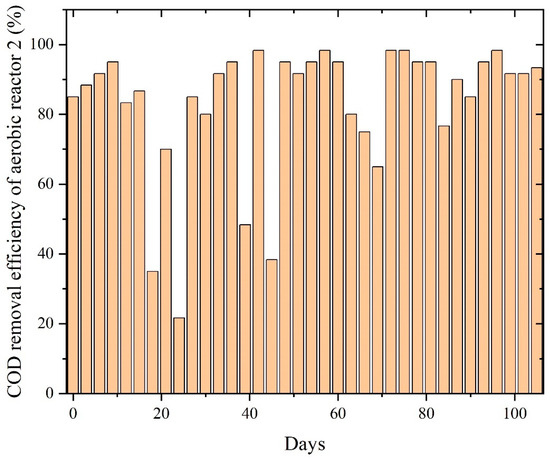
Figure 9.
COD removal efficiency of aerobic reactors treating PWW2.
In Figure 10, the reactor showed moderate COD removal efficiency as the aerobic biomass began oxidizing residual VFAs, solvent-based intermediates, and partially degraded compounds carried over from the anaerobic stage. However, unlike the other wastewater streams, the system did not achieve a stable high-efficiency plateau; instead, COD removal fluctuated widely, ranging from 40% to 98%. These variations reflect the complex and inhibitory nature of PWW3, which contains a higher proportion of solvent-derived organics, aromatic additives, and epoxy resin derivatives that challenge aerobic microbial communities. The absence of a sustained, stable operating window suggests that PWW3’s composition imposed repeated stress on the aerobic biomass, limiting full mineralization.
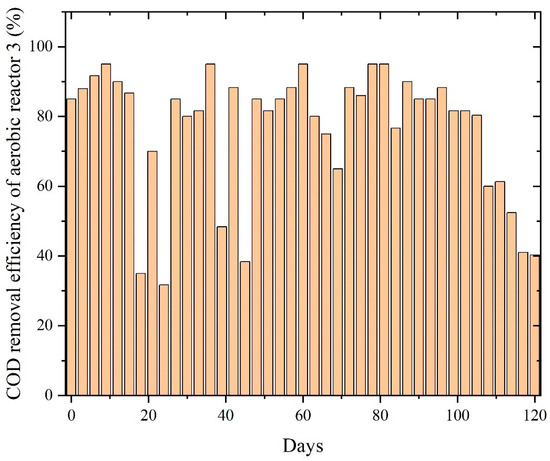
Figure 10.
COD removal efficiency of aerobic reactors treating PWW3.
However, even aerobic bacteria left some fraction undegraded, highlighting the intrinsic resistance of PWW3’s complex compounds to biological attack. These observations concur with reports that paint wastewater with very low biodegradability indices is difficult to fully treat biologically [6]. Toxic or highly stable compounds in PWW3 likely underlie the inhibited performance, a trend also noted in literature, where certain paint effluent components can inhibit treatment processes, introducing concentrated paint shop wastewater to a bioreactor impaired nitrification and slowed overall biodegradation. PWW3’s composition led to lower treatment efficiency, demonstrating the influence of wastewater makeup on the sequential system’s performance [28].
The trends observed for PWW 1, 2 and 3 in our sequential anaerobic–aerobic treatment align with findings from published studies on paint and similar wastewaters, while also highlighting some contrasts. Consistent with our results, prior works have shown that a combined anaerobic followed by aerobic process can achieve high COD removal efficiencies for difficult wastes. For instance, the best-performing case (PWW1, ~93% COD removal) is in line with that of 95–97% COD reduction in treating water-based paint effluent using a biological reactor [2]. Similarly, integrating an anaerobic granular sludge reactor with aerobic biofilm and activated sludge units could attain up to 99% COD removal in recalcitrant paint wastewater, provided that microbes are well-acclimated [6]. These high removals in the literature support the effectiveness of sequential biodegradation approaches, as reflected in our study. As noted above, the anaerobic step often removes only a fraction of the total COD, necessitating an aerobic stage to break down residual compounds
3.3. LC–MS-Based Pollutant Transformation Analysis
The analysis of paint wastewater using LCMS provides valuable insights into the composition of complex mixtures. LCMS analysis of all the paints before and after anaerobic and aerobic treatment gives the effectiveness of the treatment process. The results showed a significant decrease in the number and intensity of peaks in the LCMS graph after treatment. The peaks represent individual organic compounds present in the wastewater. The reduction in peak numbers and intensities indicates the removal or transformation of these compounds during the treatment process. The sequential anaerobic aerobic method substantially reduced some of the organic compounds present in the paint wastewater.
PWW1 exhibited a complex LC–MS chromatographic profile before treatment, with numerous peaks of high intensity indicative of various organic constituents as shown in Figure 11. After sequential treatment, the LC–MS profile showed markedly reduced peak intensities and a lower number of detectable compounds, implying substantial degradation of initial pollutants. PWW1 contained high-molecular-weight organic pollutants, with major peaks detected at 5.28 min, 5.91 min, 10.94 min, 16.20 min, and 22.44 min. The significant m/z values observed in this sample included 279.12, 301.11, 465.27, 644.22, 751.78, 858.56, 1263.80, and 1445.10, indicating the presence of aromatic hydrocarbons, phthalates, and long-chain alkanes. Many high-molecular-weight compounds (above 1000 Da) were resistant to anaerobic degradation, requiring longer retention times or co-metabolism with simpler substrates for effective breakdown.
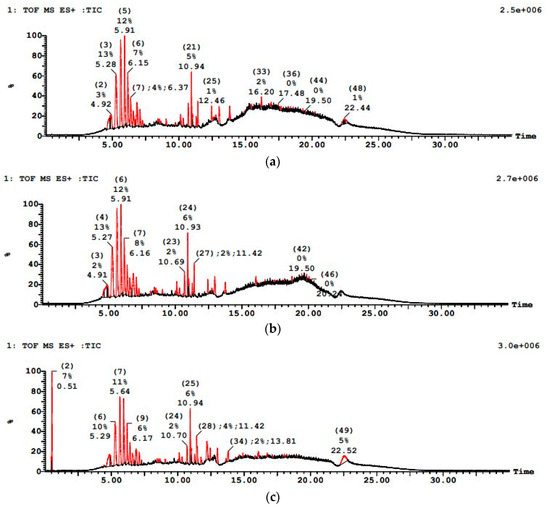
Figure 11.
LCMS graph showing paint wastewater PWW1 (a) before treatment, (b) after anaerobic treatment, and (c) after aerobic treatment.
Figure 12 showed a more resilient contaminant profile initially for PWW2, with LC–MS revealing. The LC–MS chromatogram of treated PWW2 showed significantly lower overall peak intensities and fewer peaks than the raw sample, though a few residual peaks remained. Notably, peaks corresponding to large molecular weight additives were diminished but not entirely eliminated after treatment, suggesting the presence of slowly biodegradable fractions. PWW2 results illustrate that more complex compounds require oxygen-driven processes for substantial degradation. Paint wastewater PWW2 (with a mix of oxygenated solvents and phthalates) showed reduction of its major LC–MS peaks after treatment, whereas PWW1 (which contained heavier additives) still exhibited a few residual peaks corresponding to high-molecular-weight plasticizers.
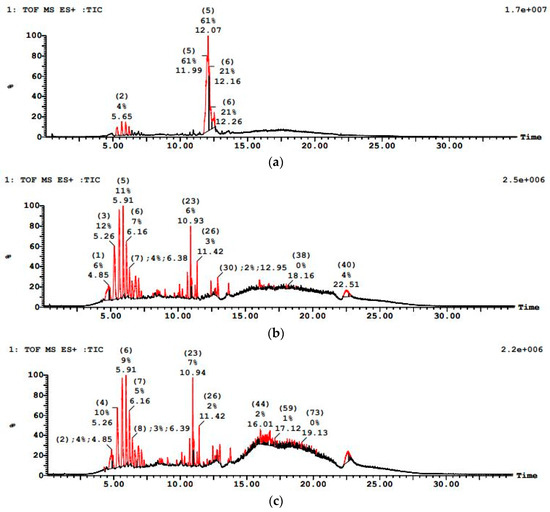
Figure 12.
LCMS graph showing paint wastewater PWW2 (a) before treatment, (b) after anaerobic treatment, and (c) after aerobic treatment.
Observations of minor foaming and a brief adaptation period in the anaerobic reactor for PWW2 suggest the microbial community adjusted to some inhibitory constituents. Nevertheless, the combined process effectively reduced both the COD and the number of LC–MS peaks, indicating that even though PWW2 had a more complex matrix than PWW1, the sequential bioreactor system substantially degraded its organic load. PWW2 exhibited a medium to high organic load, with major peaks at 5.30 min, 5.65 min, 12.07 min, and 12.16 min. The m/z values included 349.2, 183.1, 197.12, 205.11, 393.2, 553.1, 843.3, and 1202.3, representing oxygenated organics and cyclic hydrocarbons. The presence of oxygenated hydrocarbons indicated that this sample would degrade faster than PWW1 under anaerobic conditions, but aerobic oxidation would still be required to break down residual pollutants.
PWW3 wastewater was the most challenging, with an initially dense LC–MS profile (multiple high-intensity peaks) pointing to a complex mixture of heavy and potentially recalcitrant organics as shown in Figure 13. The sequential treatment achieved notable COD reduction, but to a lesser degree compared to PWW1 and PWW2. PWW3 had a higher solvent-based organic load. The sequential anaerobic-aerobic treatment approach significantly reduced COD and organic pollutants. However, the degree of degradation varied among the three paint samples. PWW3 contained a higher concentration of solvents and light organics, with peaks detected at 5.28 min, 5.92 min, 12.06 min, and 12.26 min. Significant m/z values included 142.0, 279.1, 321.1, 445.3, 902.6, 1267.8, and 1463.4, indicating the predominance of solvent-based organic compounds. These were more volatile and easier to degrade, with aerobic treatment playing a key role in breaking down solvent-based residues. A detailed extractables analysis revealed several persistent contaminants in all three samples.
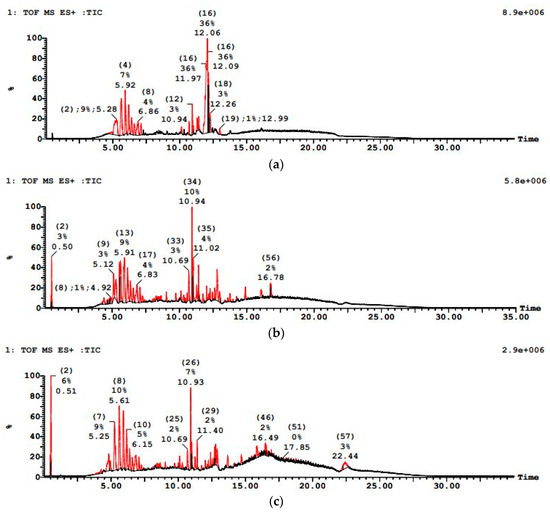
Figure 13.
LCMS graph showing paint wastewater PWW3 (a) before treatment, (b) after anaerobic treatment, and (c) after aerobic treatment.
LC–MS analysis suggested the persistence of specific compounds such as tris(2-butoxyethyl) phosphate and Irgafos 168 even after the sequential anaerobic–aerobic biological treatment, indicating the presence of recalcitrant organics and the need for tertiary processes like advanced oxidation or adsorption [11,29]. Compounds such as phthalate esters, organophosphate plasticizers, and aromatic additives were significantly degraded during the anaerobic–aerobic treatment, whereas a few persistent contaminants remained detectable in the effluent. Among the three wastewaters, PWW3, which contained a higher proportion of solvent-based organics, demonstrated comparatively higher biodegradability. This observation aligns with Moradi et al. (2023) [15], who reported increased methane yields when solvent-based additives were present in automotive paint sludge, suggesting the enhanced bioconversion potential under anaerobic conditions.
Anaerobic digestion alone resulted in only partial degradation of several compounds, as reflected in the LC–MS profiles. Multiple chromatographic peaks, while reduced in intensity, remained detectable post-treatment. This trend was particularly evident in PWW1 and PWW3, indicating the presence of glycol ethers, phthalates, benzoate plasticizers, and other aromatic organics—compounds commonly identified in paint wastewater [29]. Although Paint 3 initially showed high COD and biogas outputs, prolonged operation led to performance decline, possibly due to the accumulation of toxic intermediates. This is consistent with studies that reported microbial inhibition from recalcitrant or toxic organics in concentrated paint sludge [2,28].
The LC–MS chromatograms of the raw effluents contained numerous intense peaks (including high-molecular-weight compounds with m/z up to ~1000–1500), which were markedly diminished after anaerobic digestion and further reduced following aerobic polishing. This pronounced reduction in chromatographic peak number and area, coupled with a shift toward fewer high-m/z signals, could be evidence of biodegradation: larger complex molecules were cleaved into smaller, more biodegradable intermediates that were eventually mineralized to harmless end-products. Implementing LC–MS in this comparative manner across three wastewater types provides insight beyond conventional bulk metrics, revealing how each effluent’s unique mix of compounds responds to treatment—an aspect often overlooked in prior studies that seldom employed such detailed molecular profiling on samples. Notably, despite the broad-spectrum removal of many contaminants, the LC–MS detected a few recalcitrant compounds persisting even after aerobic treatment.
Comparative LC–MS analysis showed a significant reduction in total chromatographic area after aerobic polishing, confirming the breakdown of several high molecular weight compounds. The combined effect of anaerobic hydrolysis and aerobic oxidation facilitated the degradation of phthalates and acrylates into smaller intermediates such as volatile fatty acids (VFAs), which were subsequently metabolized to methane, CO2, and water through acetogenesis and methanogenesis pathways [13,17]. Aerobic oxidation further supported β-oxidation and ring-cleavage of the remaining aromatic and aliphatic intermediates, completing the degradation pathway [2,6]. The use of LC–MS to track pollutant degradation across sequential anaerobic–aerobic stages in multiple paint wastewaters is a unique contribution of this work, providing clear molecular evidence that the combined treatment substantially reduces a wide range of organic contaminants while also flagging the few that survive—insights that advance our understanding beyond what prior studies have reported. Certain compounds such as BADGE derivatives and tris(2-butoxyethyl) phosphate were still detected after treatment, highlighting the need for final-stage interventions [10]. The presence of Solvent Red 1 in PWW1, a known azo dye, supports the use of anaerobic–aerobic treatment for effective degradation, as such dyes undergo azo bond cleavage anaerobically followed by oxidative breakdown in aerobic systems [8].
From a performance standpoint, PWW3, despite having lower initial COD than Paint 1, showed better conversion to biogas and higher final removal efficiency, likely due to fewer inhibitory additives. Conversely, Paint 1 showed slightly lower biogas yield, indicating potential inhibition from phthalates or polyaromatic hydrocarbons (PAHs), a trend previously reported for high-strength effluents [6].
The integrated anaerobic–aerobic setup provided significant operational and environmental benefits. Anaerobic digestion reduced organic load substantially and produced biogas, thereby lowering the aeration demand of the aerobic phase. Peak biogas output in our anaerobic reactor was approximately 550 mL per cycle during stable operation. The anaerobic stage produced significantly less biomass (sludge) per unit of COD removed compared to typical aerobic yields. Specifically, the anaerobic reactors maintained MLSS on the order of ~10–12 g/L without notable sludge wastage over the 120-day run, whereas the aerobic reactors, starting at ~3–4 g/L MLSS, showed an increase in biomass concentration.
The sequential process allowed for the effective breakdown of complex molecules into simpler substrates that were more readily oxidized. Additionally, lower biomass yield in anaerobic stages helped reduce sludge handling costs, supporting a more sustainable sludge management system [11]. The persistence of synthetic additives and plasticizers after biological treatment highlights limitations. These findings indicate the requirement for further polishing steps such as activated carbon adsorption, UV/H2O2 oxidation, or membrane processes to meet discharge standards [2,6]. Although operating a two-reactor system introduces process complexity, its feasibility is enhanced by the low-energy operation of anaerobic reactors and the adaptability of aerobic batch systems. Matrix effects were not explicitly corrected and may influence ionization efficiency; therefore, the LC–MS analysis was used for qualitative identification and semi-quantitative trend evaluation only. Semi-quantitative removal was estimated based on relative peak-area reduction normalized to the internal standard to allow comparison of compound persistence and transformation across treatment stages. No targeted external calibration or absolute quantification was attempted for individual compounds. The reported removals are to be interpreted as relative trends rather than absolute concentrations, given the semi-quantitative nature of the LC–MS analysis. LC–MS analysis provided qualitative and semi-quantitative insight into compound-level transformation trends, rather than definitive compound confirmation or absolute concentration removal.
4. Conclusions
This study evaluated the performance of a sequential anaerobic–aerobic biological treatment system treating three synthetic paint wastewaters formulated to simulate paint effluent characteristics, providing a long-term comparative assessment of COD removal, biogas generation, and pollutant transformation behavior. The work demonstrates how wastewater heterogeneity, particularly differences in solvent content, plasticizers, and resin-derived additives, governs the treatability and long-term reactor behavior. By combining conventional performance metrics with pollutant-level analysis, the study provides one of the most detailed characterizations to date of how paint effluents respond to sequential biological treatment. The findings offer insight not only into biological degradation pathways but also into the inhibitory stress mechanisms that limit mineralization of complex effluents.
- Sequential anaerobic–aerobic treatment achieved high overall COD removal across the three wastewater types, with PWW1 and PWW2 exhibiting highly stable performance, whereas PWW3 showed early success but progressive decline due to inhibitory compound accumulation. Anaerobic digestion removed 70–95% of COD during stable phases, and aerobic polishing contributed an additional 10–20% removal depending on wastewater composition.
- Biogas production confirmed effective anaerobic conversion for PWW1 and PWW2. In contrast, PWW3 showed markedly lower methane recovery and required pH correction, indicating a possibility of inhibition of methanogenesis by solvent-derived aromatics and epoxy resin fragments.
- Aerobic reactors played a critical role in degrading intermediates formed under anaerobic conditions, restoring system stability and driving near-complete oxidation of phthalate fragments and solvent residues in PWW1 and PWW2. However, PWW3’s aerobic reactor experienced wide fluctuations (40–98% COD removal), demonstrating that certain high-molecular-weight additives and aromatic compounds exerted sustained oxidative stress on aerobic biomass.
- LC–MS analysis provided evidence of pollutant transformation, showing substantial reduction in the number and intensity of peaks after sequential treatment. Some compounds were significantly degraded. However, persistent compounds remained detectable, highlighting the presence of recalcitrant fractions resistant to both anaerobic and aerobic biodegradation.
- Wastewater composition influenced reactor stability, biodegradation pathways, and inhibitory stress, with PWW3—rich in solvent-derived and aromatic constituents—showing decline in long-term performance. This emphasizes that while sequential biological treatment is highly effective for most paint wastewaters, effluents containing epoxy resins and heavy plasticizers may require post-treatment such as adsorption, advanced oxidation, or membrane polishing.
The present study confirms that sequential anaerobic–aerobic treatment, when combined with proper acclimation and controlled loading, provides a robust and sustainable solution for managing complex paint manufacturing effluents. The integration of LC–MS analysis validates the biotransformation of major contaminants and offers valuable insight into pollutant-specific degradation behavior. Although a small fraction of recalcitrant additives persisted, the process substantially reduced chemical load, toxicity, and variability, demonstrating strong potential for industrial application. Incorporating targeted tertiary polishing processes would further enhance efficiency and support safe discharge or partial water reuse, advancing sustainability in the paint manufacturing sector.
Author Contributions
Conceptualization, E.S.M. and B.M.; methodology, E.S.M.; writing—original draft preparation, E.S.M.; writing—review and editing, E.S.M.; visu-alization, E.S.M.; supervision, B.M. All authors have read and agreed to the published version of the manuscript.
Funding
This research received no external funding.
Data Availability Statement
The datasets generated and/or analysed during the current study are available from the corresponding author on reasonable request.
Conflicts of Interest
The authors declare no conflict of interest.
References
- Kaur, A.; Vats, S.; Rekhi, S.; Bhardwaj, A.; Goel, J.; Tanwar, R.S.; Gaur, K.K. Physico-chemical analysis of the industrial effluents and their impact on the soil microflora. Procedia Environ. Sci. 2010, 2, 595–599. [Google Scholar] [CrossRef]
- Krithika, D.; Philip, L. Treatment of wastewater from water based paint industries using submerged attached growth reactor. Int. Biodeterior. Biodegrad. 2016, 107, 31–41. [Google Scholar]
- El Shazly, M.A.; Hasanin, E.A.; Kamel, M.M. Appropriate Technology for Industrial Wastewater Treatment of Paint Industry. J. Agric. Environ. Sci 2010, 8, 597–601. [Google Scholar]
- da Silva, L.F.; Barbosa, A.D.; de Paula, H.M.; Romualdo, L.L.; Andrade, L.S. Treatment of paint manufacturing wastewater by coagulation/electrochemical methods: Proposals for disposal and/or reuse of treated water. Water Res. 2016, 101, 467–475. [Google Scholar] [CrossRef]
- Eremektar, G.; Goksen, S.; Babuna, F.; Dogruel, S. Coagulation-flocculation of wastewaters from a water-based paint and allied products industry and its effect on inert COD. J. Environ. Sci. Health-Part A Toxic/Hazard. Subst. Environ. Eng. 2006, 41, 1843–1852. [Google Scholar]
- Show, K.Y.; Ling, M.; Guo, H.; Lee, D.J. Laboratory and full-scale performances of integrated anaerobic granule-aerobic biofilm-activated sludge processes for high strength recalcitrant paint wastewater. Bioresour. Technol. 2020, 310, 123376. [Google Scholar]
- Körbahti, B.K.; Aktaş, N.; Tanyolaç, A. Optimization of electrochemical treatment of industrial paint wastewater with response surface methodology. J. Hazard. Mater. 2007, 148, 83–90. [Google Scholar] [CrossRef]
- Kurt, U.; Avsar, Y.; Talha Gonullu, M. Treatability of water-based paint wastewater with Fenton process in different reactor types. Chemosphere 2006, 64, 1536–1540. [Google Scholar] [CrossRef]
- Bouranene, S.; Sedira, N.; Fievet, P.; Attia, N. Treatment of paint wastewater by coagulation process. Filtr. Sep. 2015, 52, 42–45. [Google Scholar] [CrossRef]
- Mahesh, G.B.; Manu, B. Biological Treatment of 3,6-Dichloro-2-Methoxybenzoic Acid Using Anaerobic-Aerobic Sequential Batch Reactor. Environ. Process. 2019, 6, 493–509. [Google Scholar]
- Mahesh, G.B.; Manu, B. Biodegradation of ametryn and dicamba in a sequential anaerobic-aerobic batch reactor: A case study. Water Pract. Technol. 2019, 14, 423–434. [Google Scholar] [CrossRef]
- Mahesh, G.B.; Manu, B. Removal of ametryn and organic matter from wastewater using sequential anaerobic-aerobic batch reactor: A performance evaluation study. J. Environ. Manag. 2019, 249, 109390. [Google Scholar]
- Jena, J.; Narwade, N.; Das, T.; Dhotre, D.; Sarkar, U.; Souche, Y. Treatment of industrial effluents and assessment of their impact on the structure and function of microbial diversity in a unique Anoxic-Aerobic sequential batch reactor (AnASBR). J. Environ. Manag. 2020, 261, 110241. [Google Scholar] [CrossRef]
- Chin, H.; Elefsiniotis, P.; Singhal, N. Biodegradation of 2,4-dicholophenoxyacetic acid using an acidogenic anaerobic sequencing batch reactor. J. Environ. Eng. Sci. 2005, 4, 57–63. [Google Scholar] [CrossRef]
- Moradi, M.; Sadani, M.; Shahsavani, A.; Bakhshoodeh, R.; Alavi, N. Enhancing anaerobic digestion of automotive paint sludge through biochar addition. Heliyon 2023, 9, e17640. [Google Scholar] [CrossRef]
- Kee, W.C.; Wong, Y.S.; Ong, S.A.; Lutpi, N.A.; Sam, S.T.; Chai, A. Volatile fatty acid (VFA) removal of anaerobically digested molasses wastewater (MWW) in aerobic sequencing batch reactor (SBR) and up-flow aerobic column reactor (UACR) under various hydraulic retention time (HRT). IOP Conf. Ser. Earth Environ. Sci. 2021, 646, 012020. [Google Scholar] [CrossRef]
- Cui, M.H.; Gao, L.; Lee, H.S.; Wang, A.J. Mixed dye wastewater treatment in a bioelectrochemical system-centered process. Bioresour. Technol. 2020, 297, 122420. [Google Scholar] [CrossRef]
- Khan, R.; Bhawana, P.; Fulekar, M.H. Microbial decolorization and degradation of synthetic dyes: A review. Rev. Environ. Sci. Biotechnol. 2013, 12, 75–97. [Google Scholar]
- Qin, L.; Liu, Y.; Tay, J.H. Effect of settling time on aerobic granulation in sequencing batch reactor. Biochem. Eng. J. 2004, 21, 47–52. [Google Scholar] [CrossRef]
- APHA. Standard Methods for the Examination of Water and Wastewater; American Public Health Association: Washington, DC, USA; American Water Works Association: Washington, DC, USA; Water Environment Federation: Washington, DC, USA, 2005. [Google Scholar]
- Dovletoglou, O.; Philippopoulos, C.; Grigoropoulou, H. Coagulation for treatment of paint industry wastewater. J. Environ. Sci. Health-Part A Toxic/Hazard. Subst. Environ. Eng. 2002, 37, 1361–1377. [Google Scholar]
- Datta, A.; Philip, L. Biodegradation of volatile organic compounds from paint industries. Appl. Biochem. Biotechnol. 2012, 167, 564–580. [Google Scholar] [CrossRef]
- Verma, A.K.; Dash, R.R.; Bhunia, P. A review on chemical coagulation/flocculation technologies for removal of colour from textile wastewaters. J. Environ. Manag. 2012, 93, 154–168. [Google Scholar] [CrossRef]
- Tezel, U.; Guven, E.; Erguder, T.H.; Demirer, G.N. Sequential (anaerobic/aerobic) biological treatment of Dalaman SEKA Pulp and Paper Industry effluent. Waste Manag. 2001, 21, 717–724. [Google Scholar] [CrossRef]
- Sabeh, Y.; Narasiah, K.S. Degradation rate of aircraft deicing fluid in a sequential biological reactor. Water Sci. Technol. 1992, 26, 2061–2064. [Google Scholar] [CrossRef]
- Anderson, G.K.; Yang, G. Determination of bicarbonate and total volatile acid concentration in anaerobic digesters using a simple titration. Water Environ. Res. 1992, 64, 53–59. [Google Scholar] [CrossRef]
- Dey, B.; Hashim, M.; Hasan, S.; Gupta, B.S. Microfiltration of water-based paint effluents. Adv. Environ. Res. 2004, 8, 455–466. [Google Scholar] [CrossRef]
- Güven, D.; Hanhan, O.; Aksoy, E.C.; Insel, G.; Çokgör, E. Impact of paint shop decanter effluents on biological treatability of automotive industry wastewater. J. Hazard. Mater. 2017, 330, 61–67. [Google Scholar] [CrossRef]
- Viktoryová, N.; Szarka, A.; Hrouzková, S. Recent Developments and Emerging Trends in Paint Industry Wastewater Treatment Methods. Appl. Sci. 2022, 12, 10678. [Google Scholar] [CrossRef]


Disclaimer/Publisher’s Note: The statements, opinions and data contained in all publications are solely those of the individual author(s) and contributor(s) and not of MDPI and/or the editor(s). MDPI and/or the editor(s) disclaim responsibility for any injury to people or property resulting from any ideas, methods, instructions or products referred to in the content. |
© 2026 by the authors. Licensee MDPI, Basel, Switzerland. This article is an open access article distributed under the terms and conditions of the Creative Commons Attribution (CC BY) license.