1. Introduction
The Centers for Disease Control and Prevention (CDC) estimates that food contaminated by microbial pathogens has caused an estimated 9.9 million human illnesses, from which more than 53,000 people have been hospitalized, and nearly 1000 deaths have occurred; more specifically, 931 deaths have occurred [
1]. Unfortunately, outbreak data summarized by Nazir et al. [
2] showed that foodborne illness from eating contaminated foods is on the rise. To reverse these trends, food processors must redouble their efforts to reduce microbial contamination, much of which comes from exposure to dirty food contact surfaces [
3]. Food-processing facilities follow their written Sanitation Standard Operating Procedures (SSOP) that includes routine environmental monitoring procedures (EMPs) to identify potential sources of microbial contamination and validate the efficacy of prior cleaning and sanitation [
4]. According to the Food Safety Modernization Act [
5], no sampling tool is specified for environmental monitoring regulations, but swabs and sponges are recommended [
6].
Adherence to U.S. Food and Drug Administration (FDA)/ U.S. Department of Agriculture (USDA) regulations and standards is not merely a compliance exercise; it is absolutely essential for minimizing the risks of foodborne illness outbreaks, preventing cross-contamination, enhancing product traceability, and safeguarding consumers’ health while maintaining producers’ brand integrity. These routine risk-reduction programs depend on surface swabbing to accurately assess contamination risks, validate the effectiveness of their SSOP protocols, and ensure the overall safety of the production environment. Effective swabbing is a primary source of data that provides foundational information upon which these controls are built and routinely validated. The high incidence of foodborne illnesses and the documented persistence of pathogenic biofilms have established undeniable and continuous threats. Regulatory bodies have responded by mandating preventative environmental monitoring as a key control measure.
Consequently, the quality and reliability of the swabbing processes dictate the efficacy of the entire proactive safety protocols. This elevates environmental swabbing from a mere procedural task to a cornerstone of public health and industrial safety, where its accuracy directly influences the ability to preemptively identify and mitigate contamination risks through measures like trend analysis and sanitation validation. Despite their widespread and long-standing application, traditional manual swabbing techniques are intrinsically hampered by several critical limitations, including significant human operator-dependent variability, often suboptimal microbial recovery efficiency, and the poor reproducibility of the results [
7]. Such inherent constraints markedly reduce the confidence that should be placed in these contamination monitoring outcomes [
6]. More critically, they elevate the risk of underreporting or mischaracterizing microbial loads on food contact surfaces, potentially leading to false assurances of safety.
The immense variability across surface sampling is due to variability among technicians, low recovery rates, and minimal reproducibility [
8,
9]. A substantial body of research has consistently demonstrated inconsistencies in fundamental swabbing parameters such as the pressure applied by the operator, the angle of the swab relative to the surface, the specific swabbing pattern employed, and overall technique all significantly contribute to errors in sample collection [
10,
11].
USDA/Food Safety and Inspection Service (FSIS) requires that food contact surfaces and equipment in Zone 1 be “clean to sight and touch”, free of visible dirt or residual food, and feel clean and be free of food residues when touched [
12]. Environmental monitoring is usually performed by using swabs or sponges, but this can result in low microbial recoveries, below 2.5 CFU/cm
2 [
13]. Despite their widespread use, swabs and sponges have notable limitations. Swabs are less effective for large or rough surfaces, while sampling contact-type plates are limited to sampling flat areas. Recovery rates can vary depending on surface type, moisture, and the presence of chemical sanitizers, potentially affecting the accuracy of the results [
14]. Therefore, there is a clear need for the development and broader adoption of better tools beyond traditional swabs and sponges to enhance environmental monitoring, particularly for applications requiring higher sensitivity, rapid responses, or coverage of complex surfaces.
From another perspective, many foods supply proteins that contain essential amino acids that humans cannot synthesize in their bodies but must be supplied by the foods we eat. Chickens and eggs provide high-quality proteins that contain the essential amino acids such as tryptophan, tyrosine, and phenylalanine [
15]. The concentrations of these free amino acids in the skeletal muscles of 6-week-old chicks were 0.04 nmol/mg tissue of tryptophan, 0.14 nmol/mg tissue tyrosine, and 0.19 nmol/mg tissue phenylalanine [
16]. These amino acids show natural fluorescence, with the fluorescence of tryptophan being the most prominent [
17].
Beyond performance variability, manual swabbing carries recurring labor and training costs that scale with sampling frequency. Automating swab application can shift a portion of this workload from manual execution to supervised operation. As an order-of-magnitude reference in the U.S. (2025), a collaborative arm with a simple with sensors and basic mounting is on the order of USD 40–50k upfront, based on current vendor list pricing [
18]. Routine maintenance is light and centered on periodic visual/functional checks with a recommended bi-annual service inspection; approved cleaning agents include water, isopropyl alcohol, and dilute ethanol (direct bleach on the bare arm is discouraged) [
19]. Because the arm is IP54, it should be located outside direct wash-down or fitted with a protective cover when harsher sanitation is required [
20,
21]. The control stack described here is robot-agnostic and can be ported to washdown-rated manipulators (IP66–IP69K) commonly used in food plants with minimal changes to kinematic interfaces and I/O wrappers; calibration is repeated once per tool configuration. Operationally, deployment follows standard collaborative-robot practice: perform a risk assessment per ISO 10218 and ISO/TS 15066, complete mounting, connect basic I/O or a PLC, and program via the teach pendant [
22,
23]. No prior robotics background is required for basic operation; operators and technicians can be trained using freely available UR Academy e-learning and a short core course [
24].
By comparison, the fully loaded annual cost of one environmental monitoring technician is approximately USD 85–90k when typical base wages (∼
$59–63 k/year) are adjusted using the Bureau of Labor Statistics Employer Costs for Employee Compensation (wages
, benefits
) [
25,
26,
27]. Thus, the capital outlay for a single robotic swabbing cell is broadly comparable to or less than one technician-year, noting that site-specific integration and safety provisions determine the final total.
The purpose of this preliminary research was to evaluate the feasibility of a more precise robot swabbing method, together with a non-contact fluorescence spectrometer, to detect food soil on typical food contact surfaces for in-plant evaluations and reproducible environmental sampling systems. Combining a rapid soil detection system with a rapid and precise robotic swabbing system could result in a significant improvement in routine cleaning and sanitation as well as producing a plant-wide sanitation validation map for production managers and third-party auditors.
2. Materials and Methods
2.1. Robotic Swabbing
System Overview
This robotic system integrated a Universal Robots UR5e robotic arm
https://www.universal-robots.com/products/ur5e/ (accessed on 23 September 2025) (Universal Robots A/S, Odense, Denmark) with a custom-designed gripper for holding a deformable sponge swab, commonly used in food safety applications (3M, Maplewood, MN, USA). Embedded within the sponge were single-cell waterproof force-sensing resistors (FSR; Sensitronics, Skagit County, WA, USA) that provided a real-time feedback control loop to maintain contact pressure during swabbing. To assess macro-scale coverage, a 10 × 10 cm tactile pad (Shunt Mode Matrix Array, Sensitronics, Skagit County, WA, USA) incorporating a 16 × 16 FSR grid recorded the contact location and pressure distribution across the swabbing trajectory, as shown in
Figure 1.
This dual-sensor setup enabled both micro-level force tracking at the point of the sponge’s contact of the surface and macro-level surface coverage analysis based on previous research [
28]. Each trial began with precisely 1.00 mL of water being applied to the contact detector pad, and the robot executing a predefined zigzag swabbing pattern across the target area. The tactile feedback was essential not only for regulating applied force but also for detecting any missed spots, ensuring complete surface sampling, a limitation frequently observed in human swabbing [
29].
To address the challenges associated with Deformable Tool Manipulation (DTM), the system employed a State-Adaptive Koopman Linear Quadratic Regulator (SA-KLQR) control framework [
28]. This control approach was designed to handle the nonlinear and time-varying dynamics introduced by the deformable nature of the swab and its interaction with variable surface conditions. The SA-KLQR controller linearized the system dynamics using the Koopman operator, enabling optimal control through a Linear Quadratic Regulation (LQR).
The Mentioned controller follows a dual-loop architecture: an inner loop regulates normal contact force to a target band, while an outer loop tracks the zigzag trajectory for uniform area coverage. For deformable tools manipulation, the interaction dynamics are nonlinear and state-dependent [
30]. The robot’s contact-rich dynamics are lifted to a linear representation in an observable space (Koopman framework), enabling optimal state-feedback on the lifted system, with real-time switching among local linear models along the path [
31]. A full derivation and ablation are reported in our prior robotics study [
28]. The brief introduction of the control algorithm are introduced below.
The swab is a soft, wetted tool whose stiffness and contact geometry change with angle, speed, and saturation. This creates interaction dynamics that are nonlinear and that vary along the path. Rather than build a single complex nonlinear model, we learn a set of simple, data-driven linear surrogates in a higher-dimensional “observable” space. In practice, we transform the measured states and inputs into a compact set of features (polynomials plus a few radial-basis functions) and use Extended Dynamic Mode Decomposition to identify how these features evolve from one control step to the next [
32]. The result is a small bank of local linear models that are accurate within their region of operation.
On top of each local model we apply standard linear–quadratic regulation. The feedback law penalizes force error and unnecessary motion, so the controller tracks the coached contact band while avoiding aggressive inputs. An integral term removes steady bias caused by sponge compliance or slow drift. This choice gives predictable behavior with a small number of tuning weights and makes the procedure easy to reproduce across labs [
33]. Because contact properties change as the zigzag progresses, the controller selects the nearest local model online and blends during handover to keep commands smooth. This state-adaptive scheme reduces tool pivoting and maintains uniform contact over the full area.
Two design points make the approach practical. First, all models are identified directly from short calibration logs, which avoids bespoke mechanics models of the swab. Second, only three items need refreshing when the swab material, size, or wetness changes: the short data collection, the local model fit, and the thresholds used by the centroid-based stabilizer. The core tuning rules remain the same. Full derivations and ablation studies for the state-adaptive Koopman LQR controller are provided in our prior technical paper, which this work builds upon [
28].
Section 2.2 explains how the coached force band is obtained from the ADC–force calibration.
The robot dynamically adjusted its end-effector pose and movement to maintain the desired force based on the output of the Analog-to-Digital Converter (ADC), a value determined through preliminary calibration experiments. ADC values are expressed in unitless digital values rather than conventional physical units like volts. In these trials, the contact force was incrementally increased while measuring both liquid recovery and swab deformation. A centroid-based fuzzy force regulation algorithm further refined the control by centering the contact force application and minimizing tool pivoting and distortion. This coordination of tactile sensing, optimal control, and fuzzy regulation leads to uniform swabbing force and enhanced recovery.
2.2. Force–ADC Correlation and Mapping
The unitless ADC readouts from the embedded swab force sensor and from the 16 × 16 tactile pad were mapped to physical force (N) using a bench calibration with a TMS–Pro Advanced Texture Analyzer (Food Technology Corporation, VA, USA) equipped with a NIST-traceable load cell. The analyzer applied a quasi-static ramp from 0 to 20 N over 200 s with a flat plate, while ADC streams from both sensors were logged synchronously.
To account for spatial non-uniformity, per-cell calibration was performed by loading a geometry-controlled footprint and recording the individual cell responses across the 10 cm × 10 cm array. A global mapping was then obtained by taking the median fit across cells and retaining cell-specific correction factors used during post-processing of coverage and pressure maps.
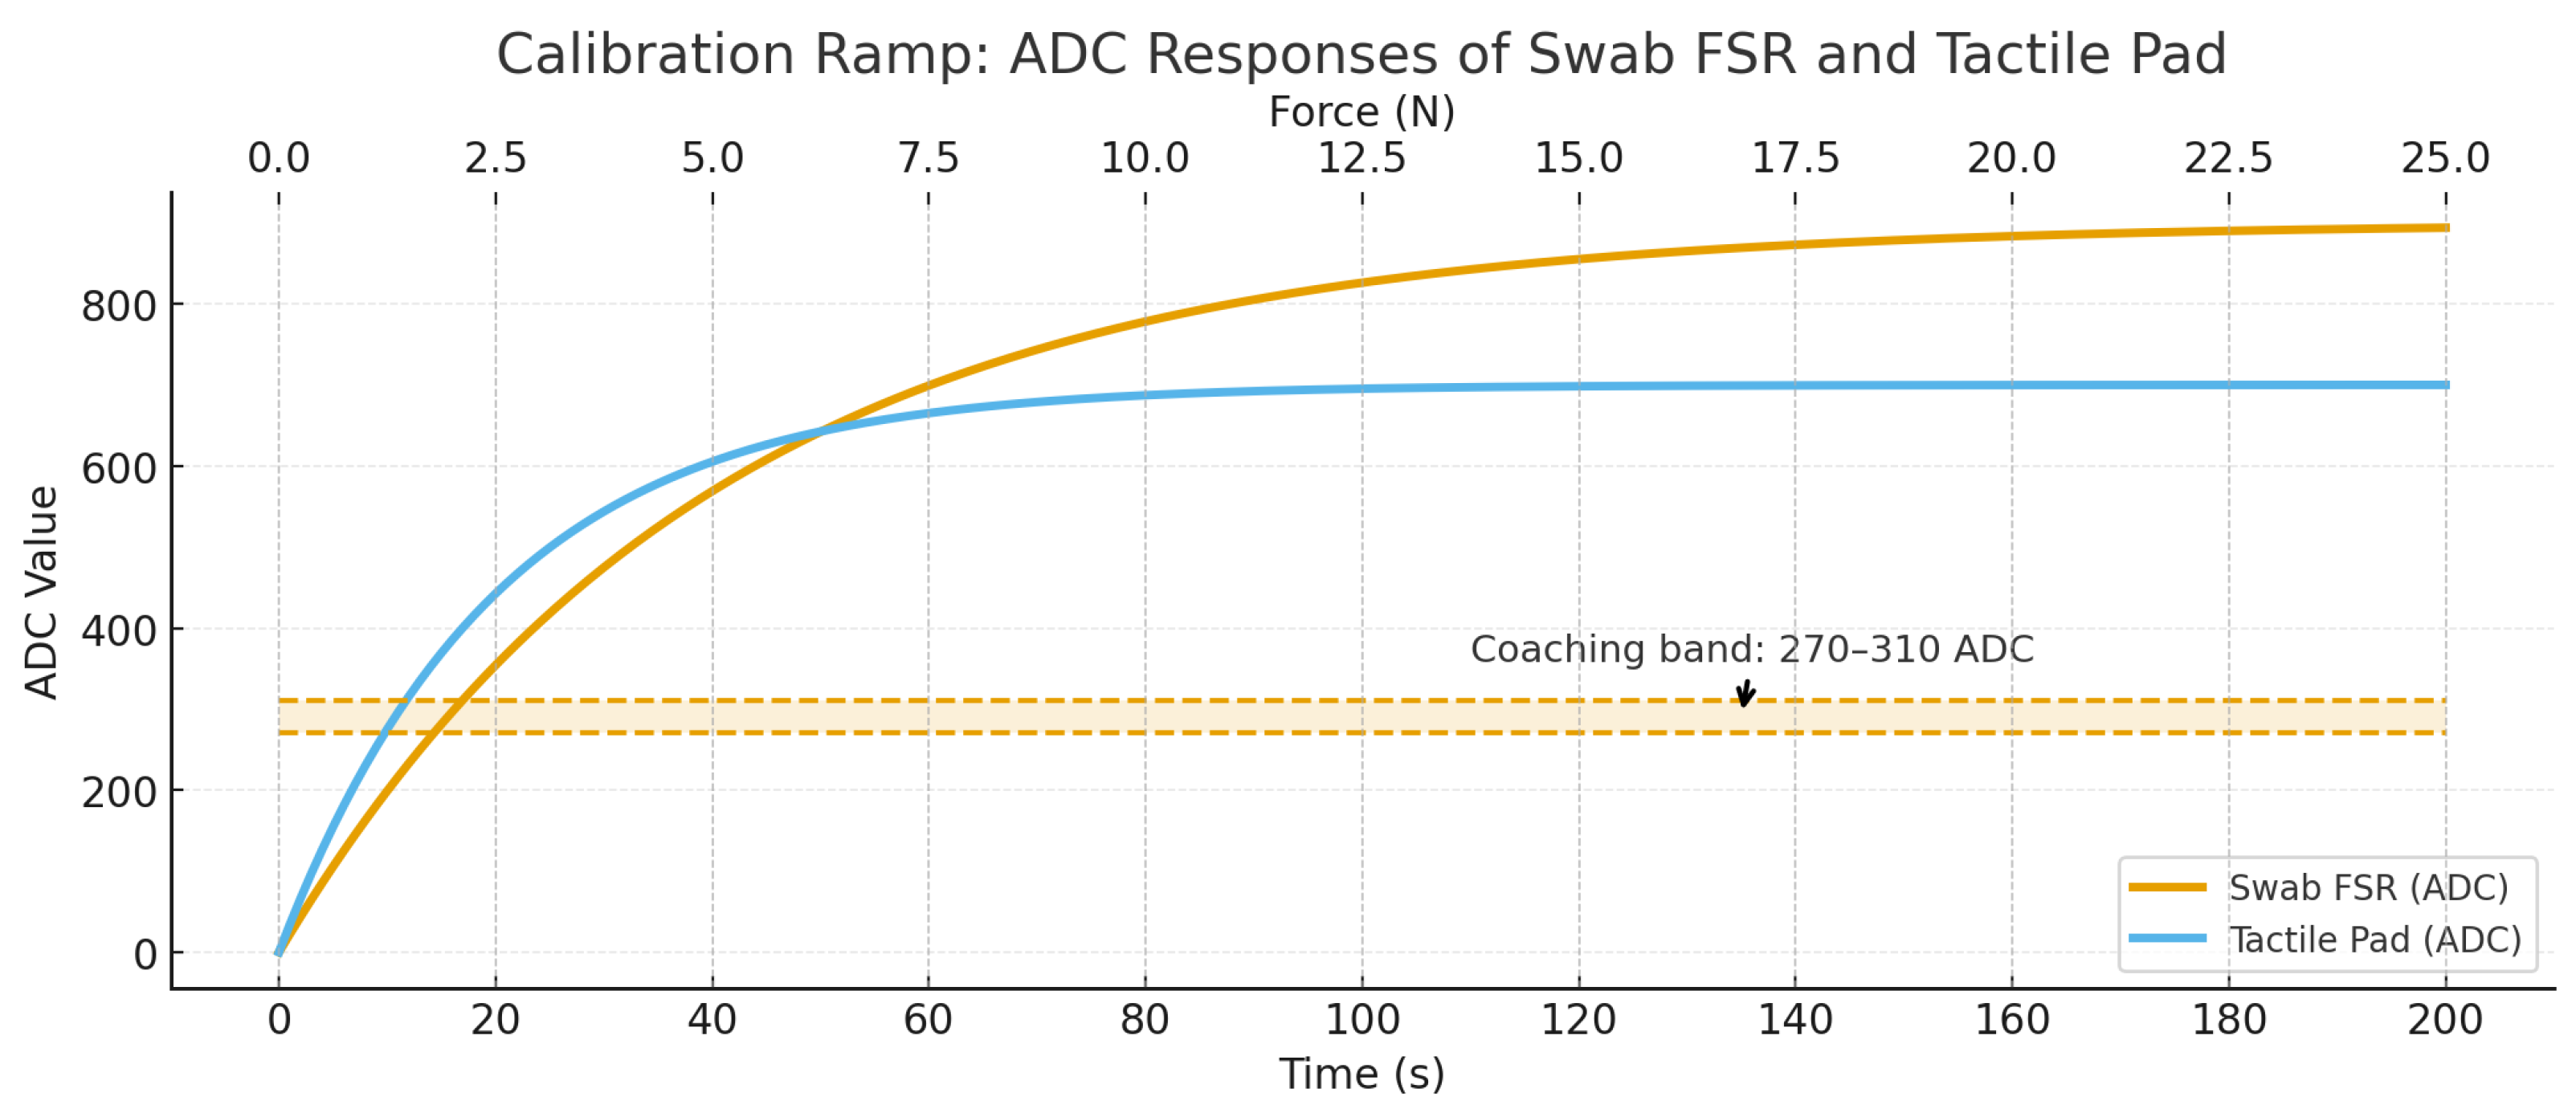
The same 0–20 N ramp was repeated with the sponge swab mounted in the experimental configuration and wetted to the same state used during trials, thereby capturing the compliance and hydration effects of the deformable interface. This calibration produced the reference used to coach participants to maintain the target range of 270–310 ADC.
For both sensors, we fitted a monotone, invertible relation through Equation (
1):
implemented as a shape-constrained (isotonic/piecewise-linear) fit, which accommodates the mild nonlinearity and hysteresis expected in soft contacts. As anticipated, the calibration revealed a low-load under-registration region (preload/creep) and a high-load over-registration region (growth of effective contact area through the wetted sponge). To ensure repeatability in practice, the coaching window of 270–310 ADC was selected from the mid-range of the fitted curve, where the deviation band is minimal and the mapping is most stable to small perturbations.
The tactile pad’s 0.2 N criterion refers to per-cell activation. During swabbing, multiple adjacent cells typically exceed this threshold simultaneously; hence, aggregate surface contact during robot and human trials is substantially above 0.2 N while the swab FSR is maintained within the calibrated 270–310 ADC window.
Before each calibration sequence, the load cell was zeroed and the sensors were equilibrated under no load. Manufacturer-specified load-cell accuracy and ADC quantization were propagated through
to generate the shaded deviation band reported with the calibration curve. Repeated ramps yielded consistent mappings (visual agreement within the deviation band), supporting the robustness of the selected operating window. The full calibration curve and bench setup are shown in
Figure 2.
The tactile pad and the embedded swab FSR exhibit distinct ADC–force trajectories because of their sensor structures and the viscoelastic dynamics of the wetted sponge. The tactile pad is a laminated, shunt-mode matrix in which many microcontacts form in parallel; small normal loads rapidly bridge resistive layers across multiple cells, yielding a comparatively steep low-load response but an early approach to saturation as the microstructures collapse [
34]. In contrast, the swab FSR is a single-element film loaded through a compliant, fluid-saturated sponge. The sponge introduces damping and creep (Kelvin–Voigt–like behavior) [
35], spreading force over time and reducing the effective pressure at the FSR at low loads under-registration [
36]. As load increases, the true contact area and liquid redistribution within the sponge grow, transferring a larger fraction of the normal force to the FSR; this produces the slower initial rise followed by a higher asymptote observed for the swab trace [
37]. The combination of array saturation in the pad and viscoelastic mediation in the sponge explains the earlier plateau of the pad curve and the delayed but ultimately greater ADC values of the swab FSR.
2.2.1. Swabbing Force Regulation and System Calibration
To limit tool pivoting and maintain uniform contact During swabbing, the 16 × 16 tactile pad provides a pressure/force map
over the
area. SA-KLQR controller computes the force-distribution centroid
and its deviation
D from the desired pad center
, using Equation (
2) as below:
In parallel, controller monitors the temporal regularity of the centroid-error signal
using a short sliding-window
Fuzzy Entropy metric [
38], denoted
. When either (i) the centroid deviation exceeds a data-driven threshold
, or (ii) the entropy indicates unstable contact
, the controller applies a small quaternion-based roll-angle correction
and modulates the force command
to re-center contact and suppress pivot-induced deformation. These corrections are bounded by the SA–KLQR weights to preserve the nominal trajectory and force setpoint.
For each swab type (material, size) and wetness condition, we perform a brief single-pass calibration at the target nominal force. In this pass, the robot executes the standard zigzag over the tactile pad while and are logged. From the resulting centroid trajectory, we estimate statistics under stable contact (median and 95th percentile of D) and set the centroid-deviation threshold to the upper bound of this stable range to avoid triggering on quantization or sensor noise. Over the same window, we compute the fuzzy-entropy metric of the centroid-error signal and choose the entropy threshold to detect the onset of irregular contact dynamics. Finally, we refresh the embedded FSR force–ADC mapping at the chosen nominal force to compensate for sponge/handle compliance and fluid uptake. This calibration yields task-specific thresholds without retuning the optimal controller.
At runtime, the centroid regulator runs at the same servo rate as the force loop. When a trigger condition is detected, a bounded corrective action is injected and exponentially decayed back to zero once and , preventing limit cycles while maintaining uniform contact.
2.2.2. Controller Hyperparameters and Reproducibility
The controller parameters fall into five coherent groups: (i) timing and data acquisition, (ii) Koopman lifting and identification, (iii) local-model bank and switching, (iv) optimal regulation weights, and (v) centroid-based contact stabilization. We report not only the settings but also the rule by which they were selected so that the procedure transfers across swab media and surface types.
In timing and data acquisition, the servo-loop frequency
was chosen to exceed the dominant contact bandwidth yet remain within the UR5e real-time budget. Tactile-pad and embedded FSR streams were sampled synchronously and denoised with a short moving window that removes ADC quantization without introducing measurable phase lag. The effective acquisition rates and filter lengths are reported in
Table 1.
Koopman lifting and identification were configured to yield a compact yet predictive surrogate. We used a small observable dictionary
, low-order polynomials augmented with a limited set of radial-basis functions distributed along the planned path, and identified the lifted linear model via EDMD with ridge regularization to suppress overfitting. The lifted dimension
and the EDMD window length were selected by minimizing one-step prediction error on calibration ramps (
Section 2.2), with preference given to the smallest model that preserved stable prediction.
Because contact stiffness and pose coupling vary along the zigzag, we employed a local-model bank with smooth switching. The path was partitioned into regions, each with its own local linear model. At runtime, the controller selects the nearest region in state space with a small hysteresis buffer, and blends commands with factor to avoid discontinuities during transitions. This scheme retains the simplicity of linear feedback while adapting to state-dependent interaction.
Optimal regulation weights were set by validation on scripted contact ramps and uniform swabbing traces. The LQR matrices balance force regulation against pose drift and input effort; we performed a small grid search and selected the pair that minimized force RMSE while avoiding limit cycles. An integral term on force error () was increased until steady-state error was removed without overshoot.
Finally, centroid-based contact stabilization is governed by two thresholds that are derived from a brief, task-specific calibration. The centroid deviation limit is set to the 95th percentile of under stable contact, and the entropy threshold marks the onset of irregular dynamics in the same window. When either trigger fires, small, bounded corrections are injected into the SA–KLQR loop and then exponentially decayed once contact re-centers.
All runtime settings used in this study are summarized in
Table 1; when the swab material, geometry, or wetness changes, the EDMD fit, the small model bank, and the data-driven thresholds
are refreshed, while the selection procedure remains unchanged [
28].
2.3. Fluorescence Spectroscopy for Detecting Protein-Based Contamination
2.3.1. Sample Preparation
Preliminary experiments had shown that a model food soil suspension of raw chicken thigh meat, fat and skin possessed natural fluorescence. Raw bone in chicken thighs were purchased from the local grocery store. Dilutions were created by blending chicken and tap water with a Ninja 72 oz countertop blender (Ninja Professional Blender 1000W 72-oz. BL610, Needham, MA, USA) To determine the limit of detection (LOD), the raw chicken and tap water were tested at multiple dilution ratios (1:10 to 1:100). Gravity separation in a refrigerator at 38 °F was used to settle out the fat particles leaving a more homogeneous solution. After settling, the middle layers of the mixtures were pipetted into 3.5 mL cuvettes and tested using the fluorescence instrument.
2.3.2. Spectral Analysis
The Horiba, Duetta florescence and absorbance spectrometer (
https://www.horiba.com/usa/scientific/products/detail/action/show/Product/duetta-1621/ (accessed on 23 September 2025)) was used to generate excitation and emission fluorescence spectra collected over the range of 240–305 nm, with the strongest emission levels being observed at and excitation 280–290 nm, likely from the naturally occurring tryptophan amino acid residues [
39]. The specifications for measuring the excitation were an excitation range of 240–305 nm, a band pass of 10nm, an integration time of 0.05 s, and 5 detector accumulations. Absorbance measurement specifications included a scan from 230–550 nm with 5 nm step increments, a 0.01 s integration time, and a 2 nm band pass. For the absorbance measurements, a blank of tap water was used before sample measurements were taken; software supplied with the instrument was used to record and analyze the absorbance and fluorescence spectra.
The fluorescence and absorbance spectrometer specifications include a fluorescence intensity of water Raman SNR > 6000: 1 RMS, 350 nm excitation, and 5 nm silts. A CDD/spectrograph and 75 W Xenon arc lamp was used. For the EzSpec software, a Windows 10 or 11 64 bit OS laptop or PC with 1 USB port is required. Fluorescence and absorbance values of tap water and chicken soil dilutions (1:25, 1:50, and 1:100) were compared using the spectrometer. All statistical analysis was completed in R [
40]. Group comparisons were tested using pairwise Tukey’s Honest Significant Difference (HSD) tests with a significance level of
p < 0.05.
The selection of dilution was based on using our senses of following USDA guidelines of clean to sight and touch. The limit of detection for human sensory perception in a laboratory setting was a 1:50 dilution. Chicken-processing plants are dark, wet, that can potentially limit human sensory abilities, causing an even higher limit of detection [
41].
2.4. Segregation and Cross-Contamination Controls
To manage cross-contamination between the non-contact fluorescence measurements and the robot-assisted contact swabbing, we separated workflows and used single-use consumables with validated sanitation. Fluorescence/absorbance readings were taken on a bench-top spectrometer using sealed cuvettes; no poultry dilutions or open vessels were present in the robot area [
42]. Swabbing media were single-use sterile sponges mounted in a cleanable or autoclave-compatible holder, and the holder plus any contact surfaces were sanitized between sites with facility-approved agents. To integrate fluorescence with robotic swabbing, the collected sample was expressed from the sponge into a sterile bag, transferred to a sterile tube, and then pipetted into a UV-transparent cuvette for measurement. These controls align with ISO surface-sampling practice and regulatory expectations for CGMP sanitation and preventive controls [
42,
43,
44,
45].
2.5. Experimental Design: Robotic and Human Swabbing
This experiment compared human versus robotic swabbing efficiency in a side-by-side environmental sampling task, evaluating three performance metrics—water pickup efficiency, surface coverage consistency, and pressure uniformity—to test the hypothesis that the robot’s contact force-feedback control loop would yield more reliable results than either the untrained or trained human operators.
- A.
Human Swabbing Procedure
Ten human volunteers each performed six swabbing trials: three conducted as untrained operators, followed by three additional trials after standardized training. The study protocol was reviewed and approved by the University Human Subjects Institutional Review Board (Approval No. 2406545996).
For the untrained trials, exactly 1 mL of water was pipetted onto a 10 × 10 cm tactile pad using a calibrated volumetric pipette (Socorex Acura E-25, Ecublens, Switzerland). Each 3M sponge was weighed in its dry state on an analytical balance (Sartorius Balance, Göttingen, Germany) to four decimal places, and then reweighed following completion of each swabbing trial. Participants were instructed simply to “swab the surface with this 3M sponge in any zigzag pattern you choose.” Each volunteer completed three consecutive swabs under these untrained conditions.
Following the initial trials, participants underwent a 15-min standardized training protocol. Training began with a visual demonstration in the form of a video showing the ideal zigzag swabbing pattern, including complete coverage of the tactile pad with approximately 5 mm lateral overlap between passes [
46]. This was followed by guided hands-on practice using a dry tactile pad, during which the experimenter provided real-time feedback on maintaining the correct angle (45° relative to the surface), swabbing speed (2 cm/s), and applied pressure, the latter demonstrated using a hand-held force gauge. To further reinforce pressure control, participants observed a live display of ADC force sensor readings and were coached to maintain the sponge force within the target range of 270–310 ADC.
After completing training, each participant performed three additional swabbing trials under identical conditions to the untrained sessions, with the exception that they were instructed to apply the trained zigzag pattern while adhering to the specified angle, speed, and target pressure range.
- B.
Robotic Swabbing Procedure
The robotic setup in
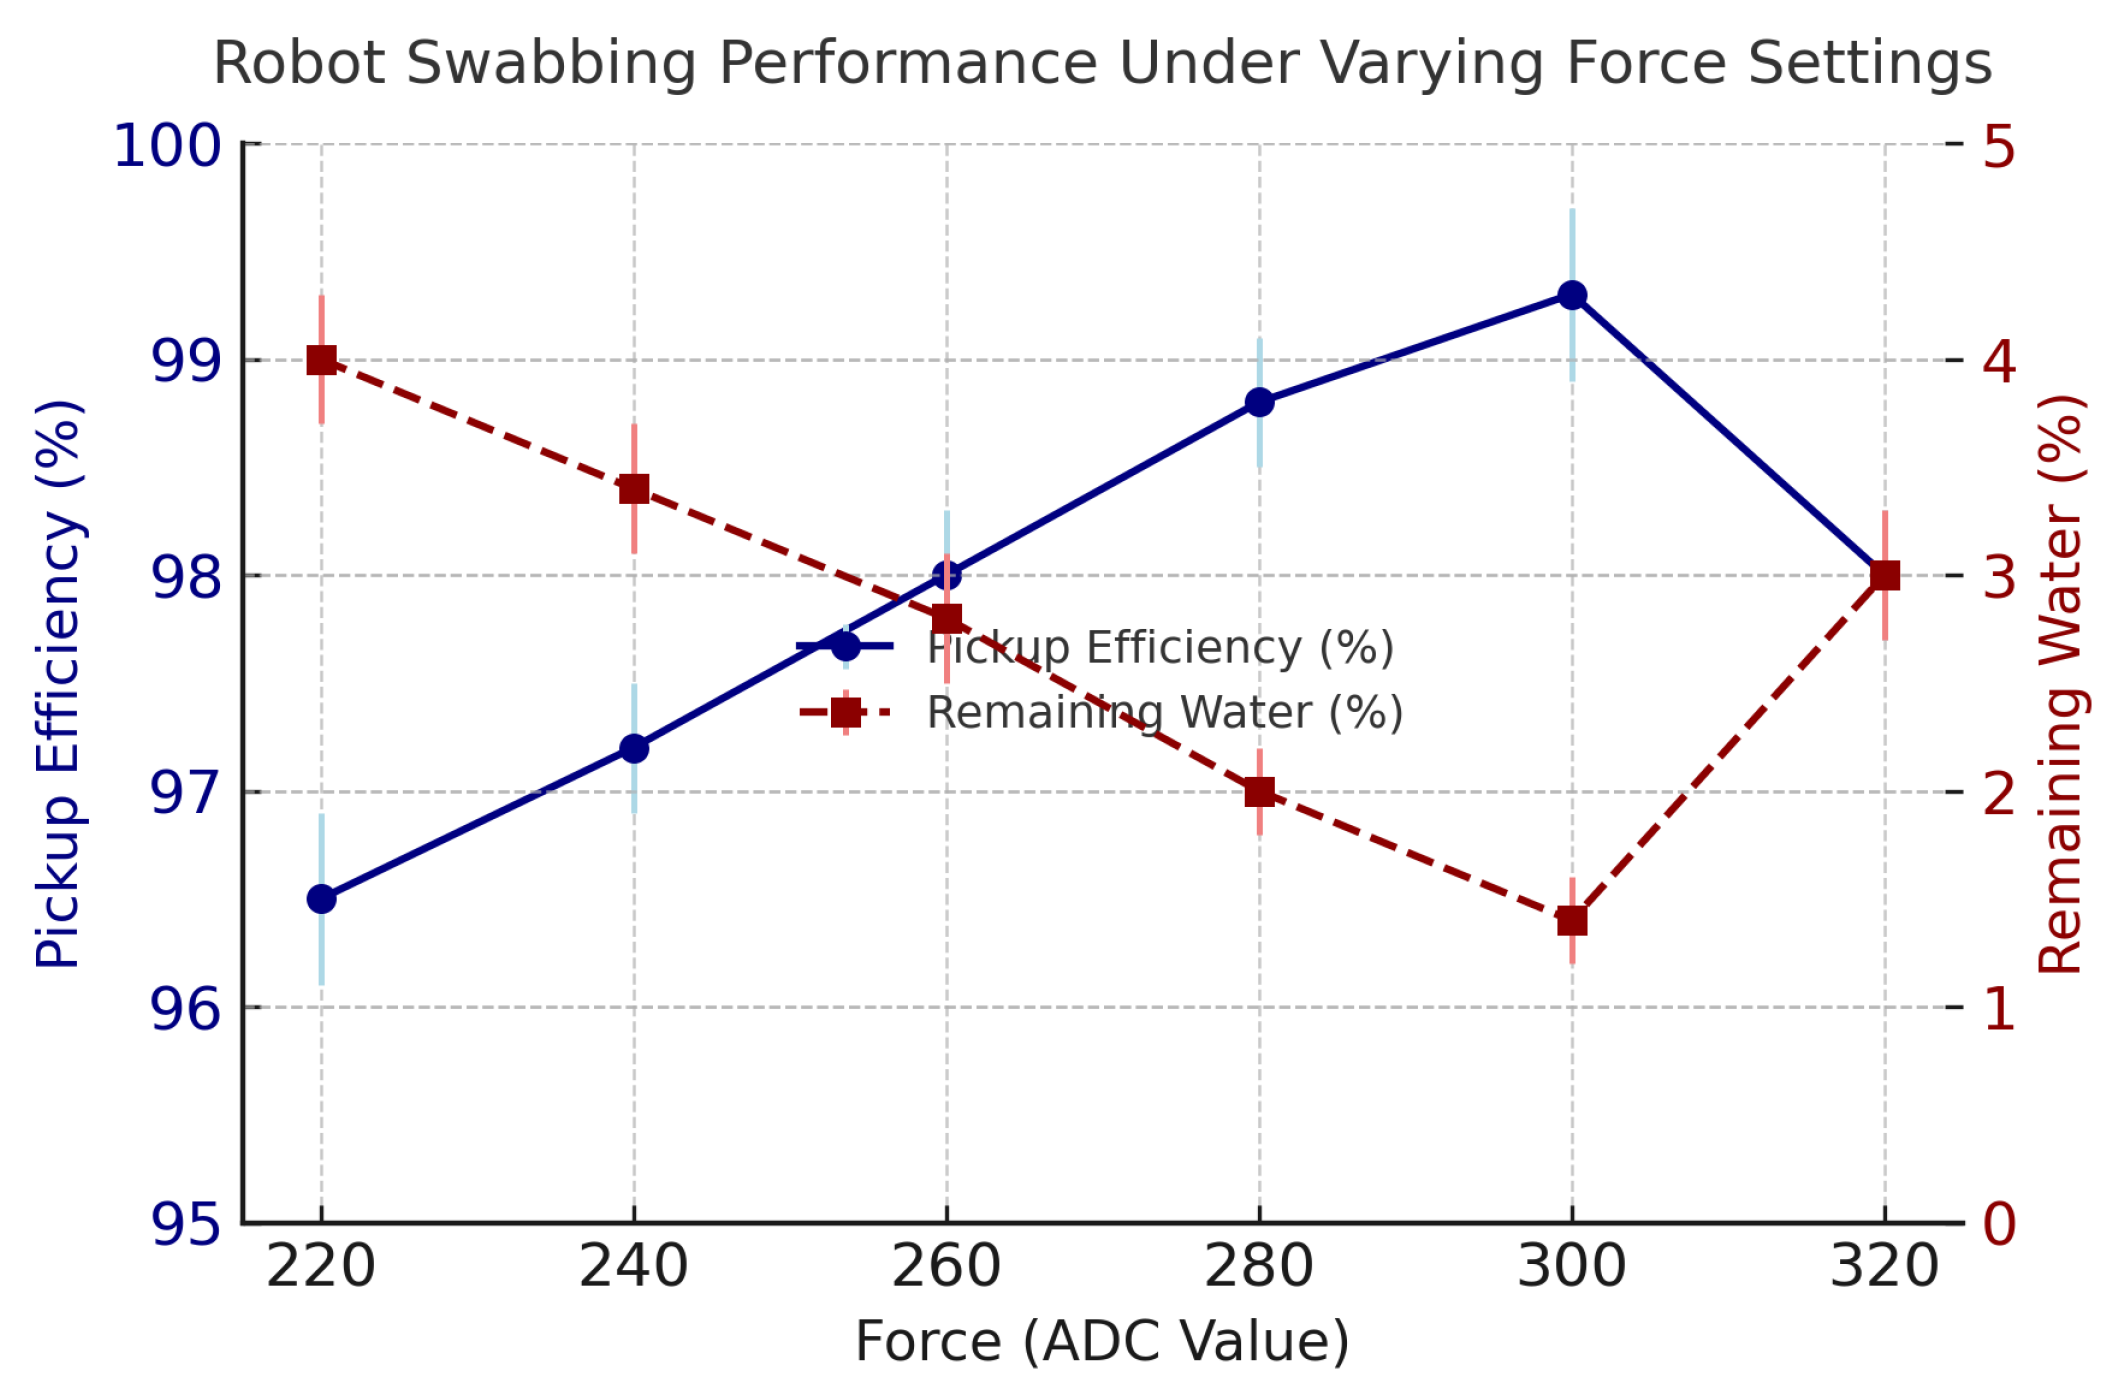
Section 2.1 executed swabbing tasks using the optimized trajectory while maintaining the optimal contact force using the force-feedback control loop. Initially, the robot performed five preliminary swabbing trials using different force values represented by ADC readings ranging from 220–320 to identify the optimal swabbing pressure. The ADC value of 300 was determined to yield the best water pickup and most uniform contact across the sensor pad. Three additional swabbing trials were then conducted under this optimized configuration. The robot performed multiple swabbing trials using a force-controlled UR5e arm with real-time feedback from an embedded FSR sensor. The ideal setting was established at 300 ADC, after which the robot conducted three final trials under this optimized configuration.
Figure 3 illustrates the robot’s swabbing performance under six different applied forces, represented as ADC values ranging from 220 to 320. Each force setting was tested in triplicate, and the plot displays both pickup efficiency and remaining water percentage, along with error bars reflecting standard deviation about the mean.
Evaluation Metrics and Statistical Analysis
Swabbing performance was assessed using three quantitative metrics: water pickup efficiency, surface coverage, and pressure consistency. These parameters were selected to capture both the effectiveness and reproducibility of sampling, which are essential for environmental monitoring in food safety applications. Water pickup efficiency (%) was calculated as Equation (
3):
where
and
represent sponge mass after and before swabbing, respectively, measured using a calibrated analytical balance (Sartorius, Göttingen, Germany; readability: 0.0001 g). The 1 mL applied water mass was corrected for ambient temperature density variations, verified prior to trials using a NIST-traceable reference weight. Each swabbing condition was tested in triplicate per participant/robot trial to ensure statistical robustness.
Surface coverage was quantified with a
tactile pad segmented into discrete sensing cells. A cell was marked
activated when contact pressure exceeded
N; clusters of non-activated cells were interpreted as missed zones due to insufficient force or poor technique. Coverage was computed as
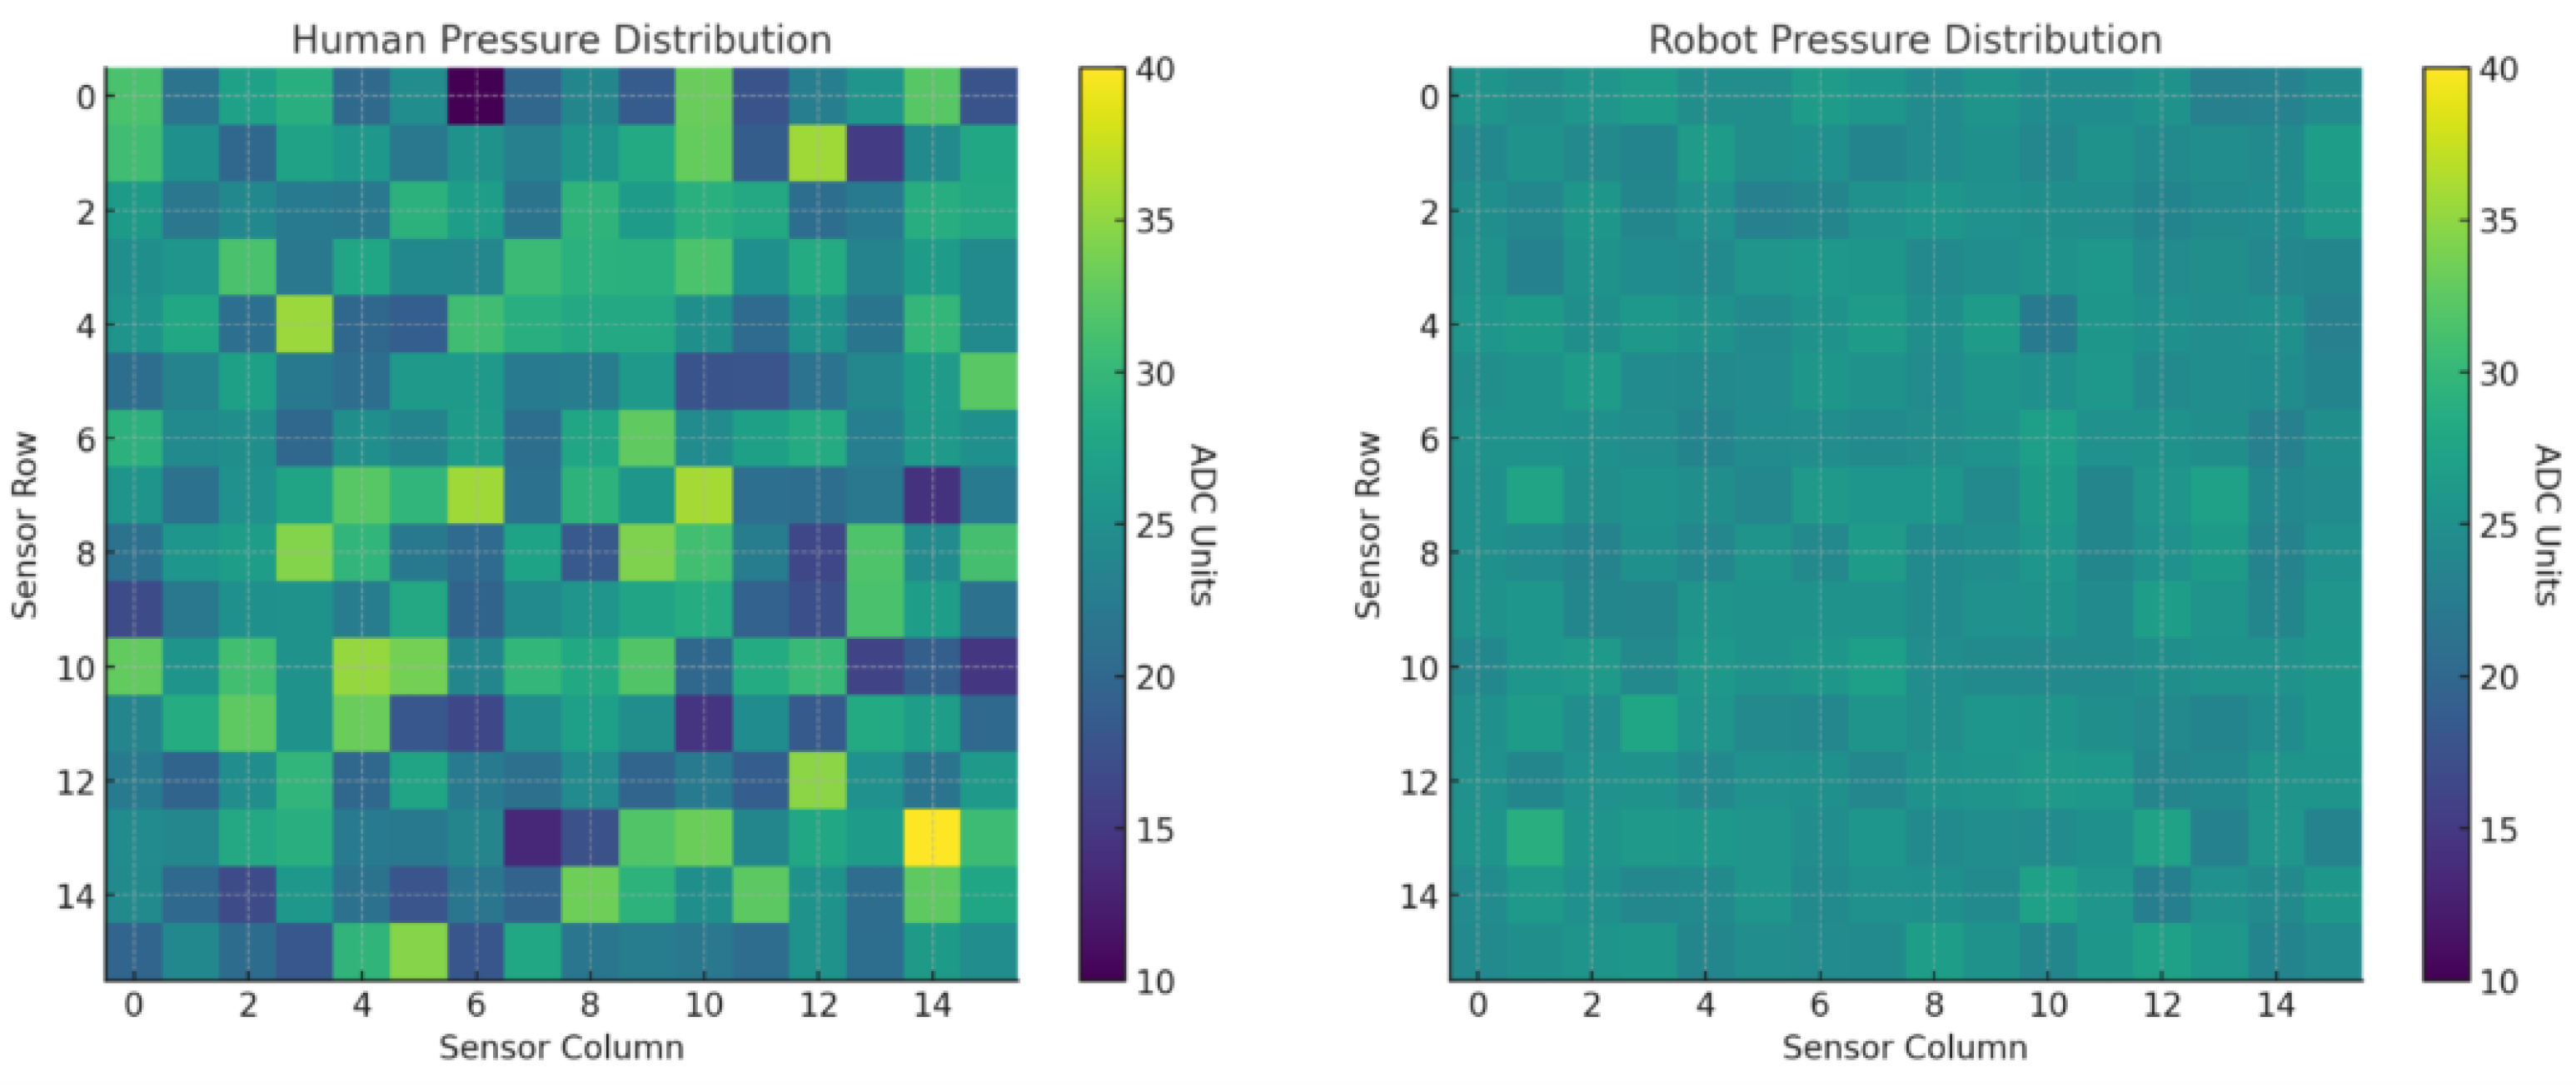
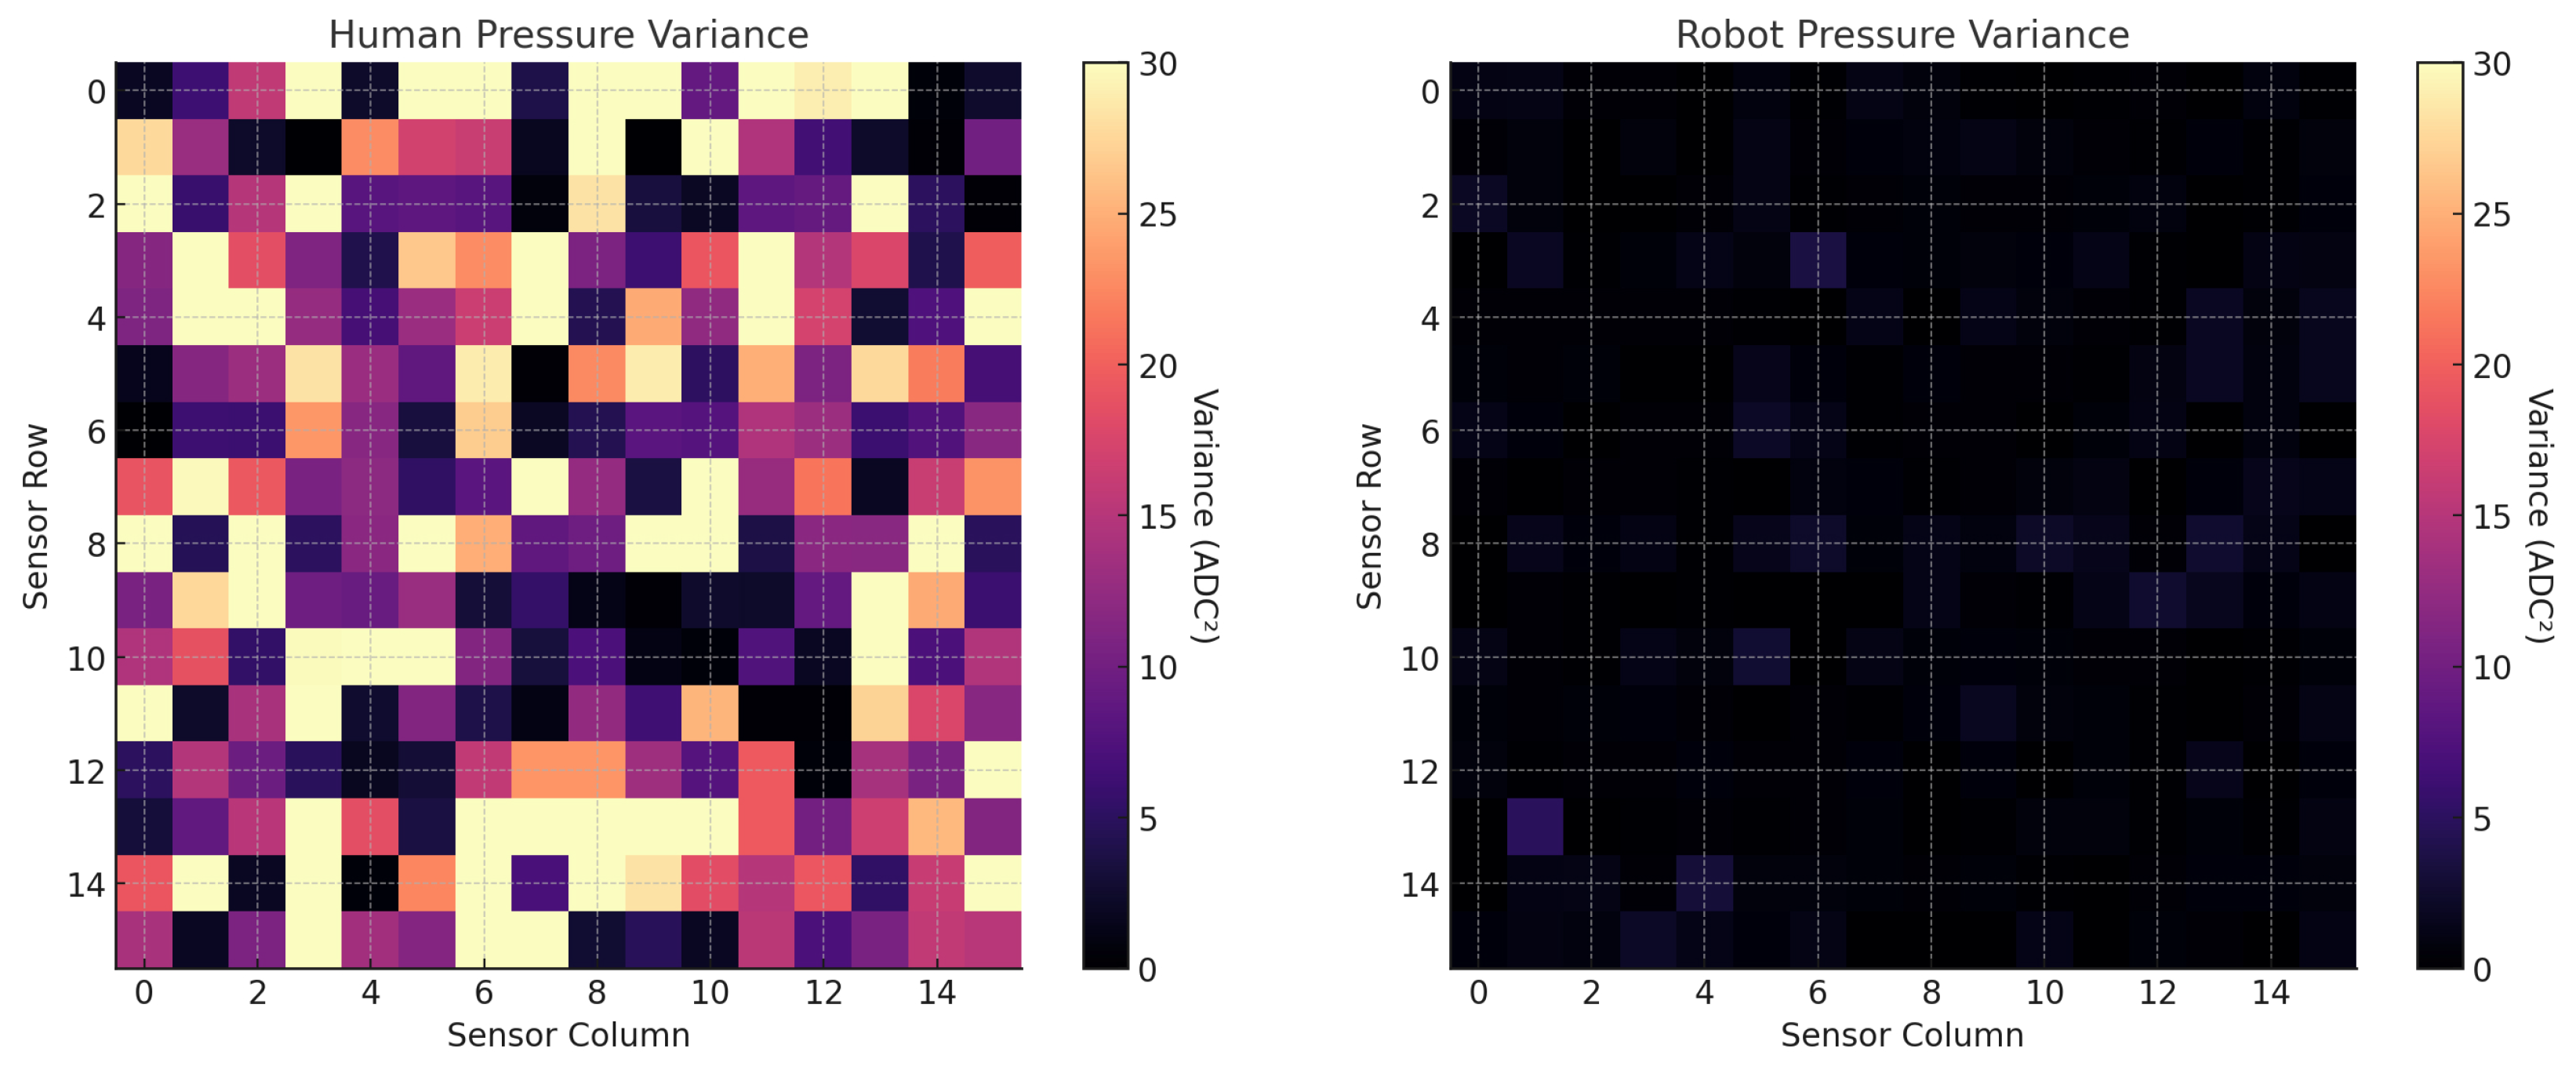
Raw recordings were processed in MATLAB (R2024a, MathWorks) to generate: (i) spatial heat maps of activation that visualize uniform versus incomplete contact; (ii) temporal activation profiles that track sequence and dwell; and (iii) automated flags for uneven force or systematically missed areas, enabling qualitative and quantitative assessment across replicates.
Pressure consistency was evaluated from the same pad data using two-dimensional pressure heat maps and by summarizing the distribution of applied pressure across trials. For each participant/condition, we calculated dispersion metrics (SD, variance) as indices of force uniformity, which is critical for reproducible sampling and effective residue recovery.
All analyses were conducted in R (v4.3.0) and MATLAB (R2024a). Assumptions were checked with Shapiro–Wilk (normality) and Levene’s test (homogeneity of variance). Within-subject comparisons (untrained vs. trained) used paired t-tests and, where repeated trials were modeled jointly, repeated-measures ANOVA. Between-group comparisons (robot vs. human means) used independent t-tests and one-way ANOVA as appropriate. When multiple group comparisons were performed, Tukey’s HSD controlled familywise error. Statistical significance was defined as two-sided . Unless stated otherwise, p denotes a two-sided p-value for the specified test; for multiple comparisons, we report Tukey-adjusted values as .
To complement
p-values, effect sizes are reported alongside all tests. For
t-tests, we report Cohen’s
d (Hedges’
g with 95% CIs for pairwise Tukey contrasts). For ANOVA, we report eta-squared and omega-squared for one-way designs, and partial eta-squared for multi-factor or blocked designs shown in Equations (
4) and (
5) as below:
where appropriate, for unbalanced/mixed designs we also note generalized eta-squared
[
47]. Confidence intervals (95%) for
/
were obtained via the noncentral-
F method [
48], or by bootstrap (10,000 resamples) when assumptions were marginal. Interpretive benchmarks follow [
49,
50].
Instrumental uncertainties from the analytical balance ( mg) and tactile pad ( N) were propagated only to quantify the instrumentation floor for single-trial derived measures (pickup efficiency, coverage); inferential tests used replicate variability, not these propagated errors. Results are reported as mean ± SD unless stated otherwise.
4. Limitations and Future Work
This study demonstrates the clear advantages of the force-controlled robotic swabbing system and the fluorescence-based chicken soil detection. However, several limitations should be acknowledged. First, the experiments were conducted under controlled laboratory settings using standardized surfaces and model protein soils. Although these conditions enabled precise performance comparisons between human and robotic swabbing, they may not fully represent the variability and complexities of real-world food processing environments, where surface geometries, contamination types, and environmental conditions can differ substantially. Second, the contamination sample, diluted poultry protein, does not encompass the full spectrum of potential soil types, including fatty residues, starches, biofilms, or microbial loads that may interact differently with both swabbing and fluorescence detection. Finally, the economic feasibility and cleaning requirements of deploying robotic swabbing systems in commercial plants were not evaluated and may influence industry adoption.
Future research will validate the integrated swabbing–fluorescence system under industrial production conditions, including high-moisture, high-particulate, temperature/flow variability, and diverse sanitizer residues. A fieldable implementation is underway in which the end-effector and detector are mounted on a mobile autonomous robot (AMR) with a collaborative manipulator to navigate to mapped sampling sites, estimate surface normals, and maintain the coached contact band via the centroid-based regulator. In situ calibration (force–ADC mapping and fluorescence background) and hygienic design with scripted swab changeover will be evaluated to control cross-contamination between sites.
Analytically, we will extend beyond proteinaceous residue to include microbial indicators, priority allergens, and selected chemical contaminants, with matrix-effect compensation and on-site LOD/LOQ verification on plant substrates. Results will be compared head-to-head with plant screening tools (ATP bioluminescence and protein color tests) and, where feasible, with standard microbiological assays collected in parallel.
From a systems standpoint, integration with plant automation and quality systems (e.g., digital records, dashboards, and trend analysis) will enable real-time verification and automated corrective-action triggers. Engineering work will explore modular, washable end-effectors for varied surface geometries, automated consumable handling, and adaptive trajectory planning using machine-learning controllers that adjust coverage based on tactile/fluorescence feedback.
Finally, we will quantify total cost of ownership through cost–benefit and lifecycle maintenance studies (reliability, uptime, calibration drift), and perform multi-week sanitation validation to establish long-term practicality and return on investment for large-scale food production facilities.
5. Discussion and Conclusions
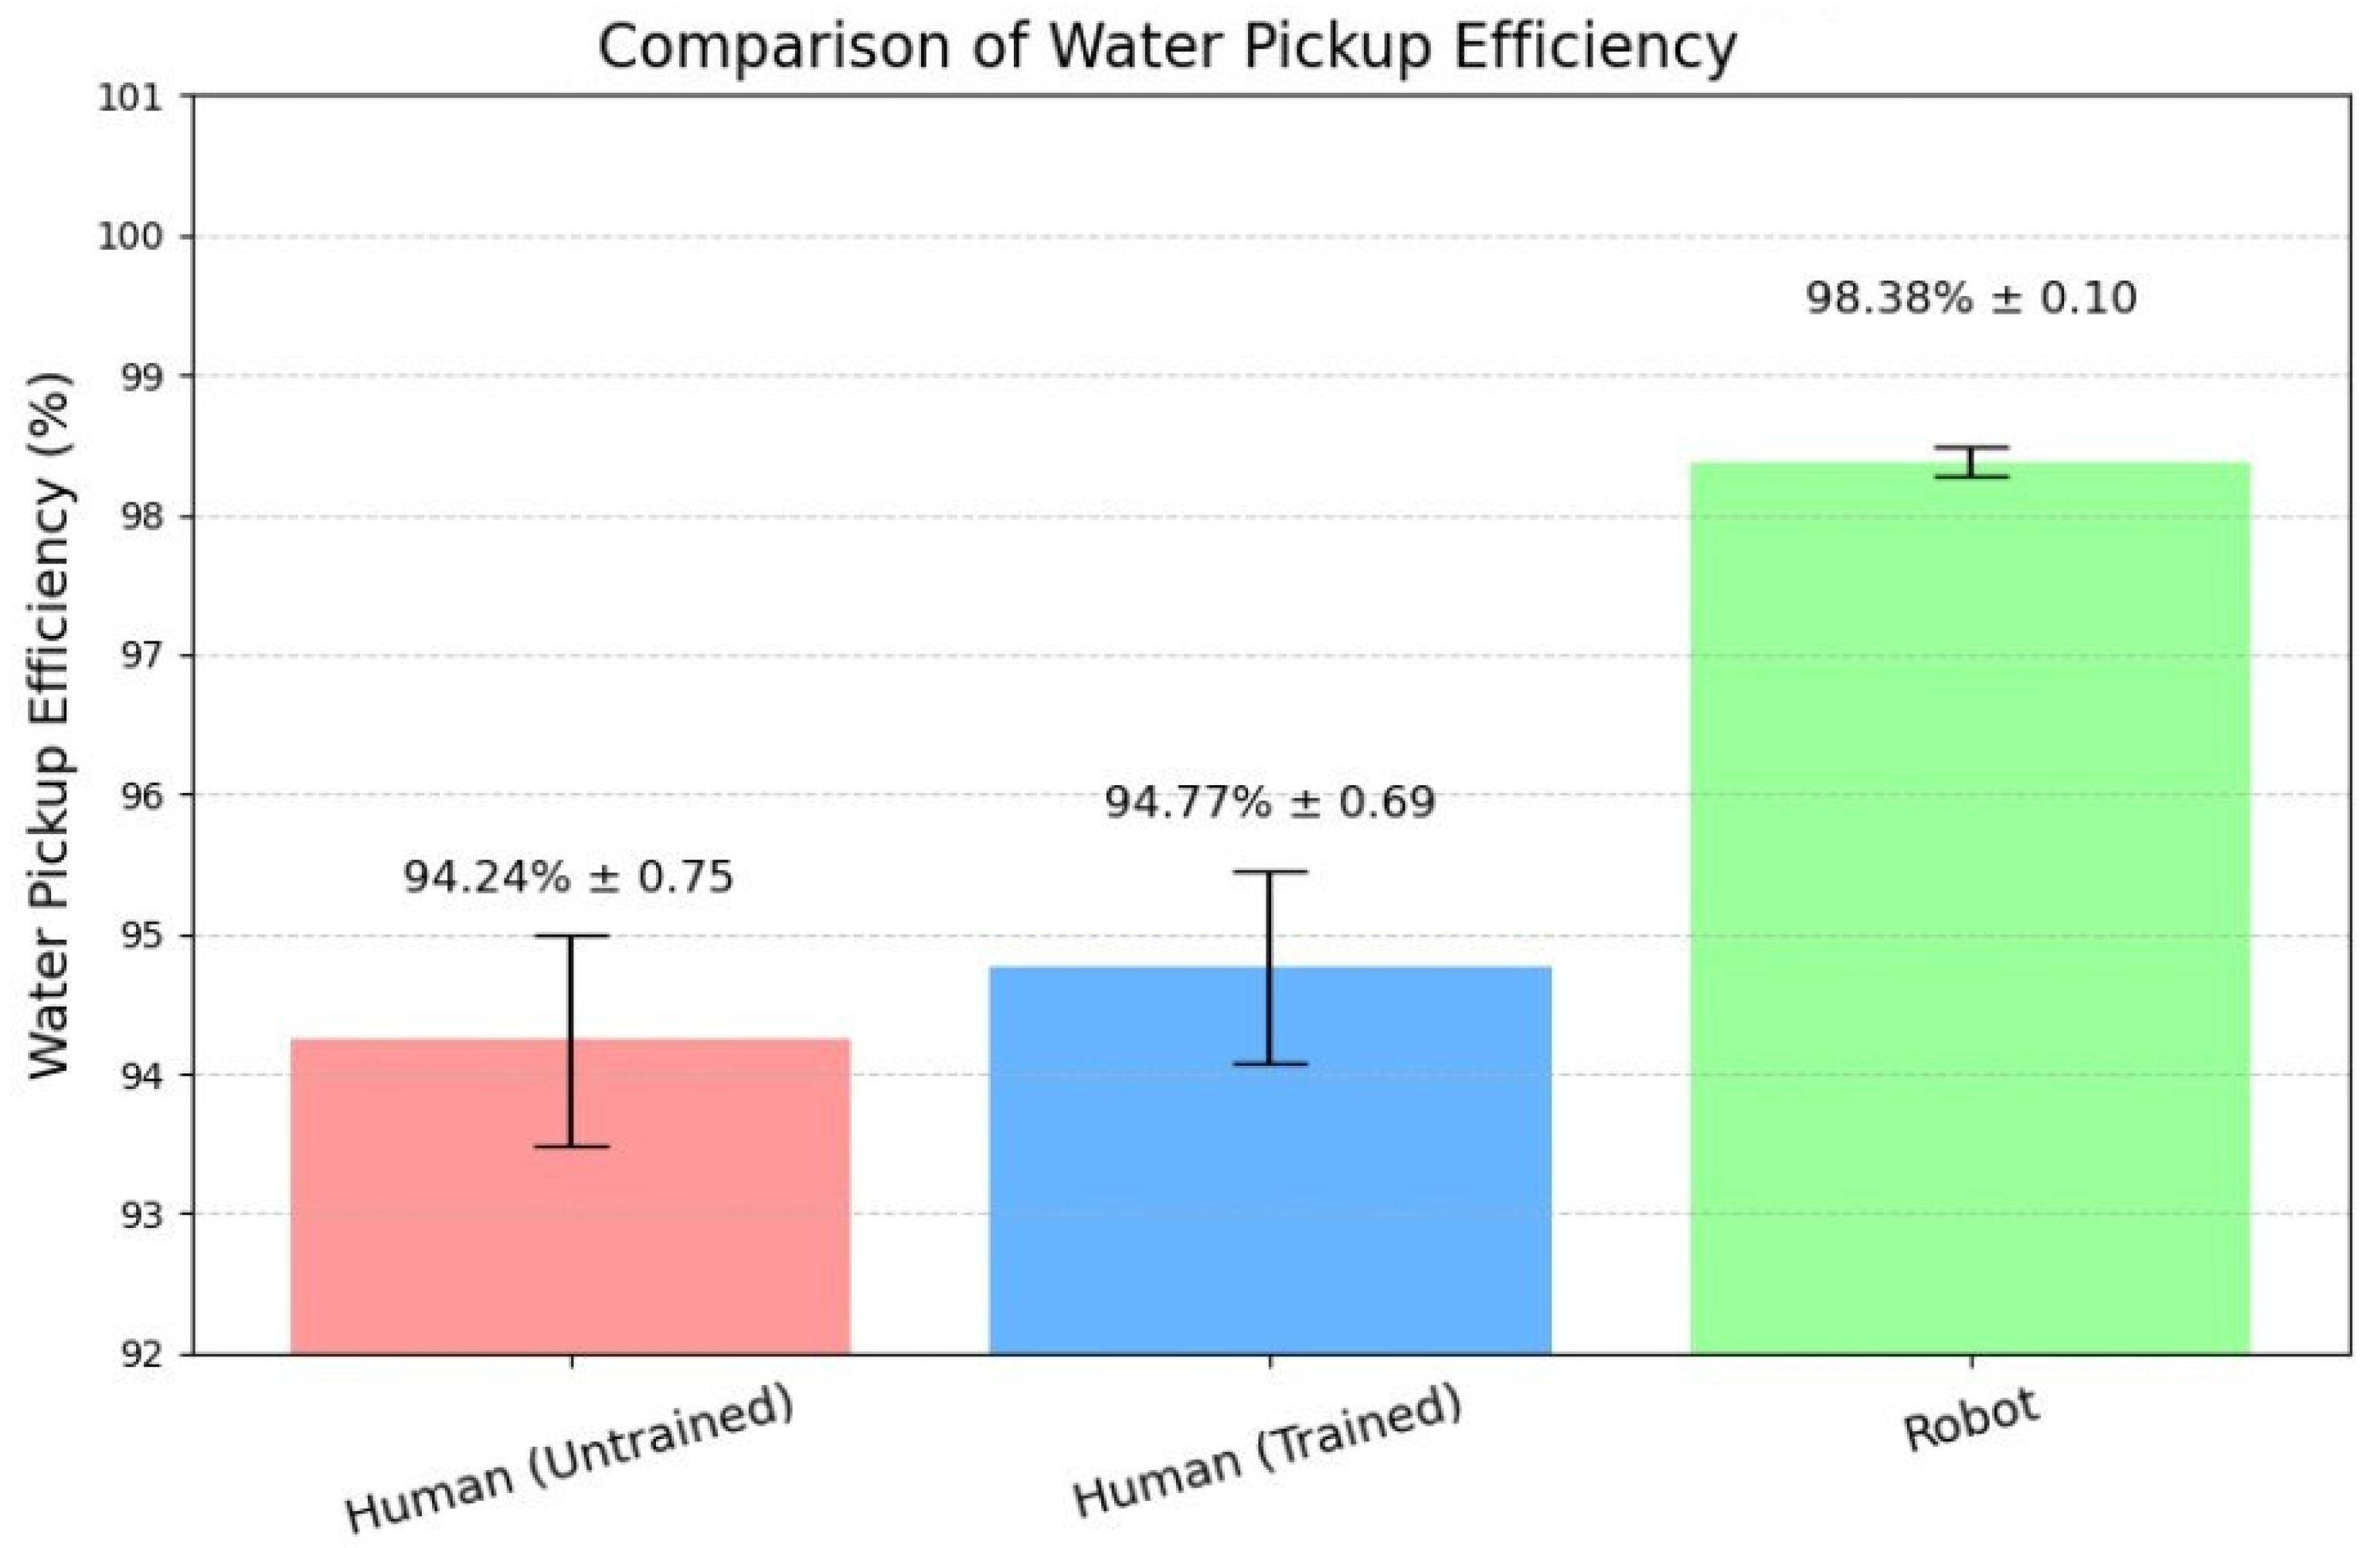
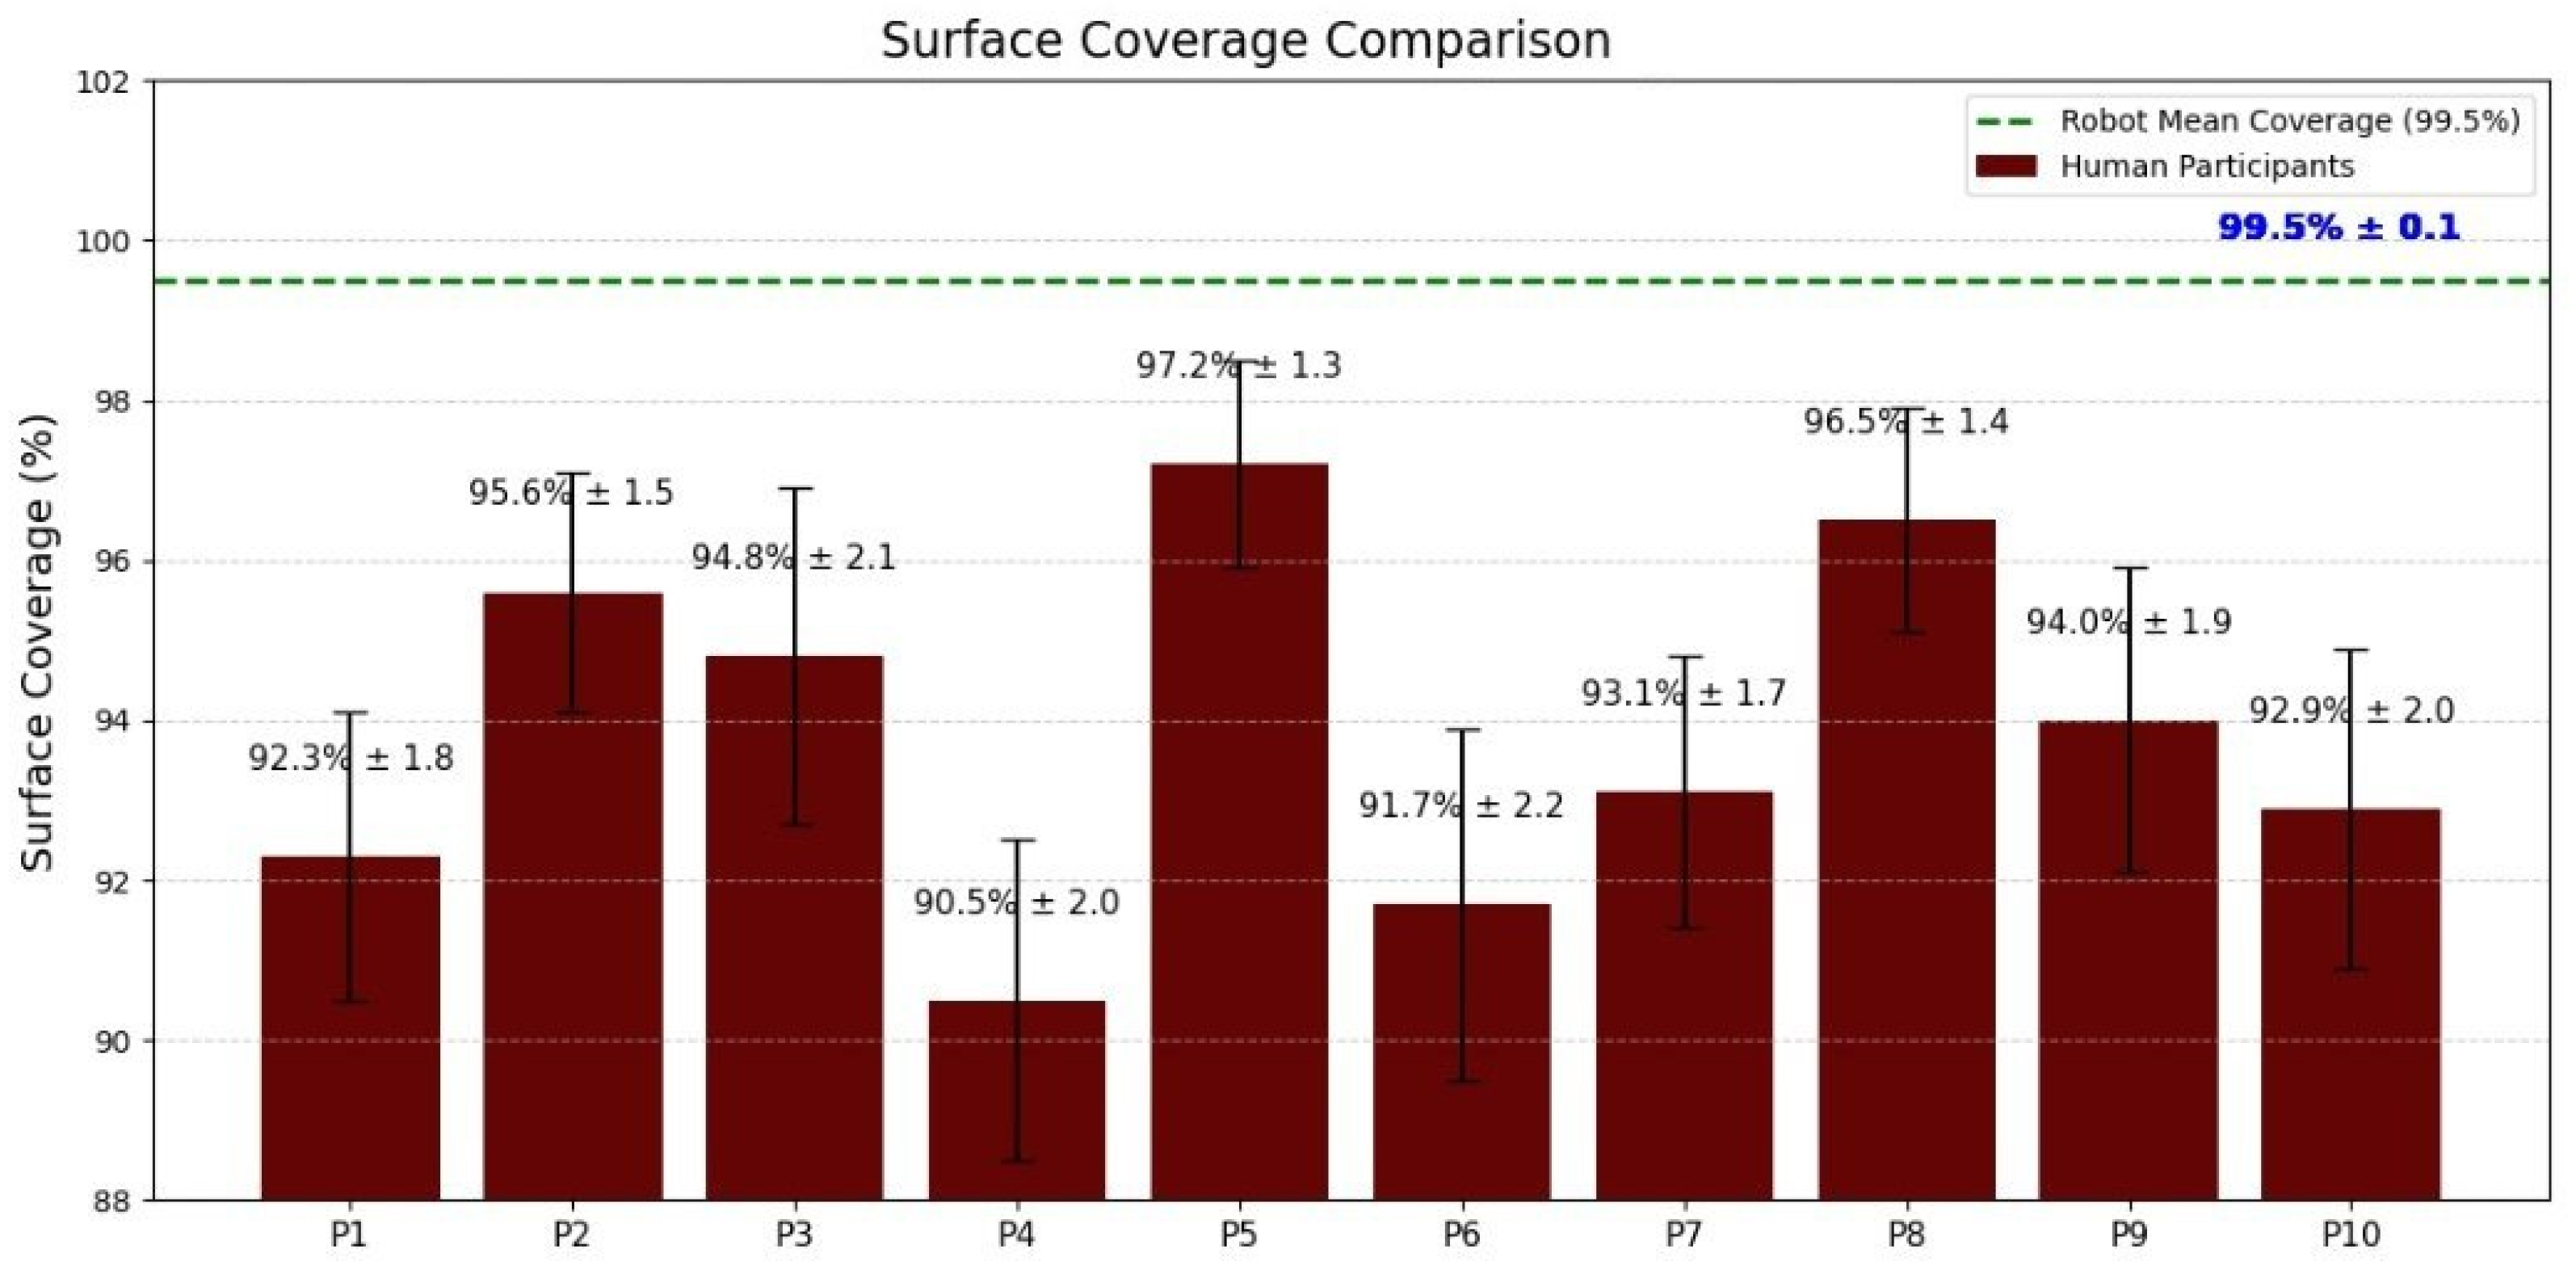
The results of this study demonstrate a clear performance advantage of the robotic swabbing system over both trained and untrained human operators. The superior outcomes are attributable to the robot’s precise control algorithms, integrated tactile sensing, and repeatable motion execution. By maintaining optimal contact force and following a predefined coverage pattern, the robotic system consistently achieved near-complete surface engagement and higher fluid recovery rates. In contrast, human operators, even with standardized training, exhibited natural variability in applied force, swab angle, and coverage patterns, leading to occasional missed areas and reduced sampling efficiency. This variability is consistent with previous findings highlighting the limitations of manual swabbing in terms of reproducibility and microbial recovery efficiency.
From an industrial food safety perspective, consistent pressure application and complete coverage are critical factors in ensuring reliable surface sampling, as inconsistencies can lead to underestimation of microbial or residue loads and potential false assurances of hygienic conditions. By minimizing operator-dependent variability, the robotic system enhances the reliability of environmental monitoring programs, thereby strengthening sanitation verification and hazard prevention within Hazard Analysis and Critical Control Point (HACCP) frameworks.
The potential integration of fluorescence spectroscopy further broadens the system’s utility. The spectrometer provided rapid, non-contact detection of protein-based residues, effectively differentiating between contamination levels in model poultry soils. This rapid verification capability is particularly valuable for in-plant applications, where immediate feedback can facilitate corrective actions, reduce downtime, and support continuous improvement in the sanitation processes. The observed sensitivity to low protein concentrations underscores its potential as a complementary tool for validating cleaning efficacy without the need for culture-based delays. Together, the combination of force-controlled robotic swabbing and fluorescence-based residue detection presents a potential dual-modality approach to environmental monitoring. This integrated system addresses key shortcomings of manual swabbing in variability, incomplete coverage, and delayed detection, while aligning with regulatory and industry trends toward data-driven, real-time hygiene verification. Future work should investigate performance across diverse surface types, soil compositions, and real-world processing environments, as well as assess economic feasibility and integration with plant automation systems. Such advancements could further position this technology as a cornerstone of next-generation food safety monitoring strategies.

