Abstract
The Asian eel, a medicinal and edible species, lacks systematic research on age-related nutritional and flavor dynamics. To optimize breeding strategies and product differentiation, this study systematically investigated the nutritional composition, flavor profiles, and physical properties of Asian eel muscles across five distinct growth stages (1, 3, 7, 11, and 22 years). Results showed that unsaturated fatty acids increased with age, while ω-3/ω-6 ratios peaked in 1-year-old eels. The levels of hydrolyzed essential amino acids were higher in the 3–11-year-old groups, contrasting with higher free amino acids in 1- and 22-year-old eels. Texture declined in hardness/chewiness but improved in resilience with age, linked to muscle fiber density and diameter. One–three-year-old eels exhibited compact muscle fibers and superior texture, while 7–22-year groups demonstrated functional lipid profiles (high docosahexaenoic acid and γ-aminobutyric acid, low cholesterol). These findings highlight age-specific quality traits: 1–3-year-old eels are suitable for fresh consumption, 3–11-year groups offer bioactive benefits, and 22-year-old eels serve as premium functional ingredients. The study provides a scientific basis for targeted breeding and market segmentation to enhance the value of eel aquaculture.
1. Introduction
The Asian swamp eel (Monopterus albus) is an economical freshwater species. Due to its high protein content, low-fat composition, and richness in bioactive compounds, M. albus is valued in aquaculture and dietary therapy [1]. According to the China Fisheries Statistical Yearbook, the annual aquaculture production of eels has consistently exceeded 300,000 tons [2]. However, expectations for aquatic products have evolved significantly. Modern consumers increasingly prioritize not only guaranteed nutritional value but also enhanced flavor and taste profiles [1,3]. Consequently, the nutritional composition and sensory attributes of eel flesh have become critical factors in determining market competitiveness.
The nutritional and flavor characteristics of fish muscle are regulated by a combination of genetic [4], dietary [5], environmental [4], and ontogenetic factors [6,7]. Among these, age plays a pivotal role in modulating muscle quality by regulating lipid metabolism, protein dynamics, and muscle fiber architecture [8,9]. Studies indicate that age-dependent regulation is exemplified by shifts in fatty acid profiles across developmental stages [10]. In Procambarus clarkii, for instance, aging correlates with diminished fatty acid diversity and reduced total polyunsaturated fatty acids (PUFAs), while eicosapentaenoic acid (EPA) and arachidonic acid (ARA) levels exhibit marked elevation [11]. Parallel patterns emerge in Culter alburnus, where both fatty acid and amino acid profiles display age-specific variations [12]. Such metabolic divergence across growth phases drives significant age-related differences in amino acid composition and physiological demands [13]. In beluga (Huso huso), the total essential amino acids (ΣEAA) increase with age, a phenomenon likely linked to growth conditions such as diet composition and environmental factors [14]. Conversely, in American shad (Alosa sapidissima), nutrient allocation is prioritized to gonads during reproduction, leading to decreased amino acid reserves in muscle and liver [15]. These findings underscore the necessity of age-specific analyses to decode the biochemical determinants of fish meat quality.
Texture, a critical sensory attribute in aquatic products, is shaped by intrinsic factors (such as structural characteristics, chemical composition, color, fat content) and extrinsic variables (such as aquaculture practices, feed formulations, and pre- to post-slaughter processing) [16,17,18]. Numerous studies have revealed the impact of feeding methods on the texture of fish muscle. Wild specimens of most fish species—including sea bass (Dicentrarchus labrax) [16], Atlantic salmon (Salmo salar) [17], and blackspot seabream (Pagellus bogaraveo) [19]—exhibit superior hardness, crispness, and muscle quality compared to their farmed counterparts. In addition, dietary interventions further modulate texture profiles: supplementation with rapeseed oil and palm oil enhances muscle hardness, elasticity, and shear force, accompanied by histological evidence of enlarged and densely packed muscle fibers [20,21]. Mechanistically, dietary regimes influence muscle fiber diameter distribution and density [22], while molecular pathways such as FoxO1 signaling, AMPK-regulated glycogen/protein metabolism [23], and the gut–muscle axis [24] govern muscle mass development. Despite these advances, the age-dependent evolution of textural and nutritional traits in cultured fish remains underexplored.
As a benthic carnivorous fish with a unique life cycle (such as sex reversal), the Asian eel has been extensively studied in terms of breeding modes [25,26], nutritional components [27,28], and specific growth stages [25]. However, systematic investigations into the age-dependent dynamics of muscle nutritional and flavor characteristics remain limited, which affects breeding strategies and leads to low resource utilization efficiency. Therefore, this study systematically analyzes the dynamic changes in nutritional composition, flavor compounds, and textural properties of eel muscles across five developmental phases (1, 3, 7, 11, and 22 years). The findings are expected to provide actionable insights into precision breeding and market-driven product differentiation, thereby enhancing the sustainability and economic value of the eel aquaculture industry.
2. Materials and Methods
The Animal Ethics Committee of the Shanghai Academy of Agricultural Sciences approved all animal procedures under approval number SAASXM062438; the approval date was 7 August 2024.
2.1. Chemicals and Reagents
The 75% ethanol (chemical grade), 95% ethanol (analytical grade), 5% paraformaldehyde (chemical grade), hydrochloric acid (analytical grade), ammonia (analytical grade), pyrogallic acid (analytical grade), ether (analytical grade), sodium hydroxide (analytical grade), methanol (HPLC grade), acetonitrile (HPLC grade), heptane (HPLC grade), isooctane (HPLC grade), and sodium chloride (analytical grade) were purchased from Sangon Biotech (Shanghai, China).OPA-derived reagents and FMOC-derived reagents (analytical grade) were purchased from Sigma Corporation (Cream Ridge, NJ, USA). The standards of fatty acid methyl ester, amino acid, GABA, and cholesterol (Purity ≥ 99.9%) were purchased from the China National Institute for the Control of Pharmaceutical and Biological Products (Beijing, China). The triglyceride test kit was purchased from Nanjing Jiancheng Bioengineering Institute (Nanjing, China).
2.2. Experimental Management
The experimental site and fish were provided by the Zhuanghang Experimental Station of the Shanghai Academy of Agricultural Sciences. The aquaculture pond covers an area of 40 m2 and has a water depth of 0.6–0.8 m. Fish were adopted in net cages and fed a commercial diet, containing 43% crude protein and 7% crude lipids (Huisheng Biotechnology Co., Ltd., Wuhan, China) at 4:00 pm every day. Feeding protocols followed the standardized management model established in our laboratory’s prior studies to ensure uniform growth conditions [29]. During the experiment, the dissolved oxygen level exceeded 6 mg/L, the pH range was 7.5 to 8.0, the ammonia nitrogen level was below 0.2 mg/L, and the temperature range was 30 ± 2 °C.
2.3. Sample Collection
Randomly select 9 M. albus at the ages of 1, 3, 7, 11, and 22, and anesthetize them with MS-222 before sampling. Subsequently, the surface of M. albus was wiped with 75% ethanol to collect muscle samples, and samples were taken from both sides of the muscle using a disinfected surgical knife. Immediately determine the parameters of the back muscle texture. Muscle slices were fixed in 5% paraformaldehyde (PFA) for 24 h at 4 °C. The remaining samples were frozen using liquid nitrogen and then stored at −80 °C.
2.4. Experimental Detection
2.4.1. Muscle Component Analysis
Muscle fatty acids were analyzed by a Shimadzu GC-2030AF gas chromatograph (Kyoto, Japan) according to the standard [30]. Muscle amino acid profiles (including hydrolyzed and free amino acids) were obtained using an Agilent 1260 HPLC system (Santa Clara, CA, USA), following the previous method [31]. This HPLC system is also used to detect the contents of GABA and cholesterol, according to the standards [32,33], respectively. Muscle triglyceride contents were detected using a Mindray UV visible spectrophotometer (Shenzhen, China), following the instructions of the Nanjing Jiancheng triglyceride kit (Nanjing, China).
2.4.2. Muscle Texture, Slice Analysis
The muscle of M. albus was cut into sizes of 2 cm × 2 cm × 2 cm. Muscular textural parameters were tested by XTPlus texture analyzer (Stable Micro Systems, Croydon, UK) according to our previous research [26]. Texture indicators, such as muscle hardness, adhesion, cohesion, springiness, gumminess, chewiness, and Resilience are collected and normalized by software.
After fixation and dehydration, the muscle was embedded in paraffin and cut into 3–4 μm sections. Then, the slices were stained with hematoxylin–eosin (HE). We used a Nikon TS100 optical microscope with a magnification of 20× to measure the muscular histometry following the previous method [28]. Image Pro Plus 6.0 analysis software was used to check the number of muscle fibers and calculate the diameter of muscle fibers. Millimeters are used as the standard unit of measurement.
2.5. Data Analysis
After collecting the data, the experimental data were organized and statistically analyzed using IBM SPSS Statistics 22.0. All data are presented in the form of mean ± standard deviation (Mean ± SD). Apply one-way analysis of variance and conduct post hoc tests on the measured data using the LSD test and the Tamhane test.
3. Results
3.1. Content of Fatty Acid in Muscle
According to Table S1, a total of 30 fatty acids were identified in the muscles of eels across different age groups, including 13 saturated fatty acids (SFAs), 7 monosaturated fatty acids (MUFAs), and 10 polyunsaturated fatty acids (PUFAs). Significant variations in fatty acid composition were observed among age groups. As the age increased, the proportion of SFAs decreased, while that of unsaturated fatty acids (UFA) increased. Notably, MUFAs were significantly lower than PUFAs in the 1-year-old group but surpassed PUFAs in older groups (3–22 years). The SFA profiles were consistent across age groups, dominated by C16:0 (20.99–23.95%) and C18:0 (4.55–5.68%). MUFAs primarily consisted of C18:1n9c (18.02–28.10%) and C16:1 (8.25–11.71%). In contrast, PUFA composition differed markedly between the 1-year-old group and older groups (3–22 years). The 1-year-old group exhibited an exceptionally high omega-3/omega-6 ratio of 1.58:1, with C18:3n3 being the predominant omega-3 PUFA. In older groups (3–22 years), this ratio declined to 0.34:1–0.78:1, and C22:6n3 (DHA) became the major omega-3 component.
3.2. Content of Amino Acids in Muscle
Table S2 presents the content of hydrolyzed amino acids (HAA) in muscle. A total of 16 HAAs were identified across different age groups, including 7 essential amino acids (EAAs, accounting for 50.714–70.496% of the total) and 9 non-essential amino acids (NEAAs, accounting for 29.504–49.286% of the total). Notably, the HAA content in the 3–11-year-old groups was significantly higher than in the 1-year and 22-year groups.
Table S3 presents the content of free amino acids (FAA) in muscle. A total of 20 FAAs were identified across different age groups, including 10 EAAs (accounting for 15.851–49.199% of the total) and 10 NEAAs (accounting for 50.801–84.149% of the total). In contrast to the content of HAAs, FAA levels in the 3–11-year-old groups were significantly lower than those in the 1-year and 22-year groups.
Figure 1 presents the content of flavor amino acids in muscle. Two umami amino acids (aspartic acid and glutamic acid) and five sweet amino acids (serine, proline, methionine, glycine, and alanine) were identified across different age groups. Their contents were significantly correlated with feeding age (p < 0.05). The content of total flavor amino acids, aspartic acid, glutamic acid, serine, and proline exhibited an initial increase followed by a decrease with advancing age, peaking in the age 3 group and reaching the lowest levels in the age 22 group. Conversely, the contents of methionine, glycine, and alanine showed an inverse pattern, with the highest values observed in the 1-year group and the lowest in the 11-year group.
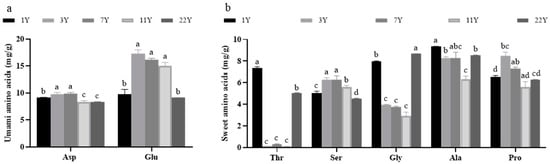
Figure 1.
Effects of different rearing years on the content of flavor amino acids in M. albus muscle. (a) the content of umami amino acids; (b) the content of sweet amino acids. Different lowercase letters indicate significant differences among the groups (p < 0.05).
3.3. Content of Gamma-Aminobutyric Acid, Triglycerides, and Cholesterol in Muscle
The contents of GABA, triglycerides, and cholesterol in muscle are illustrated in Figure 2. GABA was not detected in the 1-year and 22-year groups but was present in the 3–11-year groups (p < 0.05), with concentrations peaking in the 11-year group. Triglyceride content varied significantly across age groups (p < 0.05), particularly in the 22-year group, which exhibited markedly higher levels than other cohorts. The cholesterol content showed a trend of first increasing and then decreasing with age, with a significant increase in the 7-year group (p < 0.05). It is worth noting that the triglyceride content in the muscles of the 22-year group is the highest, while the cholesterol content is the lowest.
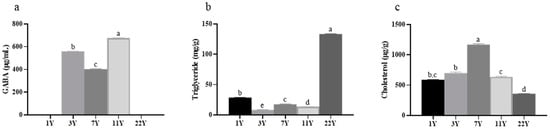
Figure 2.
Effects of different rearing years on the content of (a) γ-aminobutyric acid, (b) triglyceride, and (c) cholesterol in M. albus muscle. Different lowercase letters indicate significant differences among the groups (p < 0.05).
3.4. Principal Component Analysis of Muscle Nutritional Components
To explore age-related variations in nutritional composition, principal component analysis (PCA) was performed on fatty acids, amino acids, GABA, triglycerides, and cholesterol. As shown in Figure 3, PCA differentiated eel cohorts across five age groups (1, 3, 7, 11, and 22 years) along PC1 (82.53% variance) and PC2 (11.94% variance).
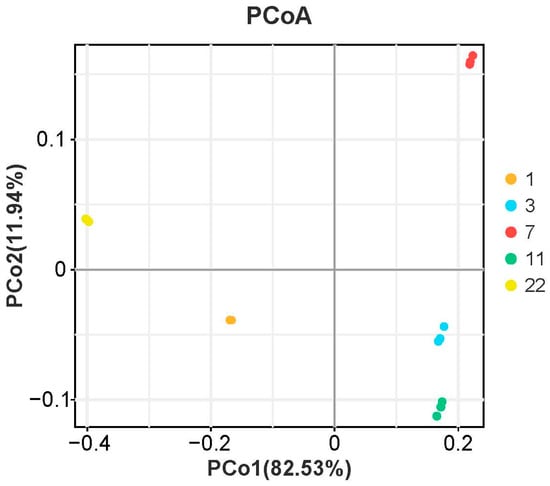
Figure 3.
Principal coordinates analysis (PCoA) analysis of nutritional components in M. albus muscle of different feeding ages.
3.5. Muscle Texture Analysis
Figure 4 presents the results of the muscle texture analysis. With increasing age, hardness (p < 0.05), gumminess, and chewiness progressively decreased, whereas springiness (p < 0.05), cohesiveness, and resilience exhibited significant increases. Notably, the most pronounced age effects were observed in hardness reduction and resilience enhancement. Normalized textural parameters are visualized in the radar chart (Figure 5), revealing that the 1–3 year groups showed significantly higher hardness, chewiness, and gumminess compared to the 7–22 year groups. This trajectory suggests an age-dependent shift from rigid to resilient muscle architecture.
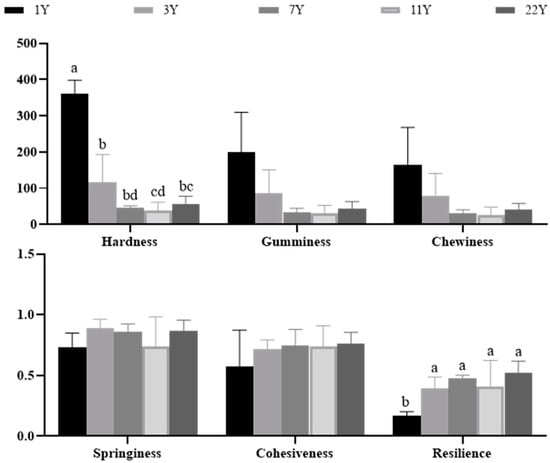
Figure 4.
Effects of different rearing years on texture profile in M. albus muscle. Different lowercase letters indicate significant differences among the groups (p < 0.05).
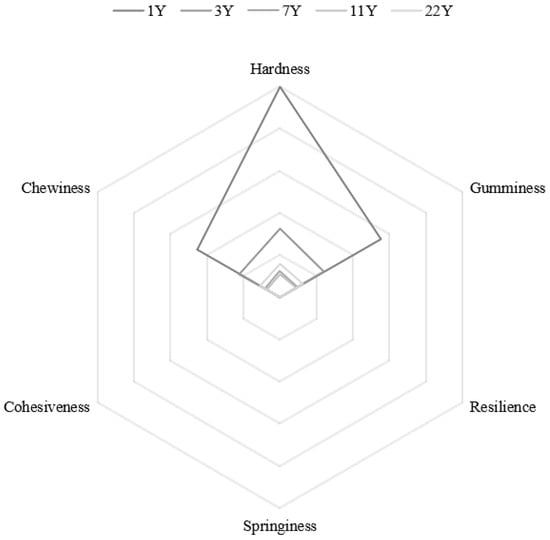
Figure 5.
Radar chart of different feeding ages M. albus muscle texture parameters.
3.6. Slice Analysis
Figure 6 shows the histological structure of eel muscle across different age groups. In the 1- and 3-year groups, muscle fibers are tightly packed, structurally intact, and exhibit smaller diameters with uniform fiber spacing (Figure 6a,b). In contrast, the 7- and 11-year groups show enlarged fiber diameters, looser fiber arrangement, and reduced fiber spaces (Figure 6c,d). The 22-year group displays fiber diameters comparable to the 1- and 3-year cohorts but retains tight fiber alignment and uniform spacing (Figure 6e).
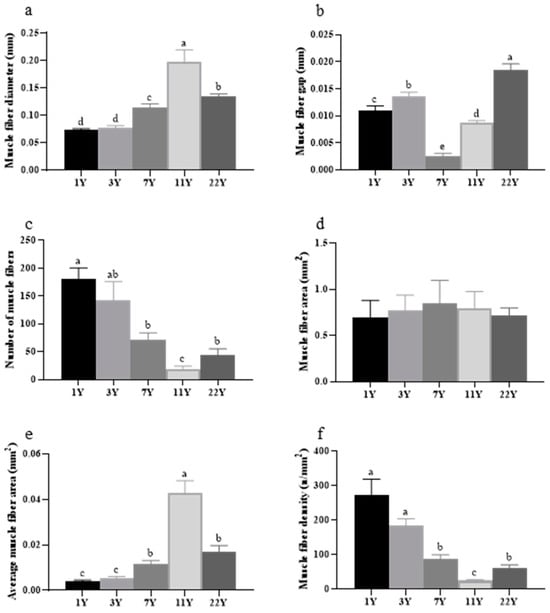
Figure 6.
Measurement and analysis of back muscle cells in M. albus muscle of different feeding ages. (a) the diameter of muscle fibers; (b) the spacing between muscle fibers; (c) the number of muscle fibers; (d) the area of muscle fibers; (e) the average area of muscle fibers; (f) the density of muscle fibers. Different lowercase letters indicate significant differences among the groups (p < 0.05).
Figure 7 illustrates the analysis results of muscle fiber parameters in the slices. With advancing age, fiber diameter and average area initially increased significantly (p < 0.05), peaking in the 7-year group, followed by a marked decline (p < 0.05). Conversely, fiber density and number exhibited an inverse trend. Significant variations in fiber spacing were observed among age groups, with the 7- and 11-year groups showing the narrowest gaps compared to other cohorts (p < 0.05).
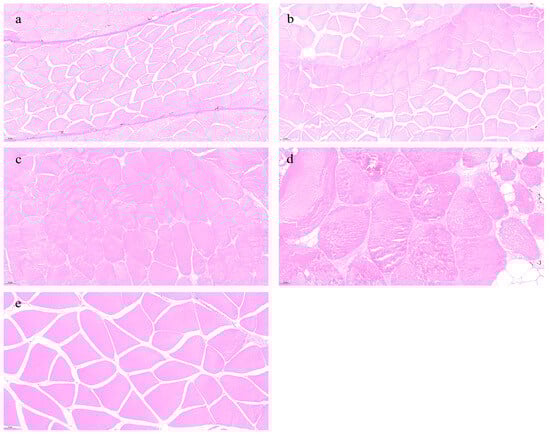
Figure 7.
Effects of different rearing years on morphological changes in M. albus muscle. (a) age 1, (b) age 3, (c) age 7, (d) age 11, and (e) age 22.
3.7. Correlation Between Muscle Texture and Muscle Fiber Parameters
To investigate the association between muscle texture and muscle fiber characteristics across different age groups, we conducted a Pearson correlation analysis between textural parameters (hardness, gumminess, chewiness) and morphometric fiber traits (density, number, diameter) in eels. The results are shown in Figure 8. Among muscle textural properties, hardness, gumminess, and chewiness exhibited a significant positive correlation with muscle fiber density and the number of muscle fibers (p < 0.01) while exhibiting a substantial negative correlation with muscle fiber diameter (p < 0.05). Negative correlation coefficients indicated that increased muscle fiber density and the number of muscle fibers were accompanied by a decrease in resilience (p < 0.05).
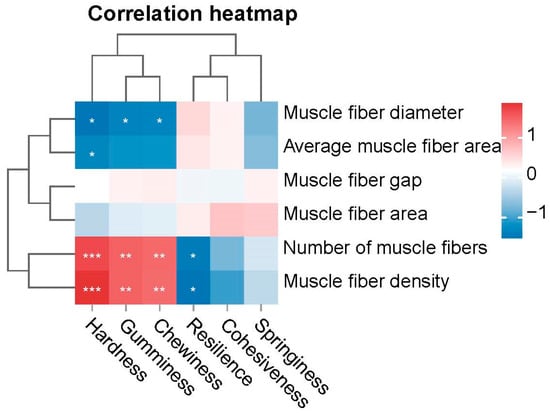
Figure 8.
Correlation Between Muscle Texture and Muscle Fiber Parameters. The asterisk indicates the significant difference in p-value between groups, * indicates p < 0.05, ** indicates p < 0.01, *** indicates p < 0.001.
4. Discussion
4.1. The Effect of Different Rearing Years on Nutritional Composition in M. albus Muscle
This study systematically analyzed the dynamic changes in fatty acids, amino acids, GABA, triglycerides, and cholesterol content in eel muscles across different feeding ages. PCA revealed significant variations in their nutritional profiles related to growth age, similar to the phenomenon observed in poultry [34], edible insects [35,36], ginseng [37], and fruits [38].
Fatty acids, as an important indicator for evaluating meat quality, are also one of the important sources of nutrition and energy for the human body. Research has found that a diet rich in MUFAs can effectively reduce triglyceride concentrations and increase high-density lipoprotein levels. The composition and content of PUFAs reflect the nutritional quality of lipids, with higher PUFA content significantly enhancing meat aroma [39]. In this experiment, as eels aged, the proportion of SFAs in the muscles of eels decreased, while the proportion of UFAs increased. When over 1 year old, MUFAs became the dominant component. This shift suggests that 1-year-old eels rely on PUFAs to support their rapid growth demands, while adults utilize MUFAs as their primary energy reserve [40]. UFAs are known to improve cardiovascular health, metabolic function, inflammatory responses, and cognitive performance [41,42]. Nutritionists recommend a polyunsaturated-to-saturated fatty acid ratio (P:S) ≥ 0.4 [43], and an ω-6/ω-3 PUFA ratio <4 to mitigate risks of cancer and coronary heart disease [44]. Our results indicate that eels aged 1–22 years meet these criteria, offering superior nutritional benefits compared to beef, lamb, pork, and marine fish [45,46]. It is worth noting that the proportion of ω-3/ω-6 in 1-year-old eels is significantly higher than in other older groups, with α-linolenic acid (C18:3n3, ALA) as the predominant ω-3 PUFA. Diets rich in ω-3 fatty acids are associated with cardiovascular protection and atherosclerosis prevention [47]. Given typical diets’ ω-6 predominance, consuming 1-year-old eels (high ω-3/ω-6 ratio) could counterbalance this imbalance. In 7- to 22-year-old eels, docosahexaenoic acid (C22:6n3, DHA) becomes the dominant ω-3 component. DHA functions as a neurotrophic factor [48], modulates synaptic plasticity [49], and participates in anti-inflammatory pathways [50]. Therefore, older eels (≥7 years) are a viable source of DHA supplementation.
Amino acid analysis also highlights the impact of age on the nutritional value of eels. HAAs comprise a mixture of short peptides generated through protein hydrolysis and a minor proportion of FAAs [51]. These short peptides are rapidly absorbed via the intestinal peptide transport system [52], exhibiting higher absorption efficiency and lower osmotic pressure compared to FAAs [53], thereby making them ideal for infants or postoperative patients with compromised digestive function [54]. In addition, short peptides may retain bioactive properties, including antioxidant [55] and immune regulation [56]. FAAs, existing in monomeric form, require no enzymatic digestion for direct absorption, with bioavailability approaching 100%. This characteristic positions FAAs as precise supplements for targeted amino acid delivery [57]. HAAs complement each other in applications. Among them, aspartic acid can promote the production of neurotransmitters, glutamic acid can participate in human protein synthesis and enhance immunity, and lysine has the effect of promoting human protein utilization and protein synthesis [58,59]. In this study, HAA analysis revealed that EAAs accounted for 50.71–70.50% of total HAAs in the 3–11-year groups, significantly exceeding levels in the 1- and 22-year groups. This indicates that the protein quality of eel muscle is better at this stage, especially due to the enrichment of EAAs like lysine and leucine, which may enhance its potential as a high-quality protein source. Conversely, FAA distribution is inversely correlated with HAA trends. This dichotomy likely reflects metabolic adaptations: older eels (22-year group) may reduce energy expenditure by suppressing FAA levels while accumulating HAAs to sustain tissue functionality [60].
GABA, a naturally occurring non-protein amino acid, serves as the primary inhibitory neurotransmitter in the mammalian central nervous system. It regulates cardiovascular functions such as blood pressure and heart rate [61] and plays a role in reducing anxiety and pain [62,63]. In this study, eels aged 3–11 years showed elevated GABA levels, which further enhanced their health-promoting potential compared to other age cohorts.
Cholesterol, a key component of the cell membrane, maintains structural stability and serves as a precursor for synthesizing bile acids [64,65], vitamin D [66], and cortisol [67]. It also plays critical roles in nerve conduction and immune regulation [68,69]. Triglycerides, the primary form of energy storage, provide sustained fuel for muscular and organ functions [70]. While both cholesterol and triglycerides are essential lipids, their levels must be balanced within optimal physiological ranges to mitigate health risks [71]. In this study, the 22-year-old group exhibited peak triglyceride content alongside the lowest cholesterol levels. This lipid profile may confer dual advantages: enhanced palatability from lipid richness and reduced cardiovascular risks from low cholesterol. Coupled with elevated DHA and monounsaturated fatty acid levels, 22-year-old eels could be strategically positioned as premium functional ingredients that integrate health benefits with sensory appeal.
4.2. The Effect of Different Rearing Years on Flavor Quality in M. albus Muscle
In addition, this study systematically revealed the age-dependent characteristics of the flavor and taste of eel muscle. The dynamic changes in taste amino acid composition, texture characteristics, and muscle fiber structure jointly shape the differences in edible quality at different developmental stages.
From the perspective of flavor characteristics, aspartic acid and glutamic acid contribute umami taste to food, while serine, proline, threonine, glycine, and alanine impart sweetness [72]. Furthermore, flavor-enhancing amino acids synergize with taste-active nucleotides to amplify flavor complexity and intensity [73,74]. In this study, the concentrations of umami- and sweet-associated amino acids in eel muscle exhibited pronounced age-dependent divergence. Total flavor amino acids peaked in the 3-year-old group, primarily driven by the accumulation of aspartic acid and glutamic acid. In contrast, the 22-year-old group showed a marked reduction in umami amino acids (with a 40% reduction in glutamic acid content). Previous studies indicate that tissue amino acid profiles are modulated by developmental stages, likely reflecting adaptive responses to growth demands [75,76,77]. Based on the changes in amino acid content, the 3-year-old group may represent the “flavor golden window” for eels, where peak total flavor amino acids—via umami–sweetness synergy—align with consumer preferences for aquatic products. While the 1-year-old group exhibited the highest sweet amino acid levels, the delayed accumulation of umami components resulted in a unidimensional sweet profile, making it suitable for specific culinary applications (such as sweet-dominated sauce braised products).
The texture characteristics of fish meat, including hardness, cohesiveness, springiness, adhesiveness, gumminess, and chewiness, are critical determinants of consumer acceptance [78]. It is related to taste, tissue morphology, and other sensory qualities [79]. Hardness reflects resistance to mastication and is positively correlated with springiness; gumminess is defined as the product of hardness and cohesiveness; chewiness is calculated as the product of hardness, cohesiveness, and springiness; resilience quantifies the material’s capacity to recover shape post-deformation [80]. In this study, correlation patterns between textural parameters mirrored those reported in Atlantic salmon (Salmo salar) and brown trout (Salmo trutta) [81,82,83], but opposite to terrestrial animals [84,85]. Eels are benthic aquatic animals. We hypothesize that their muscles must adapt to continuous swimming and flexible body movements. This adaptation likely drives muscle fibers to arrange in a dense, numerous, and small-diameter pattern. This contrasts with terrestrial animals, where age-dependent textural changes primarily reflect load-bearing adaptations [86,87]. While feed composition [28,88] and aquaculture practices [16] are known modulators of piscine texture, this study provides novel evidence that the ontogenetic stage independently regulates textural properties. In this study, the muscle hardness and chewiness of the 1- and 3-year age groups were significantly higher than those of the 7–22 age groups, indicating that young eels have denser meat and a more elastic and tough taste, which may be related to the microstructural characteristics of tightly arranged dorsal muscle fibers and smaller diameters. In contrast, the muscle fibers of 7–11-year-old eels become loose, and the gaps shrink, leading to a decrease in hardness and chewiness; consequently, the meat tends to become soft. This change may be related to the shift in energy allocation toward reproductive development after sexual maturity [89]. This result reveals the unique regulatory mechanism of its muscle texture characteristics.
5. Conclusions
This study demonstrates that as a characteristic aquatic species, the nutritional and sensory properties of Monopterus albus muscle exhibit significant age-dependent variations. The 1-year-old eels exhibit a high ω-3/ω-6 ratio (1.58:1) and are enriched with sweet-tasting amino acids; the 3–11-year-old cohorts show prominent proportions of hydrolyzed EAAs; the 22-year-old eels demonstrate elevated DHA levels, reduced cholesterol content, and neuroactive metabolites. The age-dependent transition from stiff to elastic muscle texture correlates with muscle fiber morphometrics, contrasting sharply with the adaptations observed in terrestrial animals. The above findings provide a scientific basis for differentiated breeding and precision processing.
Supplementary Materials
The following supporting information can be downloaded at: https://www.mdpi.com/article/10.3390/foods14101685/s1, Table S1: Comparative analysis of fatty acid content in M. albus muscle from different rearing years; Table S2: Comparative analysis of hydrolyzed amino acid content in M. albus muscle from different rearing years; Table S3: Comparative analysis of free amino acid content in M. albus muscle from different rearing years.
Author Contributions
Conceptualization, methodology, software, formal analysis, data curation, writing—original draft preparation: Y.Z.; Conceptualization, investigation, validation: W.X., W.L., Q.Y., H.Y., W.Z., and W.H.; Writing—review and editing, supervision, funding: W.Z. and W.H. All authors have read and agreed to the published version of the manuscript.
Funding
This research was supported by the Shanghai Science and Technology Innovation Action Plan (24N22800500) and the China Agriculture Research System of MOF and MARA (CARS-46).
Institutional Review Board Statement
The animal procedures were strictly compliance with the regulations outlined in the Statute of Experimental Animal Ethics Committee of Shanghai Academy of Agricultural Sciences with Approval Number SAASXM062438, the approved date is 7 August 2024.
Informed Consent Statement
Not applicable.
Data Availability Statement
The original contributions presented in the study are included in the article/Supplementary Materials. Further inquiries can be directed to the corresponding authors.
Conflicts of Interest
The authors declare no conflicts of interest.
References
- Mao, T.; Gan, J.; Yu, Y.; Dong, L.; Zhang, L.; Zhang, T.; Cheng, B.; He, L. Evaluation of Muscle Quality of Monopterus albus from Different Sources. For. Chem. Rev. 2022, 211–222. [Google Scholar]
- Fishery Administration Bureau of the Ministry of Agriculture and Rural Affairs; National Aquaculture Technology Promotion Station. Chinese Fisheries Society China Fisheries Statistical Yearbook 2023; Ministry of Agriculture and Rural Affairs: Beijing, China, 2023.
- Wang, Y.; Lin, W.; Li, L.; Yang, S.; Huang, H.; Yang, X.; Wu, Y.; Wang, L. Basic Nutrient Composition Analysis of Freshwater Fish Muscles Based on Four Orders and Thirteen Species. Sci. Technol. Food Ind. 2019, 40, 277–283. [Google Scholar]
- Johnston, I.A. Genetic and environmental determinants of muscle growth patterns. Fish Physiol. 2001, 18, 141–186. [Google Scholar]
- Yi, C.; Huang, D.; Yu, H.; Gu, J.; Liang, H.; Ren, M. Enzymatically Hydrolyzed Poultry By-Product Supplementation, Instead of Fishmeal, Alone Improves the Quality of Largemouth Bass (Micropterus salmoides) Back Muscle without Compromising Growth. Foods 2023, 12, 3485. [Google Scholar] [CrossRef] [PubMed]
- Xie, Q.; Liu, Y. Effect of Body Weight on the Nutritional Content of Rice Field Eel, Monopterus albus. Aquacult. Res. 2023, 2023, 9928273. [Google Scholar] [CrossRef]
- Wang, Z.; Qiao, F.; Zhang, W.-B.; Parisi, G.; Du, Z.-Y.; Zhang, M.-L. The Flesh Texture of Teleost Fish: Characteristics and Interventional Strategies. Rev. Aquacult. 2024, 16, 508–535. [Google Scholar] [CrossRef]
- Mutlu, A.S.; Duffy, J.; Wang, M.C. Lipid Metabolism and Lipid Signals in Aging and Longevity. Dev. Cell 2021, 56, 1394–1407. [Google Scholar] [CrossRef] [PubMed]
- Sarri, L.; Balcells, J.; Seradj, A.R.; de la Fuente, G. Protein Turnover in Pigs: A Review of Interacting Factors. J. Anim. Physiol. Anim. Nutr. 2024, 108, 451–469. [Google Scholar] [CrossRef]
- Kiessling, A.; Pickova, J.; Eales, J.G.; Dosanjh, B.; Higgs, D. Age, Ration Level, and Exercise Affect the Fatty Acid Profile of Chinook Salmon (Oncorhynchus tshawytscha) Muscle Differently. Aquaculture 2005, 243, 345–356. [Google Scholar] [CrossRef]
- Rao, J. Comparative Study on Muscle Quality of Crayfish (Procambarus clarkii) in Different Culture Stages. Master’s Dissertation, Sichuan Agricultural University, Yaan, China, 2021. [Google Scholar]
- Wang, K. Studies on Meat Quality and Related Candidate Gene of Culter alburnus in Xingkai Lake. Ph.D. Dissertation, Northeast Agricultural University, Harbin, China, 2013. [Google Scholar]
- Aragão, C.; Conceição, L.E.C.; Fyhn, H.-J.; Teresa Dinis, M. Estimated Amino Acid Requirements during Early Ontogeny in Fish with Different Life Styles: Gilthead Seabream (Sparus aurata) and Senegalese Sole (Solea senegalensis). Aquaculture 2004, 242, 589–605. [Google Scholar] [CrossRef]
- Kenari, A.A.; Regenstein, J.M.; Hosseini, S.V.; Rezaei, M.; Tahergorabi, R.; Nazari, R.M.; Mogaddasi, M.; Kaboli, S.A. Amino Acid and Fatty Acid Composition of Cultured Beluga (Huso huso) of Different Ages. J. Aquat. Food Prod. Technol. 2009, 18, 245–265. [Google Scholar] [CrossRef]
- Gao, X. Amino Acid Content and Composition in Female American Shad, Alosa sapidissima, at Different Stages of Ovarian Development. Open J. Fish. Res. 2019, 6, 163–171. [Google Scholar] [CrossRef]
- Periago, M.J.; Ayala, M.D.; López-Albors, O.; Abdel, I.; Martínez, C.; García-Alcázar, A.; Ros, G.; Gil, F. Muscle Cellularity and Flesh Quality of Wild and Farmed Sea Bass, Dicentrarchus labrax L. Aquaculture 2005, 249, 175–188. [Google Scholar] [CrossRef]
- Johnston, I.A.; Li, X.; Vieira, V.L.A.; Nickell, D.; Dingwall, A.; Alderson, R.; Campbell, P.; Bickerdike, R. Muscle and Flesh Quality Traits in Wild and Farmed Atlantic Salmon. Aquaculture 2006, 256, 323–336. [Google Scholar] [CrossRef]
- López-Albors, O.; Abdel, I.; Periago, M.J.; Ayala, M.D.; Alcázar, A.G.; Graciá, C.M.; Nathanailides, C.; Vázquez, J.M. Temperature Influence on the White Muscle Growth Dynamics of the Sea Bass Dicentrarchus labrax, L. Flesh Quality Implications at Commercial Size. Aquaculture 2008, 277, 39–51. [Google Scholar] [CrossRef]
- Rincón, L.; Castro, P.L.; Álvarez, B.; Hernández, M.D.; Álvarez, A.; Claret, A.; Guerrero, L.; Ginés, R. Differences in Proximal and Fatty Acid Profiles, Sensory Characteristics, Texture, Colour and Muscle Cellularity between Wild and Farmed Blackspot Seabream (Pagellus bogaraveo). Aquaculture 2016, 451, 195–204. [Google Scholar] [CrossRef]
- Zhao, H.; Xia, J.; Zhang, X.; He, X.; Li, L.; Tang, R.; Chi, W.; Li, D. Diet Affects Muscle Quality and Growth Traits of Grass Carp (Ctenopharyngodon idellus): A Comparison between Grass and Artificial Feed. Front. Physiol. 2018, 9, 283. [Google Scholar] [CrossRef]
- Chen, F.; Lou, Y.; Guan, J.; Lan, X.; Su, Z.; Xu, C.; Li, Y.; Xie, D. Rapeseed and Palm Oils Can Improve the Growth, Muscle Texture, Fatty Acids and Volatiles of Marine Teleost Golden Pompano Fed Low Fish Oil Diets. Foods 2025, 14, 788. [Google Scholar] [CrossRef]
- He, Z.; Xu, C.; Chen, F.; Lou, Y.; Nie, G.; Xie, D. Dietary DHA Enhanced the Textural Firmness of Common Carp (Cyprinus carpio L.) Fed Plant-Derived Diets through Restraining FoxO1 Pathways. Foods 2022, 11, 3600. [Google Scholar] [CrossRef]
- Liu, J.; Deng, K.; Pan, M.; Liu, G.; Wu, J.; Yang, M.; Huang, D.; Zhang, W.; Mai, K. Dietary Carbohydrates Influence Muscle Texture of Olive Flounder Paralichthys olivaceus Through Impacting Mitochondria Function and Metabolism of Glycogen and Protein. Sci. Rep. 2020, 10, 21811. [Google Scholar] [CrossRef]
- Yu, K.; Wang, C.; Huang, K.; Yang, X.; Luo, Y.; Huang, J.; Wang, D.; Li, J.; Jie, B.; Tang, Z.; et al. Exploring the Muscle-Hardening Mechanisms via the Muscle-Gut Axis in Tilapia (Oreochromis niloticus) Fed with Faba Bean (Vicia faba L.) Supplementary Diets. Aquacult. Rep. 2024, 37, 102268. [Google Scholar] [CrossRef]
- Herawati, V.E.; Nugroho, R.A.; Pinandoyo; Hutabarat, J.; Prayitno, B.; Karnaradjasa, O. The Growth Performance and Nutrient Quality of Asian Swamp Eel Monopterus albus in Central Java Indonesia in a Freshwater Aquaculture System with Different Feeds. J. Aquat. Food Prod. Technol. 2018, 27, 658–666. [Google Scholar] [CrossRef]
- Yang, H.; Yuan, Q.; Rahman, M.M.; Lv, W.; Huang, W.; Hu, W.; Zhou, W. Biochemical, Histological, and Transcriptomic Analyses Reveal Underlying Differences in Flesh Quality between Wild and Farmed Ricefield Eel (Monopterus albus). Foods 2024, 13, 1751. [Google Scholar] [CrossRef] [PubMed]
- Shi, Y.; Zhong, L.; Zhang, J.; Ma, X.; Zhong, H.; Peng, M.; He, H.; Hu, Y. Substitution of Fish Meal with Krill Meal in Rice Field Eel (Monopterus albus) Diets: Effects on Growth, Immunity, Muscle Textural Quality, and Expression of Myogenic Regulation Factors. Anim. Feed Sci. Technol. 2021, 280, 115047. [Google Scholar] [CrossRef]
- Hu, Y.; Zhang, J.; Zhong, L.; Chu, W.; Hu, Y. A Study on Methionine-Mediated Regulation of Muscle Fiber Growth, Development and Differentiation in the Rice Field Eel (Monopterus albus). Aquaculture 2022, 547, 737430. [Google Scholar] [CrossRef]
- Mao, Y.; Lv, W.; Huang, W.; Yuan, Q.; Yang, H.; Zhou, W.; Li, M. Effects on Growth Performance and Immunity of Monopterus albus after High Temperature Stress. Front. Physiol. 2024, 15, 1397818. [Google Scholar] [CrossRef]
- GB:5009.168-2016; National Food Safety Standard-Determination of Fatty Acids in Food. Standards Press of China: Beijing, China, 2016.
- Fu, D.; Shen, Y.; Wan, Y.; Zhang, L.; Xu, Z.; Zhang, W.; Xia, W. Determination of amino acids in mannatide by online pre-column OPA-FMOC derivatization HPLC. Chin. J. Anal. Lab. 2016, 35, 353–356. [Google Scholar]
- NY/T 2890-2016; Determination of Gamma Aminobutyric Acid in Rice-HPLC. Standards Press of China: Beijing, China, 2016.
- GB 5009.128-2016; National Food Safety Standard-Determination of Cholesterol in Food. Standards Press of China: Beijing, China, 2016.
- Witak, B. Tissue Composition of Carcass, Meat Quality and Fatty Acid Content of Ducks of a Commercial Breeding Line at Different Age. Arch. Anim. Breed. 2008, 51, 266–275. [Google Scholar] [CrossRef]
- Kulma, M.; Kouřimská, L.; Homolková, D.; Božik, M.; Plachý, V.; Vrabec, V. Effect of Developmental Stage on the Nutritional Value of Edible Insects. A Case Study with Blaberus craniifer and Zophobas morio. J. Food Compos. Anal. 2020, 92, 103570. [Google Scholar] [CrossRef]
- Meyer-Rochow, V.B.; Gahukar, R.T.; Ghosh, S.; Jung, C. Chemical Composition, Nutrient Quality and Acceptability of Edible Insects Are Affected by Species, Developmental Stage, Gender, Diet, and Processing Method. Foods 2021, 10, 1036. [Google Scholar] [CrossRef]
- Lim, W.; Mudge, K.W.; Vermeylen, F. Effects of Population, Age, and Cultivation Methods on Ginsenoside Content of Wild American Ginseng (Panax quinquefolium). J. Agric. Food Chem. 2005, 53, 8498–8505. [Google Scholar] [CrossRef] [PubMed]
- Lu, X.; Zhao, C.; Shi, H.; Liao, Y.; Xu, F.; Du, H.; Xiao, H.; Zheng, J. Nutrients and Bioactives in Citrus Fruits: Different Citrus Varieties, Fruit Parts, and Growth Stages. Crit. Rev. Food Sci. Nutr. 2023, 63, 2018–2041. [Google Scholar] [CrossRef]
- Mao, G.; Zhao, W. Comparison on Muscle Quality of Longchang, Taihu and New Taihu Goose. Anim. Sci. Vet. Med. 2000, 17, 16–19. [Google Scholar]
- Xu, Y.; Han, J.; Chen, H.; Zhong, Y.; Ding, Z. Effect and Mechanism of Highly Unsaturated Fatty Acids on Growth, Development and Reproduction in Aquatic Animals. Fish. Sci. 2018, 37, 271–277. [Google Scholar]
- Lunn, J.; Theobald, H.E. The Health Effects of Dietary Unsaturated Fatty Acids. Nutr. Bull. 2006, 31, 178–224. [Google Scholar] [CrossRef]
- Coniglio, S.; Shumskaya, M.; Vassiliou, E. Unsaturated Fatty Acids and Their Immunomodulatory Properties. Biology 2023, 12, 279. [Google Scholar] [CrossRef] [PubMed]
- Wood, J.D.; Richardson, R.I.; Nute, G.R.; Fisher, A.V.; Campo, M.M.; Kasapidou, E.; Sheard, P.R.; Enser, M. Effects of Fatty Acids on Meat Quality: A Review. Meat Sci. 2004, 66, 21–32. [Google Scholar] [CrossRef]
- Department of Health Großbritannien. Nutritional Aspects of Cardiovascular Disease; HM Stationery Office: Norwich, UK, 1994.
- Enser, M.; Hallett, K.; Hewitt, B.; Fursey, G.A.J.; Wood, J.D. Fatty Acid Content and Composition of English Beef, Lamb and Pork at Retail. Meat Sci. 1996, 42, 443–456. [Google Scholar] [CrossRef]
- Zhao, F.; Zhuang, P.; Song, C.; Shi, Z.; Zhang, L. Amino acid and fatty acid compositions and nutritional quality of muscle in the pomfret, Pampus punctatissimus. Food Chem. 2010, 118, 224–227. [Google Scholar] [CrossRef]
- De Carvalho, C.C.C.R.; Caramujo, M.J. The Various Roles of Fatty Acids. Molecules 2018, 23, 2583. [Google Scholar] [CrossRef]
- Barrientos Moreno, L.; Espinosa-Urgel, M. Biofilm Stress Responses Associated to Aromatic Hydrocarbons. In Cellular Ecophysiology of Microbe: Hydrocarbon and Lipid Interactions. Handbook of Hydrocarbon and Lipid Microbiology; Springer: Cham, Switzerland, 2018; pp. 105–115. [Google Scholar]
- Cao, D.; Kevala, K.; Kim, J.; Moon, H.-S.; Jun, S.B.; Lovinger, D.; Kim, H.-Y. Docosahexaenoic Acid Promotes Hippocampal Neuronal Development and Synaptic Function. J. Neurochem. 2009, 111, 510–521. [Google Scholar] [CrossRef] [PubMed]
- Johnson, M. Omega-3, Omega-6 and Omega-9 Fatty Acids: Implications for Cardiovascular and Other Diseases. J. Glycom. Lipidom. 2014, 4, 1000123. [Google Scholar] [CrossRef]
- Rutherfurd, S.M.; Gilani, G.S. Amino acid analysis. Curr. Protoc. Protein Sci. 2009, 58, 11.9.1–11.9.37. [Google Scholar] [CrossRef] [PubMed]
- Webb, K.E., Jr. Intestinal Absorption of Protein Hydrolysis Products: A Review. J. Anim. Sci. 1990, 68, 3011–3022. [Google Scholar] [CrossRef]
- Sun, W.; Shahrajabian, M.H.; Kuang, Y.; Wang, N. Amino Acids Biostimulants and Protein Hydrolysates in Agricultural Sciences. Plants 2024, 13, 210. [Google Scholar] [CrossRef] [PubMed]
- Andorsky, D.J.; Lund, D.P.; Lillehei, C.W.; Jaksic, T.; DiCanzio, J.; Richardson, D.S.; Collier, S.B.; Lo, C.; Duggan, C. Nutritional and Other Postoperative Management of Neonates with Short Bowel Syndrome Correlates with Clinical Outcomes. J. Pediatr. 2001, 139, 27–33. [Google Scholar] [CrossRef]
- Zhang, Y.; Li, Y.; Quan, Z.; Xiao, P.; Duan, J.-A. New Insights into Antioxidant Peptides: An Overview of Efficient Screening, Evaluation Models, Molecular Mechanisms, and Applications. Antioxidants 2024, 13, 203. [Google Scholar] [CrossRef]
- Apostolopoulos, V.; Bojarska, J.; Chai, T.-T.; Elnagdy, S.; Kaczmarek, K.; Matsoukas, J.; New, R.; Parang, K.; Lopez, O.P.; Parhiz, H.; et al. A Global Review on Short Peptides: Frontiers and Perspectives. Molecules 2021, 26, 430. [Google Scholar] [CrossRef]
- Elango, R.; Ball, R.O.; Pencharz, P.B. Amino Acid Requirements in Humans: With a Special Emphasis on the Metabolic Availability of Amino Acids. Amino Acids. 2009, 37, 19–27. [Google Scholar] [CrossRef]
- Yuan, Y.; Tong, Q.; Xu, Q.; Ge, S.; Sun, H.; Shan, H.; Zhang, K. The Research on the Alteration of Plasma Levels of Glutamic Acid, Aspartic Acid and γ-aminobutyricAcid in Early Parkinson’s Disease Patients and Its Diagnostic Value. Chin. J. Clin. Neurosci. 2013, 21, 601–605. [Google Scholar]
- Zhao, J.; Li, X.; Peng, S.; Zheng, X.; Li, B.; Wei, J.; Leng, X. Comparative Study on The Utilization of Different Lysine Sources by Channel Catfish (Ictalurus punctatus). Acta Hydrobiol. Sin. 2016, 40, 19–26. [Google Scholar] [CrossRef]
- Rønnestad, I.; Fyhn, H.J.; Gravningen, K. The Importance of Free Amino Acids to the Energy Metabolism of Eggs and Larvae of Turbot (Scophthalmus maximus). Mar. Biol. 1992, 114, 517–525. [Google Scholar] [CrossRef]
- Sallam, M.Y.; El-Gowilly, S.M.; Abdel-Galil, A.-G.A.; El-Mas, M.M. Central GABAA Receptors Are Involved in Inflammatory and Cardiovascular Consequences of Endotoxemia in Conscious Rats. Naunyn-Schmiedeberg’s Arch. Pharmacol. 2016, 389, 279–288. [Google Scholar] [CrossRef] [PubMed]
- Sarasa, S.B.; Mahendran, R.; Muthusamy, G.; Thankappan, B.; Selta, D.R.F.; Angayarkanni, J. A Brief Review on the Non-Protein Amino Acid, Gamma-Amino Butyric Acid (GABA): Its Production and Role in Microbes. Curr. Microbiol. 2020, 77, 534–544. [Google Scholar] [CrossRef]
- Savage, K.; Firth, J.; Stough, C.; Sarris, J. GABA-Modulating Phytomedicines for Anxiety: A Systematic Review of Preclinical and Clinical Evidence. Phytother. Res. 2018, 32, 3–18. [Google Scholar] [CrossRef]
- Norlin, M.; Wikvall, K. Enzymes in the Conversion of Cholesterol into Bile Acids. Curr. Mol. Med. 2007, 7, 199–218. [Google Scholar] [CrossRef]
- Mukhopadhyay, S.; Maitra, U. Chemistry and Biology of Bile Acids. Curr. Sci. 2004, 87, 1666–1683. [Google Scholar]
- Warren, T.; McAllister, R.; Morgan, A.; Rai, T.S.; McGilligan, V.; Ennis, M.; Page, C.; Kelly, C.; Peace, A.; Corfe, B.M.; et al. The Interdependency and Co-Regulation of the Vitamin D and Cholesterol Metabolism. Cells 2021, 10, 2007. [Google Scholar] [CrossRef]
- Terao, T.; Nakamura, J.; Yoshimura, R.; Ohmori, O.; Takahashi, N.; Kojima, H.; Soeda, S.; Shinkai, T.; Nakano, H.; Okuno, T. Relationship between Serum Cholesterol Levels and Meta-Chlorophenylpiperazine-Induced Cortisol Responses in Healthy Men and Women. Psychiatry Res. 2000, 96, 167–173. [Google Scholar] [CrossRef]
- Isojärvi, H.; Keinänen-Kiukaanniemi, S.; Kallio, M.; Kaikkonen, K.; Jämsä, T.; Korpelainen, J.; Korpelainen, R. Association of Insulin and Cholesterol Levels with Peripheral Nervous System Function in Overweight Adults: A 3-Year Follow-Up. J. Clin. Neurophysiol. 2017, 34, 492. [Google Scholar] [CrossRef]
- Aguilar-Ballester, M.; Herrero-Cervera, A.; Vinué, Á.; Martínez-Hervás, S.; González-Navarro, H. Impact of Cholesterol Metabolism in Immune Cell Function and Atherosclerosis. Nutrients 2020, 12, 2021. [Google Scholar] [CrossRef] [PubMed]
- Gormsen, L.C.; Jensen, M.D.; Schmitz, O.; Møller, N.; Christiansen, J.S.; Nielsen, S. Energy Expenditure, Insulin, and VLDL-Triglyceride Production in Humans. J. Lipid Res. 2006, 47, 2325–2332. [Google Scholar] [CrossRef]
- Ma, H. Cholesterol and Human Health. J. Am. Sci. 2006, 2, 46–50. [Google Scholar]
- Cai, L.; Tong, F.; Tang, T.; Ao, Z.; Wei, Z.; Yang, F.; Shu, Y.; Liu, S.; Mai, K. Comparative Evaluation of Nutritional Value and Flavor Quality of Muscle in Triploid and Diploid Common Carp: Application of Genetic Improvement in Fish Quality. Aquaculture 2021, 541, 736780. [Google Scholar] [CrossRef]
- Wu, Y.; An, Y.; Xiong, S. Research Progress in the Formation and Regulation of Fish Soup Flavor. Food Sci. 2023, 44, 251–260. [Google Scholar]
- Qin, K.; Meng, X.; Xu, Z. Research Progress of Umami Substances and Their Formation Mechanism in Pork. Acta Agric. Zhejiangensis 2024, 36, 719–728. [Google Scholar]
- Stilborn, H.L.; Moran, E.T.; Gous, R.M.; Harrison, M.D. Influence of Age on Carcass (Feather-Free) Amino Acid Content for Two Broiler Strain-Crosses and Sexes. J. Appl. Poult. Res. 2010, 19, 13–23. [Google Scholar] [CrossRef]
- Wu, G. Functional Amino Acids in Growth, Reproduction, and Health. Adv. Nutr. 2010, 1, 31–37. [Google Scholar] [CrossRef]
- Reinitz, G. Relative Effect of Age, Diet, and Feeding Rate on the Body Composition of Young Rainbow Trout (Salmo gairdneri). Aquaculture 1983, 35, 19–27. [Google Scholar] [CrossRef]
- Lin, W.-L.; Zeng, Q.-X.; Zhu, Z.-W.; Song, G.-S. Relation Between Protein Characteristics and Tpa Texture Characteristics of Crisp Grass Carp (Ctenopharyngodon idellus C. Et V) and Grass Carp (Ctenopharyngodon idellus). J. Texture Stud. 2012, 43, 1–11. [Google Scholar] [CrossRef]
- Zhao, L.; Liang, J.; Chen, F.; Tang, X.; Liao, L.; Liu, Q.; Luo, J.; Du, Z.; Li, Z.; Luo, W.; et al. High Carbohydrate Diet Induced Endoplasmic Reticulum Stress and Oxidative Stress, Promoted Inflammation and Apoptosis, Impaired Intestinal Barrier of Juvenile Largemouth Bass (Micropterus salmoides). Fish Shellfish. Immunol. 2021, 119, 308–317. [Google Scholar] [CrossRef] [PubMed]
- Qi, J.; Li, C.; Chen, Y.; Gao, F.; Xu, X.; Zhou, G. Changes in Meat Quality of Ovine Longissimus dorsi Muscle in Response to Repeated Freeze and Thaw. Meat Sci. 2012, 92, 619–626. [Google Scholar] [CrossRef] [PubMed]
- Hatae, K.; Yoshimatsu, F.; Matsumoto, J.J. Role of Muscle Fibers in Contributing Firmness of Cooked Fish. J. Food Sci. 1990, 55, 693–696. [Google Scholar] [CrossRef]
- Bugeon, J.; Lefevre, F.; Fauconneau, B. Fillet Texture and Muscle Structure in Brown Trout (Salmo trutta) Subjected to Long-Term Exercise. Aquacult. Res. 2003, 34, 1287–1295. [Google Scholar] [CrossRef]
- Mørkøre, T.; Ruohonen, K.; Kiessling, A. Variation in Texture of Farmed Atlantic Salmon (Salmo salar L.) Relevance of Muscle Fiber Cross-Sectional Area. J. Texture Stud. 2009, 40, 1–15. [Google Scholar] [CrossRef]
- Kim, G.D.; Overholt, M.F.; Lowell, J.E.; Harsh, B.N.; Klehm, B.J.; Dilger, A.C.; Boler, D.D. Evaluation of Muscle Fiber Characteristics Based on Muscle Fiber Volume in Porcine Longissimus Muscle in Relation to Pork Quality. Meat Muscle Biol. 2018, 2, 362. [Google Scholar] [CrossRef]
- Żochowska-Kujawska, J.; Lachowicz, K.; Sobczak, M.; Gajowiecki, L. Effects of Carcass Weight and Muscle on Texture, Structure, Rheological Properties and Myofibre Characteristics of Roe Deer. Am. J. Anim. Vet. Sci. 2007, 2, 114–120. [Google Scholar]
- Migdal, W.; Rozycki, M.; Mucha, A.; Tyra, M.; Natonek-Wisniewska, M.; Walczycka, M.; Kulawik, P.; Wesierska, E.; Zajac, M.; Tkaczewska, J.; et al. Meat Texture Profile and Cutting Strength Analyses of Pork Depending on Breed and Age. Ann. Anim. Sci. 2020, 20, 677–692. [Google Scholar] [CrossRef]
- Maltin, C.A.; Sinclair, K.D.; Warriss, P.D.; Grant, C.M.; Porter, A.D.; Delday, M.I.; Warkup, C.C. The Effects of Age at Slaughter, Genotype and Finishing System on the Biochemical Properties, Muscle Fibre Type Characteristics and Eating Quality of Bull Beef from Suckled Calves. Anim. Sci. 1998, 66, 341–348. [Google Scholar] [CrossRef]
- Wu, J.-Y.; Feng, L.; Wu, P.; Liu, Y.; Ren, H.-M.; Jin, X.-W.; Jiang, J.; Kuang, S.-Y.; Li, S.-W.; Tang, L.; et al. Modification of Beneficial Fatty Acid Composition and Physicochemical Qualities in the Muscle of Sub-Adult Grass Carp (Ctenopharyngodon idella): The Role of Lipids. Aquaculture 2022, 561, 738656. [Google Scholar] [CrossRef]
- Yang, R.; Chen, Y.; Sun, C.; Zhang, L.; Liu, G.; Cao, M. Quality Change of Sea Bass (Lateolabrax japonicas) Muscle during Cold Storage at 4 °C. Food Sci. 2023, 44, 239–245. [Google Scholar]
Disclaimer/Publisher’s Note: The statements, opinions and data contained in all publications are solely those of the individual author(s) and contributor(s) and not of MDPI and/or the editor(s). MDPI and/or the editor(s) disclaim responsibility for any injury to people or property resulting from any ideas, methods, instructions or products referred to in the content. |
© 2025 by the authors. Licensee MDPI, Basel, Switzerland. This article is an open access article distributed under the terms and conditions of the Creative Commons Attribution (CC BY) license (https://creativecommons.org/licenses/by/4.0/).