
Discrimination between the Triglyceride Form and the Ethyl Ester Form of Fish Oil Using Chromatography–Mass Spectrometry
Abstract
1. Introduction
2. Materials and Methods
2.1. Materials and Reagents
2.2. Methods
2.2.1. Fatty Acid Analysis
Sample Preparation
GC–MS Analysis
Identification of Fatty Acids
Quantification of Fatty Acids
2.2.2. Analysis of TAGs and EEs
Sample Preparation
HPLC–MS Analysis
Identification and Quantification of TAGs
Identification and Quantification of EEs
3. Result and Discussion
3.1. Quantification of Fatty Acids in Fish Oil Using GC–MS
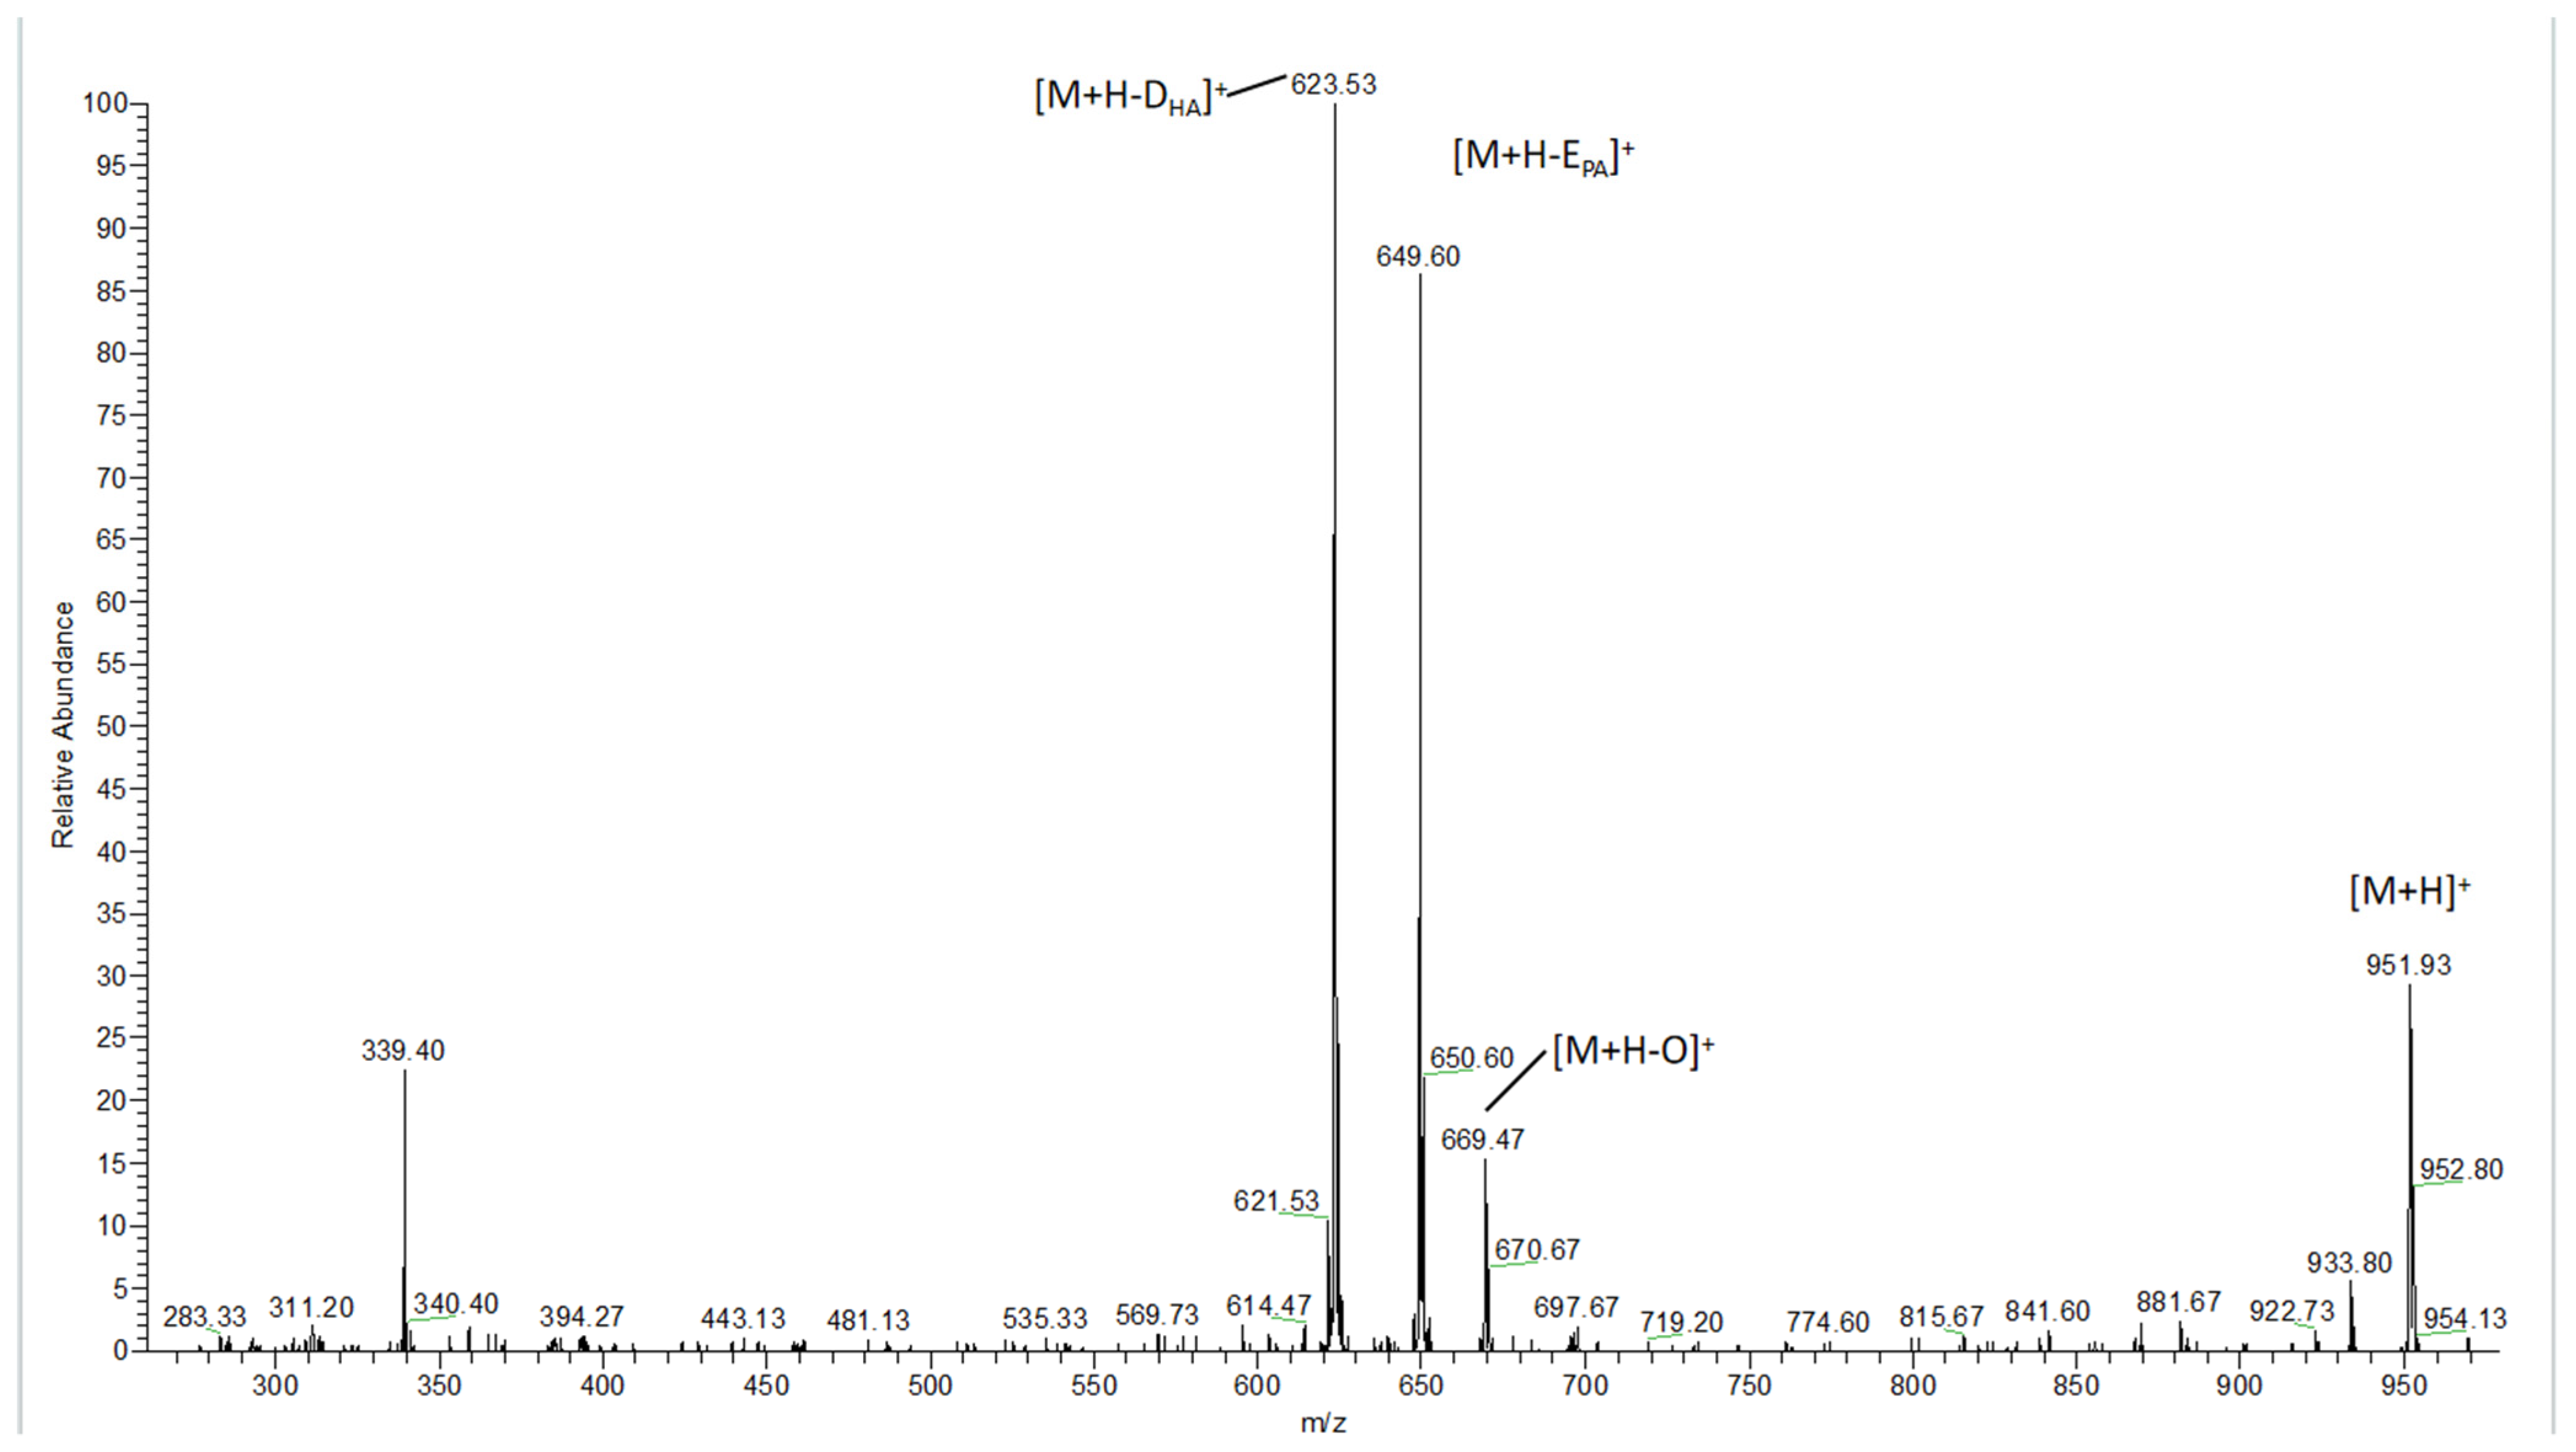
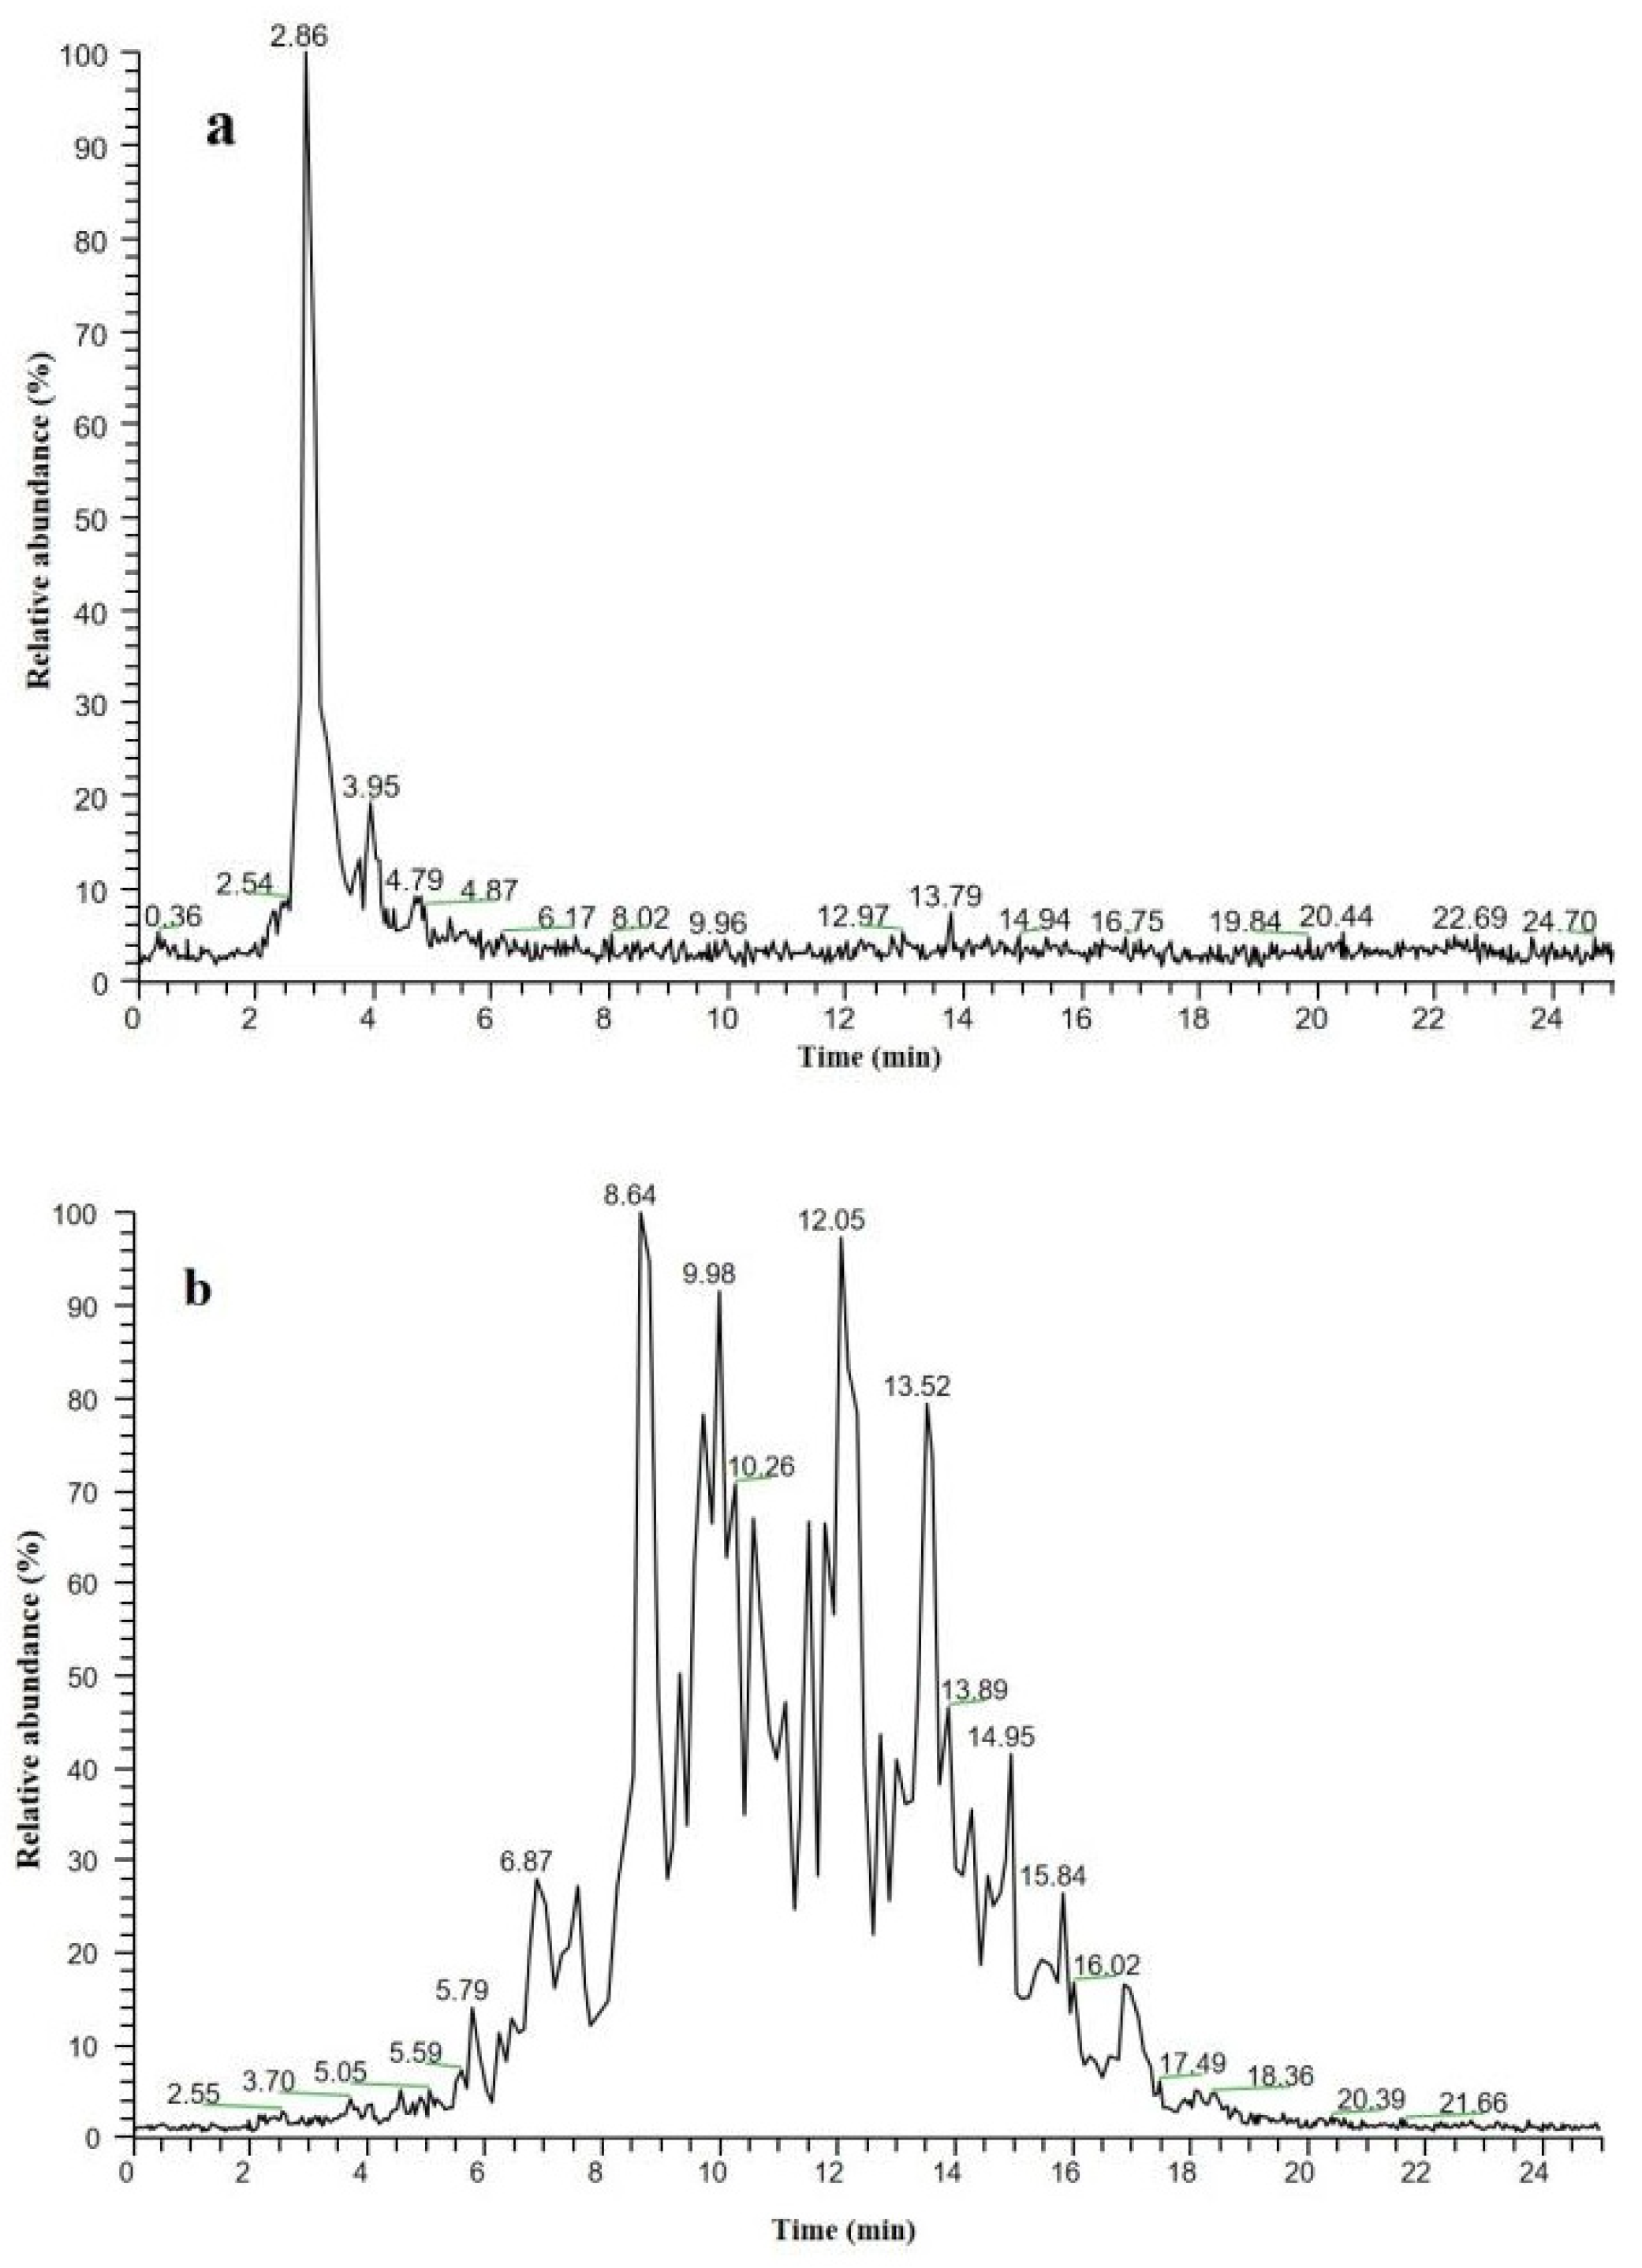
3.2. Detection of TAGS in Fish Oil Using HPLC–MS
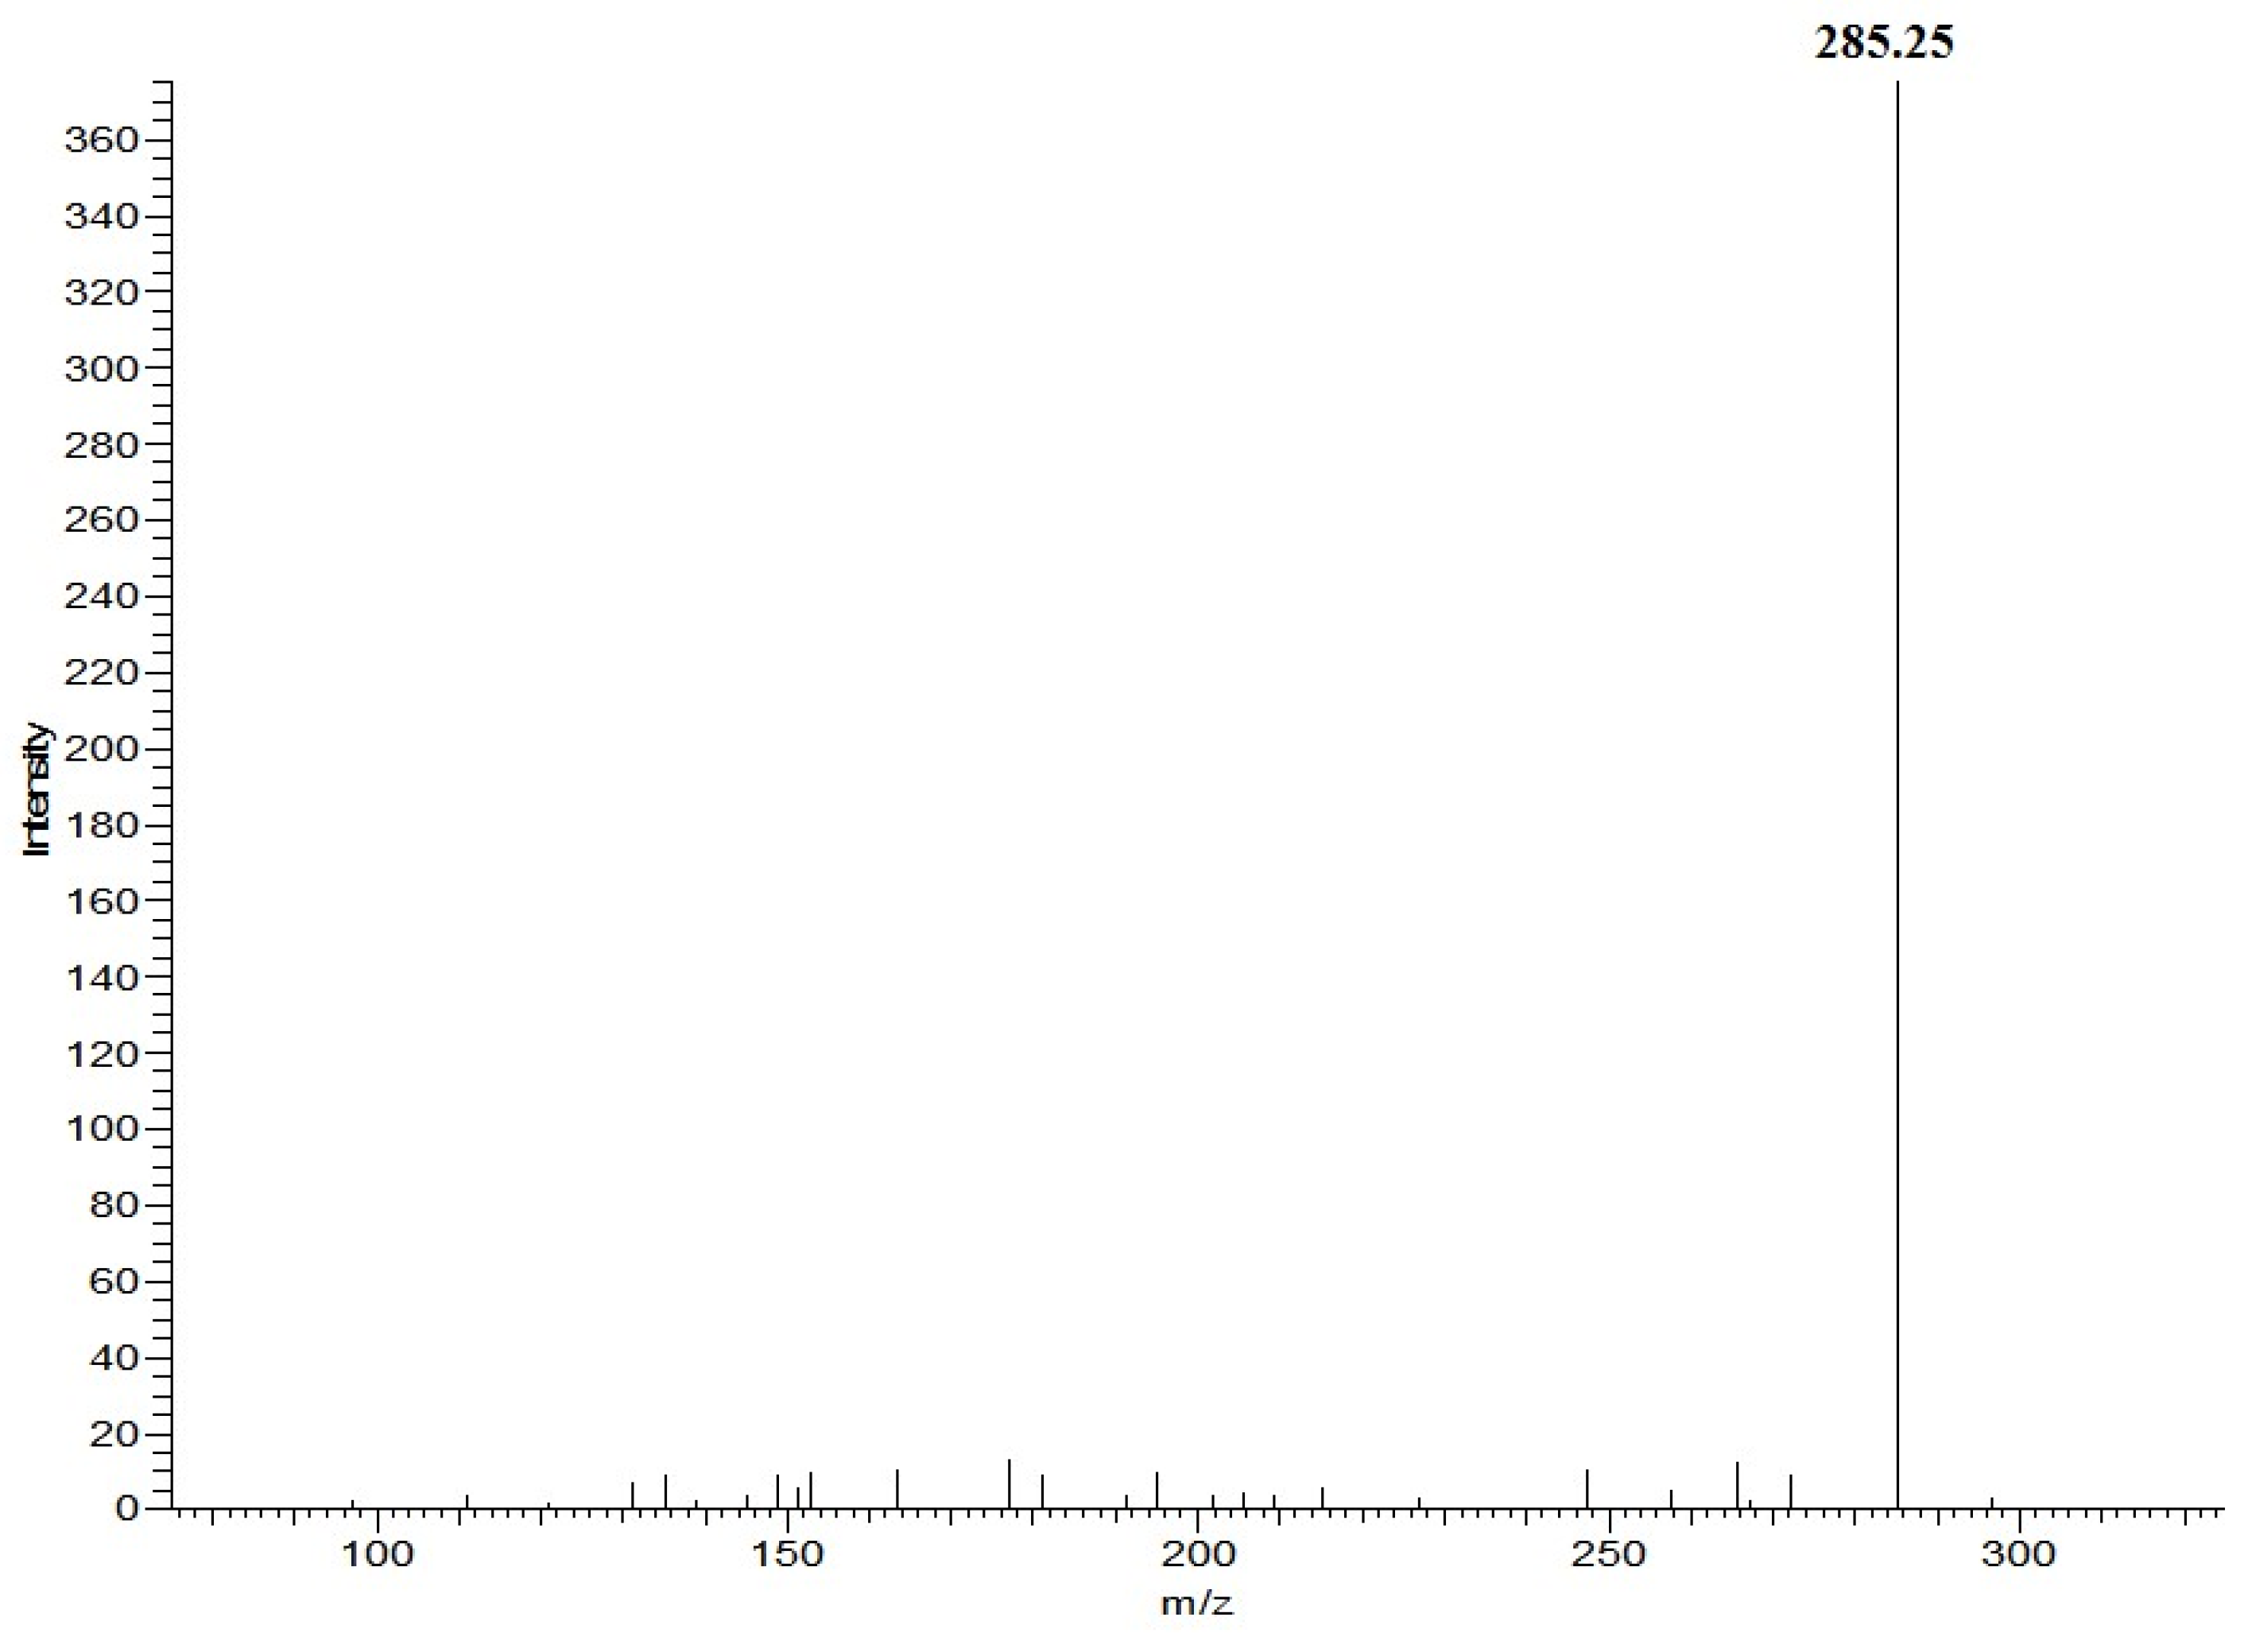
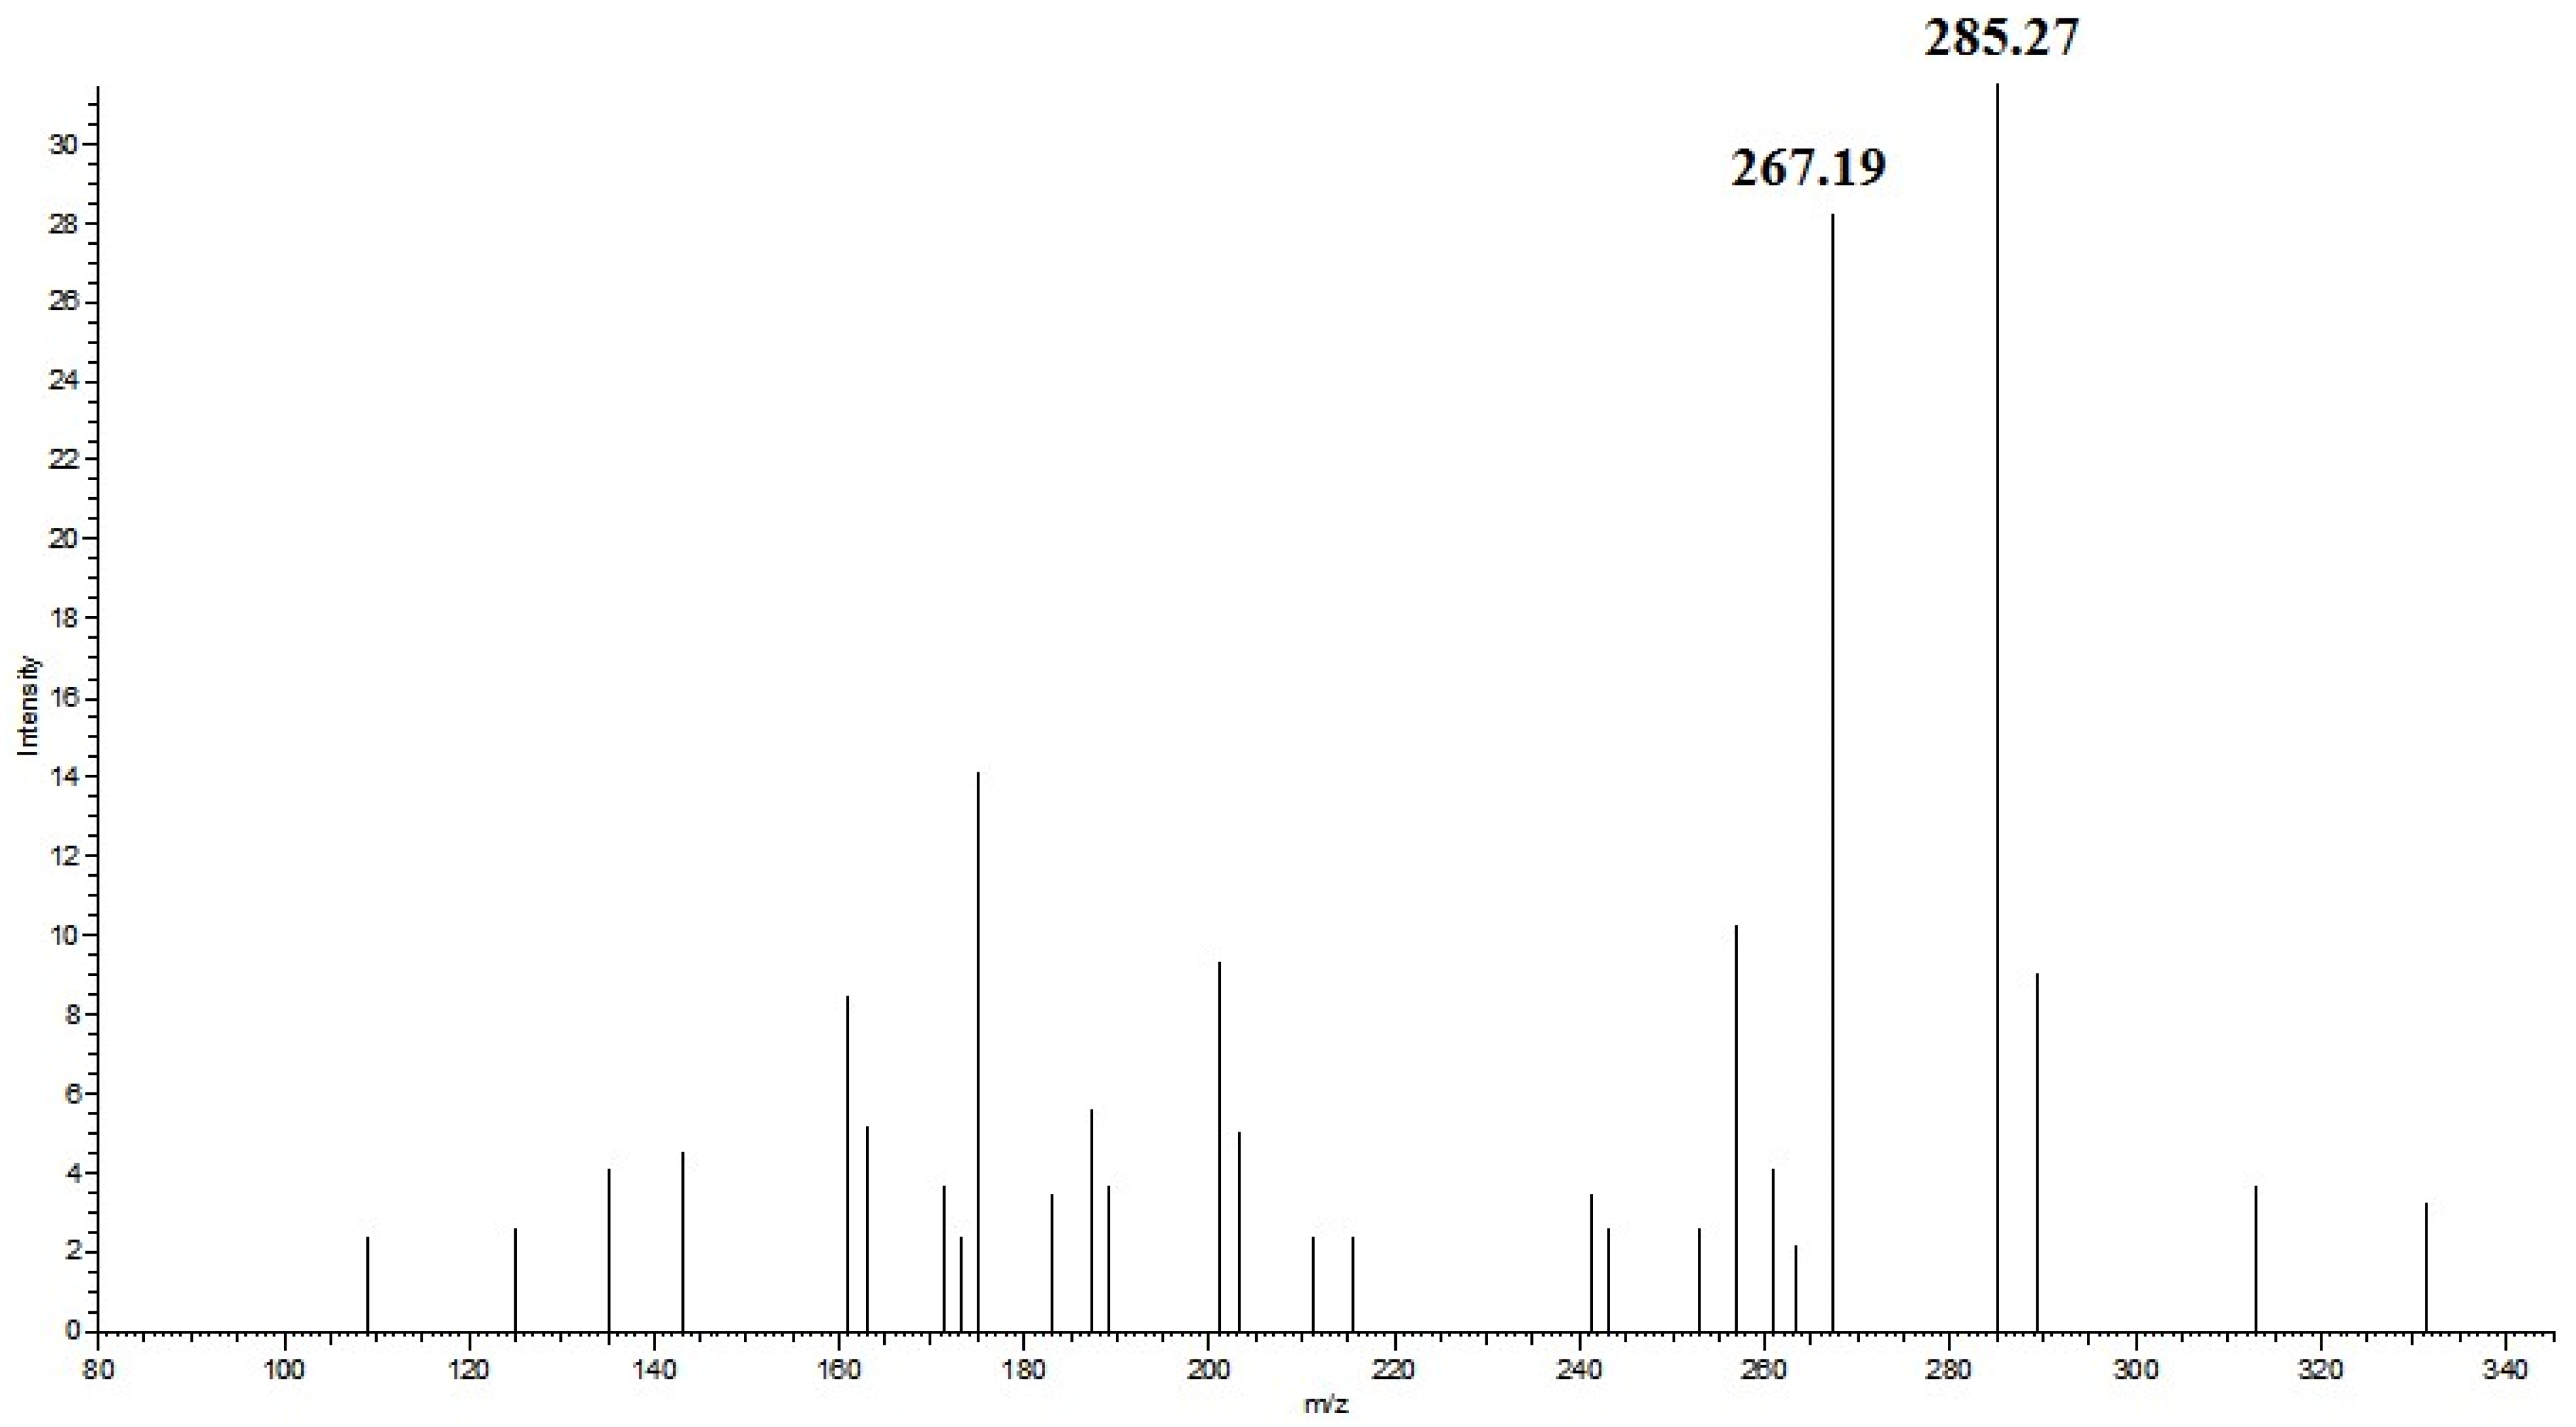
3.3. Detection of the Fatty Acid Ethyl Ester in Fish Oil Using HPLC–MS
3.4. Comparison of Components between TGFFO and EEFFO
3.5. Fish Oil Determination Using Characteristic Lipid Fingerprints
4. Conclusions
Author Contributions
Funding
Institutional Review Board Statement
Informed Consent Statement
Data Availability Statement
Conflicts of Interest
References
- Lu, Y.T.; Zhang, P.J.; Li, W.; Liu, J.; Shang, X.C.; Cheng, Y.; Li, Y.H. Comparison of gut microbial communities, free amino acids or fatty acids contents in the muscle of wild from Xinlicheng reservoir and Chagan lake. BMC Microbiol. 2022, 22, 32. [Google Scholar] [CrossRef] [PubMed]
- Zou, L.G.; Wang, Q.; Weng, L.P.; Wang, T.H.; Qiu, J.; Liu, J.B.; Jiang, H.Y.; Wu, Y.F. Quality evaluation and lipidomics analysis of salted duck egg yolk under low-salt pickling process. Food Chem. X 2022, 16, 100502. [Google Scholar]
- Kelsey, M.D.; Pagidipati, N.J. Should We “RESPECT EPA” More Now? EPA and DHA for Cardiovascular Risk Reduction. Curr. Cardiol. Rep. 2023, 25, 1601–1609. [Google Scholar] [PubMed]
- Erbay, M.I.; Valverde, N.N.G.; Patel, P.; Ozkan, H.S.; Wilson, A.; Banerjee, S.; Babazade, A.; Londono, V.; Sood, A.; Gupta, R. Fish Oil Derivatives in Hypertriglyceridemia: Mechanism and Cardiovascular Prevention: What Do Studies Say? Curr. Prob. Cardiol. 2024, 49, 102066. [Google Scholar] [CrossRef] [PubMed]
- Das, T.; Dvoretskiy, S.; Chen, C.; Luo, M.H.; Pereira, S.L. Fish Oil, Plant Polyphenols, and Their Combinations Have No Tumor Growth Promoting Effects on Human Lung and Colon Carcinoma Xenograft Mice. J. Diet. Suppl. 2023, 20, 459–474. [Google Scholar] [CrossRef] [PubMed]
- Zhou, G.D.; Jiang, W.W.; Xia, G.B.; Wang, L.H.; Richardson, M.; Chu, C.; Moorthy, B. Attenuation of Polycyclic Aromatic Hydrocarbon (PAH)-Mediated Pulmonary DNA Adducts and Cytochrome P450 (CYP)1B1 by Dietary Antioxidants, Omega-3 Fatty Acids, in Mice. Antioxidants 2022, 11, 119. [Google Scholar] [CrossRef]
- Nolan, J.M.; Power, R.; Howard, A.N.; Bergin, P.; Roche, W.; Prado-Cabrero, A.; Pope, G.; Cooke, J.; Power, T.; Mulcahy, R. Supplementation With Carotenoids, Omega-3 Fatty Acids, and Vitamin E Has a Positive Effect on the Symptoms and Progression of Alzheimer’s Disease. J. Alzheimers Dis. 2022, 90, 233–249. [Google Scholar] [CrossRef] [PubMed]
- Erhardt, R.; Cardoso, B.R.; Meyer, B.J.; Brownell, S.; O’Connell, S.; Mirzaee, S.; Duckham, R.L.; Macpherson, H. Omega-3 Long-Chain Polyunsaturated Fatty Acids: Are They Beneficial for Physical and Cognitive Functioning in Older Adults? J. Nutr. Health Aging. 2021, 25, 454–461. [Google Scholar] [CrossRef]
- Kawashima, M.; Nakamura, S.; Izuta, Y.; Inoue, S.; Tsubota, K. Dietary Supplementation with a Combination of Lactoferrin, Fish Oil, and WB2000 for Treating Dry Eye: A Rat Model and Human Clinical Study. Ocul. Surf. 2016, 14, 255–263. [Google Scholar] [CrossRef]
- Baykalir, B.G.; Ciftci, O.; Cetin, A.; Turkmen, N.B. The protective effect of fish oil against cisplatin induced eye damage in rats. Cutan. Ocul. Toxicol. 2018, 37, 151–156. [Google Scholar] [CrossRef]
- Mickleborough, T.D.; Lindley, M.R.; Montgomery, G.S. Effect of Fish Oil-Derived Omega-3 Polyunsaturated Fatty Acid Supplementation on Exercise-Induced Bronchoconstriction and Immune Function in Athletes. Phys. Sportsmed. 2008, 36, 11–17. [Google Scholar] [CrossRef] [PubMed]
- Cao, S.G.; Ren, J.A.; Sun, L.Q.; Gu, G.S.; Yuan, Y.J.; Li, J.S. Fish Oil-Supplemented Parenteral Nutrition Prolongs Survival While Beneficially Altering Phospholipids’ Fatty Acid Composition and Modulating Immune Function in Rat Sepsis. Shock 2011, 36, 184–190. [Google Scholar] [CrossRef] [PubMed]
- Farag, M.R.; Mahmoud, H.K.; El-Sayed, S.A.A.; Ahmed, S.Y.A.; Alagawany, M.; Abou-Zeid, S.M. Neurobehavioral, physiological and inflammatory impairments in response to bifenthrin intoxication in fish: Role of dietary supplementation with essential oil. Aquat. Toxicol. 2021, 231, 105715. [Google Scholar] [CrossRef] [PubMed]
- Fatel, E.C.S.; Rosa, F.T.; Alfieri, D.F.; Flauzino, T.; Scavuzzi, B.M.; Lozovoy, M.A.B.; Iriyoda, T.M.V.; Simao, A.N.C.; Dichi, I. Beneficial effects of fish oil and cranberry juice on disease activity and inflammatory biomarkers in people with rheumatoid arthritis. Nutrition 2021, 86, 111183. [Google Scholar] [CrossRef] [PubMed]
- Cai, H.; Zhu, Y.S.; Qin, L.X.; Luo, B.Z.; Liu, H.; Wu, C.F.; He, G.S. Risk-benefit assessment of methylmercury and n-3 polyunsaturated fatty acids through fish intake by pregnant women in Shanghai, China: Findings from the Shanghai Diet and Health Survey. Food Chem. Toxicol. 2023, 174, 113668. [Google Scholar] [CrossRef] [PubMed]
- Monnard, C.; Fleith, M. Total Fat and Fatty Acid Intake among 1-7-Year-Old Children from 33 Countries: Comparison with International Recommendations. Nutrients 2021, 13, 3547. [Google Scholar] [CrossRef] [PubMed]
- Yi, M.Y.; You, Y.; Zhang, Y.R.; Wu, G.C.; Karrar, E.; Zhang, L.; Zhang, H.; Jin, Q.Z.; Wang, X.G. Highly Valuable Fish Oil: Formation Process, Enrichment, Subsequent Utilization, and Storage of Eicosapentaenoic Acid Ethyl Esters. Molecules 2023, 28, 672. [Google Scholar] [CrossRef]
- Tang, X.; Li, Z.J.; Xu, J.; Xue, Y.; Li, J.Z.; Wang, J.F.; Yanagita, T.; Xue, C.H.; Wang, Y.M. Short term effects of different omega-3 fatty acid formulation on lipid metabolism in mice fed high or low fat diet. Lipids Health Dis. 2012, 11, 70. [Google Scholar] [CrossRef] [PubMed]
- Schuchardt, J.P.; Schneider, I.; Meyer, H.; Neubronner, J.; von Schacky, C.; Hahn, A. Incorporation of EPA and DHA into plasma phospholipids in response to different omega-3 fatty acid formulations—A comparative bioavailability study of fish oil vs. krill oil. Lipids Health Dis. 2011, 10, 145. [Google Scholar] [CrossRef]
- Ghasemifard, S.; Turchini, G.M.; Sinclair, A.J. Omega-3 long chain fatty acid “bioavailability”: A review of evidence and methodological considerations. Prog. Lipid Res. 2014, 56, 92–108. [Google Scholar] [CrossRef]
- Szczepiorkowski, Z.M.; Dickersin, G.R.; Laposata, M. Fatty-Acid Ethyl-Esters Decrease Human Hepatoblastoma Cell-Proliferation and Protein-Synthesis. Gastroenterology 1995, 108, 515–522. [Google Scholar] [CrossRef] [PubMed]
- Wang, P.R.; Sun, M.; Ren, J.W.; Djuric, Z.; Fisher, G.J.; Wang, X.L.; Li, Y. Gas chromatography-mass spectrometry analysis of effects of dietary fish oil on total fatty acid composition in mouse skin. Sci. Rep. 2017, 7, 42641. [Google Scholar] [CrossRef]
- Rohman, A.; Irnawati; Windarsih, A.; Riswanto, F.D.O.; Indrayanto, G.; Fadzillah, N.A.; Riyanto, S.; Bakar, N.K.A. Application of Chromatographic and Spectroscopic-Based Methods for Analysis of Omega-3 (ω-3 FAs) and Omega-6 (ω-6 FAs) Fatty Acids in Marine Natural Products. Molecules 2023, 28, 5524. [Google Scholar] [CrossRef]
- Jalali-Heravi, M.; Vosough, M. Characterization and determination of fatty acids in fish oil using gas chromatography-mass spectrometry coupled with chemometric resolution techniques. J. Chromatogr. A 2004, 1024, 165–176. [Google Scholar] [CrossRef]
- Yi, T.; Li, S.M.; Fan, J.Y.; Fan, L.L.; Zhang, Z.F.; Luo, P.; Zhang, X.J.; Wang, J.G.; Zhu, L.; Zhao, Z.Z.; et al. Comparative analysis of EPA and DHA in fish oil nutritional capsules by GC-MS. Lipids Health Dis. 2014, 13, 190. [Google Scholar] [CrossRef]
- Thurnhofer, S.; Vetter, W. A gas chromatography/electron ionization-mass spectrometry-selected ion monitoring method for determining the fatty acid pattern in food after formation of fatty acid methyl esters. J. Agric. Food Chem. 2005, 53, 8896–8903. [Google Scholar] [CrossRef] [PubMed]
- Thurnhofer, S.; Vetter, W. Application of ethyl esters and -methyl esters as internal standards for the gas chromatographic quantification of transesterified fatty acid methyl esters in food. J. Agric. Food Chem. 2006, 54, 3209–3214. [Google Scholar] [CrossRef]
- Saini, R.K.; Yu, J.W.; Song, M.H.; Ahn, H.Y.; Lee, J.H.; Keum, Y.S.; Lee, J.H. Profiling of Redox-Active Lipophilic Constituents in Leaf Mustard (Brassica juncea (L.) Czern.) Cultivars Using LC-MS and GC-MS. Antioxidants 2022, 11, 2464. [Google Scholar] [CrossRef] [PubMed]
- Ferracane, A.; Aloisi, I.; Galletta, M.; Zoccali, M.; Tranchida, P.Q.; Micalizzi, G.; Mondello, L. Automated sample preparation and fast GC-MS determination of fatty acids in blood samples and dietary supplements. Anal. Bioanal. Chem. 2022, 414, 8423–8435. [Google Scholar] [CrossRef]
- Zhang, F.P.; Liu, Y.M.; Shi, J.Y.; Wang, H.L.; Zhao, X.E.; Suo, Y.R. Extraction of Channel Catfish Muscle Oil by Supercritical Carbon Dioxide and Determination of Fatty Acids by Gas Chromatography-Electron Ionization-Mass Spectrometry. Chin. J. Anal. Chem. 2010, 38, 163–168. [Google Scholar] [CrossRef]
- Retrato, M.D.C.; Qiu, S.Y.; Lundquist, A.; Muratovic, A.Z.; Rad, F.M.; Ubhayasekera, S.J.K.A.; Bergquist, J. Simultaneous determination of 22 fatty acids in total parenteral nutrition (TPN) components by gas chromatography-mass spectrometry (GC-MS). Anal. Methods-UK. 2023, 15, 2480–2489. [Google Scholar] [CrossRef] [PubMed]
- Sun, X.M.; Zhang, L.X.; Li, P.W.; Xu, B.C.; Ma, F.; Zhang, Q.; Zhang, W. Fatty acid profiles based adulteration detection for flaxseed oil by gas chromatography mass spectrometry. LWT-Food Sci. Technol. 2015, 63, 430–436. [Google Scholar] [CrossRef]
- Indelicato, S.; Bongiorno, D.; Ceraulo, L.; Emmanuello, C.; Mazzotti, F.; Siciliano, C.; Piazzese, D. One-Pot Analysis: A New Integrated Methodology for Determination of TAG and FA Determination through LC/MS and—Saponification. Food Anal. Method. 2018, 11, 873–882. [Google Scholar] [CrossRef]
- Mondello, L.; Casilli, A.; Tranchida, P.Q.; Dugo, P.; Dugo, G. Detailed analysis and group-type separation of natural fats and oils using comprehensive two-dimensional gas chromatography. J. Chromatogr. A 2003, 1019, 187–196. [Google Scholar] [CrossRef] [PubMed]
- Wei, W.; Sun, C.; Jiang, W.D.; Zhang, X.H.; Hong, Y.; Jin, Q.Z.; Tao, G.J.; Wang, X.G.; Yang, Z.N. Triacylglycerols fingerprint of edible vegetable oils by ultra-performance liquid chromatography-Q-ToF-MS. LWT-Food Sci. Technol. 2019, 112, 108261. [Google Scholar] [CrossRef]
- Kalpio, M.; Linderborg, K.M.; Fabritius, M.; Kallio, H.; Yang, B.R. Strategy for stereospecific characterization of natural triacylglycerols using multidimensional chromatography and mass spectrometry. J. Chromatogr. A 2021, 1641, 461992. [Google Scholar] [CrossRef] [PubMed]
- Zeb, A.; Murkovic, M. Analysis of triacylglycerols in refined edible oils by isocratic HPLC-ESI-MS. Eur. J. Lipid Sci. Tech. 2010, 112, 844–851. [Google Scholar] [CrossRef]
- Indelicato, S.; Di Stefano, V.; Avellone, G.; Piazzese, D.; Vazzana, M.; Mauro, M.; Arizza, V.; Bongiorno, D. HPLC/HRMS and GC/MS for Triacylglycerols Characterization of Tuna Fish Oils Obtained from Green Extraction. Foods 2023, 12, 1193. [Google Scholar] [CrossRef] [PubMed]
- Song, R.Z.; Li, W.; Deng, S.G.; Zhao, Y.L.; Tao, N.P. Assessment of lipid composition and eicosapentaenoic acid/docosahexaenoic acid bioavailability in fish oil obtained through different enrichment methods. Front. Nutr. 2023, 10, 1136490. [Google Scholar] [CrossRef]
- Castro-Gómez, M.P.; Holgado, F.; Rodríguez-Alcalá, L.M.; Montero, O.; Fontecha, J. Comprehensive Study of the Lipid Classes of Krill Oil by Fractionation and Identification of Triacylglycerols, Diacylglycerols, and Phospholipid Molecular Species by Using UPLC/QToF-MS. Food Anal. Method. 2015, 8, 2568–2580. [Google Scholar] [CrossRef]
- Azizian, H.; Kramer, J.K.G.; Ehler, S.; Curtis, J.M. Rapid quantitation of fish oil fatty acids and their ethyl esters by FT-NIR models. Eur. J. Lipid Sci. Tech. 2010, 112, 452–462. [Google Scholar] [CrossRef]
- Pragst, F.; Auwaerter, V.; Sporkert, F.; Spiegel, K. Analysis of fatty acid ethyl esters in hair as possible markers of chronically elevated alcohol consumption by headspace solid-phase microextraction (HS-SPME) and gas chromatography-mass spectrometry (GC-MS). Forensic Sci. Int. 2001, 121, 76–88. [Google Scholar] [CrossRef] [PubMed]
- Cabarcos, P.; Alvarez, I.; Bermejo, A.M.; Tabernero, M.J.; López, P.; Fernández, P. Analysis of Fatty Acid Ethyl Esters in Hair by Headspace Solid-Phase Microextraction (HS-SPME) and Gas Chromatography-Mass Spectrometry (GC-MS). Anal. Lett. 2009, 42, 2962–2977. [Google Scholar] [CrossRef]
- Himes, S.K.; Concheiro, M.; Scheidweiler, K.B.; Huestis, M.A. Validation of a novel method to identify in utero ethanol exposure: Simultaneous meconium extraction of fatty acid ethyl esters, ethyl glucuronide, and ethyl sulfate followed by LC-MS/MS quantification. Anal. Bioanal. Chem. 2014, 406, 1945–1955. [Google Scholar] [CrossRef] [PubMed]
- Luginbühl, M.; Schröck, A.; König, S.; Schürch, S.; Weinmann, W. Determination of fatty acid ethyl esters in dried blood spots by LC-MS/MS as markers for ethanol intake: Application in a drinking study. Anal. Bioanal. Chem. 2016, 408, 3503–3509. [Google Scholar] [CrossRef] [PubMed]
- Wang, X.P.; Peng, Q.Z.; Li, P.W.; Zhang, Q.; Ding, X.X.; Zhang, W.; Zhang, L.X. Identification of triacylglycerol using automated annotation of high resolution multistage mass spectral trees. Anal. Chim. Acta. 2016, 940, 84–91. [Google Scholar] [CrossRef]
- Zhang, L.X.; Tan, B.B.; Zeng, M.M.; Lu, H.M.; Liang, Y.Z. Establishment of reliable mass spectra and retention indices library: Identification of fatty acids in human plasma without authentic standards. Talanta 2012, 88, 311–317. [Google Scholar] [CrossRef]


| Samples | Origin | Species |
|---|---|---|
| Fish oil 1 | Peru | Sardines, Anchovies |
| Fish oil 2 | South Pacific | Mackerel, Sardines, Anchovies |
| Fish oil 3 | Norway | Tuna |
| Fish oil 4 | Peru, Chile, Norway | Salmon, codfish |
| Fish oil 5 | Arctic Ocean | codfish |
| Fish oil 6 | Peru | Salmon |
| Fish oil 7 | South Pacific | Salmon |
| Lipid Name | Quantification Parent Ion MS1 [M+H]+ (m/z) | Quantification Product Ion MS2 (m/z) | Qualitative Product Ion MS2 (m/z) | Qualitative Product Ion MS2 (m/z) | |
|---|---|---|---|---|---|
| 1 | TG(16:0 a/14:0/16:1) | 777.7 | 523.5 | 521.5 | 549.5 |
| 2 | TG(16:0/12:0/18:1) | 777.7 | 495.4 | 521.5 | 577.5 |
| 3 | TG(16:0/14:0/16:2) | 775.7 | 523.5 | 547.5 | 519.4 |
| 4 | TG(16:1/14:0/16:2) | 773.7 | 521.5 | 545.5 | 519.4 |
| 5 | TG(16:1/14:0/17:0) | 791.7 | 521.5 | 537.5 | 563.5 |
| 6 | TG(15:0/16:2/16:2) | 785.7 | 533.5 | 543.4 | 533.5 |
| 7 | TG(16:0/16:0/16:1) | 805.7 | 551.5 | 549.5 | 549.5 |
| 8 | TG(16:0/16:1/16:1) | 803.7 | 549.5 | 547.5 | 549.5 |
| 9 | TG(16:1/16:1/16:1) | 801.7 | 547.5 | 547.5 | 547.5 |
| 10 | TG(16:1/17:0/17:0) | 833.8 | 563.5 | 579.5 | 563.5 |
| 11 | TG(18:1/14:0/18:1) | 831.7 | 549.5 | 549.5 | 603.5 |
| 12 | TG(16:0/14:0/20:5) | 825.7 | 523.5 | 569.5 | 597.5 |
| 13 | TG(16:1/14:0/20:5) | 823.7 | 521.5 | 569.5 | 595.5 |
| 14 | TG(16:2/14:0/20:5) | 821.7 | 519.4 | 593.5 | 569.5 |
| 15 | TG(15:0/16:0/20:5) | 839.7 | 537.5 | 597.5 | 583.5 |
| 16 | TG(12:0/20:5/20:5) | 843.6 | 541.4 | 643.5 | 541.4 |
| 17 | TG(16:0/18:1/18:1) | 859.8 | 577.5 | 603.5 | 577.5 |
| 18 | TG(18:0/14:0/20:4) | 855.7 | 551.5 | 571.5 | 627.5 |
| 19 | TG(16:1/14:0/22:6) | 849.7 | 521.5 | 595.5 | 621.5 |
| 20 | TG(12:0/20:5/22:6) | 869.7 | 541.4 | 669.5 | 567.4 |
| 21 | TG(18:0/16:1/20:4) | 881.8 | 577.5 | 597.5 | 627.5 |
| 22 | TG(16:0/18:1/20:5) | 879.7 | 577.5 | 623.5 | 597.5 |
| 23 | TG(16:1/18:1/20:5) | 877.7 | 575.5 | 623.5 | 595.5 |
| 24 | TG(16:1/18:2/20:5) | 875.7 | 573.5 | 621.5 | 595.5 |
| 25 | TG(16:1/16:1/22:6) | 875.7 | 547.5 | 621.5 | 621.5 |
| 26 | TG(17:0/17:0/22:5) | 909.8 | 579.5 | 639.5 | 639.5 |
| 27 | TG(16:0/18:1/22:5) | 907.8 | 577.5 | 625.5 | 651.5 |
| 28 | TG(18:1/18:1/20:5) | 905.8 | 603.5 | 623.5 | 623.5 |
| 29 | TG(16:1/18:2/22:6) | 901.7 | 573.5 | 647.5 | 621.5 |
| 30 | TG(15:0/20:5/22:6) | 911.7 | 583.5 | 669.5 | 609.5 |
| 31 | TG(17:0/18:1/22:6) | 919.8 | 591.5 | 649.5 | 637.5 |
| 32 | TG(18:1/20:5/20:5) | 925.7 | 623.5 | 643.5 | 623.5 |
| 33 | TG(14:0/22:6/22:6) | 923.7 | 595.5 | 695.5 | 595.5 |
| 34 | TG(16:2/20:5/22:6) | 921.7 | 593.5 | 619.5 | 669.5 |
| 35 | TG(18:0/18:1/22:6) | 933.8 | 605.6 | 649.5 | 651.5 |
| 36 | TG(18:0/20:5/22:6) | 953.8 | 625.5 | 669.5 | 651.5 |
| 37 | TG(18:1/20:5/22:6) | 951.7 | 669.5 | 623.5 | 649.5 |
| 38 | TG(16:0/22:6/22:6) | 951.7 | 623.5 | 695.5 | 623.5 |
| 39 | TG(20:5/20:4/20:5) | 947.7 | 645.5 | 645.5 | 643.5 |
| 40 | TG(17:0/22:6/22:6) | 965.8 | 637.5 | 695.5 | 637.5 |
| 41 | TG(18:1/22:6/22:6) | 977.8 | 649.5 | 695.5 | 649.5 |
| 42 | TG(20:5/20:5/22:5) | 973.7 | 671.5 | 643.5 | 671.5 |
| 43 | TG(18:3/22:6/22:6) | 973.7 | 645.5 | 695.5 | 645.5 |
| 44 | TG(20:5/20:5/22:6) | 971.7 | 643.5 | 669.5 | 669.5 |
| 45 | TG(20:5/22:6/22:6) | 997.7 | 669.5 | 695.5 | 669.5 |
| 46 | TG(22:5/22:6/22:6) | 1025.8 | 697.5 | 695.5 | 697.5 |
| 47 | TG(22:6/22:6/22:6) | 1023.7 | 695.5 | 695.5 | 695.5 |
| 48 | TG(17:0/20:5/22:6) | 939.7 | 611.5 | 669.5 | 637.5 |
| 49 | TG(18:0/22:5/22:6) | 981.8 | 653.6 | 651.5 | 697.5 |
| 50 | 18:0 EE b | 313.3 | 285.3 | 267.3 | - c |
| 51 | 18:1 EE | 311.3 | 283.3 | 265.3 | - |
| 52 | 18:3 EE | 307.3 | 279.2 | 261.2 | - |
| 53 | 18:4 EE | 305.2 | 277.2 | 259.2 | - |
| 54 | 20:4 EE | 333.3 | 305.2 | 287.2 | - |
| 55 | 20:5 EE | 331.3 | 285.2 | 303.2 | - |
| 56 | 22:5 EE | 359.3 | 331.3 | 313.3 | - |
| 57 | 22:6 EE | 357.3 | 311.2 | 329.2 | - |
| FA Name | Fish Oil 1 | Fish Oil 2 | Fish Oil 3 | Fish Oil 4 | Fish Oil 5 | Fish Oil 6 | Fish Oil 7 |
|---|---|---|---|---|---|---|---|
| FA Levels (%) ± RSD (%) | FA Levels (%) ± RSD (%) | FA Levels (%) ± RSD (%) | FA Levels (%) ± RSD (%) | FA Levels (%) ± RSD (%) | FA Levels (%) ± RSD (%) | FA Levels (%) ± RSD (%) | |
| 12:0 a | 0.16 ± 4.8 | n.d. f | n.d. | n.d. | n.d. | n.d. | n.d. |
| 14:0 | 11.93 ± 2 | 1.56 ± 5.5 | 11.55 ± 3.6 | 12.08 ± 3.2 | 11.88 ± 3.1 | 11.26 ± 2.5 | 4.66 ± 3.7 |
| 15:0 | 0.72 ± 4.7 | 0.29 ± 5 | 0.64 ± 6.3 | 0.69 ± 4.7 | 0.62 ± 5.1 | 0.59 ± 5.4 | 0.47 ± 5.5 |
| 16:0 | 26.62 ± 1.6 | 28.88 ± 1.7 | 26.91 ± 2.5 | 27.16 ± 5 | 26.21 ± 3.3 | 26.66 ± 1.8 | 26.43 ± 1.5 |
| 16:1n-9c b | 0.45 ± 4.8 | 0.36 ± 5.5 | 0.38 ± 6.7 | 0.38 ± 4.1 | 0.38 ± 6.8 | 8.46 ± 2.2 | 0.36 ± 5.6 |
| 16:1n-7c | 9.18 ± 1.8 | 6.70 ± 3.1 | 8.14 ± 3 | 9.05 ± 3.7 | 8.33 ± 4 | 1.02 ± 7.8 | 5.62 ± 3.8 |
| 16:1n-5c | 0.21 ± 5.3 | n.d. | n.d. | n.d. | n.d. | n.d. | n.d. |
| 16:2n-5c | 1.10 ± 3 | 0.97 ± 6.8 | 1.09 ± 4.8 | 1.14 ± 4.6 | 1.16 ± 4.1 | 0.78 ± 6.9 | 0.81 ± 4.4 |
| 17:0 | 0.87 ± 4.3 | 1.43 ± 5.8 | 0.87 ± 4.9 | 0.80 ± 6 | 0.85 ± 7.1 | 1.09 ± 5.7 | 1.15 ± 5.9 |
| 16:3n-3c | 1.67 ± 4.4 | 1.52 ± 5.9 | 1.68 ± 4.9 | 2.01 ± 3.1 | 2.21 ± 3.6 | 4.67 ± 4.4 | 1.40 ± 7.0 |
| 18:0 | 4.74 ± 3.3 | 6.42 ± 3.6 | 4.62 ± 4.3 | 4.59 ± 4.7 | 4.63 ± 6 | 8.53 ± 5.9 | 6.56 ± 7.6 |
| 18:1 | 8.38 ± 2.2 | 11.78 ± 3.6 | 8.73 ± 2.9 | 7.53 ± 5.7 | 7.67 ± 3.4 | 3.06 ± 4 | 10.13 ± 5.6 |
| 18:1n-9c | 3.09 ± 3.7 | 4.26 ± 8.2 | 2.87 ± 4.6 | 2.99 ± 2.8 | 3.01 ± 5 | 1.22 ± 2 | 3.76 ± 2.6 |
| 18:1n-7c | 0.40 ± 5.2 | n.d. | n.d. | n.d. | n.d. | n.d. | n.d. |
| 18:2 n-6 | 0.69 ± 4.8 | 1.82 ± 5.6 | 1.09 ± 4.1 | 1.04 ± 5.8 | 1.06 ± 5 | 0.64 ± 9 | 1.38 ± 3.0 |
| 18:3n-6c | 2.33 ± 3.8 | 1.14 ± 6.1 | 0.66 ± 9 | 0.55 ± 8 | 0.54 ± 4.2 | 2.44 ± 3.2 | 0.44 ± 3.9 |
| 18:3n-3c | 0.70 ± 5 | 3.87 ± 6 | 2.38 ± 5.3 | 2.35 ± 5.3 | 2.34 ± 3.3 | 0.72 ± 3.7 | 0.89 ± 4 |
| 20:1n-9c | 0.22 ± 5.2 | 0.73 ± 5.6 | 0.45 ± 6.6 | 0.42 ± 5 | 0.40 ± 4.2 | 0.67 ± 7.7 | 1.83 ± 2.2 |
| 20:4n-3 | 0.70 ± 5.4 | 0.65 ± 6 | 0.59 ± 3.2 | 0.6 ± 4.1 | 0.63 ± 4.1 | 0.61 ± 6 | 0.75 ± 3.1 |
| 20:5n-3 | 16.07 ± 2.8 | 18.26 ± 3.8 | 16.87 ± 1.6 | 16.67 ± 5.5 | 18.57 ± 2.9 | 17.09 ± 1.9 | 22.15 ± 2.3 |
| 22:5n-3 | 1.42 ± 3.6 | 0.37 ± 5.2 | 0.46 ± 5.2 | 1.34 ± 6.8 | 0.53 ± 4.5 | 1.32 ± 3.6 | 0.56 ± 4.3 |
| 22:6n-3 | 7.04 ± 2.7 | 8.04 ± 3.3 | 8.72 ± 3.7 | 6.90 ± 4.9 | 7.58 ± 2.9 | 7.45 ± 3.5 | 9.78 ± 5.7 |
| SFAs c | 45.03 | 38.57 | 44.59 | 45.32 | 44.19 | 48.14 | 39.28 |
| MUFAs d | 21.92 | 23.83 | 20.57 | 20.38 | 19.80 | 14.43 | 21.69 |
| PUFAs e | 31.73 | 36.64 | 33.53 | 32.61 | 34.62 | 35.71 | 38.16 |
| EPA+DHA | 23.12 | 26.30 | 25.59 | 23.58 | 26.15 | 24.53 | 31.92 |
| Lipid Name | Fish Oil 1 | Fish Oil 2 | Fish Oil 3 | Fish Oil 4 | Fish Oil 5 | Fish Oil 6 | Fish Oil 7 | |
|---|---|---|---|---|---|---|---|---|
| Lipid Levels (%) ± RSD (%) | Lipid Levels (%) ± RSD (%) | Lipid Levels (%) ± RSD (%) | Lipid Levels (%) ± RSD (%) | Lipid Levels (%) ± RSD (%) | Lipid Levels (%) ± RSD (%) | Lipid Levels (%) ± RSD (%) | ||
| 1 | TG(16:0 a/14:0/16:1) | 10.19 ± 3.2 | n.d. b | n.d. | 18.78 ± 5.6 | n.d. | n.d. | n.d. |
| 2 | TG(16:0/12:0/18:1) | n.d. | n.d. | n.d. | n.d. | 1.19 ± 5.8 | n.d. | n.d. |
| 3 | TG(16:0/14:0/16:2) | n.d. | n.d. | n.d. | n.d. | 7.24 ± 4.2 | n.d. | n.d. |
| 4 | TG(16:1/14:0/16:2) | n.d. | n.d. | n.d. | n.d. | n.d. | 2.35 ± 5.6 | n.d. |
| 5 | TG(16:1/14:0/17:0) | n.d. | n.d. | n.d. | n.d. | 1.09 ± 6.1 | n.d. | n.d. |
| 6 | TG(15:0/16:2/16:2) | n.d. | n.d. | 5.09 ± 5.3 | n.d. | n.d. | n.d. | n.d. |
| 7 | TG(16:0/16:0/16:1) | 15.95 ± 4.2 | n.d. | n.d. | 27.55 ± 5.4 | n.d. | 15.52 ± 3.1 | n.d. |
| 8 | TG(16:0/16:1/16:1) | n.d. | n.d. | n.d. | n.d. | n.d. | 15.84 ± 3.5 | n.d. |
| 9 | TG(16:1/16:1/16:1) | n.d. | n.d. | n.d. | n.d. | n.d. | n.d. | 7.19 ± 5.4 |
| 10 | TG(16:1/17:0/17:0) | n.d. | n.d. | n.d. | n.d. | n.d. | 15.19 ± 3.7 | n.d. |
| 11 | TG(18:1/14:0/18:1) | n.d. | n.d. | n.d. | n.d. | n.d. | n.d. | 21.55 ± 3.1 |
| 12 | TG(16:0/14:0/20:5) | n.d. | n.d. | n.d. | n.d. | n.d. | n.d. | 16.45 ± 3.5 |
| 13 | TG(16:1/14:0/20:5) | n.d. | n.d. | n.d. | 5.75 ± 3.1 | n.d. | n.d. | n.d. |
| 14 | TG(16:2/14:0/20:5) | n.d. | n.d. | n.d. | n.d. | n.d. | 7.45 ± 6.5 | n.d. |
| 15 | TG(15:0/16:0/20:5) | n.d. | n.d. | n.d. | n.d. | n.d. | n.d. | 1.26 ± 8.4 |
| 16 | TG(12:0/20:5/20:5) | n.d. | n.d. | 31.76 ± 3.6 | n.d. | 9.97 ± 3.9 | n.d. | 5.78 ± 7.6 |
| 17 | TG(16:0/18:1/18:1) | n.d. | n.d. | n.d. | n.d. | n.d. | 27.36 ± 3.5 | n.d. |
| 18 | TG(18:0/14:0/20:4) | 1.92 ± 5.9 | n.d. | n.d. | n.d. | n.d. | n.d. | n.d. |
| 19 | TG(16:1/14:0/22:6) | n.d. | n.d. | n.d. | 13.76 ± 3.2 | n.d. | n.d. | n.d. |
| 20 | TG(12:0/20:5/22:6) | 2.66 ± 3.7 | n.d. | n.d. | n.d. | n.d. | n.d. | 1.46 ± 8.7 |
| 21 | TG(18:0/16:1/20:4) | n.d. | n.d. | n.d. | n.d. | n.d. | n.d. | 2.12 ± 6.8 |
| 22 | TG(16:0/18:1/20:5) | 14.54 ± 4.1 | n.d. | n.d. | n.d. | 25.25 ± 3.4 | n.d. | n.d. |
| 23 | TG(16:1/18:1/20:5) | n.d. | n.d. | n.d. | n.d. | 34.14 ± 3.2 | n.d. | n.d. |
| 24 | TG(16:1/18:2/20:5) | n.d. | n.d. | n.d. | 6.11 ± 3.6 | n.d. | 5.70 ± 6.4 | n.d. |
| 25 | TG(16:1/16:1/22:6) | 11.42 ± 3.6 | n.d. | n.d. | n.d. | n.d. | n.d. | n.d. |
| 26 | TG(17:0/17:0/22:5) | n.d. | n.d. | n.d. | n.d. | 2.05 ± 6.5 | n.d. | n.d. |
| 27 | TG(16:0/18:1/22:5) | 6.16 ± 0.0 | n.d. | n.d. | n.d. | n.d. | n.d. | n.d. |
| 28 | TG(18:1/18:1/20:5) | n.d. | n.d. | n.d. | n.d. | n.d. | n.d. | 20.86 ± 2.3 |
| 29 | TG(16:1/18:2/22:6) | 10.01 ± 4.3 | n.d. | n.d. | n.d. | n.d. | n.d. | n.d. |
| 30 | TG(15:0/20:5/22:6) | n.d. | n.d. | n.d. | 1.27 ± 6.5 | n.d. | n.d. | n.d. |
| 31 | TG(17:0/18:1/22:6) | 1.73 ± 5.8 | n.d. | n.d. | n.d. | n.d. | n.d. | n.d. |
| 32 | TG(18:1/20:5/20:5) | n.d. | n.d. | n.d. | n.d. | n.d. | 3.50 ± 5.6 | n.d. |
| 33 | TG(14:0/22:6/22:6) | 4.13 ± 2.5 | n.d. | n.d. | n.d. | n.d. | n.d. | n.d. |
| 34 | TG(16:2/20:5/22:6) | n.d. | n.d. | n.d. | n.d. | n.d. | 4.32 ± 6.7 | n.d. |
| 35 | TG(18:0/18:1/22:6) | n.d. | n.d. | 41.86 ± 3.5 | n.d. | n.d. | n.d. | n.d. |
| 36 | TG(18:0/20:5/22:6) | n.d. | n.d. | n.d. | n.d. | 6.87 ± 3.5 | n.d. | n.d. |
| 37 | TG(18:1/20:5/22:6) | n.d. | n.d. | n.d. | 17.17 ± 5.4 | n.d. | n.d. | 11.04 ± 2.6 |
| 38 | TG(16:0/22:6/22:6) | 5.78 ± 3.8 | n.d. | n.d. | n.d. | n.d. | n.d. | n.d. |
| 39 | TG(20:5/20:4/20:5) | n.d. | n.d. | n.d. | n.d. | 2.92 ± 3.6 | n.d. | n.d. |
| 40 | TG(17:0/22:6/22:6) | n.d. | n.d. | n.d. | n.d. | 2.09 ± 6.3 | n.d. | 1.n.d. |
| 41 | TG(18:1/22:6/22:6) | 3.36 ± 0.0 | n.d. | n.d. | n.d. | n.d. | n.d. | 2.22 ± 6.9 |
| 42 | TG(20:5/20:5/22:5) | n.d. | n.d. | n.d. | n.d. | n.d. | n.d. | 1.35 ± 7.2 |
| 43 | TG(18:3/22:6/22:6) | n.d. | n.d. | n.d. | 2.89 ± 3.5 | n.d. | n.d. | n.d. |
| 44 | TG(20:5/20:5/22:6) | 7.16 ± 3.4 | n.d. | n.d. | n.d. | n.d. | n.d. | 6.50 ± 3.5 |
| 45 | TG(20:5/22:6/22:6) | 2.35 ± 2.5 | n.d. | 19.13 ± 3.1 | 4.61 ± 1.5 | 5.39 ± 3.1 | n.d. | n.d. |
| 46 | TG(22:5/22:6/22:6) | n.d. | n.d. | 2.13 ± 5.8 | n.d. | n.d. | n.d. | n.d. |
| 47 | TG(22:6/22:6/22:6) | n.d. | n.d. | n.d. | n.d. | n.d. | 1.32 ± 6.9 | n.d. |
| 48 | TG(17:0/20:5/22:6) | 1.00 ± 6.8 | n.d. | n.d. | n.d. | n.d. | n.d. | n.d. |
| 49 | TG(18:0/22:5/22:6) | n.d. | n.d. | n.d. | 1.00 ± 5.6 | n.d. | 1.00 ± 8.1 | n.d. |
| 50 | 18:0 EE c | n.d. | 5.04 ± 4.6 | n.d. | n.d. | n.d. | n.d. | n.d. |
| 51 | 18:1 EE | n.d. | 3.54 ± 6.7 | n.d. | n.d. | n.d. | n.d. | n.d. |
| 52 | 18:3 EE | n.d. | 1.38 ± 6.4 | n.d. | n.d. | n.d. | n.d. | n.d. |
| 53 | 18:4 EE | n.d. | 9.09 ± 3.5 | n.d. | n.d. | n.d. | n.d. | n.d. |
| 54 | 20:4 EE | n.d. | 3.06 ± 5.9 | n.d. | n.d. | n.d. | n.d. | n.d. |
| 55 | 20:5 EE | n.d. | 42.87 ± 2.5 | n.d. | n.d. | n.d. | n.d. | n.d. |
| 56 | 22:5 EE | n.d. | 4.10 ± 5.1 | n.d. | n.d. | n.d. | n.d. | n.d. |
| 57 | 22:6 EE | n.d. | 30.94 ± 3.2 | n.d. | n.d. | n.d. | n.d. | n.d. |
Disclaimer/Publisher’s Note: The statements, opinions and data contained in all publications are solely those of the individual author(s) and contributor(s) and not of MDPI and/or the editor(s). MDPI and/or the editor(s) disclaim responsibility for any injury to people or property resulting from any ideas, methods, instructions or products referred to in the content. |
© 2024 by the authors. Licensee MDPI, Basel, Switzerland. This article is an open access article distributed under the terms and conditions of the Creative Commons Attribution (CC BY) license (https://creativecommons.org/licenses/by/4.0/).
Share and Cite
Liu, M.; Liu, Y.; Wang, X. Discrimination between the Triglyceride Form and the Ethyl Ester Form of Fish Oil Using Chromatography–Mass Spectrometry. Foods 2024, 13, 1128. https://doi.org/10.3390/foods13071128
Liu M, Liu Y, Wang X. Discrimination between the Triglyceride Form and the Ethyl Ester Form of Fish Oil Using Chromatography–Mass Spectrometry. Foods. 2024; 13(7):1128. https://doi.org/10.3390/foods13071128
Chicago/Turabian StyleLiu, Mingxuan, Yuchong Liu, and Xiupin Wang. 2024. "Discrimination between the Triglyceride Form and the Ethyl Ester Form of Fish Oil Using Chromatography–Mass Spectrometry" Foods 13, no. 7: 1128. https://doi.org/10.3390/foods13071128
APA StyleLiu, M., Liu, Y., & Wang, X. (2024). Discrimination between the Triglyceride Form and the Ethyl Ester Form of Fish Oil Using Chromatography–Mass Spectrometry. Foods, 13(7), 1128. https://doi.org/10.3390/foods13071128